information asymmetry and estimation risk: …bizfaculty.nus.edu/documents/research paper...
TRANSCRIPT

Information Asymmetry and Estimation Risk: Preliminary Evidence
from Chinese Equity Markets
by
Swee-Sum Lam and Jing Du*
* Swee-Sum Lam is an associate professor of finance with the Department of Finance and
Accounting, National University of Singapore. Jing Du is a risk advisory associate with Canadian Imperial Banking Corporation, Toronto, Canada.
Please direct all correspondence to Swee-Sum Lam, National University of Singapore, School of Business, 1 Business Link, Biz 1 Building, Singapore 117592. Work: (65) 6874 3037 Fax: (65) 6779 2083 E-mail: [email protected]

Information Asymmetry and Estimation Risk: Preliminary Evidence
from Chinese Equity Markets
Abstract
This study discusses the implication of information asymmetry between firms and investors for
the estimation risk of asset returns. We evaluate various risk measures of information asymmetry
between firms and investors for China, an excellent example of a low information environment. We find
a significant negative relationship between voluntary disclosure based on U.S. GAAP with certification of
a credible audit firm and the variation of risk-adjusted returns. On the other hand, neither private
information production nor certified voluntary disclosure is associated with any variation of asset returns
in the primary markets.
Keywords: Information asymmetry, estimation risk, private information production, voluntary
disclosure, auditor certification

Information Asymmetry and Estimation Risk: Preliminary Evidence from Chinese Equity Markets
1. Introduction
The evaluation of information asymmetry between firms and investors has remained
inconclusive. One difficulty lies in understanding the impact of investors making investment decisions
under imperfect information in capital markets.1 Another difficulty lies in measuring the impact of
information asymmetry.
In this study, we adopt the Bayesian approach to explain how investor’s imperfect information
about the parameters of the firm’s underlying cash flow or return generating process gives rise to
estimation risk. Lam (1991) defines estimation risk as the incremental variation of an investor’s
predictive return distribution relative to the limiting case when all agents have perfect information.
Following Clarkson et al (1996) and Lewellen and Shanken (2002), we posit that both the beta estimate
and the variance of returns are appropriate measures of estimation risk.2
If estimation risk increases a firm’s beta estimate and variance of returns, the firm has incentives
to reduce information asymmetry because estimation risk translates to a higher cost of equity. Healy and
Palepu (1995) analyze at length how CUC International used costly capital structure modifications as a
signal to investors. Since investors cannot observe the firm’s underlying cash flow, CUC had difficulty
convincing investors that its marketing outlays were profitable investments. Such anecdotal evidence
suggests that financial disclosure in a high information environment like the U.S. is less likely to be
effective in resolving information asymmetry, resulting in poor stock price performance in this instance.
1 The problem of imperfect information is a general one and needs to be carefully defined. There is one stream of research that evaluates information asymmetry among investors and traders using bid ask spread, liquidity, volume, volatility (e.g., Copeland and Galai 1983; Glosten and Milgrom 1985; Amihud and Mendelson 1986; Diamond and Verrecchia 1991; Brennan and Subrahmanyam 1996). In this study, we focus on the information asymmetry between firms and investors. 2 Leuz and Verrecchia (2000) highlight the need for direct measures of estimation risk that would offer a parsimonious solution to the problem of measuring information asymmetry. Lewellen and Shanken (2002) use a multi-period model where prices are endogenous to show that estimation risk arising from the investors’ imperfect information of the firm’s underlying dividend or cash flow generating process results in a higher beta estimate when investors have an informed prior and a higher variance of returns compared to the case absent estimation risk.

Information Asymmetry and Estimation Risk
A solution is effective if, by revealing information about the firm’s underlying cash flow or return
generating process to investors, it reduces estimation risk (and therefore beta estimate and variance of
returns).3 Mandatory disclosures, effective enforcements and well-developed analysts’ followings in
developed economies are expected to yield a relatively low level of estimation risk cross-sectionally in
the economy. Therefore, the challenge of working with data in developed economies lies in identifying
windows of low information. In this connection, Botosan (1997) finds that greater disclosure through the
annual report is associated with a lower cost of equity for firms that attract a low analyst following. On
the other hand, she finds no evidence of an association between her measure of disclosure level and cost
of equity for firms that have a high analyst following.
In this study, we evaluate information asymmetry in a low information environment where the
problem is likely to be significant.4 We identify an empirical setting that allows us to evaluate this
research problem. China offers an ideal low information environment. We evaluate the relationship of
private information production and voluntary disclosure with certification and the variation of asset
returns in both the primary and secondary equity markets in China.5
China is an interesting test case because there is a dearth of security research relative to what is
available in developed economies like the U.S., Switzerland and Germany. Moreover, the Chinese retail
3 Merely revealing information about the firm’s underlying cash flow is a necessary but not sufficient condition to reduce estimation risk. To be effective, the relevant information that investors need has to be considered relative to investors’ priors about the firm’s cash flow. We would then expect solutions to information asymmetry to change with the development of capital markets and the sophistication of investors. For example, what would be effective for retail investors need not be effective for institutional investors. Therefore, it is an empirical question as to which solution to information asymmetry is effective at any point in time in a given market. 4 Consistent with Zhang (2001), the most effective solutions can be deemed to be the most efficient ones since the cost functions of the alternative solutions are endogenous in this framework. When the information asymmetry problem is significant, any effective solution would bring about a statistically if not economically significant reduction in return variation. 5 See Auer (1998) and Leuz and Verrecchia (2000) for related studies on disclosure environment in the Swiss and German markets respectively. Voluntary disclosure allows the firm to offer more information about the firm’s underlying cash flow beyond the statutory requirements. The audit firm “certifies” the validity of the voluntary disclosure together with the mandatory disclosure of the firm in the prospectus or the annual report to resolve the adverse selection problem (given information asymmetry) in new issues. In the context of this study that evaluates the information asymmetry problem between firms and investors in the early years of capital market development, the private information producers are not the information traders that we know in the developed markets. These are
2

investors are less sophisticated than those in the developed economies. Therefore, the quality of
information and the level of disclosure that is relevant and useful for the Chinese investors are more basic
than what investors in the developed economies are used to. We construct measures for the quantity and
quality of private information produced, as well as the quantity and quality of the voluntary disclosure for
each firm in both samples for the primary and secondary markets.
Following Lewellen and Shanken (2002) and Zhang (2001), this study evaluates the relationship
between private information production and disclosure about the firm’s underlying cash flow and the
variation of asset returns. We hypothesize that there is a negative relationship between cross-sectional
beta and variance estimates and the information measures. Consistent with our prediction, we find that
the variance of risk-adjusted asset returns in the secondary markets is related negatively with voluntary
disclosure according to internationally accepted standards like the U.S. Generally Accepted Accounting
Principles (GAAP) as certified by credible audit firms.
Setting our study in China also allows for the isolation of information asymmetry effects on beta
and variance estimates. Zhang’s (2001) model shows that the relationship between disclosure and the
variation of asset returns depends on whether the variability of asset returns is driven by information
traders’ activities or information asymmetry. To illustrate the point, Bushee and Noe (2000) evaluate
institutional investors in a highly developed capital market (U.S.) with strongly enforced disclosure
standards. Our study evaluates a new and developing capital market (China) that has lower quality
disclosure and enforcement regimes at the time of the study. Bushee and Noe (2000) find that yearly
improvements in disclosure rankings actually increase return volatility. They suggest that U.S.
institutional investors who are attracted to greater disclosure actually increase return volatility through
their aggressive trading strategies. In China’s case, institutional investors account for less than 20% of
3
the brokerage and financial houses (on the sell side) and individual analysts who generate information about the firm’s underlying cash flow for their clients and the general investing public.

Information Asymmetry and Estimation Risk
total shareholders in the A share markets.6 Moreover, Chinese equity markets are closed to foreign
investors except for the B shares of listed firms.7 Our samples are drawn from listed firms that have
issued only A shares which are theoretically accessible to local investors only. Our finding a negative
relationship between certified disclosure and the variation of asset returns is therefore consistent with the
prediction of Zhang’s (2001) model when the variability of asset returns is driven by information
asymmetry rather than information traders’ activities.
In examining firms that choose to disclose according to U.S. GAAP, we are also contributing to
the international accounting literature. While voluntary disclosure in itself does not necessarily resolve
information asymmetry, it can become an effective signal for quality information when certified by a
credible audit firm.
Our findings throw light on the dynamic resolution of information asymmetry in the development
of capital markets. While voluntary disclosure about the firm’s underlying cash flow as certified by
credible audit firms is associated with lower risk in the Chinese secondary markets, we find that the
quantity of private information produced is not. Yet, we find that Chinese firms that release quality
information also have a better coverage. These findings highlight the dominant role of credible
certification agents and standards in the early stages of development of the Chinese capital markets.
Lastly, we report that neither private information production nor voluntary disclosure with certification is
associated with the variation of asset returns in the Chinese primary markets.
6 Tu Guangshao, President of the Shanghai Stock Exchange, cited these statistics at the China Business Summit 2000 in April 2000. It was reported that China had some 50 million brokerage accounts, and as many as 80 million retail investors. In a similar vein on November 5, 2000, Zhao Xiaoping, director of the Information Center of Shanghai Stock Exchange, announced at the International Fund Manager Forum, “It is necessary to devote more energy to the cultivation of institutional investors to promote the development of the stock market and meet the challenges brought by China’s WTO entry.”
4
7 Restrictions on foreign ownership of Chinese firms provide for two categories of shares to be issued on the Shanghai Stock Exchange and the Shenzhen Stock Exchange: A and B shares. Right till February 19, 2001, local investors are restricted to buy A shares only. And, foreign investors are restricted to buy B shares only. We select the A share market data because there is a significant proportion of Chinese firms that has chosen to issue A shares only. Secondly, B share counters tend to be illiquid, and many were not traded on most days. See Bailey (1994) for a study on the A and B share markets.

This study is organized as follows. Section 2 gives the background on the development of
Chinese markets to explain why it is an interesting case of a low information environment for our study.
Section 3 discusses the hypothesis development, data and method. Section 4 reports the results and the
analyses. Section 5 concludes and highlights the limitations to this study.
2. The development of Chinese equity markets
China adopted the Soviet uniform accounting system with the foundation of the People’s
Republic of China in 1949. The objective of such an accounting system was to record and report the
sources of funds obtained by enterprises and the uses of those funds, to provide financial information to
improve the operations and management of the state-owned enterprises, and ultimately to reflect, analyze,
and assess the implementation of state macro-economic plans. For example, the accounting system would
estimate total tonnage of steel to be produced by the steel industry annually and report any overproduction
or shortfall. The system served China in meeting with her objectives of a planned economy. But such an
accounting system became inefficient and inadequate when China decided to move towards a market-
oriented economy in late 1970s.
Reforms of the Chinese Accounting System started in 1978. These include re-instituting “state
auditing” and the Chinese “accounting profession” (both had their roles significantly diminished since
1949 when the People’s Republic of China was founded). The State Auditing Administration was
restored in 1982. Meanwhile, various over-the-counter equity markets were set up in Shanghai and other
major cities between 1986 and 1990 on an experimental basis. The China Securities Regulatory
Commission (CSRC) revived the regulation of certified public accountants in 1986 in preparation for the
opening of the Shanghai Stock Exchange and the Shenzhen Stock Exchange in December 1990 and April
1991 respectively. CPA law and the Accounting Standards for Enterprises were implemented in 1992.
5

Information Asymmetry and Estimation Risk
The development of the Chinese Accounting System lags behind the development of the financial
markets in promoting corporate governance and consistent financial reporting and disclosure practices. In
particular, foreign investors find it difficult to reconcile the differences between the Chinese Accounting
Standards and the internationally accepted accounting standards [see Hepp and Chen (1997)]. Beyond the
non-disclosure and reconciliation problems, investors have to realize that weak bankruptcy laws means
inflated book values for many of the state-owned enterprises that are effectively bankrupt.8
More importantly, the education system is also in a state of transition. China is short of public
accounting professionals and certified financial analysts.9 In the early days, the primary task of the CPA
firms was to audit business entities associated with foreign businesses. These CPA firms used to place
less emphasis in disclosing information to investors, and more on providing information to tax authorities.
We therefore have a good example of a low information environment in the Chinese equity
markets. Firstly, mandatory disclosure is a new corporate culture in the 1990s, and voluntary disclosure
according to International Accounting Standards (IAS) or U.S. GAAP is adopted by only those firms with
foreign investors and alliances. Secondly, credible private information production capability is minimal.
Thirdly, investors are often not sophisticated enough to be able to read and appreciate financial reports.
The above conditions tend to accentuate the information asymmetry between firms and investors. In this
study, we test empirically if private information production and certified voluntary disclosure is
negatively related to the variation of asset returns. While the Chinese equity markets offer the appropriate
setting for our evaluation of the information asymmetry problem, we acknowledge at the same time that
8 China only started to enforce bankruptcy laws in recent years as part of the exercise to liquidate thousands of inefficient and overstaffed state-owned enterprises. These bankruptcies could precipitate a banking and equity market crisis if reforms do not come fast enough and the non-performing loan problem is not checked. Such reforms come at a price of potential social unrest. The Financial Times, October 24, 2001, reported that “China acts to curb corporate bankruptcy” in the light of global and national slowdown following the September 11, 2001 attack on U.S.. 9 The Securities Analysts Association of China (SAAC), a specialized organization of and working independently under the supervision and direction of the Securities Association of China, was established in Beijing on July 5, 2000. It is a national self-regulatory organization for the Chinese securities investment consulting industry. All institutional and individual members must be licensed by the China Securities Regulatory Commission to engage in securities investment consulting business. The SAAC has 123 institutional members as of December 2001. There
6

good quality Chinese data are not as readily available as U.S. data. We discuss this problem in the next
section.
3. Hypothesis development, data and method
Hypothesis development
Lewellen and Shanken (2002) model a representative investor who maximizes his utility of
wealth in multi-period setting when parameters of the firm’s underlying dividend or return generating
process cannot be observed. With such information asymmetry between the firm and investor, they show
that estimation risk increases beta estimates when the investor has informed priors and leaves beta
estimates unchanged when the investor has diffuse priors. Regardless of the investor’s priors, estimation
risk increases the variance of returns compared to the case absent estimation risk.10 Therefore, we use
beta and variance of returns estimates as measures of estimation risk.
Following Lewellen and Shanken (2002), more information about a firm’s underlying cash flow
or return generating process would be associated with a lower variation of asset returns. Private
information production and voluntary disclosure represent ways of increasing investors’ information
about the firm’s underlying cash flows. However, we find mixed evidence that more information is
associated with lower beta estimates.11 This is not surprising because the order of magnitude of any
impact that information asymmetry has on a risk estimate like beta or variance of asset returns in a high
information environment is expected to be small. Studies like Clarkson and Thompson (1990) and Lam
(1991) that offer evidence for the impact of information on estimation risk evaluate the initial public
are as yet, no individual members. In keeping with international regulations, the management rules for individual members are being set up. 10 Previous literature discusses the impact of estimation risk on investors’ predictive return distribution which is different from the (true) observed distribution of asset returns (Klein and Bawa 1976,1977; Bawa et al 1979; Barry and Brown 1985). Clarkson and Thompson (1990) show that, given differential information across firms, beta estimate declines with increasing information about firm’s underlying cash flow process.
7

Information Asymmetry and Estimation Risk
offerings aftermarket (a low information environment) when cross-sectional beta estimates through the
first few trading days are extremely high. It is an empirical question whether the negative relationship
between information and risk measures will be of economic significance in a low information
environment like China.
Theory also predicts that signaling could be a solution to the information asymmetry problem in a
low information environment (Akerlof, 1970). DeFond et al (2000) evaluate changes in auditor
independence subsequent to the adoption of new auditing standards in China at the end of 1994.12 They
find a significant increase in modified reports, especially among those top ten auditors that are affiliated
with the government. On the contrary, they find no significant increase in modified reports issued by
those top ten auditors that are joint-ventures with the Big Five. This finding is consistent with the
hypothesis that those top ten auditors that are joint ventures with the Big Five were already highly
independent even prior to the new standards coming into effect. In this study, we evaluate the proposition
that financial reports that are certified by credible audit firms are effective signals for quality information
disclosure.
This discussion motivates the following statistical hypotheses: there is a negative relationship
between beta and variance estimates respectively and the various measures of information production and
disclosure.
Data
Information is hard to come by in a low information environment like China. There are no
databases of analyst rankings, analysts’ ratings of firms’ disclosure policies, investors’ assessments or
11 Clarkson and Thompson (1990) and Lam (1991) document evidence of cross-sectional beta estimates declining with information in the IPO aftermarket However, Auer (1998), Healy et al (1999), Bushee and Noe (2000) find that increase in accounting disclosure is not associated with any change in beta estimates.
8

corporate governance survey results. Commercial databases tend to have missing price data for the early
years and errors. We therefore draw our data from official sources of financial information in China: the
Shanghai Stock Exchange and the Shenzhen Stock Exchange. In the early part of the 1990’s, there are
two main official publications that release financial news and reports in China, namely, the China
Securities Daily and Securities Weekly.
Evaluating the Chinese IPO markets is part of our research question. The primary market offers a
lower information environment relative to its secondary market, even in developed capital markets
because IPOs have no prior price data. While our study of the Chinese secondary equity markets offers
insights to the problem of information asymmetry in a low information environment, that of the Chinese
IPO markets offers further insights in an extremely low information environment.
We select all IPOs of companies that listed only A shares in the period 1991 through 1996 for
which there were news and financial reports in the China Securities Daily and Securities Weekly upon
listing and in the aftermarket.13 This requires going through all IPOs and checking for their disclosures
and analyst reports in the two publications throughout the six-year period. Price data for these firms are
drawn from the A-share markets on the Shanghai Stock Exchange and the Shenzhen Stock Exchange.
We collect the offer price of each IPO, its first day high and low prices, and its daily closing prices up to
three months in the aftermarket. For the seasoned stock sample, we collect daily closing prices of each
stock starting from four months before the announcement of annual financial results right through the day
before announcement. The A-share Composites of these exchanges are used as proxy for the respective
market returns. The contemporaneous A share Composite on the exchange is collected for each IPO and
each seasoned stock price data.
12 Penalties for violating such auditing standards are harsh. They include the revocation of the auditor’s license to practice and even imprisonment. There were precedent cases even prior to 1994 that demonstrated that the Chinese regulators were able and ready to impose harsh penalties on errant auditors.
9
13 Chinese companies that list both A and B shares or A and H shares are subject to the disclosure standards in the B or H share markets. Our sampling criterion of restricting firms to those that list only A shares controls for firms whose stock prices may be responding to different levels of disclosure.
Information Asymmetry and Estimation Risk
We construct information measures of private information production and voluntary
disclosure with certification. The construction methodology is similar to that in Botosan (1997).
Private information production and firm disclosure measures reflect the information that is
available to investors before they trade, whether in the aftermarket or before the end of the fiscal
year.14
Measures of private information production are constructed to measure two attributes: the
quantity as well as the quality of private information produced. We consider the prospectus as
the primary financial document for private information production in the IPO markets. We total
the number of news and analysis reports on each firm from the date of prospectus to the date of
listing. For the seasoned stock sample, the annual report is the major financial document that
resolves part of the information asymmetry between the firm and investors. Analysts tend to
generate their reports based on the analysis of the annual report and other private and public
information. We total the number of news and analysis reports on each firm during the four
months before the end of the fiscal year. The quantity of private information produced on firm i,
NINFOi, is then measured as the natural log of the number of news and analysis reports on firm i
released in China Securities Daily and Securities Weekly.
We have difficulty calibrating the quality of such private information produced as our discussion
in Section 2 would suggest. We observe, however, that security and financial houses are distinguished by
size and location. Those houses that are bigger and more reputable also tend to be located in big coastal
cities like Shanghai or Shenzhen, as compared with the smaller provincial houses. As security and
financial houses are on the sell side, we deem their releases to be less credible and less independent than
those from the Shanghai or Shenzhen Stock Exchanges. On the other hand, we rank security houses
10
14 Setting the test period apart from the announcement of the annual results allows us to focus on the relationship of information and risk measures, rather than announcement effects.

higher than individual analysts. We therefore rate on a ten-point scale the credibility of the private
information produced: articles produced by a stock exchange, ten; research departments of top securities
and financial houses, eight; provincial securities companies and less well-known research institutions, six;
well-known brokers writing in personal capacity, four; and stock analyses by individuals, two.15 The
quality of private information produced on firm i, QINFOi, is then measured as the natural log of the
weighted average rating of the various information producers on firm i.
We also evaluate the effectiveness of mandatory disclosure according to the Accounting
Standards for Stock Companies, a by-law of the Chinese Accounting Standards.16 While the government
wants firms to move towards a culture of corporate disclosure, it is unclear if management of the
thousands of state-owned enterprises, and especially the listed ones, has shifted its paradigm towards one
of accountability to shareholders, including minority shareholders. Therefore, we do not presume that
management of listed firms would disclose according to the Accounting Standards for Stock Companies.
In fact, DeFond et al (2000) find that management of state-owned enterprises prefers a clean audit report
instead of audit independence. There was a significant “flight from independence” after the government
imposed new auditing standards in 1995 that are patterned after the International Standards on Auditing
issued by the International Federation of Accountants. While we acknowledge that a firm’s disclosure
policy is endogenously determined and the disclosure-risk relationship may run the other way, i.e. firms
that are more risky tend to disclose more, we do not think that this poses a serious specification problem
during our test period since De Fond et al (2000) find that management of state-owned enterprises prefers
to switch auditors than to comply with (disclosure) requirements of an independent audit.17 It is precisely
15 Ordinal ratings, like those on a ten-point scale, have been used by La Porta et al (1998). 16 Based on the requirements in Chinese Accounting Standards, we track the following disclosure items: Description of accounting interval, accounting policy, currency, accounting for inventory, preparation for bad debts, accounting for depreciation, taxes, intangible assets, long-term investments, recognition of revenue, profit distribution, short-term investments, short-term liability, accounts receivable, accounts payable, pre-paid accounts, amortization, incomes from main business, incomes from other business, and analysis of changes above +/-30%.
11
17 Most of the A share listings have government ownership. Qi et al (2000) report that the mean (median) government ownership of all firms listed on the Shanghai Stock Exchange as at the end of 1996 is 29.3% (28.6%), with firms in the first quartile having at least 53.1% government ownership. We can use lead-lag tests to

Information Asymmetry and Estimation Risk
such characterization of disclosure practices that gives us the low information environment in Chinese
equity markets.
Again, we measure two aspects of corporate disclosure: the quantity as well as the quality of
corporate disclosure. To construct the quantity of disclosure measure for the sample of IPOs, we total the
number of items disclosed according to the Chinese Accounting Standards in each firm’s prospectus. For
the sample of seasoned stocks, we total the number of items disclosed in each firm’s annual financial
report. The quantity of information disclosed by firm i, NDISCLOSEDi, is the natural log of the number
of items disclosed according to the requirements in the Accounting Standards for Stock Companies. This
measures the level of compliance with mandatory disclosure requirements according to the Accounting
Standards for Stock Companies.
In a setting where compliance with mandatory corporate disclosure is not to be presumed,
voluntary disclosure according to IAS or U.S. GAAP can be perceived as a signal for a firm’s
commitment to good disclosure policies. However, many of these firms are joint venture firms or they
have foreign alliances that require or prefer such disclosure. In this instance, reputable auditor
certification of the disclosure is necessary to validate the management’s signal for quality disclosure [see
DeAngelo (1981), Beatty (1989)]. Therefore, we posit that voluntary disclosure and auditor certification
are complements in the measure for quality disclosure and we construct the interaction term. This
interaction effect allows for differential certification value across auditor types.
We first identify 24 accounting standards for the treatment of, for example, valuation of
marketable securities, financial leases, R&D expenses. The measure for voluntary disclosure is the
percentage of these 24 standards that are disclosed according to U.S. GAAP and that do not contradict the
Chinese Accounting Standards.18
discriminate between the two specifications due to possible causality problems. Even then, readers are cautioned against the interpretation of such results.
1218 This disclosure strategy is consistent with “dual reporting” described in Leuz and Verrecchia (2000).

Calibrating the reputation of Chinese audit firms is challenging because reputation capital takes
time to invest in and there is not enough history at this point in time. Given the infancy of corporate
governance standards and the legal system, market discipline is not set in place. For a start, a valid
partition is to classify audit firms as Big Five affiliated and non-Big Five affiliated.19 However, this does
not give a fine partition since non-Big Five affiliated audit firms would constitute more than 90% of the
total number of Chinese audit firms. To further partition this, we can use the conventional affiliation
classification: government-affiliated audit firms, university-affiliated audit firms, and audit firms that are
joint ventures with the Big Five international audit firms. The government-affiliated audit firms have
continued to be the dominant group with 75% of the audit market share in 1999 in terms of the number of
clients. In this study we rank the government-affiliated firms above the university-affiliated firms in audit
quality because the government’s pressure is on this group to develop in professional competence to
match the Big Five affiliated in the local market. DeFond et al (2000, p.284) find evidence that
government-affiliated audit firms are responding to this call to professionalism. During the period 1993-
1996, these gave 60 modified reports representing 6.3% of their total clients, compared with 10 modified
reports given by university-affiliated audit firms representing 4.1% of their total clients.20 The measure of
auditor reputation is given a value of ten, five and one respectively for the Big Five affiliated,
government-affiliated and university-affiliated audit firms. The quality of information disclosed by firm
i, QDISCLOSUREi, is then computed as the product of the two measures of voluntary disclosure and
19 DeAngelo (1981) suggests that audit firm size is a good proxy for audit quality. However, we argue here that the U.S. (and international) audit market has survived years of competition in a market economy. The general consensus that the Big Five today is a good proxy for quality audit is the result of competitive reputation building over decades. Therefore using firm size (measured in terms of number or gross assets of clientele) as a proxy for reputation in these early years of the Chinese experiment with market economy is one but not necessarily the most appropriate one. However, a Big Five affiliated audit firm (even though they may not have big Chinese clienteles) remains a valid proxy for quality since the affiliation presumably would require the internal audit systems and procedures to be made compatible with the Big Five.
13
20 Big Five affiliated audit firms gave 7 modified reports representing 7.4% of their total clients during the same period. DeFond et al (2000) suggest that these were already qualifying or modifying reports before the change in auditing standards in 1995. Therefore, the average rate of giving modified reports at 7.4% over the four-year period here is an understatement of their auditor independence compared to the other two groups.

Information Asymmetry and Estimation Risk
auditor reputation respectively on a ten-point scale. We take the natural log transformation after checking
the variable for stability.
For the purpose of our study, we evaluate two control variables in our regression analyses: firm
size, LNSIZE, and ALPHA, the proportion of state-owned shares and legal person shares retained after
the IPO. Although the latter are non-tradeable shares, they reflect the interests retained by the state.
LNSIZE is computed as the the natural logarithm of the market capitalization of the firm on the
first trading day for the IPO sample firms. For the seasoned stock sample, it is the natural logarithm of
the market capitalization of the firm on December 31, 1996. Market capitalization is determined by the
closing price on the specified day multiplied by the number of outstanding tradeable shares. The size
anomaly finds an inverse relationship between LNSIZE and returns. Many explain that small firms offer
higher risk cash flows and investors therefore require higher returns. We therefore expect a negative
relationship between LNSIZE and various risk measures. ALPHA, on the other hand, is used in the IPO
literature, to evaluate information asymmetry between the insiders and the investing public. The
information asymmetry hypothesis suggests that a high ALPHA signals for a good quality firm with a
high risk-adjusted return.
Firms that have missing prices or missing data are omitted. The final sample has 366 firms out of
a population of 431 listed companies that issue only A shares as at the end of 1996.21
Method
We test the statistical hypothesis that there is a negative relationship between beta and variance
estimates respectively and measures of the quantity and quality of information produced, and disclosed
respectively.
14
21 China Securities Regulatory Commission reports a total of 530 listed companies as at the end of 1996, including those issuing B shares only, issuing A and B shares and issuing A and H shares.

To estimate beta and variance of returns for the seasoned stock sample, we estimate the market
model for each firm i using its daily stock returns and the contemporaneous return on the A-share
Composite of firm i’s exchange over the four-month period before the end of the fiscal year. Using the
beta estimate of firm i, we compute the variance of its beta risk-adjusted returns over the same four-month
period. The beta estimate and the variance of beta risk-adjusted returns of firm i are then individually
regressed against the contemporaneous measures of private information produced on firm i, namely,
NINFO, QINFO, and measures of information disclosed by firm i, namely, NDISCLOSED and
QDISCLOSURE respectively.
For our robustness tests, we also run a multivariate regression on the four information measures
together with the control variables, LNSIZE and ALPHA. We apply a variable selection procedure in
which all independent variables are entered into the equation and then sequentially removed. The
independent variable with the smallest partial correlation with the dependent variable is considered first
for removal. If it meets the criterion for elimination (p-value > 0.10), it is removed. After the first variable
is removed, the independent variable remaining in the equation with the smallest partial correlation is
considered next. The procedure stops when there are no variables in the equation that satisfy the removal
criteria. In our cross-sectional regression analysis the standard errors of estimates are corrected for
heteroskedasticity.22
The estimation of the risk measures for the IPO sample is different. IPO studies measure market-
adjusted returns instead of beta risk-adjusted returns because of the lack of prior price data and the
instability of beta in the early aftermarket.23 We compute the variance of market-adjusted returns, σ52, as
22 The non-trading problem is less severe on the A share market than the B share market. Moreover, trading volume in the A share aftermarket is sustained since Chinese investors have no other financial investment option in the early years of capital market development except putting their money in the bank that earns them low interest. Nevertheless, we re-compute the beta and variance estimates using Scholes and Williams (1977) correction for non-synchronous trading. The regression results and analyses do not change significantly. White’s (1980) heteroskedasticity-consistent covariance matrix is used.
15
23 Clarkson and Thomson (1990) and Lam (1991) find that the cross-sectional beta estimate of an IPO sample declines exponentially in the first five days of listing before stabilizing in the aftermarket.

Information Asymmetry and Estimation Risk
one risk measure for the IPO sample through the first five trading days. For a second risk measure, we
compute the price volatility measure, VOL, on the first trading day.24
We also estimate beta on firm i, BETA66, using the market model. We regress the time-series of
daily returns on firm i from its 6th through 66th trading day (up to 3 months after listing) on the
contemporaneous return on the A-share Composite of firm i’s exchange. Using the beta estimate,
BETA66, we then compute the variance of beta risk-adjusted returns from the 6th through 66th trading day,
σ662.
For the IPO sample, therefore, we individually regress the four risk measures of firm i, namely,
VOL, σ52 in the early aftermarket, and BETA66, σ66
2 in the stable aftermarket against the measures of
private information produced on firm i, namely, NINFO, QINFO, and measures of information disclosed
by firm i, namely, NDISCLOSED and QDISCLOSURE respectively.25 The robustness tests using
multivariate regression analyses involving all four information measures and the control variables,
LNSIZE and ALPHA, are repeated for the IPO sample.
4. Results and analyses of findings
The IPO sample
Preliminary statistical analyses involve the use of Pearson (Panel A) and Spearman rank (Panel
B) correlations in Table 1. We do not find systematic negative relationships between the risk and
information measures for the IPO sample. What is significant across both Panels A and B is that the
quantity of private information produced, NINFO, is positively correlated with the quality of information
24 Volatility of the first day price is measured by: Vi = (Hi - Li) / (Hi + Li), where Vi is the volatility of stock price of firm i on its first trading day; Hi is the highest price of firm i on its first trading day; and Li is the lowest price of firm i on its first trading day.
16
25 We note that the Chinese underwriters, unlike their U.S. counterpart, do not provide price support in the aftermarket. Therefore, our risk measures are not affected by any price stabilization efforts that effectively set a quasi-floor price to the aftermarket prices. Moreover, the offer prices are regulated by the China Securities Regulatory Commission and are not subject to price revisions as in the book-building process in the U.S.

disclosed by the firm, QDISCLOSURE. This means that firms with higher quality of disclosure tend to
generate more coverage. This is consistent with findings in Healy et al (1999). They find that U.S. firms
with better disclosures have larger analyst followings. Our findings give support for the same observation
in a low information environment. Additionally, the Spearman test results (Panel B) suggest that the
quantity of private information produced, NINFO, is positively correlated with the firm’s price volatility
on the first trading day, VOL, at the 5% significance level. This suggests that firms that generate more
coverage tend to exhibit greater price volatility on the first trading day.
Insert Table 1 about here
Univariate regression analyses for the early and stable aftermarket are reported in Tables 2 and 3
respectively. Contrary to the prediction of our hypothesis, but consistent with the correlation test results,
the volatility of a stock on its first trading day, VOL, is positively correlated with the quantity of private
information produced, NINFO, at the 10% significance level (Table 2). NINFO explains 5% of the price
volatility of an IPO on its first trading day. An explanation for the positive correlation between NINFO
and VOL is that the IPO that carries more ex ante “disagreement” tends to have more private information
produced for investors. Once the bulk of investor “disagreement” over the value of an IPO has been
resolved through first day trades, we find regression results for the aftermarket that are consistent with our
prediction.
Insert Table 2 about here
NINFO, NDISCLOSED and QDISCLOSURE are negatively correlated with the variance of
market-adjusted returns in the early aftermarket, σ52, with NDISCLOSED being significant at the 10%
significance level. NDISCLOSED and QDISCLOSURE respectively can explain up to 3% of the
17

Information Asymmetry and Estimation Risk
variance of market-adjusted returns in the early aftermarket, σ52. Firms that disclose more information in
their prospectus are associated with lower risk in the first five trading days. Unlike the price performance
on the first trading day, the risk of an IPO in the early aftermarket is negatively related to the firm’s
disclosures.
Table 3 reports the regression analyses results for the aftermarket up to three months after listing.
We do not find significance in any of the coefficients of the information variables given the high level of
noise in the early aftermarket.
Insert Table 3 about here
Our robustness test applying multivariate regression analysis using the four information measures
together with the control variables, LNSIZE and ALPHA, yields no significant results at the 10%
significance level.
The seasoned stock sample
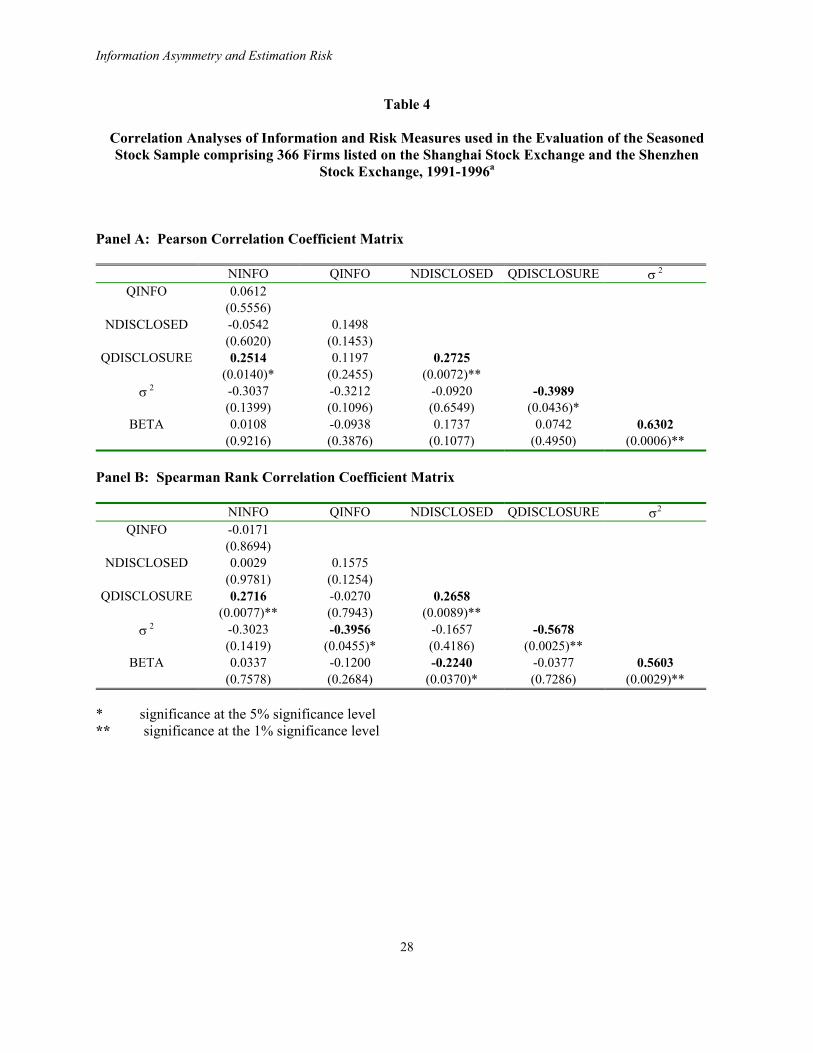
The seasoned stock sample gives stronger preliminary results than the IPO sample in the Pearson
and Spearman rank correlations analyses (see Table 4). Firstly, NINFO, NDISCLOSED and
QDISCLOSURE are all positively and significantly correlated. This suggests again that firms that signal
with a strong and credible disclosure strategy also tend to have more private information generated for
investors. Secondly, firms that choose to have high compliance with mandatory disclosure are also likely
to volunteer disclosure according to U.S. GAAP with certification from credible audit firms.
Thirdly, the variance of risk-adjusted returns, σ2, is negatively correlated with all the four
information measures under both Pearson and Spearman rank correlation analyses. In particular, it is
significantly negatively correlated with QINFO and QDISCLOSURE. To add to our previous inference,
this suggests that firms with quality disclosures also draw quality analyst following.
18

Fourthly, BETA is not consistently negatively correlated with any of the four information
measures. Looking at Spearman rank correlation analysis alone, BETA is significantly negatively
correlated with NDISCLOSED only. This implies that firms that choose to have high compliance with
mandatory disclosure also tend to have low systematic risk.
Insert Tables 4 and 5 about here
Our multivariate regression analysis again yields no significant results for the control variables,
LNSIZE and ALPHA. Table 5 therefore reports the univariate regression analyses results for the
seasoned stock sample. Consistent with the correlation test results, there is a significant negative
relationship (at the 5% significance level) between the variance of risk-adjusted returns on seasoned
stocks, σ2, and quality disclosure, QDISCLOSURE. More significantly, QDISCLOSURE alone explains
about 18% of the variation of σ2. Seasoned stocks that choose to adopt voluntary disclosure with
certification from credible audit firms are associated with lower return variability.26 Again, these results
are different from those in the U.S. given the different state of development of the capital markets as well
as disclosure and enforcement regimes. Botosan (1997) points out that in the case of U.S. markets,
disclosure measures that are limited to the information provided in the annual report may not yield a
powerful proxy for overall disclosure level when a substantial amount of information is disseminated
through financial analysts (Botosan 1997, p.325).
We perform various robustness tests, especially since both QINFO and QDISCLOSURE are by
nature subjective. We apply sensitivity analysis to the re-calibration of QINFO and QDISCLOSURE.
For example, we re-weight the credibility of information produced, say: articles produced by a stock
19
26 We further run a multivariate regression of σ2 on all the four information variables even though the Pearson and Spearman rank correlation analyses in Table 4 tell us that we would have problems of inconsistency in parameter estimation given the high correlation across NINFO, NDISCLOSED and QDISCLOSURE. In any case, the adjusted R square is not significantly improved beyond 18% offered by the univariate regression on just QDISCLOSURE.

Information Asymmetry and Estimation Risk
exchange, ten; research departments of top securities and financial houses, nine; provincial securities
companies and less well-known research institutions, five; well-known brokers writing in personal
capacity, five; and stock analyses by individuals, one. Consistent with our expectations, there is no
significant change to all the regression results. QINFO remains insignificant (at the 10% significance
level) in all the regression analyses. As for QDISCLOSURE, the subjective component of auditor
reputation has three distinct ordinal categories: Big Five affiliated, government-affiliated and university-
affiliated. Any re-weighting cannot be significantly different since we need to preserve the relative
distances among the three categories. Changing the calibration of QINFO and QDISCLOSURE from a
ten-point scale to a 100-point scale also does not change the results.
Our discussion in Section 2 highlights that credible private information production capability in
China in the early part of the 1990s was minimal. Disclosure practices can be arbitrary and management
prefers a clean audit report. On the other hand, Big Five affiliated audit firms in China have been
perceived as offering credible independence (DeFond et al, 2000). Consistent with this circumstantial
evidence, it is not surprising that the use of voluntary disclosure according to U.S. GAAP with
certification by a credible audit firm is associated with low variation of asset returns. What is surprising,
though, is that the reduction in the average variance of risk-adjusted returns that is correlated with quality
disclosure is of economic significance in the simple regression analysis (it reduces the average variance
from 1.4 to 0.5, a 64% reduction). On the other hand, none of the information measures can significantly
explain the beta estimate of seasoned stocks.27
We find quite the opposite for the IPO markets. First, IPOs are low information assets for lack of
prior market data. Therefore, IPO price data tend to be “noisy”. Second, the IPO markets are set in an
emerging economy, China, as we have described in Section 2. Our data therefore reflect the impact of an
extreme level of estimation risk.
20
27 Lewellen and Shanken (2002) model estimation risk when investors have diffuse priors. They show that beta estimate is not different from that when estimation risk is absent.

Media reports have described the Chinese IPO markets as very speculative.28 What are some of
the factors that have contributed to this volatility? For a start, the legal framework for the protection of
minority shareholder rights has not been set in place. The investing community is generally not informed
about risk and return concepts. Apart from the stock markets, there was generally a lack of investment
options (besides the fixed deposits with banks that pay an insignificant rate of return). Moreover, there
are capital controls that restrict capital outflows. All these result in a large supply of investible funds
being channeled into the stock markets by uninformed retail investors.
On the other hand, the CSRC determines the quota of IPOs to be listed annually. It also sets the
offer price by approving a price earnings multiple for each stock. Empirical evidence points to extremely
large initial returns on Chinese IPOs that exceed 100%.29 Historical price behavior in the IPO markets
supports the belief that there is too much money chasing after too few IPOs. Such “money on the table”
implies that the probability that a successful subscriber would lose money in the Chinese IPO markets is
low indeed. As long as the probability of loss in the IPO markets is insignificant, investors would
presumably have little demand for private information production, or voluntary disclosure with
certification by independent auditors. Even compliance with mandatory disclosure is of no relevance to
investment returns. But this would not be the case for investors in the seasoned stock markets.
Our findings highlight the importance of quality disclosure consistent with internationally
accepted accounting standards in emerging economies like China. Moreover, results suggest that the
appointment of a credible auditor firm in China carries positive certification value through risk reduction.
28 The December 17, 1996 edition of the Financial Times had this headline: China equity markets fall 10%. Beijing crackdown on rampant speculation and manipulation. It reported that the CSRC, China’s securities regulator, suspended the rights of two key newspapers, the Shanghai Securities News and Shenzhen-based Securities Times, to release official information about listed companies because of mistakes in reporting. On a related note, the August 15, 1997 edition of the Associated Press had this headline: Regulators take control of stock markets. It reported that CSRC had replaced Shanghai Stock Exchange’s chief Yan Xianghai. “The decision to grant direct control of the stock markets to the Commission came from the State Council, China’s cabinet. The exchanges were previously overseen by local governments….Yan’s oversight of the exchange came under fire after massive speculation and price manipulation sent share prices soaring late last year and early this year”.
21
29 We report an average market-adjusted initial return of 110% on a sample comprising 161 A share IPO listed on the Shanghai Stock Exchange and 103 A share IPO listed on the Shenzhen Stock Exchange between December 19, 1990 and April 30, 1994.

Information Asymmetry and Estimation Risk
5. Conclusion
This study evaluates investor uncertainty over the firm’s underlying cash flow or return
generating process by measuring its direct impact on the observed beta and variance of returns. If private
information production or disclosure is any effective in resolving this information asymmetry problem, it
would be associated with lower beta and variance estimates. We find preliminary evidence that quality
disclosure according to U.S. GAAP with certification of a credible audit firm is associated with lower
variance of risk-adjusted returns.
In the Chinese IPO markets where the information asymmetry problem is heightened, we find no
association between information production or disclosure with the variation of asset returns. One
explanation is that when the probability of loss to a successful IPO subscriber is perceived to be
insignificant, the expected benefits of producing information or signaling in such a market would be
limited.
We wish to qualify the results in several ways. This study is limited to the early years of
development of the Chinese equity markets. There were intermittent speculative runs followed by policy
reversals during the test period. It means that the data are expected to be very noisy. Moreover, Chinese
data are not as clean as U.S. data, for example, especially as data for the information measures in this
study are hand-collected and are less rigorously screened for errors. The results should therefore be
interpreted against the constraint of working with a dearth of good data. We also highlight that the
Chinese experience in the development of their capital markets is unique. These results are hardly
generalizable to other markets, nor do we expect them to hold with changes in regulatory and institutional
framework over time.
Notwithstanding its limitations, this study has implications for management, investors, and
regulators. Regulators set the legal, institutional and disclosure framework that affects the supply of and
investors’ demand for information. Management can help to resolve the information asymmetry problem
22

between the firm and investors through compliance with mandatory disclosure or voluntary disclosure
with signaling. What constitutes a credible signal varies from firm to firm and market to market. Healy
and Palepu (1995) suggest that investor communications costs must surely be justified by avoidance of a
greater potential loss in firm value. Finally, utility-maximizing investors need to evaluate how imperfect
information about firms’ cash flows would affect their investment decisions, and whether they can resolve
part of the uncertainty by considering available information production and disclosure processes.
23

Information Asymmetry and Estimation Risk
Table 1 Correlation Analyses of Information and Risk Measures used in the Evaluation of the IPO Sample Comprising 366 firms Listed on the Shanghai Stock Exchange and the Shenzhen Stock Exchange,
1991-1996a
Panel A: Pearson Correlation Coefficient Matrix
NINFO QINFO NDISCLOSED QDISCLOSURE VOL σ52 σ66
2
QINFO -0.0069 (0.9577)
NDISCLOSED 0.0514 0.0114 (0.6940) (0.9308)
QDISCLOSURE 0.2990 0.0823 0.0894 (0.0192)* (0.5284) (0.4935)
VOL 0.2612 0.0572 -0.0142 0.2327 (0.0795) (0.7057) (0.9253) (0.1197)
σ52 -0.0660 0.0604 -0.1610 -0.0712 -0.1522
(0.6290) (0.8586) (0.2360) (0.6021) (0.3184) σ66
2 0.0117 0.0234 0.0382 -0.0259 -0.1081 0.1721 (0.9379) (0.8746) (0.7944) (0.8599) (0.4596) (0.2369)
BETA66 -0.1436 0.1054 -0.0242 -0.2293 -0.1463 -0.0606 0.0238 (0.2736) (0.4227) (0.8542) (0.0780) (0.3312) (0.6575) (0.8582)
Panel B: Spearman Rank Correlation Coefficient Matrix
NINFO QINFO NDISCLOSED QDISCLOSURE VOL σ52 σ66
2
QINFO
-0.3029
(0.0176)* NDISCLOSED 0.1194 0.0473
(0.3594) (0.7176) QDISCLOSURE 0.4089 0.0491 0.1118
(0.0011)** (0.7070) (0.3908) VOL 0.3383 -0.0650 0.0214 0.2612
(0.0215)* (0.6679) (0.8876) (0.0795) σ5
2 -0.0483 0.1816 -0.1268 -0.1296 -0.1057 (0.7240) (0.1804) (0.3516) (0.3411) (0.4897)
σ662 0.1923 0.1516 0.1702 0.1820 -0.0784 0.0977
(0.1954) (0.3038) (0.2423) (0.2106) (0.5925) (0.5042) BETA66 -0.2136 0.1208 -0.0080 -0.1188 -0.1328 -0.0950 0.0020
(0.1014) (0.3578) (0.9518) (0.3661) (0.3788) (0.4862) (0.9888) * significance at 5% significance level ** significance at 1% significance level
24

25
a Information measures include the quantity and quality of information produced, NINFO, QINFO, respectively, and the quantity and quality of information disclosed, NDISCLOSED, QDISCLOSURE, respectively. Definitions of information measures used for the IPO sample are: NINFO the natural logarithm of the number of news and analysis reports released in
China Securities Daily and Securities Weekly from the date of the prospectus to the date of listing
QINFO the natural logarithm of the weighted average rating of the information producers NDISCLOSED the natural logarithm of the number of items disclosed by the firm in the
prospectus in accordance with the Chinese Accounting Standards QDISCLOSURE the natural logarithm of the product of the percentage of items disclosed by the
firm that are consistent with U.S. GAAP and an auditor reputation rating The risk measures are the volatility of IPO prices on the first trading day, VOL, the variance of market-adjusted returns through the first five trading days of an IPO, σ5
2, the variance of risk-adjusted returns from 6th through 66th trading day, σ66
2, and the beta estimate from 6th through 66th trading day, BETA66. P-values are reported in parentheses. Correlations with p-values < 0.05 are in bold.

Information Asymmetry and Estimation Risk
Table 2
Risk and Information Measures of the Initial Public Offering Sample through the First Five Trading Daysa
Coefficient (p-value) estimate from
regressing
Volatility of first day prices, VOL, on Variance of market-adjusted returns, σ52, on
Constant 0.0333(0.4081)
0.0094 (0.0002)
0.1009 (0.0002)
0.1573 (0.0001)
0.2607 (0.8731)
-2.2638 (0.0291)
-3.1085 (0.0916)
-4.3551 (0.0228)
NINFO 0.0337(0.0795)
-0.7642 (0.3125)
QINFO 0.0062(0.7057)
0.7574(0.3142)
NDISCLOSED -0.0054(0.2530)
-4.7491(0.0916)
QDISCLOSURE 0.0277(0.1197)
-1.5018(0.1009)
R2 0.0682 0.0033 0.0002 0.0541 0.0189 0.0188 0.0518 0.0491Adj-R2 0.0471 -0.0194 -0.0225 0.0326 0.0007 0.0006 0.0342 0.0315
a We use the volatility of an IPO on its first trading day, VOL, as one risk measure. This is defined as: VOLi = (Hi - Li) / (Hi + Li) where, Hi is the highest trading price of firm i on its first trading day; L is the lowest trading price of firm i on its first trading day. Another risk measure is the variance of market-adjusted returns for the first five trading days, σ5
2. VOL and σ52, respectively, are regressed cross-
sectionally on each of the four information measures of the same firm: the quantity and quality of private information produced on firm, NINFO, QINFO, respectively, and the quantity and quality of information disclosed by firm, NDISCLOSED, QDISCLOSURE, respectively. Please see footnote of Table 1 for definitions of information measures. Each column in the table above reports the coefficient estimate of a different regression equation, using the four information measures, one at a time. Standard errors are corrected for autocorrelation and heteroskedasticity. P-values are stated in parentheses. Coefficient estimates with p-values < 0.05 are in bold. The R-square and adjusted R-square of each regression are also reported.
26

27
Table 3
Risk and Information Measures of the Initial Public Offering Sample in the Aftermarketa
Coefficient (p-value)
estimate from regressing
Variance of risk-adjusted returns, σ662, on Beta estimate, BETA66, on
Constant 0.0007 (0.0001)
0.0006 (0.5381)
0.0006 (0.1657)
0.0074 (0.0001)
1.3033 (0.0001)
1.1335 (0.0001)
1.1514 (0.0001)
1.1006 (0.0001)
NINFO 0.0001(0.9379)
-0.0709 (0.1828)
QINFO 0.0003(0.8746)
0.0174(0.7484)
NDISCLOSED 0.0006(0.7944)
-0.0093(0.9600)
QDISCLOSURE -0.0016(0.8599)
-0.0767(0.2215)
R2 0.0001 0.0005 0.0015 0.0007 0.0304 0.0018 0.0001 0.0257Adj-R2 -0.0221 -0.0212 -0.0198 -0.0206 0.0137 -0.0154 -0.0172 0.0089
a The variance of risk-adjusted returns and the beta estimate of an IPO in the first three months are used as risk measures of an IPO in the aftermarket. Lam (1991) and Clarkson and Thompson (1990) find that both the systematic and non-systematic risks of an IPO are highly unstable through the first trading week. We therefore use the variance of risk-adjusted returns, σ66
2, as well as the beta estimate, BETA66, measured only from the 6th through 66th trading day, as the appropriate risk measures of an IPO in the aftermarket. σ66
2 and BETA66, respectively, are regressed cross-sectionally on each of the four information measures of the same firm: the quantity and quality of private information produced on firm, NINFO, QINFO, respectively, and the quantity and quality of information disclosed by firm, NDISCLOSED, QDISCLOSURE, respectively. Please refer to footnote of Table 1 for definitions of information measures. Each column in the table above reports the coefficient estimate of a different regression equation, using the four information measures, one at a time. Standard errors are corrected for heteroskedasticity (White, 1980). P-values are stated in parentheses. Coefficient estimates with p-values < 0.05 are in bold. The R-square and adjusted R-square of each regression are also reported.
Information Asymmetry and Estimation Risk
Table 4
Correlation Analyses of Information and Risk Measures used in the Evaluation of the Seasoned Stock Sample comprising 366 Firms listed on the Shanghai Stock Exchange and the Shenzhen
Stock Exchange, 1991-1996a Panel A: Pearson Correlation Coefficient Matrix
NINFO QINFO NDISCLOSED QDISCLOSURE σ 2 QINFO 0.0612
(0.5556) NDISCLOSED -0.0542 0.1498
(0.6020) (0.1453) QDISCLOSURE 0.2514 0.1197 0.2725
(0.0140)* (0.2455) (0.0072)** σ 2 -0.3037 -0.3212 -0.0920 -0.3989
(0.1399) (0.1096) (0.6549) (0.0436)* BETA 0.0108 -0.0938 0.1737 0.0742 0.6302
(0.9216) (0.3876) (0.1077) (0.4950) (0.0006)** Panel B: Spearman Rank Correlation Coefficient Matrix
NINFO QINFO NDISCLOSED QDISCLOSURE σ2 QINFO -0.0171
(0.8694) NDISCLOSED 0.0029 0.1575
(0.9781) (0.1254) QDISCLOSURE 0.2716 -0.0270 0.2658
(0.0077)** (0.7943) (0.0089)** σ 2 -0.3023 -0.3956 -0.1657 -0.5678
(0.1419) (0.0455)* (0.4186) (0.0025)** BETA 0.0337 -0.1200 -0.2240 -0.0377 0.5603
(0.7578) (0.2684) (0.0370)* (0.7286) (0.0029)** * significance at the 5% significance level ** significance at the 1% significance level
28

29
a Information measures include the quantity and quality of information produced, NINFO, QINFO, respectively, and the quantity and quality of information disclosed, NDISCLOSED, QDISCLOSURE, respectively. Definitions of information measures used for seasoned stock sample are: NINFO the natural logarithm of the number of news and analysis reports released in
China Securities Daily and Securities Weekly during the four months before the end of the fiscal year
QINFO the natural logarithm of the weighted average rating of the information producers NDISCLOSED the natural logarithm of the number of items disclosed by the firm in the annual
financial report in accordance with the Chinese Accounting Standards QDISCLOSURE the natural logarithm of the product of the percentage of items disclosed by the
firm that are identical to U.S. GAAP and an auditor reputation rating The risk measures are the variance of risk-adjusted returns, σ2, and the beta estimate, BETA, of each firm that are drawn from the time series of daily returns four months before the end of the fiscal year. P-values are in parentheses. Correlation coefficients with p-values < 0.05 are in bold.

Information Asymmetry and Estimation Risk
Table 5
Risk and Information Measures of a Seasoned Stock Sample in the Chinese Secondary Marketsa
Coefficient (p-value) estimate from
regressing
Variance of risk-adjusted returns, σ2, on
Beta estimate, BETA, on
Constant 1.7024(0.0583)
4.3855 (0.0792)
0.9714 (0.4355)
1.4277 (0.0036)
1.0417 (0.0001)
1.0956 (0.0001)
0.9971 (0.0001)
1.0868 (0.0001)
NINFO -0.5556(0.1399)
0.0034 (0.9216)
QINFO -1.2438(0.1096)
-0.0409(0.2097)
NDISCLOSED -0.2909(0.6549)
-0.1451(0.1077)
QDISCLOSURE -0.9157 (0.0183)
0.0253(0.4949)
R2 0.0922 0.0131 0.0085 0.2109 0.0001 0.0088 0.0302 0.0055Adj-R2 0.0528 -0.0658 -0.0329 0.1781 -0.0118 -0.0029 0.0187 -0.0062
a The risk measures are the variance of risk-adjusted returns, σ2, and the beta estimate, BETA, of each stock. These are estimated from the time series of daily returns four months before the end of the fiscal year. σ2 and BETA, respectively, are regressed cross-sectionally on each of the four information measures of the same firm: the quantity and quality of private information produced, NINFO, QINFO, respectively, and the quantity and quality of information disclosed by the firm, NDISCLOSED, QDISCLOSURE, respectively. Please refer to footnote of Table 4 for definitions of information measures. Each column in the table above reports the coefficient estimate of a different regression equation, using the four information measures, one at a time. Standard errors are corrected for heteroskedasticity (White, 1980). P-values are stated in parentheses. Coefficient estimates with p-values < 0.05 are in bold. The R-square and adjusted R-square of each regression are also reported.
30
References
Akerlof, G.A., 1970. The market for ‘lemons’: Quality uncertainty and the market mechanism.
Quarterly Journal of Economics 84: 488-500.
Amihud, Y. and H. Mendelson. 1986. Asset pricing and the bid-ask spread. Journal of Financial
Economics 17 (December): 223-249.
Auer, K. 1998. Der einfluß des wechsels vom rechnungslegungsstandard auf die risikoparameter von
schweizerischen aktien. Zeitschrift fũr betriebswirtschaftliche Forschung (February): 129-155.
Bailey, W. 1994. Risk and return on China’s new stock markets: Some preliminary evidence. Pacific-
Basin Finance Journal 2, 243-260.
Barry, C.B., and S.J. Brown. 1985. Differential information and security market equilibrium. Journal of
Financial and Quantitative Analysis 20, 407-422.
Bawa, V.S., S.J. Brown and R.W. Klein. 1979. Estimation Risk and Optimal Portfolio Choice.
Amsterdam: North-Holland Publishing Co.
Beatty, R., 1989. Auditor reputation and the pricing of initial public offerings. The Accounting Review
64, 693-709.
Botosan, C. 1997. Disclosure level and the cost of equity capital. The Accounting Review 72 (July): 323-
349.
Brennan, M. and A. Subrahmanyam. 1996. Market microstructure and asset pricing: On the
compensation for illiquidity in stock returns. Journal of Financial Economics 41 (July): 441-464.
Bushee, B.J., and C.F. Noe. 2000. Corporate disclosure practices, institutional investors, and stock return
volatility, Journal of Accounting Research 38: 171-202.
Clarkson, P.M. and R. Thompson. 1990. Empirical estimates of beta when investors face estimation risk.
Journal of Finance 45, 431-453.
Clarkson, P.M., J. Guedes and R. Thompson. 1996. On the diversification, observability and
measurement of estimation risk. Journal of Financial and Quantitative Analysis 31 (March), 69-
84.
Copeland, T.E. and D. Galai. 1983. Information effects on the bid-ask spread. Journal of Finance 38
(December): 1457-1469.
DeAngelo, L.E. 1981. Auditor size and audit quality. Journal of Accounting and Economics 3(3): 183-
199.
DeFond, M.L., T.J. Wong and S. Li. 2000. The impact of improved auditor independence on audit
market concentration in China. Journal of Accounting and Economics 28: 269-305.
31

Information Asymmetry and Estimation Risk
32
Diamond, D. and R. Verrecchia. 1991. Disclosure, liquidity and cost of capital. Journal of Finance
46(4): 1325-1359.
Glosten, L. and P. Milgrom. 1985. Bid, ask and transaction prices in a specialist market with
heterogeneously informed traders. Journal of Financial Economics 14 (March): 71-100.
Healy, P.M. and K.G. Palepu. 1995. The challenges of investor communication: The case of CUC
International, Inc. Journal of Financial Economics 38 (June): 111-140.
Healy, P.M., A. Hutton and K.G. Palepu. 1999. Stock performance and intermediation changes
surrounding sustained increases in disclosure. Contemporary Accounting Research 16 (Fall):
485-520.
Hepp, J. and Y. Chen. 1997. Chinese accounting in transition. The Journal of Corporate Accounting and
Finance 8: 103-114.
Klein, R.W. and V.S. Bawa. 1976. The effect of estimation risk on optimal portfolio choice. Journal of
Financial Economics 3: 215-231.
Klein, R.W. and V.S. Bawa. 1977. The effect of limited information and estimation risk on optimal
portfolio diversification. Journal of Financial Economics 5: 89-111.
La Porta, R., F. Lopez-De-Silanes, A. Shleifer, R. Vishny. 1998. Law and finance. The Journal of
Political Economy 106 (December): 1113-1155.
Lam, S.S., 1991. Venture capital financing: A conceptual framework. Journal of Business Finance &
Accounting 18: 137-149.
Lewellen, J. and J. Shanken. 2002. Learning, asset-pricing tests, and market efficiency. Journal of
Finance 57: 1113-1145.
Leuz, C. and R.E. Verrecchia. 2000. The economic consequences of increased disclosure. Journal of
Accounting Research 38: 91-124.
Qi, D., W. Wu and H. Zhang. 2000. Shareholding structure and corporate performance of partially
privatized firms: Evidence from listed Chinese companies, Pacific–Basin Finance Journal 8,
587-610.
Scholes, M. and J. Williams. 1977. Estimating betas from nonsynchronous data. Journal of Financial
Economics 5, 309-328.
White, H. 1988. A heteroskedasticity-consistent covariance matrix estimator and a direct test for
heteroskedasticity. Econometrica 48, 817-838.
Zhang, G. 2001. Private information production, public disclosure, and the cost of capital: Theory and
implications. Contemporary Accounting Research 18 (Summer): 363-384.