information and consumer choice: the value of publicized...
TRANSCRIPT

Journal of Health Economics 25 (2006) 248–275
Information and consumer choice: The value ofpublicized health plan ratings
Ginger Zhe Jina, Alan T. Sorensenb,∗a University of Maryland and NBER, College Park, MD 20742, USA
b Stanford University and NBER, Graduate School of Business,518 Memorial Way, Stanford, CA 94305-5015, USA
Received 30 August 2004; received in revised form 24 June 2005; accepted 28 June 2005Available online 16 August 2005
Abstract
We use data on the enrollment decisions of federal annuitants to estimate the influence of publicizedratings on health plan choice. We focus on the impact of ratings disseminated by the National Commit-tee for Quality Assurance (NCQA), and use our estimates to calculate the value of the information. Ourapproach exploits a novel feature of the data—the availability of nonpublic plan ratings—to correctfor a source of bias that is inherent in studies of consumer responsiveness to information on productquality: since publicized ratings are correlated with other quality signals known to consumers (butunobserved by researchers), the estimated influence of ratings is likely to be overstated. We control forthis bias by comparing the estimated impact of publicized ratings to the estimated impact of ratingsthat were never disclosed. The results indicate that NCQA’s plan ratings had a meaningful influenceon individuals’ choices, particularly for individuals choosing a plan for the first time. Although weestimate that a very small fraction of individual decisions were materially affected by the information,for those that were affected the implied utility gains are substantial.© 2005 Elsevier B.V. All rights reserved.
JEL classification: D12; D83; I11; L15
Keywords: Health plan ratings; Value of information; Health plan choice; Quality ratings
∗ Corresponding author. Tel.: +1 650 724 0446; fax: +1 650 725 7979.E-mail addresses: [email protected] (G.Z. Jin), [email protected] (A.T. Sorensen).
0167-6296/$ – see front matter © 2005 Elsevier B.V. All rights reserved.doi:10.1016/j.jhealeco.2005.06.002
G.Z. Jin, A.T. Sorensen / Journal of Health Economics 25 (2006) 248–275 249
1. Introduction
Consumers often choose between products whose qualities or characteristics are exante uncertain. The reliability of a car, for example, cannot be fully known at the time ofpurchase, and the quality of a restaurant isn’t known until after one has dined there. Forsome products, the presence of such uncertainty has given rise to markets for information:for example, companies like Edmunds and Consumer Reports publish automobile ratings,and publications like Zagat provide restaurant reviews. The profitability of such informationenterprises indicates that the information is valuable—but exactly how valuable is it? Insome cases, government or nonprofit consumer-interest agencies have assumed the role ofinformation provider. Does the information benefit consumers enough to warrant the costsof its acquisition and dissemination?
In this paper, we attempt to answer these questions in the context of employee health plandecisions. For employees choosing from a menu of health plan options, how valuable arepublicized plan ratings in making the decision? The National Committee for Quality Assur-ance (NCQA), an independent nonprofit agency that serves as a “watchdog for the managedcare industry”, collects and actively disseminates information about health insurance plans.The ratings and statistics are used by large employers to inform their employees aboutplans, and for a period of time in the late 1990’s summaries of the ratings were publishedin a major national news magazine,U.S. News & World Report. Using enrollment data fora large sample of U.S. government annuitants, we measure the impact of the health planratings on individuals’ choices, and use our estimates to calculate the value (to consumers)of the information.
This study is not the first to analyze consumer reponses to health plan quality informa-tion. Wedig and Tai-Seale (2002)examine data on federal employees in 1995 and 1996,when health plan report cards were first provided, and report evidence that plan ratingssignificantly influenced individuals’ decisions.Beaulieu (2002)examined the health planchoices of Harvard University employees and found that the provision of quality informa-tion in 1997 had a small but significant effect.Scanlon et al. (2002)use employee data fromGeneral Motors to study health plan decisions; they find that employees respond to overallquality indices but not to specific quality measures. Using the same dataset,Chernew et al.(2004)estimate the parameters of a Bayesian learning model, in which reported plan ratingscause individuals to update their prior beliefs about plan quality. Their findings confirm thepositive value of information, but also suggest that much of the information in reportedratings was already known.
Relative to the previous literature, the key contribution of this paper lies in its ability tocorrect for an important source of bias in estimating the quantitative impact of publicizedratings. A fundamental challenge for this study and all its predecessors is that publishedinformation may be highly correlated with quality signals consumers can obtain throughinformal channels. In general, this correlation between observed product ratings and unob-served product quality will cause econometric estimates of the ratings’ impact to be biased.In the present context, if health plan ratings simply mirror information about plan qualitythat was already known to consumers (but not the econometrician), then high market sharesfor plans with high ratings could be incorrectly interpreted as evidence that the ratings wereinfluential. This is obviously a critical concern if one’s objective is to determine the value

250 G.Z. Jin, A.T. Sorensen / Journal of Health Economics 25 (2006) 248–275
of information: if the health plan ratings merely reflect information that consumers alreadyknew, then the ratings have no informational value at all.
Our ability to address this problem comes from a novel characteristic of the data. Whilemost major health plans reported information to NCQA during our sample period, not allplans elected to allow public dissemination of their information. Essentially, plans reportingto NCQA had the option of being “public” or “nonpublic”.1 For the years 1998–1999, wehave NCQA rating data forboth types of plans. The reason this is valuable is that ratingsfor nonpublicly reporting plans by definition have no causal impact on choices: individualscannot be influenced by information they do not have. Therefore, any measured effect ofnonpublic ratings on plan choice must purely reflect the correlation of those ratings withunobserved plan quality. If the correlation between plan ratings and unobserved plan qualityis the same whether a plan is public or nonpublic, the difference between the estimatedimpacts of public versus nonpublic ratings provides a consistent measure of the publicinformation’s actual influence.
This approach is similar in spirit to that ofWedig and Tai-Seale (2002), who studyconsecutive years in which FEHBP provided health plan report cards to employees. In 1995,these report cards were distributed on a limited basis, whereas in 1996 the distribution wasmore widespread, so the authors compare the measured effects of the report cards in theconsecutive years to test the hypothesis that report cards provided relevant information toconsumers. Hence the underlying idea—to control for the bias stemming from correlationswith unmeasured quality by comparing the effects of information that is versus is notpublicized—is the same as the one motivating our study, with the primary difference beingthat we are able to make this comparison contemporaneously by comparing the impact ofpublic versus nonpublic information in the same year.
Our empirical strategy not only delivers a clean estimate of the informational value ofpublicized plan ratings, but also allows us to assess the overall importance of the corre-lation with unobservables problem. Previous authors have employed various approachesto circumvent or resolve the problem; having replicated those approaches, we can observewhether nonpublic plan ratings still appear to “influence” individuals’ choices. For example,Beaulieu (2002)emphasizes estimates of the impact of plan ratings on switching behaviorrather than cross-sectional results relating plans’ market shares to their ratings, andScanlonet al. (2002)use a panel dataset to estimate a choice model with plan fixed effects, effectivelyeliminating any bias that would result if plans’ ratings are correlated with time-invariantunobservables. Our data enable us to employ similar controls, and then additionally com-pare the estimated effects of public versus nonpublic ratings. If nonpublic ratings appearto be influential after controlling for time-invariant unobserved plan characteristics or indi-vidual enrollment history, then we could infer that such controls are insufficient—i.e., thatplan ratings are likely correlated with unobservable, time-varying determinants of planchoice—and result in overstated estimates of the impact of publicized plan ratings.
In the following section, we explain how health plan quality information is collected anddisseminated to consumers, and then describe the features of our data. Section3 presentsempirical estimates of the influence of plan ratings. The results generally confirm that
1 SeeJin (2005)for an empirical analysis that partially accounts for this disclosure decision. That paper pools“not reporting to NCQA” and “reporting to NCQA nonpublicly” as one group of non-disclosure.

G.Z. Jin, A.T. Sorensen / Journal of Health Economics 25 (2006) 248–275 251
correlation of these ratings with unobservable plan characteristics is an important problem;however, we find that controlling for switching costs and time-invariant unobservables (e.g.,by incorporating plan fixed effects or lagged plan market shares) mostly corrects the bias. InSection3.4, we use the empirical estimates to calculate the information value of publicizedplan ratings. Although we estimate that a very small fraction of individual decisions werematerially affected by the information, for those that were affected the implied utility gainsare substantial. The overall implications of our findings are discussed in the concludingsection.
2. Background and data
2.1. How health plan ratings are constructed and publicized
2.1.1. NCQA programsNCQA is the earliest and remains the most important verification agency for HMOs.
Founded in 1979 by two major managed care trade associations, NCQA claimed inde-pendence in 1990 under the support of the Robert Wood Johnson Foundation along withmatching funds from HMOs and purchaser contributions. NCQA offers a variety of healthcare quality evaluation services, including accreditation2 and the collection, updating, andmaintenence of the Health Plan Employer Data and Information Set (HEDIS®). HEDIShas been offered nationwide annually since August 1996. It permits HMOs to disclosetheir summary statistics on physician inputs and patient utilization of certain procedures.Typical examples are breast cancer screening, diabetic eye exams, child immunization, andphysician turnover rates. These data are self-collected by HMOs and standardized subject toNCQA specifications. Every year since 1996, NCQA has also conducted independent con-sumer surveys for each participating HMO and reported satisfaction indices if it is permittedto do so. The survey was named the NCQA Member Satisfaction Survey (MSS) before 1998and renamed the Consumer Assessment of Health Plan Satisfaction (CAHPS®) after 1998.Because HEDIS measures and consumer satisfaction data appear together in media publi-cations, we group them as HEDIS/CAHPS.
Participation in both HEDIS and CAHPS is voluntary. Moreover, HEDIS/CAHPS par-ticipants may allow NCQA to publicize the collected data, or instruct NCQA to keep themnonpublic. For “public” plans, NCQA may include the plan-specific data in one comparisontable and sell it to employers (typically at a cost of US$ 2500–7500 per copy), disclose thedata to the media, make the data accessible through its own website, or provide the data toconsumer groups and government agencies. For example, each year from 1996 to 1998,U.S.News & World Report used the HEDIS/MSS data to construct a comparison chart of HMOs,and assigned an overall rating from one to four stars.Newsweek also made a similar tablein 1999. In principle, the participation and publication decisions can be made separately forHEDIS and CAHPS. In practice, plans are more likely to report in HEDIS than in CAHPS.Participation in CAHPS is somewhat more costly because it is survey-based, and becauseNCQA requires the use of a licensed survey vendor following a strict protocol.
2 For a detailed description of NCQA accreditation, seeJin (2005).

252 G.Z. Jin, A.T. Sorensen / Journal of Health Economics 25 (2006) 248–275
We define a plan to be “public” if it has an overall score inU.S. News & World Report orallows NCQA to publicize its data in both HEDIS and CAHPS. By this definition, throughoutthe whole HMO industry (with or without FEHBP contracts), 26.7% of operating HMOsparticipated in the public release of HEDIS/CAHPS in 1998, accounting for 49% of HMOpatients. Another 18.1% reported nonpublic data, accounting for 29% of patients. Theremaining 55.2% of HMOs (covering 22% of HMO patients) did not report to NCQA.
Because participation in the NCQA rating programs is voluntary, the decision to reportpublicly is itself potentially informative to consumers. In Section3.2, we discuss the endo-geneity of disclosure status and how it affects our empirical analysis. Intuitively, one mightexpect that plans with the highest ratings are the ones who elect to report publicly; however,we discuss below that there are various idiosyncratic reasons why some plans choose notto report publicly, and we show that there is considerable overlap in the distribution of planratings for public versus nonpublic plans.
2.1.2. FEHBP guideOperated by the Office of Personnel Management (OPM), FEHBP is the largest
employer-sponsored health benefit program in the world, offering health insurance toroughly 1.7 million federal employees and 2.2 million annuitants (which include retireesand employee survivors). Every year, it renegotiates contracts with 200–400 HMOs and13–21 non-HMOs. In selecting plans to contract with, OPM says its most important con-cern is a plan’s financial stability, not its quality ratings. The rationale for including so manyplans is to allow consumers to benefit from competition among health plans.
Strictly speaking, an “HMO” can be an HMO or a POS but cannot be both.3 For sim-plification, we group all HMO/POS plans as HMOs. All non-HMOs offer both PPO andnon-PPO coverages, which are subject to different copay and coinsurance structures but inthe data share the same plan ID, premium and quality ratings. If an individual chooses anon-HMO, she does not need to choose between PPO and non-PPO until the delivery ofhealth services. For this reason, we refer to all non-HMOs as fee-for-service (FFS) and donot differentiate between PPO and non-PPO coverages.
Every year FEHBP publishes a guidebook right before the open enrollment season,November 1 to November 30. Plan choices made in the open enrollment season are validfor the duration of the next calendar year unless the beneficiary moves or exits the FEHBPsystem. The guidebook, disseminated in both hard copy and electronically on the internet,lists premium, main benefits (such as copays and prescription drug coverage), and somequality information for every plan. Premium is further broken down by self and familycoverages, but the other variables do not vary by self/family. Detailed benefits are describedin plan-specific brochures, available at local human resource offices and on the FEHBPwebsite. Because there are few FFS plans and each FFS plan has two sets of copay andcoinsurance structures for PPO and non-PPO, in the empirical analysis we define benefitvariables for HMOs only.
FEHBP has long been praised as a model program for its provision of quality information.Its own consumer satisfaction survey was started in 1994 and the first set of survey results
3 FEHBP considers it unfair for a health plan to compete with itself.

G.Z. Jin, A.T. Sorensen / Journal of Health Economics 25 (2006) 248–275 253
were disseminated to a limited subsample of beneficiaries in the 1995 open enrollmentseason. From 1996 on, the survey has been repeated every year and survey results havebeen published in the FEHBP guide for all beneficiaries. Unlike NCQA programs, FEHBPrequires every plan with more than 300 enrollees in the previous year, including HMOsand non-HMOs, to participate in the FEHBP consumer survey. We focus on two measuresof satisfaction: the percentage of enrollees who report being “very satisfied” or “extremelysatisfied” overall, and the percentage of enrollees who report being satisfied with a plan’scoverage of services. These satisfaction rates, as reported in the FEHBP guide, are plan-specific and do not vary by self/family coverage, nor by respondent characteristics. Theoverall satisfaction rate is a time-consistent measure, since the survey question to whichit corresponds did not change from year to year. The reporting format for plan coveragesatisfaction changed in 1999, so in our empirical models we estimate coefficients for thecoverage variable separately by year. FEHBP does not report HEDIS/CAHPS data, but theyare available from other media reports as mentioned above.4
2.2. Data
The principal data sources for our analysis are the health plan enrollment records of allfederal government annuitants. The complete data set, which was provided by the Office ofPersonnel Management (OPM), covers roughly 1.7 million employees and 2 million annui-tants across the entire U.S. for the years 1995–2000. Current employees may be more sensi-tive to health plan information than annuitants, but OPM keeps employee records by workingplace instead of living place. Since an individual cannot enroll in an HMO unless she residesin one of the plan’s serving counties (at the time of enrollment), the lack of residence infor-mation makes it difficult to define the choice set of health plans for each employee. We, there-fore, focus the empirical analysis on annuitants, for whom this data problem does not existbecause their residence information is recorded in the data. We use the term “annuitants”to include both retirees and surviving family members of deceased federal employees.5
Most of the annuitants in the data are old enough to qualify for Medicare. However,most still enroll in an FEHBP plan for supplementary coverage. For these individuals,Medicare serves as the primary insurer, and FEHBP plans adjust any payments so that theysupplement rather than duplicate any Medicare benefits. Although the FEHBP plans arenot Medigap plans (in the sense that they are not one of the ten standardized Medicaresupplemental policies), annuitants have little reason to purchase Medigap policies whenthey can obtain similar supplemental coverage through FEHBP at heavily subsidized rates.FEHBP brochures explicitly discourage Medicare-eligible annuitants from purchasing bothan FEHBP plan and a Medigap policy, since the combination of Medicare and FEHBPprovides essentially comprehensive coverage. Because the majority of annuitants enrollin an FEHBP plan either for primary or supplementary coverage, publicized health plan
4 FEHBP also began publishing NCQA accreditation status in 1996. We control for this information in theempirical analysis.
5 Retirees entitled to annuitized retirement benefits are also eligible for FEHBP health insurance coverage ifthey were continuously enrolled in any FEHBP plan for the 5 years of service immediately prior to the start of theirretirement annuity. Survivors are eligible if the employee was enrolled in family coverage at the time of death.

254 G.Z. Jin, A.T. Sorensen / Journal of Health Economics 25 (2006) 248–275
Table 1Summary of health plans
1998 1999
Total # of health plans 442 362# FFS plans 14 13% enrollment in FFS 60.95 60.94# HMO plans 428 349% enrollment in HMO 12.38 12.49# publicly reporting plans 175 133% enrollment in public 7.25 7.10# nonpublic plans 72 95% enrollment in nonpublic 2.64 3.33
The percentages enrolled in FFS and HMO plans do not add to one because some annuitants opt out, choosingnot to enroll in any FEHBP plan. The percentages enrolled in public and nonpublic do not add to the percentageenrolled in HMOs because some plans are non-reporting (i.e., neither public nor nonpublic).
information is directly relevant regardless of Medicare eligibility. However, it is possiblethat Medicare-eligible individuals respond to the information differently; we address thisissue directly in the analysis of Section3.3.
For each annuitant in each year, we observe the health plan chosen and type of cov-erage (i.e., single or family),6 as well as individual characteristics such as age, income,sex, and county of residence.Table 1summarizes the health plans offered in the FEHBPsystem. Because the FEHBP covers annuitants nationwide, there are hundreds of plans inthe system—even though a given annuitant typically selects from a menu of roughly 5–10HMO plans (in addition to all available FFS plans). As the table indicates, the total numberof plans decreased dramatically during the sample period, and enrollment in HMO plansincreased slightly.
In a typical year, about 26.5% of annuitants do not choose any FEHBP plan. This happensfor two reasons: the annuitant is covered somewhere else outside the FEHBP system, orcovered through his/her spouse who is eligible for the FEHBP benefits as well. Becausewe do not observe marital status, it is impossible to distinguish these two cases. We ignorethese individuals who “opt out”, so all empirical analyses are conditional on having chosenan FEHBP plan.
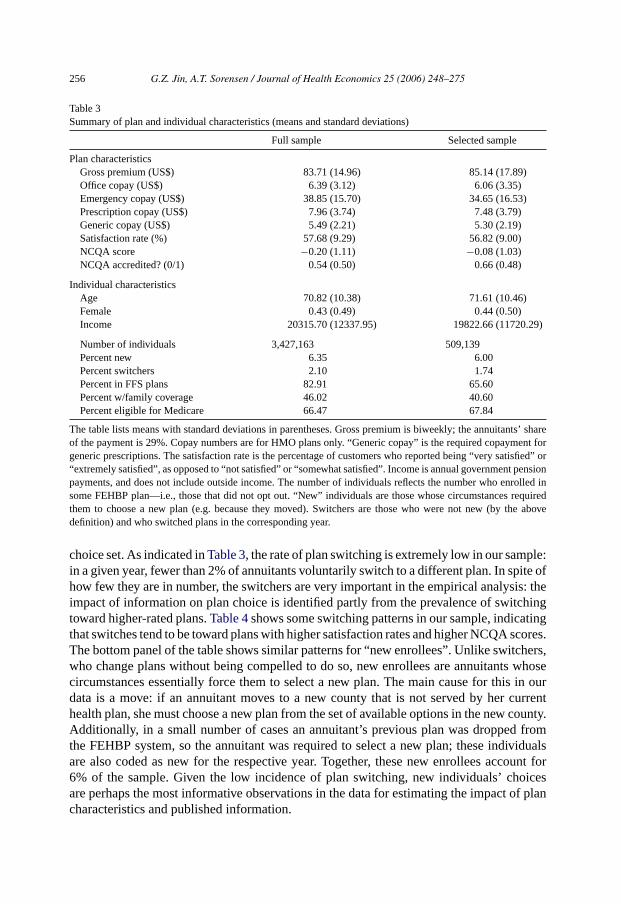
To make the data more manageable and to focus attention on the data most relevantto our study, we narrowed the sample to 86 counties in which we observed the greatestnumber of public and nonpublic plans operating simultaneously. The main justification fordoing this is that counties without publicly or nonpublicly reporting plans are essentiallyuninformative with respect to the key questions of our study. Moreover, although thereare many counties outside our sample that have either public or nonpublic plans, we aremost interested in observing counties where both types of plans are available.Table 2liststhe important characteristics of the counties in our selected sample, and compares them tothe full sample. Not surprisingly, our sample is somewhat biased toward larger counties
6 Medicare enrollment is individual-only, but medicare-eligible annuitants may enroll in family coverage throughFEHBP. In such cases, FEHBP serves as supplemental coverage for the medicare-eligible annuitant, and as primaryor supplemental coverage for the spouse depending on his/her medicare eligibility.

G.Z. Jin, A.T. Sorensen / Journal of Health Economics 25 (2006) 248–275 255
Table 2Summary statistics for counties: selected vs. full sample
Full sample Selected sample
1998 1999 1998 1999
# of counties 3180 3220 86 86Median # annuitants per county 106 106 736 741Mean # annuitants per county 530 523 3000 2971Median # plans per county 6 6 11 10Median # HMOs per county 2 2 5 5Median # reporting plans 2 2 3 3Median # public per county 1 1 2 2Median max # public per county 1 1 3 3Median # nonpublic per county 1 1 1 2Median max # nonpublic per county 1 1 2 2
with more offered plans. However, we note that the sample covers a broad geographic anddemographic range: every major region of the U.S. is represented, with large urban countiessuch as New York, NY included along with smaller and less populated counties such asTuolumne, CA. A full list of the 86 selected counties is provided in the Appendix.
In principle, the set of available health plans in each county can be easily reconstructedfrom the individual choices. However, while health insurance coverage extends from January1 to December 31, the OPM data are based on coverage and residence information as ofSeptember 30. As a result, some individuals may have moved before September 30 butkept the same health plan. Subject to plan portability, a plan may show up in a county(with an extremely low market share) even if it does not serve that county. To address thiscontamination, we cut off the choice sets by excluding plans with market shares below 0.5%and total enrollment less than 10. The numbers inTable 2reflect this definition of the choicesets. Overall, 126 (113) HMO plans and 8 (7) FFS plans are represented in the data in 1998(1999). The FFS plans offered through FEHBP are national plans, while the HMO plansare city- or county-specific.
Data on health plan characteristics were obtained from FEHBP guidebooks for the rel-evant years. Some features of health plans, such as office or prescription drug copayments,exhibit little variation across plans. However, there is substantial variation in plan premi-ums. During our sample period, the government covered 71% of the listed premium, withthe remainder being the responsibility of the enrollee. Premiums vary across plans—evenwithin fee-for-service or HMO classes, some plans were considerably more expensive thanothers—and also (to a lesser extent) over time. The top panel ofTable 3shows summarystatistics for plan characteristics, comparing the selected sample to the full sample. Thebottom panels of the table summarize the individual characteristics of principal interestfor the empirical analysis. Note that because the sample consists solely of annuitants, theaverage age is quite high and the average income is rather low. Our income measure reflectspension payments by the government, and will understate true income levels to the extentthat individuals have income from other sources.
In analyzing health plan choice behavior it is useful to distinguish two specific typesof individuals: “switchers” and “new enrollees”. We define a switcher as someone whoswitches plans in a given year without being compelled to do so by some change in her
256 G.Z. Jin, A.T. Sorensen / Journal of Health Economics 25 (2006) 248–275
Table 3Summary of plan and individual characteristics (means and standard deviations)
Full sample Selected sample
Plan characteristicsGross premium (US$) 83.71 (14.96) 85.14 (17.89)Office copay (US$) 6.39 (3.12) 6.06 (3.35)Emergency copay (US$) 38.85 (15.70) 34.65 (16.53)Prescription copay (US$) 7.96 (3.74) 7.48 (3.79)Generic copay (US$) 5.49 (2.21) 5.30 (2.19)Satisfaction rate (%) 57.68 (9.29) 56.82 (9.00)NCQA score −0.20 (1.11) −0.08 (1.03)NCQA accredited? (0/1) 0.54 (0.50) 0.66 (0.48)
Individual characteristicsAge 70.82 (10.38) 71.61 (10.46)Female 0.43 (0.49) 0.44 (0.50)Income 20315.70 (12337.95) 19822.66 (11720.29)
Number of individuals 3,427,163 509,139Percent new 6.35 6.00Percent switchers 2.10 1.74Percent in FFS plans 82.91 65.60Percent w/family coverage 46.02 40.60Percent eligible for Medicare 66.47 67.84
The table lists means with standard deviations in parentheses. Gross premium is biweekly; the annuitants’ shareof the payment is 29%. Copay numbers are for HMO plans only. “Generic copay” is the required copayment forgeneric prescriptions. The satisfaction rate is the percentage of customers who reported being “very satisfied” or“extremely satisfied”, as opposed to “not satisfied” or “somewhat satisfied”. Income is annual government pensionpayments, and does not include outside income. The number of individuals reflects the number who enrolled insome FEHBP plan—i.e., those that did not opt out. “New” individuals are those whose circumstances requiredthem to choose a new plan (e.g. because they moved). Switchers are those who were not new (by the abovedefinition) and who switched plans in the corresponding year.
choice set. As indicated inTable 3, the rate of plan switching is extremely low in our sample:in a given year, fewer than 2% of annuitants voluntarily switch to a different plan. In spite ofhow few they are in number, the switchers are very important in the empirical analysis: theimpact of information on plan choice is identified partly from the prevalence of switchingtoward higher-rated plans.Table 4shows some switching patterns in our sample, indicatingthat switches tend to be toward plans with higher satisfaction rates and higher NCQA scores.The bottom panel of the table shows similar patterns for “new enrollees”. Unlike switchers,who change plans without being compelled to do so, new enrollees are annuitants whosecircumstances essentially force them to select a new plan. The main cause for this in ourdata is a move: if an annuitant moves to a new county that is not served by her currenthealth plan, she must choose a new plan from the set of available options in the new county.Additionally, in a small number of cases an annuitant’s previous plan was dropped fromthe FEHBP system, so the annuitant was required to select a new plan; these individualsare also coded as new for the respective year. Together, these new enrollees account for6% of the sample. Given the low incidence of plan switching, new individuals’ choicesare perhaps the most informative observations in the data for estimating the impact of plancharacteristics and published information.

G.Z. Jin, A.T. Sorensen / Journal of Health Economics 25 (2006) 248–275 257
Table 4Choice patterns for switchers and new enrollees
Previous plan New plan Other plans
SwitchersPercent FFS 64.92 60.56 56.47Percent Public 46.85 49.26 39.85Percent Nonpublic 32.20 28.18 27.04Mean satisfaction rate 61.54 63.41 60.79Mean NCQA score −0.18 0.04 −0.32Mean previous-year market share 11.84 19.48 6.24
New enrolleesPercent FFS – 48.94 57.52Percent public – 54.03 37.88Percent nonpublic – 23.57 27.95Mean satisfaction rate – 62.23 60.13Mean NCQA score – 0.21 −0.57Mean previous-year market share – 23.10 5.75
It is worth noting that the low switching rate is not unique to our data. Among theHarvard employees studied inBeaulieu (2002), only 5% voluntarily switched plans in1997, and another 4% were forced to switch due to plan termination. The voluntary switchrates reported bySorensen (2004)are also in the 5% range (for employees of the Universityof California). These percentages are not far from ours, and given the size of our sample,we observe a much greater number of voluntary and involuntary switches.
For the empirical analysis, we restrict our attention to the years 1998–1999. Health planratings based on HEDIS/CAHPS data were not widely available until 1997: although someinformation was being collected by NCQA, that information was not actively disseminateduntil late 1996. In September 1996,U.S. News & World Report released an issue devotedto health plan quality concerns, including a summary of the NCQA ratings for all publiclyreporting U.S. health plans. This special issue was then repeated annually for the years1997–1998. Due to the late publication dates, the ratings are relevant to the enrollmentdecisions for the following year, so 1997 was the first year in which annuitants’ plan choicescould have been influenced by the published ratings. However, we are forced to ignore 1997in the analysis because we do not have complete data from NCQA on health plan scoresfor 1997. Although in principleU.S. News scores could be used to impute the NCQAinformation (a process explained in more detail below), the imputation is problematic for1997, since the weighting of various NCQA categories was dramatically different in 1997versus 1998–1999 (the years for which we do have complete NCQA data). This essentiallymakes it difficult to calculate summary ratings that are comparable across years.7
7 The 1997U.S. News ratings weighted preventive care categories much more heavily than in later years. Infact, the 1997 ratings were based solely on preventive measures, while 1998 and 1999 ratings included manynon-preventive categories such as access to care, access to doctor, doctor credentials, and member satisfaction.When we tried imputing the 1997 scores and incorporating them in our analysis, our findings were consistentwith this: annuitants, who are probably less concerned about preventive care than other populations, appearedto respond negatively to highU.S. News ratings. When we broke down overallU.S. News ratings into specificpreventive measures, we found annuitants responding positively to cholestrol check, pap test and mammography,but negatively to child immunization and prenatal care.

258 G.Z. Jin, A.T. Sorensen / Journal of Health Economics 25 (2006) 248–275
The critical variables in this study are the public and nonpublic NCQA plan ratings.As mentioned in the previous section, NCQA collects health plan information in manycategories as part of its HEDIS/CAHPS system. In order to summarize the various scores intoa single composite rating, we make use of the ratings published byU.S. News. These ratingswere probably the highest-profile publication of NCQA information, and they are convenientas summary measures of plan quality. However, the rating system differed slightly for1998 versus 1999, and the exact algorithm used to compute the summary scores was notavailable to us. We handle the first of these complications by standardizing the scores(subtracting the mean score and dividing by the standard deviation of scores for each year).For public plans, then, our NCQA score variable is simply the standardizedU.S. Newsscore: it reflects the number of standard deviations above or below the mean score in thatyear. For nonpublic plans, we impute the score variable using the estimated relationshipbetween observedU.S. News ratings and NCQA scores. That is, we regress theU.S. Newsscores for public plans on all 39 NCQA variables (with another 39 dummies to indicate ifthe data for those variables were missing), and use the estimated coefficients to predict the(standardized) scores that the nonpublic plans would have received had they been publishedin U.S. News.8 The regressions were run separately for 1998 and 1999 since we were toldthatU.S. News had changed the relative weights of the NCQA categories in their calculation.Although this imputation procedure is not perfect, we are confident that the resulting scorevariable is internally consistent (i.e., comparable across years and across public versusnonpublic status). The correlation between the imputed NCQA scores and the FEHBPsatisfaction index is 0.43, suggesting that while both measures tend to identify similarplans as being good ones, they are not redundant (i.e., there is information content in bothmeasures).
3. Empirical model and results
3.1. Model
Our objective is to measure individuals’ responsiveness to publicized health plan rat-ings, and to use the resulting estimates to calculate the value of the information. We modelconsumers’ health plan decisions in a traditional discrete choice framework, with expectedplan utilities depending explicitly on the information available. In particular, we supposethat individuals’ perceived payoffs from choosing each plan depend on a set of plan andindividual characteristics,x, a set of information variables (quality signals),z, and an unob-served plan characteristic,w. We will interpretw specifically as a quality signal that isobserved by consumers but not by the econometrician. In the application,x consists ofplan characteristics such as premium, type (fee-for-service or HMO), emergency roomand prescription drug copayments, etc., and interactions with individual characteristicssuch as age, income, and sex. The key information variables (z) in our study are thesatisfaction index (from the FEHBP guidebook) and the NCQA scores (as described inSection2.2).
8 TheR2 for the prediction equation was 0.92 for 1998 and 0.91 for 1999.

G.Z. Jin, A.T. Sorensen / Journal of Health Economics 25 (2006) 248–275 259
We assume that an individual’s indirect utility from choosing a plan is a linear functionof plan characteristics and plan quality, which we denoteq, plus an idiosyncratic error. Ofcourse, plan quality is uncertain at the time of enrollment, so individuali forms expectationsaboutq using quality signals. LettingUijt(Ωijt) denote individuali’s expected utility fromchoosing planj in periodt when the information available about planj is Ωijt, we have
uijt(Ωijt) = xijtβ + Ei[qjt ] + εijt .
We consider two information sets:Ω0ijt = xjt, wijt when plan ratings are not available
to the public, andΩ1ijt = xjt, zjt, wijt when plan ratings get publicized. We also assume
that the conditional expectation function forq is linear, so that:
Ei[qjt|xjt, wijt ] = xjtδ0 + wijtθ0
and
Ei[qjt|xjt, zjt, wijt ] = xjtδ1 + zjtγ1 + wijtθ1.
Expected plan utilities are then given by
uijt(Ω0ijt) = xijt(β + δ0) + wijtθ0 + εijt (1)
and
uijt(Ω1ijt) = xijt(β + δ1) + zjtγ1 + wijtθ1 + εijt . (2)
The above expressions for plan utilities highlight two important difficulties in measuringconsumers’ responsiveness to information. First, since observable information variablesare likely to be correlated with unobserved signals of plan quality, coefficients on thoseinformation variables will typically misrepresent the true impact of the information. In thepresent context, where the z’s are health plan ratings, we are concerned thatγ1 will reflectmore than just the impact of those ratings on consumers’ choices: it will also reflect anycorrelation of plan ratings with unobserved plan quality. In the worst case, the plan ratingsmay simply serve as perfect proxies forw, so that even though they have no informationalvalue they will be estimated to have a positive impact on consumers’ choices. The seconddifficulty can be seen in the comparison of Eqs.(1)and(2): when new information becomesavailable, other factors that were used in forming expectations about plan quality will beweighted differently. In other words, the coefficients on other variables are likely to changewhenz (the new information) is made available to consumers. For example, in the absence ofpublished health plan ratings, consumers may rely on plan premiums as signals of quality. Inthat case, we would expect the estimated coefficient on premium to be different dependingon whether the ratings were available.
The availability of nonpublic information in our data allows us to address these issuesdirectly. To see the first point, let us ignore the second problem for the moment. If publicizingplan ratings does not entail changes in the other coefficients,γ should capture the full valueof information and the only bias inγ arises from the correlation between plan ratingszand unobserved quality signalsw. Our data allow us to use the undisclosed health planratings to directly correct this bias. Because nonpublic plans’ ratings were undisclosed,they have no direct impact on consumers’ choices: i.e., the coefficient on nonpublic plan

260 G.Z. Jin, A.T. Sorensen / Journal of Health Economics 25 (2006) 248–275
scores must be zero in the choice model. Therefore, if we include nonpublic plan scoresin the empirical model, then the estimated coefficient reflects only the correlation of thosescores with unobserved quality. If we also assume that the correlation of plan scores withunobserved plan quality is the same regardless of whether the scores were made public ornot, then the difference between the coefficients for public versus non-public plan scoresidentifies the direct impact of the information.
If publicizing plan ratings leads consumers to reweight other quality signals, the abovelogic must be modified. The change in perceived plan utilities resulting from new informa-tion is obtained by differencing Eqs.(1) and(2):
uijt(Ω1ijt) − uijt(Ω
0ijt) = xijt(δ1 − δ0) + zjtγ1 + wijt(θ1 − θ0). (3)
This expression suggests thatγ1 is not the only parameter of interest: introducing newinformation changes the weights on other quality signals, and this indirect effect should betaken into account in computing the value of the information. For thex variables we canaddress this issue directly, by allowing their coefficients to differ across information regimes(i.e., public versus nonpublic plans); however, sincewijt is unobserved, we cannot directlymeasure changes in its impact on perceived utilities. In what follows, we report resultsfrom estimating the model under the assumption thatδ0 = δ1 andθ0 = θ1, and also considerspecifications in whichδ0 andδ1 are estimated separately. If these assumptions are wrong,our estimate ofγ1 will reflect a combination of the pure impact of the information andchanges in the influences of other quality signals. However, while this suggests a bias inγ1in the technical sense, it is arguably advantageous for calculating the value of information:to the extent possible, we want our calculations to incorporate all the changes in consumers’choices that result from the new information.
The public–nonpublic comparison we propose above is complementary to various empir-ical strategies utilized in the existing literature. When data from multiple time periods areavailable, one approach is to assume that unobserved quality is time-invariant and commonto all individuals (i.e.,wijt = wj). In that case, thewj ’s can be estimated as fixed effects. Thisis a way of controlling for unobserved plan quality, and it is essentially the approach adoptedby Chernew et al. (2004). However, if in fact there are time- or individual-specific qualitysignals observed by consumers but not by econometricians—i.e.,wijt = wj + ηijt—thenthe endogeneity problem is still present to the extent that scorejt is correlated with thespecific quality signalηijt.
Another approach to control for unobserved quality signals is to directly account forindividual specific enrollment history. For example,Beaulieu (2002)estimates plan choice(and the probability of switching) as a function of the number of years an individual hasbeen enrolled in a specific plan. This allows each individual to have better knowledge aboutthe plan she chose before, but still assumes that the unobserved quality signal is orthogonalto observed plan ratings for all the plans she did not choose. Apparently, this approachis complementary to the fixed-effects one: enrollment history controls for individual- andtime-specific knowledge of plan quality, while plan fixed effects control for time-invariantinformation that is common to every individual.
Because our data include multiple years and some nonpublic scores, we are able toaugment the previous approaches with the public–nonpublic comparison outlined above.

G.Z. Jin, A.T. Sorensen / Journal of Health Economics 25 (2006) 248–275 261
Rather than estimate fixed effects, however, we instead consider specifications in whicheach plan’s market share from the previous year is included as a control forwj . Laggedmarket shares essentially absorb the unobserved heterogeneity in the same way fixed effectswould, while still allowing for some movement in unobserved plan quality over time.9
More importantly, the public–nonpublic comparison allows us to assess how effectively theexisting approaches address the problem of unobserved quality signals: if nonpublic ratingsstill appear to have a significant impact after we include a specific control, then that controlmust not fully correct the bias from the unobservables.
3.2. Endogeneity of disclosure decisions
A potential concern with our empirical analysis is that health plans’ disclosure decisionsare endogenous. Participation in the NCQA rating programs is voluntary, so plans choosewhether to report and, conditional on reporting, whether to allow the information to bepublicized. Plans that elect not to report to NCQA apparently do so either because it istoo costly to construct data in compliance with NCQA specifications or because they facelittle market pressure to do so. Also, some plans do not meet minimum size requirementsfor reporting clinical indicators. Some plans capitate most doctors and it is difficult tosynchronize different databases kept in each individual doctor’s office. In the 13 October1997 issue ofU.S. News, the editor wrote “Don’t assume that (an HMO not listed in thecomparison table) is a subpar performer. Many managed-care plans in this fast-changingsector are being absorbed into others or are in the process of restructuring themselves, andyours simply may be too new to have the several years’ worth of data required for listing.Others lack the information-gathering abilities to collect vast quantities of data. And HMOswith minimal competition may feel little pressure to generate numbers if local employersdo not ask for them”.
It is more puzzling why a plan would report its data to NCQA but choose to keep thedata nonpublic. One reason cited by NCQA staff is concerns about heterogeneous auditingpractices. Although NCQA required submitted data to be audited by a third party beginningin 1998, prior to that many HMOs submitted unaudited data. Some plans felt it was unfairfor their audited data to be compared with others’ unaudited data, but still wanted theirnumbers to enter in the calculation of national averages, since the latter may be used inshaping future public policies for the managed care industry.
However, this does not explain why nonpublic reporting still exists after 1998. Economictheory suggests that zero-cost disclosure should be 100% unraveling: as long as consumersassume non-disclosing firms have the worst quality, every firm above the worst quality hasan incentive to disclose, and therefore disclosure and non-disclosure are equally revealingfor the worst ones.10 We suspect the unraveling theory fails in the context of health plansbecause consumers do not necessarily know what the worst quality is. Obviously, if thedata turn out to be worse than consumer beliefs, the plan may choose to hide the data.Another possibility is that plans may not believe NCQA specifications provide an unbiased
9 In what follows we report results from specifications with lagged market shares included as controls; specifi-cations with plan fixed effects yielded qualitatively and quantitatively similar results.10 See, e.g.,Milgrom (1981), Grossman (1981), andJovanovic (1982).

262 G.Z. Jin, A.T. Sorensen / Journal of Health Economics 25 (2006) 248–275
description of HMO quality. For example, some plans are good in dental and vision care,but NCQA measures do not capture this competitive advantage. Reporting in the publicizeddataset may mislead consumers to cherry-pick plans that are only strong in dimensionsreported by NCQA.
Although modeling plans’ disclosure decisions is beyond the scope of this paper, weaddress the issue indirectly by including an indicator for publicly reporting plans as acovariate in the empirical models we estimate below. To the extent that a plan’s reportingstatus is informative about its quality, consumers’ mean response to that information shouldbe captured in the coefficient on this dummy variable.
Given the empirical strategy of the paper—to compare the estimated impacts on consumerdecisions of public versus nonpublic ratings—it is important that there be some overlap inthe distributions of scores for public and nonpublic plans. Implicitly, our analysis asks whatthe market shares of nonpublic plans would have been if their scores had been public. Butwe intuitively expect non-public plans to have lower scores than public plans—since low-scoring plans are precisely the ones with an incentive to withhold the information—andcomparisons of nonpublic plans with public plans would be difficult if the former were ofuniformly lower quality. However, as mentioned above, there are other idiosyncratic reasonswhy plans might elect to be nonpublic, and in fact we find that many nonpublic plans haverelatively high ratings.Fig. 1shows the score distributions for public and nonpublic plans,both for the full sample and for the selected sample. As expected, public plans clearly havehigher average scores, but the overlap in the distributions is still substantial. This overlapsuggests (and our conversations with researchers at NCQA have tended to confirm) thatplans’ reasons for selecting nonpublic status are often somewhat idiosyncratic, and notmerely a function of plan quality.
An additional concern is that the endogeneity of plans’ disclosure decisions may under-mine our assumption that the correlation between NCQA scores and unobserved qualitysignals is the same for public and nonpublic plans. However, we see no reason that endoge-nous selection of public versus nonpublic plans would imply differences in this correlation.Suppose, for example, that plans choose to allow public disclosure if their ratings are betterthan the quality signal observed by consumers. Although this would truncate the distribu-tion of ratings that consumers get to observe, it would not necessarily induce a differencein the correlation between ratings and quality signals for public versus nonpublic plans.
3.3. Estimation and results
We estimate the choice model in Eqs.(1) and(2) assuming the distribution of the errors,εijt is type I extreme value, so that the choice probabilities have the convenient logit form.Our x variables include plan premium (interacted with age, sex, and income), a fee-for-service indicator (also interacted with age, sex, and income), and copays for outpatientvisits, emergency room visits, and prescription drugs (separately for branded and generic).11
Summary statistics for these variables are reported inTable 3. Our information variables,
11 Some additional variables are included in the estimated models to serve as controls, but not reported in thetables in order to save space. These include indicators for type of coverage (self or family), Medicare eligibility,NCQA accreditation status, and dummy variables to indicate whether the values of certain variables were missing.

G.Z. Jin, A.T. Sorensen / Journal of Health Economics 25 (2006) 248–275 263
Fig. 1. Distributions of NCQA scores for public and nonpublic plans.

264 G.Z. Jin, A.T. Sorensen / Journal of Health Economics 25 (2006) 248–275
Table 5Estimates of plan choice model
I II III IV
Premium −0.0316 (0.0001) −0.0290 (0.0003) −0.0015 (0.0001) −0.0100 (0.0004)Premium× female −0.0136 (0.0002) −0.0051 (0.0005) −0.0003 (0.0002) 0.0040 (0.0006)Premium× age −0.0001 (0.0000) −0.0002 (0.0000) 0.0001 (0.0000) 0.0001 (0.0000)Premium× income −0.0010 (0.0001) 0.0004 (0.0002) −0.0018 (0.0001) 0.0008 (0.0002)Switch – −6.6811 (0.0140) – −6.5029 (0.0141)Switch× female – −0.3392 (0.0268) – −0.3372 (0.0270)Switch× age – −0.0495 (0.0011) – −0.0455 (0.0011)Switch× income – 0.1360 (0.0102) – 0.1284 (0.0103)Lag market share – – 6.1489 (0.0113) 4.8167 (0.0351)Satisfaction rate× FFS 0.1131 (0.0004) 0.0829 (0.0012) 0.0193 (0.0004) 0.0146 (0.0004)Satisfaction rate× HMO 0.0074 (0.0006) −0.0003 (0.0015) −0.0076 (0.0006) −0.0092 (0.0016)Coverage 0.0434 (0.0009) 0.0786 (0.0025) 0.0006 (0.0008) 0.0518 (0.0024)Coverage× 1999 −0.5171 (0.0050) −0.2053 (0.0160) 0.0292 (0.0060) 0.1593 (0.0180)Public 0.1259 (0.0153) 0.0537 (0.0315)−0.0487 (0.0147) −0.0367 (0.0318)NCQA score× public 0.3781 (0.0081) 0.4152 (0.0173) 0.2900 (0.0080) 0.3747 (0.0175)NCQA score× nonpublic 0.0951 (0.0062) 0.1331 (0.0132) 0.1082 (0.0061) 0.0828 (0.0135)
N 153,405 153,405 153,405 153,405Average log-likelihood −7.1596 −0.8331 −5.9692 −0.7664Pseudo-R2 0.1805 0.9046 0.3168 0.9123
Standard errors in parentheses. Premium is biweekly gross premium; “Switch” is an indicator equal to zero for theprevious year’s plan, and equal to one for all others; lag market share is the plan’s market share in the individual’scounty in the previous year. “Coverage” refers to the FEHBP satisfaction rate for the plan’s coverage of services;we estimate a separate coefficient on this variable for 1999 because the survey question was altered between 1998and 1999. Several additional controls were included in the estimation, but to save space are not reported here. Atable listing the full set of coefficients is available from the authors.
z, are the satisfaction index from the FEHBP guidebook and the NCQA plan score.12 Asdescribed in Section2.2, the fraction of individuals switching plans in a given year istypically quite low. To accommodate this feature of the data, we include an additionalcovariate to represent switching costs. In particular, we define an indicator switchijt = 1 ifindividual i did not choose planj in periodt − 1. In other words, in any given period, thisindicator is turned on for every plan except the one chosen last period.
Table 5reports maximum likelihood estimates for four specifications of the model.13
Each of the four columns in the table represents different sets of controls, to facilitate com-parisons of the corresponding estimates of plan ratings’ impact. The first column controlsfor neither switching costs nor lagged market shares; essentially, it estimates the impact ofplan ratings purely from the cross-sectional patterns in market shares. The second and third
12 The NCQA scores apply only to HMO plans. For FFS plans, we set the scores to zero and include an FFSdummy to control for the “missing” scores.13 The large size of our sample makes the model computationally burdensome to estimate. To reduce the burden,
we randomly sampled non-new and non-switching enrollees for inclusion in the estimation: the sample usedfor estimation includes all new enrollees, all enrollees who switch plans, and a random 5% sample of all otherenrollees. The observations are then weighted so that the estimated coefficients accurately reflect the effects thatwould be obtained from the full sample.

G.Z. Jin, A.T. Sorensen / Journal of Health Economics 25 (2006) 248–275 265
columns control for switching costs and lagged market shares (respectively), and the fourthcolumn—our preferred specification— controls for both.
The estimated coefficients on plan characteristics are mostly consistent with basic intu-ition about health plan choice.14 The coefficient on premium is negative and statisticallysignificant, and it differs meaningfully depending on individual characteristics: e.g., pricesensitivity decreases with income. The large negative coefficient on the switch indicatorreflects the persistence of health plan enrollment decisions: people very rarely switch awayfrom their chosen plan. Females are less likely to switch plans than males, and switching ismore likely among younger annuitants with higher incomes.15 The importance of allowingfor this inertia is evident from the dramatic improvement in fit when the switch indicatorsare included (the pseudo-R2 increases from 0.18 to over 0.90). The coefficients on boththe switch variables and the lagged market shares reflect a general persistence in plans’market shares, which could result from reluctance to switch plans at the individual level,or from small net changes in enrollment shares in spite of high turnover at the individuallevel. Including the switch variables in the model allows the data to distinguish these twoexplanations (in favor of the former), and also yields more reliable estimates of the premiumcoefficients.
In general, the coefficients on the information variables are sensible, indicating thatannuitants prefer plans with higher published ratings. However, the important pattern shownin the tables is that the magnitudes of the coefficients shrink when switching costs andlagged market shares are included as controls. This is especially true for the satisfactionrate. The pattern is suggestive of the central concern this paper addresses: that reported planratings are correlated with unobserved plan quality. Note that if the impact of plan ratingsis estimated purely from the cross-section (column I), the estimate is quite large with a verysmall standard error. However, it is clear fromTable 5that much of this estimated effectmust be spurious: the coefficient on nonpublic NCQA scores is also large and statisticallysignificant, which would imply that individuals were affected by information they neverreceived. Our ability to observe “responsiveness” to ratings that were never disclosed allowsus to assess the effectiveness of various controls at mitigating the bias. The estimates reportedin column IV of Table 5suggest that switch costs and lagged market shares help controlfor unobserved plan quality, as the coefficient on nonpublic scores is closer to zero. Thisis somewhat encouraging, since in general it is easier to obtain panel data and control forplan effects than it is to obtain nonpublic data. However, it appears that neither control issufficient to entirely resolve the problematic correlation between published information andunobserved quality.
The positive difference in the estimated coefficients for public versus nonpublic planratings reveals clearly that published ratings indeed contain information that is acted upon.
14 Several plan characteristics are included in the model as controls but omitted from the table to save space.These include HMO age, model type, an indicator for whether the HMO belongs to a national managed care chain,the number of hospitals under contract with the HMO, and the number of physicians under contract with the HMO.15 Note that although it is tempting to convert the switch coefficient to dollars (using the premium coefficient)
and interpret it as a literal switching cost, this would ignore other plausible explanations for the observed inertia.For instance, the negative coefficient could reflect persistence in preferences: consumers tend to stay in the sameplan not because it is costly to switch, but because their idiosyncratic preferences for plans are highly stable overtime (e.g., theεijt’s could be serially correlated).

266 G.Z. Jin, A.T. Sorensen / Journal of Health Economics 25 (2006) 248–275
Table 6Medicare beneficiaries and new enrollees
Medicare Non-Medicare New enrollees Non-new enrollees
Premium −0.0152 (0.0006) −0.0055 (0.0006) −0.0048 (0.0006) −0.0158 (0.0006)Switch −6.5554 (0.0184) −6.3284 (0.0286) – −6.5330 (0.0154)Lag market share 4.4888 (0.0580) 5.0153 (0.0443) 5.5374 (0.0462) 3.8004 (0.0572)Satisfaction rate× FFS 0.0240 (0.0022) 0.0092 (0.0017) 0.0037 (0.0019) 0.0325 (0.0021)Satisfaction rate× HMO −0.0143 (0.0028) −0.0071 (0.0019) −0.0149 (0.0020) 0.0004 (0.0025)Coverage 0.0712 (0.0040) 0.0411 (0.0031) 0.0220 (0.0032) 0.0924 (0.0036)Coverage× 1999 0.1117 (0.0297) 0.1803 (0.0227) 0.2707 (0.0244) 0.0176 (0.0277)Public −0.1182 (0.0583) 0.0007 (0.0379) −0.0389 (0.0415) −0.0841 (0.0504)NCQA score× public 0.3436 (0.0310) 0.3823 (0.0212) 0.4459 (0.0237) 0.1995 (0.0282)NCQA score× nonpublic 0.0871 (0.0240) 0.0794 (0.0163) 0.0137 (0.0169) 0.2670 (0.0225)
N 74,156 79,259 31,756 121,649Average log-likelihood −0.6139 −0.9054 −1.9333 −0.4486Pseudo-R2 0.9495 0.8362 0.2397 0.9567
New enrollees are annuitants whose circumstances required choosing a new health plan in the given year—e.g.,because they moved to a new county or because their previous plan was dropped from the FEHBP. All variabledefinitions are the same as inTable 5. Interactions of annuitant characteristics (age, income, sex) were includedin the estimation, but the coefficients are omitted to save space. The reported coefficients on premium and switchreflect effects for males with average age and income.
If these coefficients were equal, we would be forced to conclude that published scorescontained no new information—i.e., they simply mirrored information that was alreadyknown. However, the estimated difference is statistically and economically significant.If interpreted literally as the causal effect of the ratings on perceived plan qualities, thedifference in the public versus nonpublic coefficients (0.292 in the preferred specificationin column IV) is large enough to suggest the published scores have a meaningful impact onchoice: if a plan’s score increased by one standard deviation, this would increase a typicalindividual’s likelihood of choosing that plan by 2.63 percentage points. To put this in context,an equivalent increase in the likelihood of selection would result from a US$ 759 decrease inthe annual gross premium (which would mean US$ 220 less per year out of the annuitant’spocket). The quantitative estimates of individuals’ responsiveness to information will figureprominently in the analysis of Section3.4, where we use the results to compute the dollarvalue of the information.
Table 6presents estimates of the choice model based on two divisions of the sample. Thefirst two columns compare the results for Medicare-eligible versus non-Medicare-eligibleindividuals. As mentioned above, Medicare-eligible annuitants purchase FEHBP plans assupplemental coverage, and therefore may respond differently to published information thanindividuals for whom the FEHBP plan is the primary insurer. However, the results indicatethat choice behavior is quite similar between the two groups. Medicare-eligible annuitantsare more price-sensitive and less responsive to NCQA ratings, but the differences are small.This is encouraging, since it suggests that our findings are not peculiar to the Medicaresubpopulation.
Perhaps the most informative comparison afforded by the data is that of “old” versus“new” enrollees. As is evident from the estimated coefficients on the switch indicator,
G.Z. Jin, A.T. Sorensen / Journal of Health Economics 25 (2006) 248–275 267
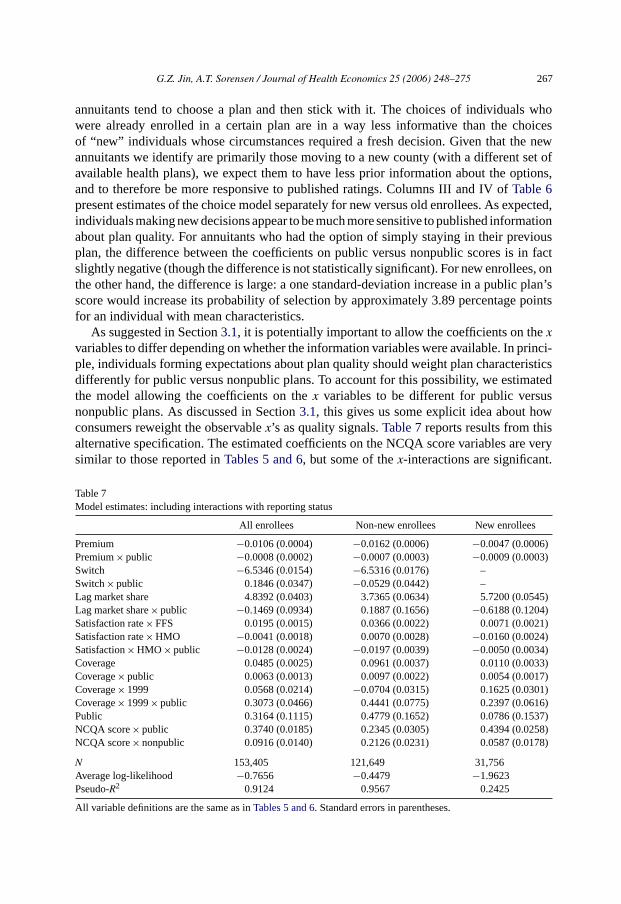
annuitants tend to choose a plan and then stick with it. The choices of individuals whowere already enrolled in a certain plan are in a way less informative than the choicesof “new” individuals whose circumstances required a fresh decision. Given that the newannuitants we identify are primarily those moving to a new county (with a different set ofavailable health plans), we expect them to have less prior information about the options,and to therefore be more responsive to published ratings. Columns III and IV ofTable 6present estimates of the choice model separately for new versus old enrollees. As expected,individuals making new decisions appear to be much more sensitive to published informationabout plan quality. For annuitants who had the option of simply staying in their previousplan, the difference between the coefficients on public versus nonpublic scores is in factslightly negative (though the difference is not statistically significant). For new enrollees, onthe other hand, the difference is large: a one standard-deviation increase in a public plan’sscore would increase its probability of selection by approximately 3.89 percentage pointsfor an individual with mean characteristics.
As suggested in Section3.1, it is potentially important to allow the coefficients on thexvariables to differ depending on whether the information variables were available. In princi-ple, individuals forming expectations about plan quality should weight plan characteristicsdifferently for public versus nonpublic plans. To account for this possibility, we estimatedthe model allowing the coefficients on thex variables to be different for public versusnonpublic plans. As discussed in Section3.1, this gives us some explicit idea about howconsumers reweight the observablex’s as quality signals.Table 7reports results from thisalternative specification. The estimated coefficients on the NCQA score variables are verysimilar to those reported inTables 5 and 6, but some of thex-interactions are significant.
Table 7Model estimates: including interactions with reporting status
All enrollees Non-new enrollees New enrollees
Premium −0.0106 (0.0004) −0.0162 (0.0006) −0.0047 (0.0006)Premium× public −0.0008 (0.0002) −0.0007 (0.0003) −0.0009 (0.0003)Switch −6.5346 (0.0154) −6.5316 (0.0176) –Switch× public 0.1846 (0.0347) −0.0529 (0.0442) –Lag market share 4.8392 (0.0403) 3.7365 (0.0634) 5.7200 (0.0545)Lag market share× public −0.1469 (0.0934) 0.1887 (0.1656) −0.6188 (0.1204)Satisfaction rate× FFS 0.0195 (0.0015) 0.0366 (0.0022) 0.0071 (0.0021)Satisfaction rate× HMO −0.0041 (0.0018) 0.0070 (0.0028) −0.0160 (0.0024)Satisfaction× HMO × public −0.0128 (0.0024) −0.0197 (0.0039) −0.0050 (0.0034)Coverage 0.0485 (0.0025) 0.0961 (0.0037) 0.0110 (0.0033)Coverage× public 0.0063 (0.0013) 0.0097 (0.0022) 0.0054 (0.0017)Coverage× 1999 0.0568 (0.0214) −0.0704 (0.0315) 0.1625 (0.0301)Coverage× 1999× public 0.3073 (0.0466) 0.4441 (0.0775) 0.2397 (0.0616)Public 0.3164 (0.1115) 0.4779 (0.1652) 0.0786 (0.1537)NCQA score× public 0.3740 (0.0185) 0.2345 (0.0305) 0.4394 (0.0258)NCQA score× nonpublic 0.0916 (0.0140) 0.2126 (0.0231) 0.0587 (0.0178)
N 153,405 121,649 31,756Average log-likelihood −0.7656 −0.4479 −1.9623Pseudo-R2 0.9124 0.9567 0.2425
All variable definitions are the same as inTables 5 and 6. Standard errors in parentheses.

268 G.Z. Jin, A.T. Sorensen / Journal of Health Economics 25 (2006) 248–275
One notable difference is that individuals appear to be more price-sensitive for public plans,which is consistent with the idea that premiums could be used as signals of quality in theabsence of other direct information about quality. For nonpublic plans, higher premiumsmight be taken to imply higher quality, which would tend to make demand appear price-inelastic. Individuals also appear to be less responsive to lagged market shares for publicplans, and less averse to switching to public plans, which again could be taken to implythat plan information from alternative channels is relied on more heavily when publicizedratings are unavailable. However, the coefficients on the coverage× public interactions arean exception to this pattern: individuals appear to be more responsive to coverage ratingsfor public plans than for nonpublic plans.
Collectively, the results inTables 5–7tell a plausible story about consumer choicebehavior and responsiveness to information, and the pattern of coefficients on the pub-lic and nonpublic NCQA scores is fairly robust. Several additional controls were includedin the estimation but omitted from the tables to save space; in general the coefficients onthese controls are consistent with intuition, but a few of the coefficients have unexpectedsigns. For example, the coefficient on a plan’s copay rate for branded drugs is positive,16
which could mean that higher copays for branded drugs are correlated with more generousformularies (about which our data have no information). Because these few anomalouscoefficients suggested we may have some important omitted variables, we re-estimated themodels to see if omitting different sets of plan characteristics would have an appreciableimpact on our main results. The results are qualitatively and quantitatively similar, thoughthe coefficients on the NCQA score variables change slightly when copay variables and/orcontracting variables are omitted.17 We prefer the reported specification because copays areclearly printed in the FEHBP brochures and contracting variables were found to be impor-tant in numerous previous studies; including these variables as controls should capture (tothe extent our data allow) the other information that enrollees observe beyond the NCQAscores.
One potential concern with our empirical results is that premiums may be endogenousin the sense of being correlated with unobserved plan quality. This is a classic problemwith price coefficients in discrete choice models, and generally tends to bias the estimatestoward finding relatively inelastic demand. This is very important in our case, since inorder to calculate a meaningful estimate of the value of information, we need to use theestimated price coefficient to convert numbers to dollars. If our estimate of individuals’price sensitivity is too close to zero (too inelastic), when we divide by it we will get anupward-biased estimate of the dollar value of information.
The magnitudes of the premium coefficients indeed suggest that annuitants are not verysensitive to price. For example, for a plan with a market share of 10%, a US$ 300 increase inthe gross annual premium would reduce its probability of selection by only 1.04 percentagepoints for a typical annuitant (based on the estimates in column IV ofTable 5). This relativeunresponsiveness to price is due in part to employer cost-sharing—the US$ 300 increase
16 We also control for the copay of generic drugs. Its coefficient is negative, as expected.17 The coefficient on the public NCQA scores increases slightly, and the coefficient on the non-public NCQA
scores tends to decrease slightly when omitting observable plan characteristics. Details of these sensitivity tests(along with tables listing the full sets of estimated coefficients) are available from the authors.

G.Z. Jin, A.T. Sorensen / Journal of Health Economics 25 (2006) 248–275 269
in gross premium requires only US$ 100 in additional payments by the enrollee—but wenote that it may reflect the endogeneity problem described above. Nevertheless, controllingfor lagged market share should alleviate much of the problem: any bias that remains mustreflect correlation between premiums and period-specific quality shocks. Also, comparisonswith findings from other studies are reassuring.Wedig and Tai-Seale (2002)estimate pricesensitivities very close to ours (based on the specifications in column IV ofTable 5or columnI of Table 7), and the estimates ofChernew et al. (2004)are actually smaller (implying evenless price sensitivity than what we find).
3.4. Calculating the value of information
The estimates reported inTables 5–7can be used to derive the value to consumers ofthe NCQA scores. Changing notation slightly from the previous section, letui(j) denoteindividual i’s indirect utility from planj. If ai is the plan that individuali would chooseif the information is available, andbi the plan that would be chosen in the absence of theinformation, then the dollar value of the information to individuali is [ui(ai) − ui(bi)]/αi,whereαi is the marginal utility of a dollar. Under this definition, information is valueless(ex post) if it does not change the individual’s choice—i.e., ifai = bi. Note that in principleone could allow the utility function itself to change depending on the information available,in which case the information could have value even ifai = bi. For example, people couldderive utility from being told that their chosen plan is highly rated even if that informationwould not have affected their choice. In what follows, we instead choose to hold the utilityfunction fixed, and calculate the ex post value of information by determining (a) whetherthe information affected the individual’s choice and (b) if so, what the resulting gain inutility was.
To generate numerical estimates of the value of information, we consider two coun-terfactual experiments. First, we ask how utility would have been affected if the publicNCQA scores had been nonpublic—i.e., we compare the actual information regime to onewith no publicized information at all. Second, we ask how utility would have changed ifthe nonpublic NCQA scores had been publicized. In each case, we estimate the value ofinformation for each individual as
vi = ui(ai) − ui(bi)
αi
,
whereui is the estimated utility function from the “informed” regime,αi is the estimatedmarginal utility of a dollar for individuali,18andai(bi) is the model’s prediction of individuali’s choice with (without) information. To be specific, we obtain estimates from the followingsimulation procedure: (1) calculate plan utilities for each individual under each regime (withversus without information), using random draws from the extreme value distribution forthe ε’s; (2) obtainai(bi) by determining which plan yields the maximal predicted utilityin the informed (uninformed) model; (3) calculate the difference in utilities from ˆai and
18 This varies across individuals because the coefficient on premium in the choice model depends on the individ-ual’s age, sex, and income.

270 G.Z. Jin, A.T. Sorensen / Journal of Health Economics 25 (2006) 248–275
Table 8Value of information estimates
Specification Counterfactual
Public scores withheld Nonpublic scores publicized
Old/new annuitants pooled (Table 7, column I)Number of choices changed 3539 2078Percent of choices changed 0.69 0.41
Average value of informationChoices changed (US$) 160.37 218.46Overall (US$) 1.11 0.88
Old and new separately (Table 7, columns II and III)Old
Number of choices changed 2240 96Percent of choices changed 0.47 0.02
Average value of informationChoices changed (US$) 105.45 10.50Overall (US$) 0.49 0.002
NewNumber of choices changed 2552 1259Percent of choices changed 8.04 3.97
Average value of informationChoices changed (US$) 588.67 644.36Overall (US$) 47.31 25.55
bi using the utility function from the informed regime; (4) divide that difference byαi toconvert the number to dollars per year.19
Table 8shows average estimates from 100 replications of the above simulation procedure.Based on the specification in column I ofTable 7, we estimate that the choices of 3539individuals were directly affected by the publicized NCQA scores, in the sense that theywould have chosen a different plan if they had not had the information. However, this is a verysmall percentage of the total: 99.3% of the enrollment choices in our sample would have beenthe same with or without the information. This is primarily due to the considerable inertiain health plan enrollment decisions: for the vast majority of individuals, the switching costsswamp any effect the information might have. For those individuals whose decisions werematerially affected by the ratings, the value of the information is estimated to be substantial:US$ 160 per person per year. Averaged over all individuals in the sample, the value ofthe published scores is only US$ 1.11 per person. Interestingly, the second column of thetable indicates that publicizing the nonpublic scores (the second counterfactual experiment)would have had a slightly lower informational value, presumably because nonpublic planstend to have lower market shares than public plans and there are fewer nonpublic plansoverall.
19 In this case,αi is obtained as (coefficient on premium fori) × 26× 0.29, since payments are biweekly and theannuitants’ share of the cost is 29%.

G.Z. Jin, A.T. Sorensen / Journal of Health Economics 25 (2006) 248–275 271
The relatively small fraction of decisions for which the ratings are pivotal suggestsseparating the estimates for new versus old individuals: the choices of annuitants whosecircumstances necessitate a new health plan decision are presumably more sensitive to theratings, and we should therefore expect the information to be more valuable to them. Thesecond panel ofTable 8presents calculated values based on separately estimated modelsfor old and new annuitants. The value of publicized NCQA scores is clearly smaller forindividuals who have the option of maintaining enrollment in their previous plan: less thanhalf of one percent of these individuals are estimated to have made different choices than theywould have in the absence of the publicized information. In contrast, the information appearsto be much more influential for individuals making new choices: over 8% of these annuitantswere affected by the publicized ratings, and the average value of the information among thosewhose choices “changed” was US$ 588.67 (and US$ 47.31 among all new enrollees). Sincenew enrollees comprise roughly 6.2% of the sample, our estimate of the overall averagevalue of the information for the entire sample is (47.31)(0.062) + (0.49)(0.938) = US$ 3.39per person per year.20
These estimates can be used to make a rough calculation of the overall gain in consumerwelfare derived from the information provided by NCQA. Multiplied by the 1.7 millionindividuals in the full sample who chose an FEHBP plan, the US$ 3.39 per person implies aUS$ 5.76 million overall benefit per year to annuitants of the U.S. government. This numberis likely to overstate the true benefit, however, since plans with publicized ratings are lessprevalent in general than in the specific subsample we selected for the analysis. However,even if there were no benefits whatsoever to individuals outside the selected sample, theestimated overall benefit to those 250,000 individuals who are in the sample would be US$0.85 million per year.
Dynamic considerations also suggest these numbers may understate the true value ofinformation. We calculate the expected dollar value for a given year, but the effects of infor-mation are not confined to the current period: costs of bad choices continue over each addi-tional period in which the incorrect choice persists. Also, switching costs are incurred whenan individual ultimately switches out of a bad choice. This suggests that the present value ofinformation should incorporate not just the benefits of correct choices in the current year, butalso the implicit benefits in future years of avoiding the costs associated with bad choices.
4. Discussion and conclusions
Our empirical results clearly indicate that publicized ratings have a direct impact onindividuals’ choices of health plans—a finding that is consistent with other recent studiesof information and health plan choice. More importantly, our ability to compare the effects ofpublicized and non-publicized plan ratings allows us to assess the significance of a potentialsource of bias: if publicized ratings largely reflect information that is already known to
20 In order to put a confidence interval around this number, we performed a parametric bootstrap procedurein which we resampled the parameter vector from the distribution implied by our estimates, and recalculated(using the simulation method described above) the value of information number for each resampled value of theparameter. Using 30 repetitions we get a 95% confidence interval of [US$ 3.14, US$ 3.64].

272 G.Z. Jin, A.T. Sorensen / Journal of Health Economics 25 (2006) 248–275
consumers (but not econometricians)—that is, if ratings are correlated with unobservedplan quality—then naive estimators will overstate the actual impact of the information.Not surprisingly, this problem is most severe when the effect of information variables isestimated from a simple cross-section: in that case, even information that was unavailableto consumers appears to have had a substantial impact.
We suspect nonpublic data will rarely be accessible to researchers, so comparisons likethe ones made here will not typically be feasible. Nevertheless, our findings about the effec-tiveness of various control methods are somewhat encouraging. In particular, using paneldata and incorporating plan fixed effects or lagged market shares appears to be helpful: in ourapplication, including lagged market shares and controlling for switching costs eliminatesome (but not all) of the bias.
Our estimates imply the average dollar value of the publicized plan information is modest(US$ 3.39 per person per year when averaged over all individuals in our sample), but thevalue is much more substantial for the small fraction of individuals whose decisions areaffected by the information. In any case, even this seemingly modest estimate impliesbenefits that far outweigh the costs of acquiring and distributing the information. If the US$3.39 per household is crudely extrapolated to every U.S. household enrolled in a healthplan, we would arrive at a total benefit easily exceeding US$ 200 million per year. Thoughsuch a number is obviously speculative, it seems clear that the overall benefits to consumersfar outweigh the costs. NCQA’s annual operating expenses were roughly US$ 20 millionfor the period we studied, and only a fraction of those expenses were related to the HEDISand CAHPS programs.
Note also that the benefits we have calculated are thedirect benefits to consumers; wehave made no attempt to estimate the indirect benefits that may accrue from health plans’increased incentives to provide quality. If active publication of health plan quality reportscauses plans to improve their services and obtain better health outcomes, the consequentbenefits to consumers could conceivably swamp the benefits we’ve estimated here. Ana-lyzing health plans’ responses to the publication of information is a difficult but importantissue to explore.21
Finally, our results suggest open questions about the format in which information isdelivered to consumers. Would the impact of the publicized plan ratings be greater if theratings were reported differently? How much more influential is the information if it isdelivered directly to consumers in a brochure instead of indirectly via news publications orthe Internet? Also, for which categories of care does information about plan quality appearto be highly valued? Our findings confirm that quality information is valued by consumersin a general sense, leaving these (and other) questions about the nuances of publicizingquality ratings for future research.
Acknowledgement
Special thanks to Sarah Shih, Sarah Scholle, Greg Pawlson and James Bost at NCQAfor providing assistance with the quality information reported to NCQA; to Bill Anderson,
21 Jin (2005)is one example of a paper that focuses on supply-side responses to the provision of information.

G.Z. Jin, A.T. Sorensen / Journal of Health Economics 25 (2006) 248–275 273
James Quayle, Agnes Kalland, Ralph Pierce, Ron Gresch, Leroy McKnight, and EbbieBlock in OPM for providing us individual records of FEHBP beneficiaries; and to theUniversity of Maryland for financing the data cost. We are grateful to the editor and twoanonymous referees for several helpful suggestions. Participants at the 2004 FTC Confer-ence on Health Care also provided useful comments. Any errors are ours.
Appendix A. Counties in selected sample
County # annuitants
Alameda, CA 10479Albany, NY 1936Allegheny, PA 8093Amador, CA 318Ashtabula, OH 256Beaver, PA 518Boulder, CO 1652Bronx, NY 4046Butler, OH 613Butler, PA 817Butte, CA 1283Calaveras, CA 346Cape May, NJ 943Cattaraugus, NY 227Chautauqua, NY 362Clark, NV 7879Cook, IL 19084Cowlitz, WA 352Cumberland, NJ 282Cumberland, PA 4214Custer, CO 29Denver, CO 4875El Paso, CO 4319Essex, NY 176Fremont, CO 467Genesee, NY 270Gloucester, NJ 1659Graham, AZ 166Greene, NY 201Hamilton, OH 4708Highland, OH 262Jefferson, CO 5089Johnston, NC 392Kings, CA 369Kings, NY 7282Lawrence, PA 300Lewis, WA 455Los Angeles, CA 21741Louisa, VA 258Madera, CA 403Madison, NY 282

274 G.Z. Jin, A.T. Sorensen / Journal of Health Economics 25 (2006) 248–275
Appendix A (Continued )
County # annuitants
Maricopa, AZ 15087Marin, CA 1495Merced, CA 681Montgomery, NY 301Nash, NC 305Nassau, NY 5480Nevada, CA 755New York, NY 3776Nye, NV 427Orange, CA 7051Orange, NY 1762Parker, TX 472Putnam, NY 264Queens, NY 8471Rensselaer, NY 1093Riverside, CA 5413Robeson, NC 369Rockland, NY 774Sacramento, CA 14512San Bernardino, CA 6842San Diego, CA 18188San Francisco, CA 5147San Mateo, CA 3943Santa Clara, CA 4629Santa Cruz, CA 676Saratoga, NY 916Schenectady, NY 1052Schoharie, NY 107Sonoma, CA 2704Stanislaus, CA 1374Suffolk, NY 5551Sullivan, NY 296Teller, CO 149Tulare, CA 726Tuolumne, CA 434Ventura, CA 5138Walworth, WI 195Warren, NY 213Warren, OH 404Washington, NY 179Washington, PA 703Wayne, MI 6442Westchester, NY 3102Wyoming, NY 119Yamhill, OR 412

G.Z. Jin, A.T. Sorensen / Journal of Health Economics 25 (2006) 248–275 275
References
Beaulieu, N.D., 2002. Quality information and consumer health plan choices. Journal of Health Economics 21(1), 43–63.
Chernew, M., Gowrisankaran, G., Scanlon, D.P., 2004. Learning and the value of information: the case of healthplan report cards. NBER working paper #8589.
Grossman, S., 1981. The informational role of warranties and private disclosure about product quality. Journal ofLaw and Economics 24, 461–489.
Jin, G.Z., 2005. Competition and disclosure incentives: an empirical study of HMOs. RAND Journal of Economics36 (1), 93–112.
Jovanovic, B., 1982. Truthful disclosure of information. Bell Journal of Economics 13, 36–44.Milgrom, P., 1981. Good news and bad news: representation theorems and applications. Bell Journal of Economics,
380–391.Scanlon, D.P., Chernew, M.E., McLaughlin, C.G., Solon, G., 2002. The impact of health plan report cards on
managed care enrollment. Journal of Health Economics 21 (1), 19–41.Sorensen, A., 2004. Social learning and health plan choice. Stanford University working paper.Wedig, G.J., Tai-Seale, M., 2002. The effect of report cards on consumer choice in the health insurance market.
Journal of Health Economics 21 (6), 1031–1048.