information and communications...
TRANSCRIPT

FEATURED SECTOR→
Information and Communications Technology
The New Zealand Sectors Report 2013

© Crown Copyright 2013
The material contained in this report is subject to Crown copyright protection unless otherwise indicated. The Crown copyright protected material may be reproduced free of charge in any format or media without requiring specific permission. This is subject to the material being reproduced accurately and not being used in a derogatory manner or in a misleading context. Where the material is being published or issued to others, the source and copyright status should be acknowledged. The permission to reproduce Crown copyright protected material does not extend to any material in this report that is identified as being the copyright of a third party. Authorisation to reproduce such material should be obtained from the copyright holders.
ISSN 2324-5069 (Print)
ISSN 2324-5077 (Online)
July 2013
MBIE develops and delivers policy, services, advice and regulation to support economic growth and the prosperity and wellbeing of New Zealanders.
MBIE combines the former Ministries of Economic Development, Science + Innovation, and the Departments of Labour and Building and Housing.
3
New Zealand Sectors Report 2013
The New Zealand Sectors Report consists of the Main Report
covering all sectors in the economy and six additional, separate,
reports providing an in-depth analysis of six individual sectors. The
seven reports are:
1 The New Zealand Sectors Report 2013: Main Report
Featured Sector Reports:
2 Information and communications technology (ICT)
(this report)
3 High technology manufacturing
4 Construction
5 Petroleum and minerals
6 Tourism
7 Knowledge intensive services

4
occupations across the whole economy in 2012, from the financial
and insurance sector to manufacturing and agriculture. This is an
increase of 11,184 workers since 2003.
Many of the initiatives the Government is implementing through its
Business Growth Agenda are targeted towards the future growth of
this sector – such as encouraging business innovation through
Callaghan Innovation, rolling out Ultra-Fast Broadband fibre to 75 per
cent of New Zealand households, and increasing access to capital
for small, high-growth businesses through the New Zealand Venture
Investment Fund.
One of the main challenges facing the sector is the international
shortage of highly skilled IT professionals. Around half of computer
system design firms report moderate or severe difficulty in recruiting
managers and professionals, and more than half report moderate or
severe difficulty in recruiting technicians and associated
professionals. The government is working alongside industry to
encourage more students to train as IT professionals.
For New Zealand to grow incomes and jobs, we need all sectors of
our economy to operate successfully. The information in this report will
help investors, business and policy makers to remove constraints so
we can further develop New Zealand’s high performing ICT sector.
Hon Steven Joyce MINISTER FOR ECONOMIC DEVELOPMENT MINISTER FOR SCIENCE AND INNOVATION MINISTER FOR TERTIARY EDUCATION, SKILLS AND EMPLOYMENT ASSOCIATE MINISTER OF FINANCE
I am pleased to present this report on the fast-growing,
high-achieving ICT sector and its impact on jobs, skills,
innovation and growth.
New Zealand’s traditional economy, exports and markets are
changing, and the pace of change is accelerating.
Our traditional export sectors, such as food and beverage, forestry
and tourism, remain important components of the economy.
Increasingly we are also seeing growth in emerging export sectors
such as information technology (IT) services (averaging 11 per cent
per annum since 2002), high-technology manufacturing and
processed foods.
IT services in particular are generating significant innovation,
attracting investment in established firms and start-ups, and creating
wealth and high-skilled employment opportunities for New
Zealanders.
The report focuses mainly on the IT services sector formally called
‘computer system design and related services’. The number of firms
in computer system design has grown by more than 3,300 since 2002.
The sector is investing strongly in research and development - up
18.9 per cent since 2011. Exports of computer and information
services have increased by 85 per cent since 2006 with Australia and
North America being key markets. Wages and salaries in computer
system design are twice the New Zealand average and are growing
faster than the average.
Digital technologies and automation are also driving significant
change across the whole economy. Traditional exports are
increasingly enabled by digital technology or have a software
component. A total of 62,252 workers were employed in ICT related
Minister’s foreword
5

agree with Statistics New Zealand data due to differences in the
group of exported products being allocated to the relevant sector.
Use of the term ‘firm’
The term ‘firm’ is used generically. It includes all relevant entities,
some of which are not firms at all, such as those in the charities,
government, education and health sectors.
Example firms
This report provides examples of firms which are believed to belong to
the sector. The example firms provide a partial answer to a key
question on the composition of a sector: which firms are in it?
Firms are classified by Statistics New Zealand as being part of an
industry sector according to their predominant activity. This is
explained fully on the Statistics New Zealand website. The
classification of each firm to a sector using the Australian and New
Zealand Standard Industrial Classification (ANZSIC) system is
confidential to Statistics New Zealand.
Because of the confidentiality rules, MBIE has used other publicly
available sources to determine which firms are likely to belong to a
sector. These sources may be inaccurate or incomplete.
Quotes and interviews
A limited number of interviews with sector leaders were carried out in
the preparation of this report. Anonymous quotes from these
interviews that illustrate key themes have been included. The
opinions expressed are those of the industry participants. Additional
quotes from public sources have also been used.
A full explanation of the data sources and limitations is provided in
the Appendix.
Defining sectors
A sector is an area of economic activity in which businesses or other
organisations (e.g. government or voluntary organisations) share a
similar market or produce a similar product or service. Examples are
retailing (businesses that sell products directly to consumers) and
telecommunications (provision of communications services using
wired or wireless infrastructure).
This report uses data grouped into sectors using the Australian and
New Zealand Industrial Classification codes (ANZSIC codes). A
business or other type of organisation is classified to an ANZSIC code
based on its predominant activity. The term ‘sector’ is often used
interchangeably with the term ‘industry’.
Sources
The numbers in this report come from multiple sources. Data
sourced from Statistics New Zealand is the latest that was available
as at mid-December 2012. Some of this data is provisional and may
change.
The data used covers different time periods for different metrics. For
example, goods exports is for the year ended June 2012, while
labour productivity is for the year ended March 2010.
Customised data for ICT
ICT is a cross-cutting sector combining several ANZSIC codes.
Customised data has been provided by Statistics New Zealand for
this report.
Export data
Some export data for cross-cutting sectors uses international sources
in order to provide a longer time series. These sources may not
Key terms and data limitations
6

Report objective
7
The New Zealand Sectors Report Series is a set of seven publications that
provides a factual source of information in an accessible format on the key sectors that make up the New Zealand economy. New Zealand needs to encourage all industry sectors to operate at their peak potential to meet the goals of our Business Growth Agenda. This report provides information on New Zealand’s ICT sector, with a special focus on IT services. The report does not intend to draw policy conclusions. Its aim is to provide a
comprehensive report card on the state of New Zealand’s ICT Sector for business people, exporters, policy makers, media commentators, economists, academics, students and anyone with an interest in New Zealand’s economic development. The Ministry of Business, Innovation & Employment (MBIE) welcomes comment and feedback on this report, and on the measures the Government is taking to facilitate the development of a competitive and successful ICT sector.
Email [email protected]

8

TABLE OF CONTENTS PAGE
Foreword 5
Key terms and data limitations 6
Report objective 7
Executive summary 10
Definition and key themes 13
Government’s Business Growth Agenda 19
ICT sector snapshot and industry characteristics 25
IT services sector: focusing on computer system design and
related services 33
Telecommunications 69
The digital economy 77
Appendix: glossary, definitions, sources, methodology and
limitations 87
Further reading 99
9

Executive summary
*One of the seven publications that comprise the Sectors Report 2013. **Australia and New Zealand Industrial Classification system. 10
adoption of smartphones and other mobile devices. At the same
time revenues from traditional fixed-line telephony services are
declining.
IT services and product firms
- Of the three industries covered, IT services is found to be
generating significant innovation, attracting investment in
established and start-up businesses, and generating export and
employment growth and value creation.
- For this reason, the bulk of the report focuses on the largest IT
services sub-sector, which has the formal name of ‘computer
system design and related services’ (ANZSIC** code M7000).
- The report finds that IT businesses can be divided into two broad
types: those delivering IT services and those developing IT
products.
- IT services firms are mainly focused on the domestic market,
providing IT infrastructure to medium and large organisations. This
group includes many multi-nationals. They are important to the
New Zealand economy, enabling large corporates and
organisations (such as government departments) to drive
efficiencies and develop new products, services or forms of
service delivery through the application of ICT. They are critical to
driving the digitisation of the economy.
- On the other hand, IT product firms are focused on developing
new applications and web-services typically aimed at a particular
industry or process. These firms are highly innovative and research
and development (R&D) intensive. They have the potential to be
significant exporters and build large international businesses.
In many cases these firms are developing products based around
cloud computing and the software as a service model.
General
- Information and communications technology (ICT) captures
three important activities in the economy: ICT manufacturing,
telecommunications and information technology (IT) services.
This report provides a snapshot of the aggregated data for these
activities. Collectively they contribute 5 per cent of GDP and
employ 73,392 New Zealanders; 3.2 per cent of the workforce.
- The report finds major differences in the structure and
characteristics of the three industries captured by the definition
for ICT. The bulk of the report focuses on IT services.
ICT manufacturing
- ICT manufacturing is a small sub-set of high technology
manufacturing and so is not considered in detail in this report.
Data on ICT manufacturing is captured in the High Technology
Manufacturing Report.*
Telecommunications
- The telecommunications industry provides the communications –
or the ‘C’ component of ICT. This is a critical part of the enabling
infrastructure underpinning the digital economy.
- New Zealand has well-developed telecommunications
infrastructure. The Government is working with the sector through
the Ultra-Fast Broadband (UFB) and Rural Broadband Initiative
(RBI) programmes to improve Internet access and speed for all
New Zealanders.
- The telecommunications sector is domestically focused, and is
not a significant contributor to exports.
- Telecommunications businesses globally and in New Zealand are
having to develop new business models to meet the increasing
demand for high speed data, particularly with the rapid
Executive summary continued
*Australia and New Zealand Industrial Classification system. 11
Investment
- The sector is attracting increased investment from angel and
venture investors, and there is a small but growing number of firms
listing on the sharemarket.
The Digital Economy
- Sixty two thousand workers were employed in ICT occupations (as
distinct from being employed by ICT firms) across the whole
economy in 2012, 11,000 more than in 2003.
- The report finds that information technology is increasingly
pervasive across all economic and social activities, and is driving
significant and sometimes fundamental change in most sectors of
the economy.
- The implication is that some traditional occupations and industries
will disappear or change radically (as has occurred with the
music industry), while new opportunities for value creation and
economic growth emerge.
- Firms which may be formally classified as being in the IT sector
often see themselves as being part of the sector they serve. For
instance, Konnect Net sees itself as part of the insurance industry,
although the service it provides is entirely ICT enabled.
Business and employment
- The computer system design sub-sector has shown strong
employment growth, adding 1,630 jobs in 2012 across a range of
occupation types.
- The number of firms in the sector has grown by 40 per cent since
2002, with an additional 266 firms in total, 142 of which are mid-
sized (10–49 employees).
- Half of all employees in the sub-sector are in Auckland, a quarter
in Wellington, with Christchurch accounting for 10 per cent.
- By far the majority of jobs are professional and technical, with
wages and salaries twice the New Zealand average. Firms in the
sector report increasing difficulty in recruiting skilled staff.
Expansion and R&D
- Close to half of the firms in the sector invested in expansion in
2012, almost twice the New Zealand average, and a third
undertook R&D, four times the New Zealand average. Firms
undertaking R&D invested on average $1.1 million in R&D
activities in 2012.
Exports
- Exports of computer and information services showed a
compound annual growth rate (CAGR) of 11% in the period 2006
– 2012, 3% higher than the growth in computer and information
services imports. If this trend continues New Zealand will become
a net-exporter of computer services in the next few years.
- Australia and North America are the major markets and have
driven growth. Exporters report access to finance and distance
as barriers, but also report fewer concerns about the exchange
rate than for New Zealand exporters generally.

12
DEFINITION AND KEY THEMES
13

14
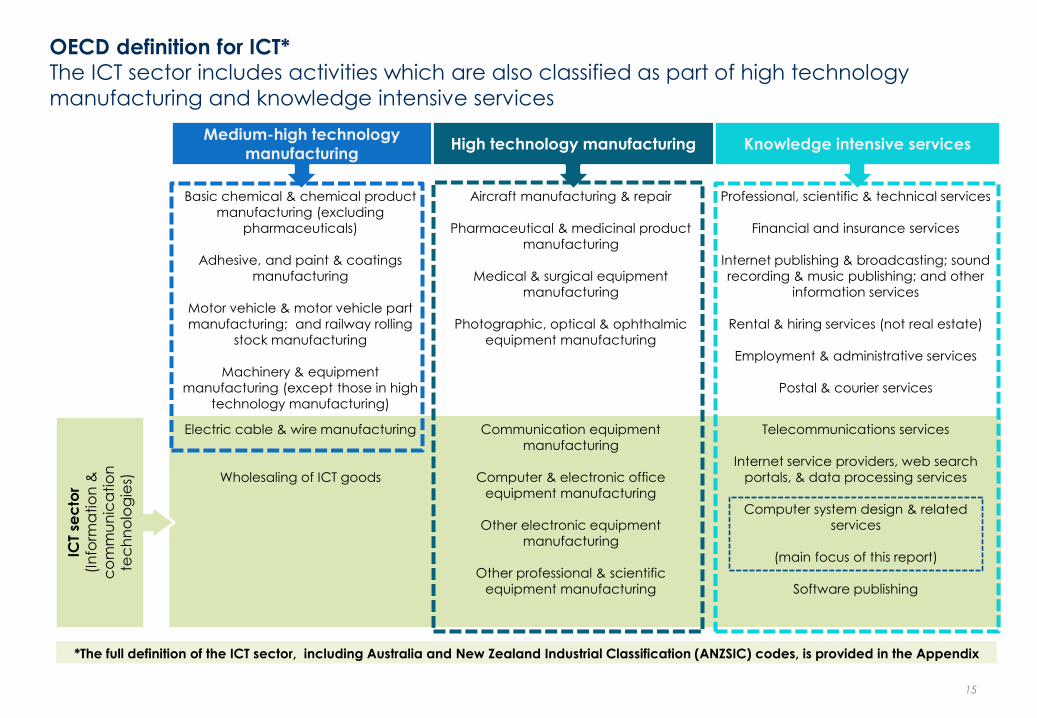
OECD definition for ICT* The ICT sector includes activities which are also classified as part of high technology
manufacturing and knowledge intensive services
Basic chemical & chemical product
manufacturing (excluding
pharmaceuticals)
Adhesive, and paint & coatings
manufacturing
Motor vehicle & motor vehicle part
manufacturing; and railway rolling
stock manufacturing
Machinery & equipment
manufacturing (except those in high
technology manufacturing)
Aircraft manufacturing & repair
Pharmaceutical & medicinal product
manufacturing
Medical & surgical equipment
manufacturing
Photographic, optical & ophthalmic
equipment manufacturing
Professional, scientific & technical services
Financial and insurance services
Internet publishing & broadcasting; sound
recording & music publishing; and other
information services
Rental & hiring services (not real estate)
Employment & administrative services
Postal & courier services
Electric cable & wire manufacturing
Wholesaling of ICT goods
Communication equipment
manufacturing
Computer & electronic office
equipment manufacturing
Other electronic equipment
manufacturing
Other professional & scientific
equipment manufacturing
Telecommunications services
Internet service providers, web search
portals, & data processing services
Computer system design & related
services
(main focus of this report)
Software publishing
15
Medium-high technology
manufacturing High technology manufacturing Knowledge intensive services
ICT
sec
tor
(In
form
atio
n &
c
om
mu
nic
atio
n
tec
hn
olo
gie
s)
*The full definition of the ICT sector, including Australia and New Zealand Industrial Classification (ANZSIC) codes, is provided in the Appendix

Key themes: New Zealand industry A number of key themes emerged in the ICT sector
Theme Description Details
‘Weightless’
exports
The export of intellectual property and ideas.
In the context of ICT, typically software
applications or services that utilise ICT
platforms, such as software as a service.
• Examples include Orion Healthcare, Xero and Green Button.
• Weightless exports are not costless. While the product or service is weightless in the
sense of being computer code, there is significant cost in sales and marketing,
after-sales service, customisation and installation – much of this cannot be done remotely and requires a presence in-market.
Increased
investment
ICT sector attracting increasing interest from
angel and venture investors and on the NZX.
• In 2011, two-thirds of venture and early stage investments were in IT or software
companies.
• The initial capital requirements for a software-as-a-service business are significantly
less than for high technology manufacturing. Most of the cost is in people. Once
the business is proven, however, the capital requirements to scale quickly and build
an international network for sales, marketing and customer support are significant.
Demand for
skills
Increased use of ICT across the economy
generating employment growth across a
range of skill-sets, including software
engineering and development, project
managers, marketers, sales, administrators and business analysts.
• When you go to the knowledge intensive side, you create employment here and
that plays to our natural advantages – our geography, our good schooling system
and our quality of life. – Director, technology company.
• The best guesstimate is that we will need twice as many people working in the
technology industry – broadly defined – as we have today. The biggest bottleneck is the scarcity of people. – CEO, industry body.
Innovation Information and communications
technologies providing platform for
innovation across all sectors.
• The ICT sector produces twice as many innovations that are ‘new to the world’ than
the New Zealand average.
• I see in the ICT sector some stunningly good ideas and guys that can build services
and sometimes products on a shoestring – Director, technology company.
Mobile
connectivity
Rapid uptake of smartphones, tablet
computers and other mobile devices.
• Mobile broadband users increased by 34% in the June 2012 year to 2.5 million, more
than half the population.
• Vodafone has launched a 4G network with data speeds up to 10 times that of 3G.
Developing
capabilities
New Zealand companies gaining experience
and building local and international business
networks in support of export growth.
• Kiwi Landing Pad established in San Francisco with support from private investors
and government.
• Kiwi Landing Pad looking good and Kiwi businesses doing the business in San
Francisco... pic.twitter.com/zpjKhEnbum – Sam Morgan tweet, March 2013.
• We always knew that New Zealand companies had good products, but they just
didn‟t know how to get in. Now there‟s a little ecosystem starting to develop
especially in San Francisco and Washington DC. – CEO, industry body.
16

Key themes: technology The pace of technological change is increasing, driving change in all sectors
Theme Description Details
Cloud
computing
Cloud computing is the use of computing
resources (hardware and software) that are
delivered as a service over the Internet. This
enables data and software applications on remote servers to be accessed on any
computer or device, anywhere, anytime.
• Enables individuals and businesses to have access to highly sophisticated
computing resources, data or applications at low cost.
• Provides a platform for different business models, e.g. software as a service (Xero’s
accounting services, Diligent Board Member Services’ Board Portal) • A familiar example is the music service Spotify, which provides individuals access to
a vast database of recorded music that can be streamed to many devices.
Cyber security
/ privacy
Big data enabling governments and
businesses to analyse and track individual
behaviour. Ubiquitous use of electronic
technology for all activities and functions
increases vulnerability to cyber attacks and
security breaches.
• In 2012, 8% of firms reported a security attack that resulted in the loss of data or
time, or damage to software – Statistics NZ, Business Operations Survey, 2012
• …companies ranging from IBM to Google to Microsoft are racing to combine
natural language processing with huge Big Data systems in the cloud that we can
access from anywhere. These systems will know us better than our best friend. – Greg Satell, Forbes.com, 13 March, 2013.
Internet of
things / remote
sensing
Increasing numbers of objects are
embedded with sensors and gaining the
ability to communicate. The resulting
information networks contribute to big data
and highly customised applications and
management.
• MetService has access to over 2000 Automatic Weather Stations in New Zealand
which make approximately one billion observations per year. Over half of these
stations are in rural areas. MetService collects many gigabytes of data each day.
In 2014–15 the new Japanese weather satellites Himawari 8 and 9 will each deliver
one terabyte of data per day.
• Proposal to make Christchurch a ‘sensing city’ streaming real-time information on
everything from traffic to weather and water systems, and even how many people
are on the city's streets. – media report; stuff.co.nz., April 2013.
Big data Datasets too large to be manipulated by
ordinary database programmes. This data
comes from everywhere: sensors used to
gather climate information, posts to social
media sites, digital pictures and videos,
purchase transaction records (credit cards,
loyalty cards) and cell phone GPS signals
and applications.
• The use of big data will become a key basis of competition and growth for
individual firms… The use of big data will underpin new waves of productivity
growth and consumer surplus. – McKinsey Global Institute.
17

18

THE GOVERNMENT’S BUSINESS GROWTH AGENDA
19
20
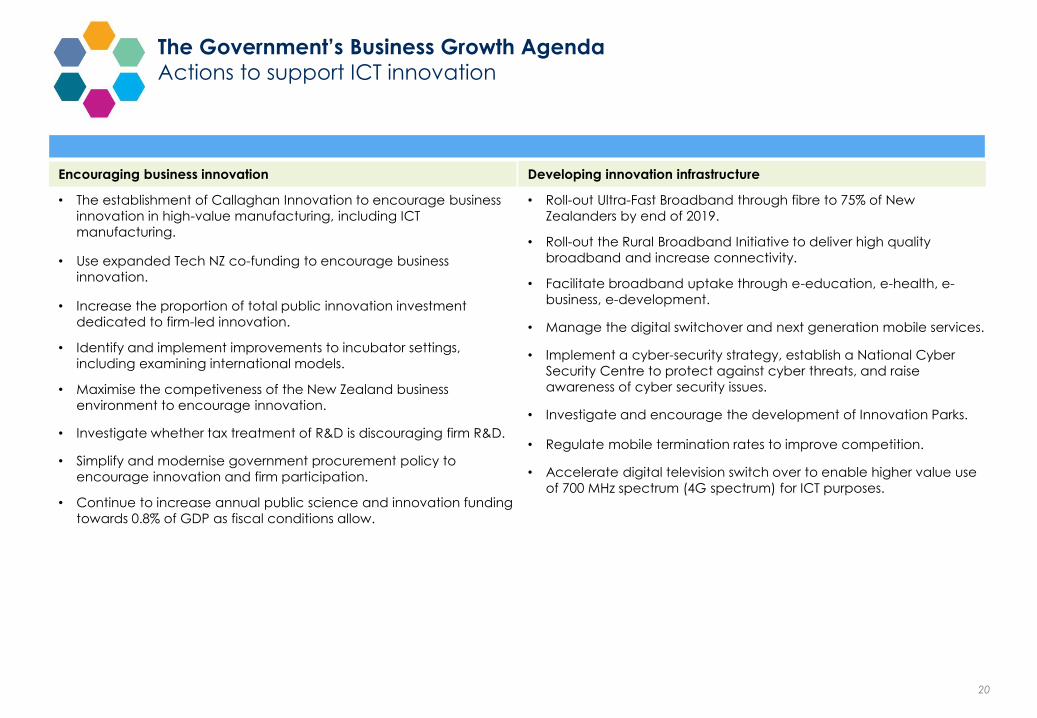
Encouraging business innovation
• The establishment of Callaghan Innovation to encourage business
innovation in high-value manufacturing, including ICT
manufacturing.
• Use expanded Tech NZ co-funding to encourage business
innovation.
• Increase the proportion of total public innovation investment
dedicated to firm-led innovation.
• Identify and implement improvements to incubator settings,
including examining international models.
• Maximise the competiveness of the New Zealand business
environment to encourage innovation.
• Investigate whether tax treatment of R&D is discouraging firm R&D.
• Simplify and modernise government procurement policy to
encourage innovation and firm participation.
• Continue to increase annual public science and innovation funding
towards 0.8% of GDP as fiscal conditions allow.
The Government’s Business Growth Agenda Actions to support ICT innovation
Developing innovation infrastructure
• Roll-out Ultra-Fast Broadband through fibre to 75% of New
Zealanders by end of 2019.
• Roll-out the Rural Broadband Initiative to deliver high quality
broadband and increase connectivity.
• Facilitate broadband uptake through e-education, e-health, e-
business, e-development.
• Manage the digital switchover and next generation mobile services.
• Implement a cyber-security strategy, establish a National Cyber
Security Centre to protect against cyber threats, and raise
awareness of cyber security issues.
• Investigate and encourage the development of Innovation Parks.
• Regulate mobile termination rates to improve competition.
• Accelerate digital television switch over to enable higher value use
of 700 MHz spectrum (4G spectrum) for ICT purposes.

21
The Government’s Business Growth Agenda Actions to improve skills availability and intellectual property settings
Growing the innovation workforce
• Increase investment in engineering studies at tertiary institutions and
lift graduate numbers by 500 per annum by 2017.
• Collect and provide better information on career prospects to
students and the tertiary sector.
• Highlight the role of entrepreneurship in business innovation through
annual Prime Minister's Business Scholarships.
• Investigate highlighting innovation careers in science, design,
engineering and maths to school students and their families.
• Establish annual Prime Minister’s Science Prizes to acknowledge and
reward scientific achievement.
• Maintain internationally competitive personal tax rates that
encourage highly-skilled workers to work from New Zealand.
Strengthening tertiary education
• Purchase additional tertiary places as required to meet demand
across the sector, including in engineering.
• Complete the introduction of performance-linked funding to focus
providers on achieving results for students.
• Publish employment outcome information and likely industry
demand indicators, to better inform prospective students about
study choices.
• Review the Essential Skills in Demand lists, to examine their
effectiveness in addressing skills shortages in the short- and long-
term.
Improving intellectual property settings
• Complete passage of the Patents Bill to more closely align New
Zealand’s patent settings with trading partners.
• Create a single trans-Tasman patents examination regime with
Australia to simplify patent applications.
• Investigate whether the intellectual property settings of public
institutions are optimal for technology transfer.
• Explore opportunities for government to improve the environment
for firms’ use of intellectual property.

22
The Government’s Business Growth Agenda Actions to support exporters and businesses looking to expand internationally
Strengthening high-value manufacturing and services exports
• With Callaghan Innovation, and through New Zealand Trade and
Enterprise (NZTE) programmes Better by Design, Better by Lean,
Better by Strategy and through the Primary Growth Partnership,
assist firms to grow international capability, e.g through improving
supply chain integration using digital technology. (Farm IQ is a
Primary Growth Partnership example).
• Establish mechanisms to secure commercial export opportunities
on the basis of core public sector intellectual property and
expertise.
• Develop stronger ‘NZ Inc’ approach with business on cyber
security.
• Identify key issues for commercial service exporters and promote
export prospects.
Making it easier to trade from New Zealand
• Establish a single trade window for importers and exporters.
• Enhance the NZ Export Credit Office products and services,
improving guarantee products to support export growth.
• Implement Immigration Global Management System upgrade and
network configuration.
• Undertake 28 Minister-led trade missions over the parliamentary
terms to unlock strategic opportunities for business.
Helping businesses internationalise
• Deliver targeted services to approximately 2000 internationalising
firms, with an intensive focus on 500 firms. Of the current 500, 80 are
ICT firms. Examples of services include NZTE programmes such as
Beachheads, Path to Market and Better by Capital.
• Deliver multi-firm, high impact market development programmes
to accelerate the success of firms in the Health IT and Security
Technology sectors.
• Use the International Growth Fund (IGF) to assist high growth firms
to internationalise.
• Utilise the Better by Capital service to assist high growth firms to
plan for, and attract the growth capital required to achieve their
international growth plans.
• Deliver integrated knowledge on key markets to business from all
agencies operating off-shore.
• Develop with key stakeholders a broad, compelling, and flexible
New Zealand story that works for a range of exporters and sectors,
including tourism and education, and for immigration .

23
The Government’s Business Growth Agenda Actions to improve investment and access to capital
Strengthening equity markets
• Partially-list four State-owned enterprises on the NZX exchange.
• Investigate options for lower cost public listing.
• Pass the Financial Markets Conduct Bill to make it easier for listed
companies to raise capital.
• Make it easier for businesses to offer employee share schemes.
• Pass the Financial Reporting Bill to reduce unnecessary financial
reporting costs for business.
Supporting early stage and growth capital
• Increase access to capital for small, high-growth businesses by
supporting the New Zealand Venture Investment Fund.
• Deliver targeted services to help internationalising New Zealand
firms raise capital.
• Improvements to business R&D grants.
• Improvements to incubator programmes.
• Enable crowd funding and peer-to-peer lending.
• Provide more options for SMEs to raise capital by clarifying and
widening disclosure exceptions for SMEs seeking to raise capital
(e.g. offers to experienced investors, small offers).
Attracting foreign investment
• Encourage a more positive environment for international
investment and explain the benefits to New Zealanders.
• Align business law between New Zealand and Australia.
• Review investor, entrepreneur and worker policy settings with a
view to attracting migrants with the right skills and capital to invest.
Attracting skilled migrants and investors
• Review investor, entrepreneur and worker policy settings with a
view to attracting migrants with the right skills and capital to invest.
• Introduce Silver Fern Visa to provide employers with greater access
to young skilled migrants.

24

ICT SECTOR SNAPSHOT AND INDUSTRY CHARACTERISTICS
25

Industry level financial performance
Total Growth (1yr)
This sector All sectors This sector All sectors
Total income per firm 2011# $1,923,412 $1,294,500 5.6% 5.2%
Total income per employee 2011# $453,027 $311,600 7.0% 4.0%
Surplus per employee 2011# $17,199 $24,000 -15.8% -12.7%
Return on equity 2011# 9.8% 6.6% down down
Debt ratio (liabilities/assets) 2011# 65.7% 64.1% up down
Capital stock per worker 2010 n/a $169,364 n/a 5.2%
* NZ is total employing firms, except total measured sector for productivity
** Cross-cutting sector: uses value add per employee for productivity, NZ average = 100%
#All sector total excludes some industries. Refer appendix, terms and definitions.
ICT snapshot (OECD definition) Situation Cross-cutting sector (data is aggregated and double-counted with other sectors)
Includes firms whose main activity is provision of goods and services which fulfil or enable the function of information processing and communication
by electronic means including transmission and display. Also includes firms which provide goods which use electronic processing to detect, measure
and/or record physical phenomena or control a physical process.
26
26
Example firms
Firm Turnover ($m) Employees Ownership
Chorus $613m (7 months
ending June 2012) 548 Listed NZX
Telecom 4,576m
(2012)
7,866
(2012) Listed NZX
Revera $38
(2012) 133
Acquired by
Telecom
Orion Health $100
(2012) 633 Private
Optimation (NZ) $48
(2012) 230 Private
Key services exports from this sector Key markets for this sector
Service
(aggregated ICT data)
Exports
($m; 2012) Country
Exports
($m: 2012)
Computer services $391.3 n/a
Communication services $183.6
Software royalties $123.2
News & information
services $21.5
Other royalties & franchises $15.5
Other $383.9 Other
TOTAL
all exports $1,119
TOTAL all countries
$1,119
Scorecard
Measure Total % of NZ* Growth Growth Growth
(1 year) (5 yr CAGR) (10 yr CAGR)
GDP 2010 (nominal) $8,405m 5.1% -4.6% 2.8% n/a
Real GDP 2012 n/a n/a n/a n/a n/a
Goods exports 2012 $745m 1.7% 11.4% -1.0% n/a
Employment 2011 73,398 3.2% 2.0% 1.1% 1.8%
Value added /
employee 2010
(nominal)**
$116,832 161.4%** 0.2% 1.1% n/d
Investment in fixed
assets 2010 $1,278m 4.2% -17.0% n/d n/d
No. of firms 2012 14,187 3.0% 1.4% 0.8% 3.2%

ICT snapshot (OECD definition) Performance Cross-cutting sector (data is aggregated and double-counted with other sectors)
Comment
• Sector value add growing
• Large employer: 73,398
• More workers overall: +11,754 (2001–11)
• Lost workers: -3,627(2009)
• More workers: +1455 (2011) • Productivity improving
• Goods exports recovering after GFC
• Services exports growing
• Number of firms increasing
• Fixed capital investment stable
• R&D and innovation rates high
• Return on investment: 10% (2011)
• Highly internationalised sector
27
Results from Survey: 2011
R&D & innovation rates
Export barriers:
Current exporters % firms
Export barriers:
Future exporters % firms Internationalisation %
R&D rate 1. Distance from markets 1. Limited experience in
expanding beyond NZ
% of ICT firms reporting
overseas income n/a
Innovation rate 2. Other 2. Limited access to finance
for expansion beyond NZ
% of ICT firms with off-
shore direct investment 11%
3. Exchange rate volatility/
Limited access to finance for
expansion beyond NZ
3. Limited knowledge about specific markets/
Low market demand or
increased competition
% of ICT firms >50%
foreign owned 19%
+3,862 firms
2002-12
+ 11.4% in 2012
The majority of IT workers are in other sectors, eg Fonterra has one of largest IT depts. in NZ
Investment averaging $1.4b per annum 2009–11.
Includes telecommunications, excludes media
Cross-cutting sector: value added per
worker
High
Medium
Low
Key trends, various timeframes: 10-year index (base =1000) except productivity is $ values – this sector vs all other sectors
$116,832
Cross-cutting sector: uses value added as a proxy for GDP

Number of firms by major ICT sub-sector By far the majority of ICT firms are in IT services
Number of firms by sub-sector
Firms; 2002–2012
28
IT services
IT wholesaling
ICT manufacturing
CAGR
11–12
-2.2%
1.9%
ABS
02–12
-327
+4137
0.2% +33
CAGR
02–12
-2.0%
4.2%
0.9%
Source: Statistics New Zealand, customised data drawn from New Zealand Business Demography Statistics (2012)
497 568 639 635 609 577 585 604 653 690 676
8,155 8,720
9,560 10,241
11,048 11,593 11,926 12,050 11,689 12,061 12,292
373
403
425
428
416 416
412 397 406
405 406
1,816
1,812
1,779
1,721
1,681 1,639
1,615 1,565 1,516
1,523 1,489
10,841
11,503
12,403
13,025
13,754 14,225
14,538 14,616 14,264
14,679 14,863
2002 2003 2004 2005 2006 2007 2008 2009 2010 2011 2012
Telecommun-
ications -2.0% +179 3.1%
Total 1.3% +4022 4.2%
10,670 9,630 10,180 11,270 12,100 12,920 13,880 13,930 13,830 14,030 14,980
20,913 21,865 21,700 24,185
25,240 26,720
28,005 28,245 25,940 27,470
29,145
4,420 4,950 5,130
5,300 5,435
5,445 5,265 4,700
4,760 4,750
4,855
12,280 12,400 12,640
12,790 13,040
13,070 13,180 12,780
13,440 13,530
13,240
48,283 48,845 49,650
53,545 55,815
58,155 60,330 59,655
57,970 59,780
62,220
2002 2003 2004 2005 2006 2007 2008 2009 2010 2011 2012
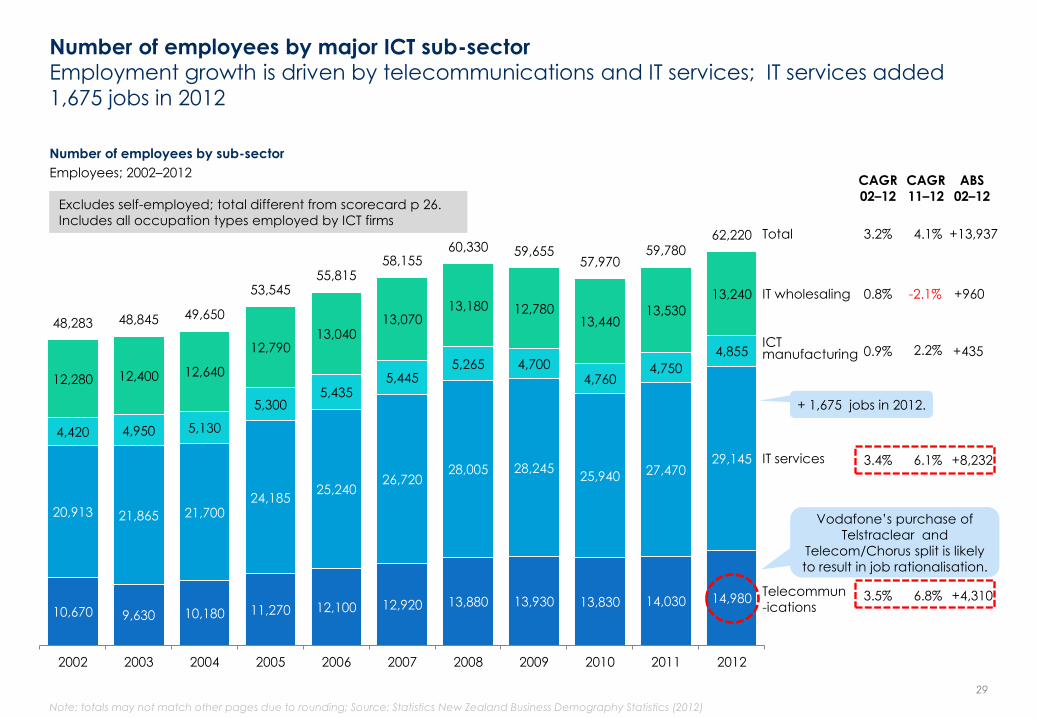
Number of employees by major ICT sub-sector Employment growth is driven by telecommunications and IT services; IT services added
1,675 jobs in 2012
Number of employees by sub-sector
Employees; 2002–2012
Note: totals may not match other pages due to rounding; Source: Statistics New Zealand Business Demography Statistics (2012)
29
IT services
IT wholesaling
CAGR
11–12
-2.1%
6.1%
ABS
02–12
+960
+8,232
2.2% +435
CAGR
02–12
0.8%
3.4%
0.9%
Telecommun
-ications 6.8% +4,310 3.5%
Total 4.1% +13,937 3.2%
Excludes self-employed; total different from scorecard p 26.
Includes all occupation types employed by ICT firms
+ 1,675 jobs in 2012.
Vodafone’s purchase of
Telstraclear and
Telecom/Chorus split is likely
to result in job rationalisation.
ICT manufacturing

OECD definition: industry comment Industry leaders commented that aggregated data on the ICT sector is misleading
• ICT is a misleading description. IT and telecommunications are really two quite different sectors. The IT sector
is a story of growth. Compare that to the financial performance of the telecommunications sector, and
what you see is a tapering off and not a huge amount of growth. What this results in is a picture that
understates the contribution that IT is making and doesn‟t recognise the increasing head-winds in the
telecommunications industry.
– CE, industry body
• I think about ICT as the telcos or the specific software companies, and then the digital economy is separate.
So how is the rest of the economy using ICT? How are farmers using the systems of geo-spatial technology to
improve irrigation efficiency?
– New Zealand representative, very large multinational
• It‟s hard to align these categorisations with the real world. Intuitively they don‟t make sense. IT services and
ICT manufacturing are fundamentally different business models. The capital requirements for software are
very different to manufacturing devices. The two business areas don‟t overlap.
– Partner, technology law firm
• There needs to be a clearer differentiation between those [multinational] companies that are in New
Zealand providing services, and those New Zealand companies that are doing creative stuff and are
looking to expand internationally.
– CE, small-medium IT product firm.
• We would see value in differentiating between multinational and domestic companies. A lot of innovation
occurs in small and start-up New Zealand-owned companies that have the potential to grow quite rapidly.
The thing you‟ve got to be mindful of is that grouping certain organisations together may not be
representative. IT services companies might include customer services related staff in call centres. If you
bundle these together with pure IT companies, you are looking at an average salary that is not
representative of the opportunities that might be there.
– CE, industry association
30
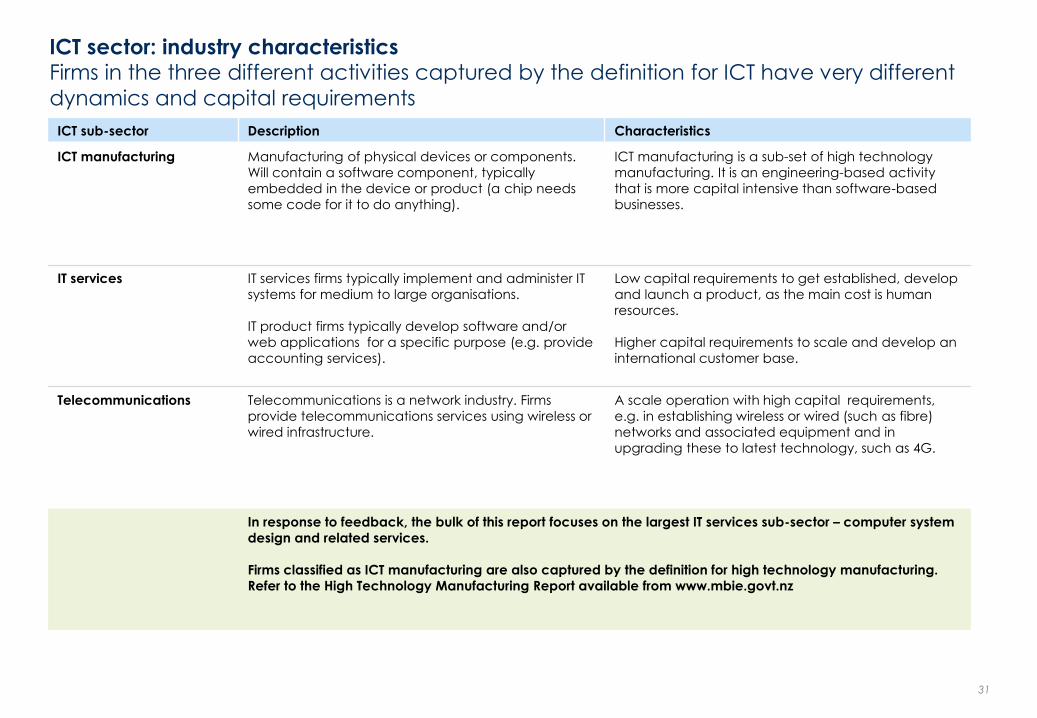
ICT sector: industry characteristics Firms in the three different activities captured by the definition for ICT have very different
dynamics and capital requirements
ICT sub-sector Description Characteristics
ICT manufacturing Manufacturing of physical devices or components.
Will contain a software component, typically
embedded in the device or product (a chip needs
some code for it to do anything).
ICT manufacturing is a sub-set of high technology
manufacturing. It is an engineering-based activity
that is more capital intensive than software-based
businesses.
IT services IT services firms typically implement and administer IT
systems for medium to large organisations.
IT product firms typically develop software and/or
web applications for a specific purpose (e.g. provide
accounting services).
Low capital requirements to get established, develop
and launch a product, as the main cost is human
resources.
Higher capital requirements to scale and develop an
international customer base.
Telecommunications Telecommunications is a network industry. Firms
provide telecommunications services using wireless or
wired infrastructure.
A scale operation with high capital requirements,
e.g. in establishing wireless or wired (such as fibre)
networks and associated equipment and in
upgrading these to latest technology, such as 4G.
In response to feedback, the bulk of this report focuses on the largest IT services sub-sector – computer system
design and related services.
Firms classified as ICT manufacturing are also captured by the definition for high technology manufacturing.
Refer to the High Technology Manufacturing Report available from www.mbie.govt.nz
31

32
IT SERVICES SECTOR
Focusing on computer system
design and related services
33

IT services sub-sectors
The IT services sector is made up of six sub-sectors, covering a wide range of
activities
34
Sub-sector Description ANZSIC code* Examples
Other goods and
equipment rental and
hiring n.e.c.
Firms mainly engaged in hiring or leasing of goods and equipment not elsewhere
classified, including electronic equipment.
L6639 Vidcom New
Zealand
Computer system design
and related services
Firms engaged in providing expertise in the field of information
technology. Includes consulting services around computer hardware programming
and software, internet and web design. Also includes customised software
development (except software publishing), software installation services and systems
analysis services.
M7000 Orion
Healthcare
For the purposes of this report it is assumed that software-as-a-service businesses (for
example) are captured in this classification. In any case, as the largest IT subsector, it is
assumed that the data is representative of the structure and dynamics of New
Zealand’s cohort of IT firms.
Software publishing Firms mainly engaged in creating and disseminating ready-made (non-customised)
computer software.
J5420 Pingar
Data processing and web
hosting services
Firms mainly engaged in providing electronic data processing or hosting services,
including web hosting, streaming services or application hosting and application
service provisioning. Includes provision of complete processing and specialised reports
from data supplied by customers or automated data processing and data entry
services.
J5921 Revera
Electronic information
storage services
Firms mainly engaged in providing electronic information storage and retrieval services
(excludes library services).
J5922 Paymark
Electronic (except
domestic appliance) and
precision equipment repair
and maintenance
Firms engaged in repairing and maintaining electronic equipment (except domestic
appliances) such as computers and communications equipment, and/or highly
specialised precision instruments.
S9422 Kinetics Group
*Australia and New Zealand Standard Industrial Classification 2006 („ANZSIC‟)

Comparative size of IT services sub-sectors Computer system design is by far the largest IT services sub-sector, and is the focus of this
report’s analysis (see appendix for full definition)
Number of employees by sub-sector
Employees; 2012
Number of firms by sub-sector
Firms; 2012
Source: Statistics New Zealand, New Zealand Business Demography Statistics (2012) 35
78% 77%
3%
6%
13%
6%
5%
13%
1735
1390
3670
22,350
Software publishing, data
strorage and processing
Electronic precision equipment
repair
Equipment rental and hiring
Computer system design
308
707
1667
9610
Software publishing, data
strorage and processing
Electronic precision equipment
repair
Equipment rental and hiring
Computer system design
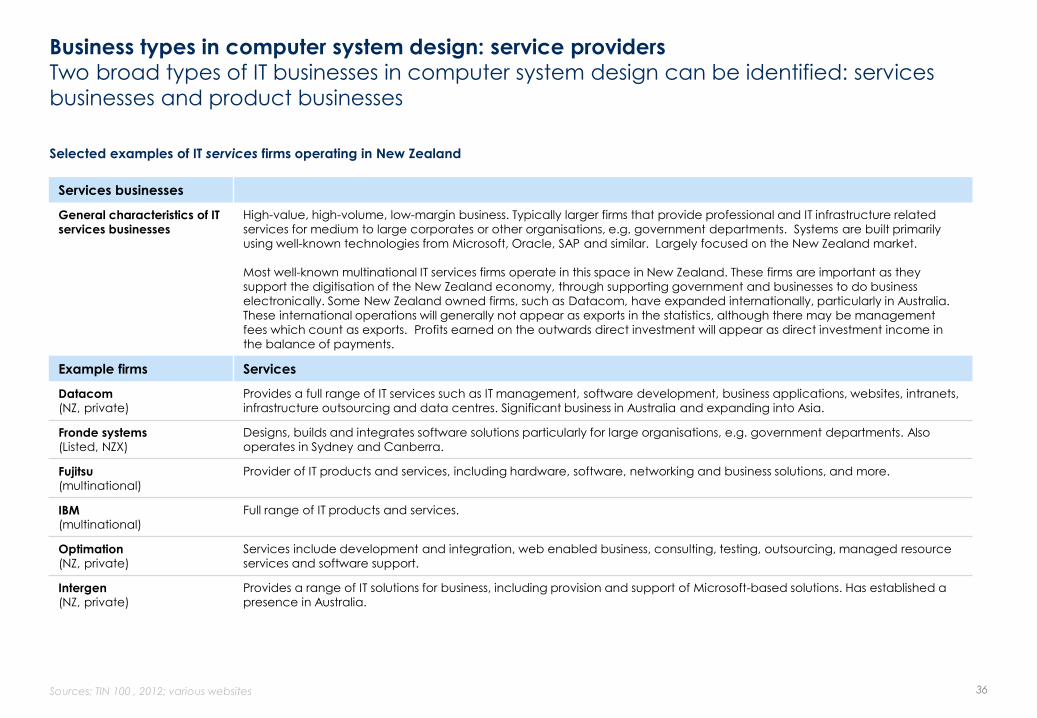
Business types in computer system design: service providers Two broad types of IT businesses in computer system design can be identified: services
businesses and product businesses
Services businesses
General characteristics of IT services businesses
High-value, high-volume, low-margin business. Typically larger firms that provide professional and IT infrastructure related services for medium to large corporates or other organisations, e.g. government departments. Systems are built primarily
using well-known technologies from Microsoft, Oracle, SAP and similar. Largely focused on the New Zealand market.
Most well-known multinational IT services firms operate in this space in New Zealand. These firms are important as they
support the digitisation of the New Zealand economy, through supporting government and businesses to do business
electronically. Some New Zealand owned firms, such as Datacom, have expanded internationally, particularly in Australia.
These international operations will generally not appear as exports in the statistics, although there may be management
fees which count as exports. Profits earned on the outwards direct investment will appear as direct investment income in
the balance of payments.
Example firms Services
Datacom (NZ, private)
Provides a full range of IT services such as IT management, software development, business applications, websites, intranets,
infrastructure outsourcing and data centres. Significant business in Australia and expanding into Asia.
Fronde systems (Listed, NZX)
Designs, builds and integrates software solutions particularly for large organisations, e.g. government departments. Also
operates in Sydney and Canberra.
Fujitsu (multinational)
Provider of IT products and services, including hardware, software, networking and business solutions, and more.
IBM (multinational)
Full range of IT products and services.
Optimation (NZ, private)
Services include development and integration, web enabled business, consulting, testing, outsourcing, managed resource
services and software support.
Intergen (NZ, private)
Provides a range of IT solutions for business, including provision and support of Microsoft-based solutions. Has established a
presence in Australia.
Selected examples of IT services firms operating in New Zealand
Sources; TIN 100 , 2012; various websites 36

Business types in computer system design: product developers New Zealand IT product firms typically focus on developing products that exploit a niche
opportunity; most are exporting
Product businesses
General characteristics of
IT product businesses
High-margin, high-growth potential businesses. Typically focused on developing applications or products focused on a
specific sector (e.g. health), or specific business operation (e.g. accounting) or a specific service (e.g. online auctions). These
businesses can be established and a product launched with a relatively small amount of capital, as the key assets are
intellectual property and human capability. Such businesses have the capacity to scale rapidly if the product is proved in the
market, although this takes significant additional capital. Staff requirements are low when compared to the value created.
These businesses have the potential to create significant value and appear to be driving exports in the sector. Typically,
exporting also involves establishing offices in market to provide sales, marketing and customer support services, as the
following examples demonstrate.
Selected examples of IT product firms operating in New Zealand
Sources; TIN 100 2012; various websites 37
Firm Industry/niche targeted Products Comments
Vista Entertainment
Solutions (Private)
Entertainment industry,
particularly multiplex
cinemas
• Software for management of all aspects of
a multiplex cinema.
• Customised software services to the
entertainment industry.
• Internet-based software-as-a-service
model, Veezi, for smaller cinemas that
cannot afford the deluxe Vista version,
using a pay-as-you-go cloud-based model.
• 23% market share globally, 53 countries.
• $30m revenue (est).
• 125 staff.
• Mixed business model, sells direct in some
countries and through partners in others
• Vista has a global partner network with
representatives in 11 countries.
Konnect Net (Private)
Insurance industry • Integrated suite of process management
services that facilitate the capture, transfer
and management of information across
the finance, health and corporate sectors,
replacing time-consuming paper based
systems.
• $12–15m revenue (est).
• 80 staff (est).
• Australian office established.
Xero (Listed, NZX)
Total market capitalisation
as at 6 May 2013
$1.612b
Accounting software for
small and medium
businesses
• Provides accounting software in the cloud
by subscription.
• Operates software-as-a-service business
model.
• $40m revenue (year ended 31 March,
2013).
• 350 staff (est).
• Offices in Melbourne, Sydney, Brisbane, San
Francisco and Milton Keynes.

Business types in computer system design: product developers continued
Selected examples of IT product firms operating in New Zealand
Sources; TIN 100 2012; various websites 38
Firm Industry/niche targeted Products Comments
COMRAD (Private)
Health, radiology • The COMRAD Radiology Information
System (RIS) – software solutions for
radiology market.
• $7m revenue (est).
• 42 staff.
• System installed in 390 practices in New
Zealand and Australia.
• Offices in Sydney and Melbourne.
Biomatters
(Private/VC)
DNA analysis. • Geneius; Molecular Profiler.
• Biomatters’ applications translate genomic
data into biological and clinical insights.
• $4m revenue (est)
• 21 staff
• Office in San Francisco
ARANZ Geo (Private)
Mining, geothermal and
hydrogeology.
• Core product is the Leapfrog® 3D
geological modelling software for the
mining, hydrogeology and geothermal
industries.
• ARANZ Geo has a 50-strong Christchurch
based team and a further 35 staff located
across a network of local support offices…
Around 98% of the company‟s software is
exported.
-scoop.co.nz, March 2013.
Gentrack (Private/VC)
Utilities & airports • Specialist billing, customer relationship
management and revenue assurance
software solutions for energy and water
utilities, heating schemes and airports. Also
provides business and industry consulting
and project management services.
• $25–30m turnover (est).
• 140 staff.
• Six offices worldwide including Melbourne,
Orlando, New York, London, Manchester.
Diligent Board Member
Services (Listed, NZX)
Total market capitalisation as at 6
May 2013
$594 million
Corporate governance • Provides directors with access to board
papers in the cloud, through a bespoke
portal, Boardbooks.
• Operates software-as-a-service business model, income listed as ‘licensing
revenue’.
• Provides services to 2,800 boards globally .
• $44m revenue (2012).
• 138 staff (global).
• Offices in New Zealand, United States, the United Kingdom, Australia, Singapore,
Canada, the Netherlands and Hong Kong.
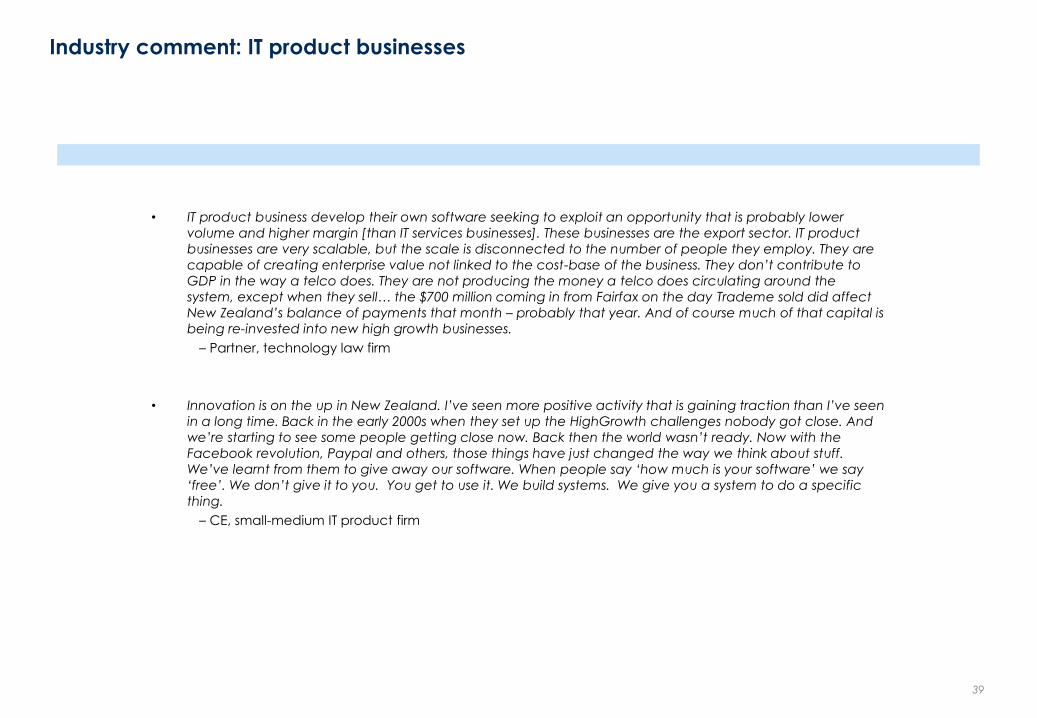
Industry comment: IT product businesses
• IT product business develop their own software seeking to exploit an opportunity that is probably lower
volume and higher margin [than IT services businesses]. These businesses are the export sector. IT product
businesses are very scalable, but the scale is disconnected to the number of people they employ. They are
capable of creating enterprise value not linked to the cost-base of the business. They don‟t contribute to
GDP in the way a telco does. They are not producing the money a telco does circulating around the
system, except when they sell… the $700 million coming in from Fairfax on the day Trademe sold did affect
New Zealand‟s balance of payments that month – probably that year. And of course much of that capital is
being re-invested into new high growth businesses.
– Partner, technology law firm
• Innovation is on the up in New Zealand. I‟ve seen more positive activity that is gaining traction than I‟ve seen
in a long time. Back in the early 2000s when they set up the HighGrowth challenges nobody got close. And
we‟re starting to see some people getting close now. Back then the world wasn‟t ready. Now with the
Facebook revolution, Paypal and others, those things have just changed the way we think about stuff.
We‟ve learnt from them to give away our software. When people say „how much is your software‟ we say
„free‟. We don‟t give it to you. You get to use it. We build systems. We give you a system to do a specific
thing.
– CE, small-medium IT product firm
39

6,241 6,657
7,246 7,742
8,393 8,876 9,202 9,336 9,042 9,391 9,610
2002 2003 2004 2005 2006 2007 2008 2009 2010 2011 2012
Number of computer system design firms Computer system design has added 3,369 firms since 2002; growth in firm numbers resumed
in 2011 after dip in 2010
Number of firms
Firms; 2002–2012
40
Source: Statistics New Zealand, New Zealand Business Demography Statistics (2012)
Computer
system design
2.3% +3,369 4.4% Total
Includes firms with no employees
CAGR
11–12
ABS
02–12
CAGR
02–12

13,500 14,110 14,360 16,170
17,010 17,580 19,170 19,450 19,340
20,720 22,350
2002 2003 2004 2005 2006 2007 2008 2009 2010 2011 2012
Computer system design: number of employees Computer system design has shown strong employment growth
Number of employees
Employees; 2002–2012
41 Source: Statistics New Zealand, New Zealand Business Demography Statistics (2012)
CAGR
11–12
ABS
02–12
CAGR
02–12
Computer system design
7.9% +8,850 5.2% Total
1,630 jobs added in
2012.
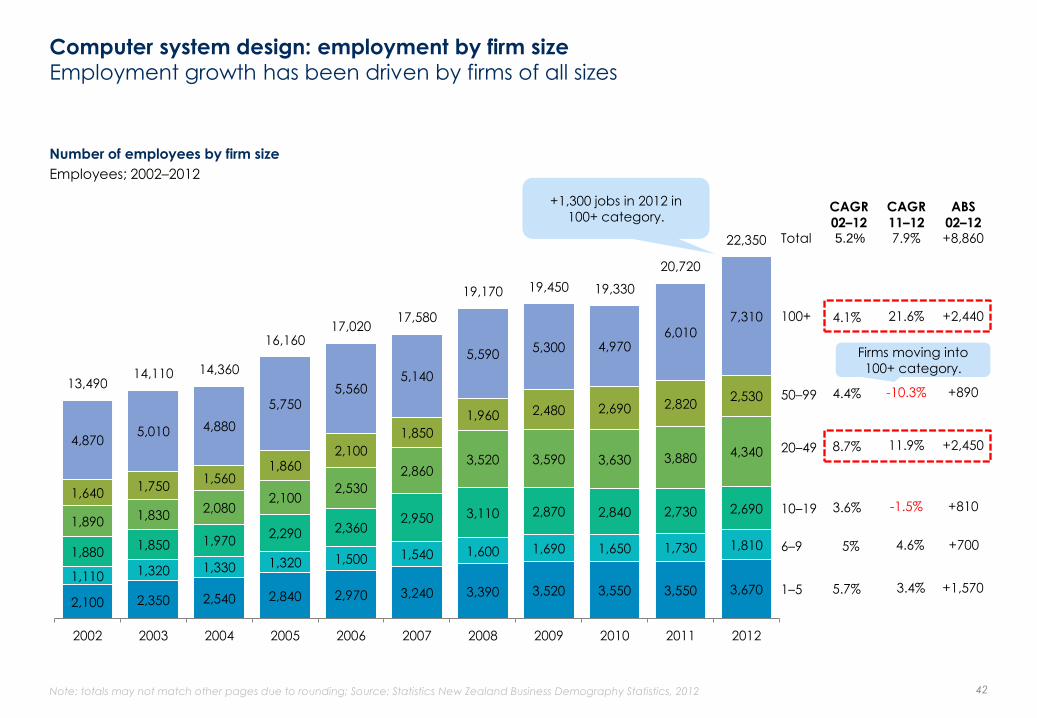
Computer system design: employment by firm size Employment growth has been driven by firms of all sizes
Note: totals may not match other pages due to rounding; Source: Statistics New Zealand Business Demography Statistics, 2012 42
2,100 2,350 2,540 2,840 2,970 3,240 3,390 3,520 3,550 3,550 3,670 1,110 1,320 1,330 1,320 1,500 1,540 1,600 1,690 1,650 1,730 1,810 1,880
1,850 1,970 2,290 2,360
2,950 3,110 2,870 2,840 2,730 2,690 1,890
1,830 2,080
2,100 2,530
2,860 3,520 3,590 3,630 3,880 4,340
1,640 1,750
1,560 1,860
2,100
1,850
1,960 2,480 2,690 2,820 2,530
4,870 5,010 4,880
5,750 5,560
5,140
5,590 5,300 4,970
6,010
7,310
13,490 14,110 14,360
16,160 17,020
17,580
19,170 19,450 19,330
20,720
22,350
2002 2003 2004 2005 2006 2007 2008 2009 2010 2011 2012
Total
20–49
10–19
6–9
1–5
50–99
100+
CAGR
11–12
ABS
02–12
CAGR
02–12 7.9% 5.2% +8,860
21.6% +2,440 4.1%
+890 4.4%
11.9% +2,450 8.7%
-10.3%
-1.5% +810 3.6%
4.6% +700 5%
3.4% +1,570 5.7%
Number of employees by firm size
Employees; 2002–2012
Firms moving into
100+ category.
+1,300 jobs in 2012 in
100+ category.

Computer system design: firms by employment size
75% of firms have no employees; these are likely to be private contractors
Number of firms by employee numbers (firms with six or more employees aggregated)
Firms; 2002–2012
43
4,830 5,095 5,572 5,901
6,436 6,763 6,943 6,996 6,710 7,035 7,164
1,010 1,137
1,232 1,369
1,429 1,544
1,640 1,721 1,715
1,718 1,779
401 425
442
472
528
569 619 619
617 638
667
6,241 6,657
7,246
7,742
8,393
8,876 9,202 9,336
9,042 9,391
9,610
2002 2003 2004 2005 2006 2007 2008 2009 2010 2011 2012
0
1–5
6–100+
Total
CAGR
11–12
ABS
02–12 CAGR
02–12
2.3% 4.4% +3,369
4.5% +266 5.2%
+769 5.8% 3.6%
1.8% +2,334 4%
Note: totals may not match other pages due to rounding; Source: Statistics New Zealand Business Demography Statistics, 2012
75%

Computer system design: firms by employment size continued The sector is adding mid-sized firms (20–49 employees) and large firms (100+ employees) at
a good rate; with a surge in 2011 & 2012
Number of firms by employee numbers (six employees and above)
Firms; 2002–2012
44
153 182 181 181
207 207 222 233 227 237 252
141 138 148 171
181 217
228 210 211 207 205
65 62
72 71
87
96
117 120 121 129 143
24 26
23 26
30
26
26 34 38 41
37
18 17
18
23
23
23
26 22 20 24
30
401 425
442 472
528
569
619 619 617 638
667
2002 2003 2004 2005 2006 2007 2008 2009 2010 2011 2012
Total
20–49
10–19
6–9
50-99
100+
CAGR
11–12
ABS
02–12
CAGR
02–12
4.5% 5.2% +266
-9.8% +13 4.4%
+78 8.2% 10.9%
6.3% +99 5.1%
-1% +64 3.8%
25% +12 5.2%
Note: totals may not match other pages due to rounding; Source: Statistics New Zealand Business Demographics database
The sector added 10 firms with 100+
employees in 2010-2012; indicates
firms previously in 50–99 range
adding jobs.
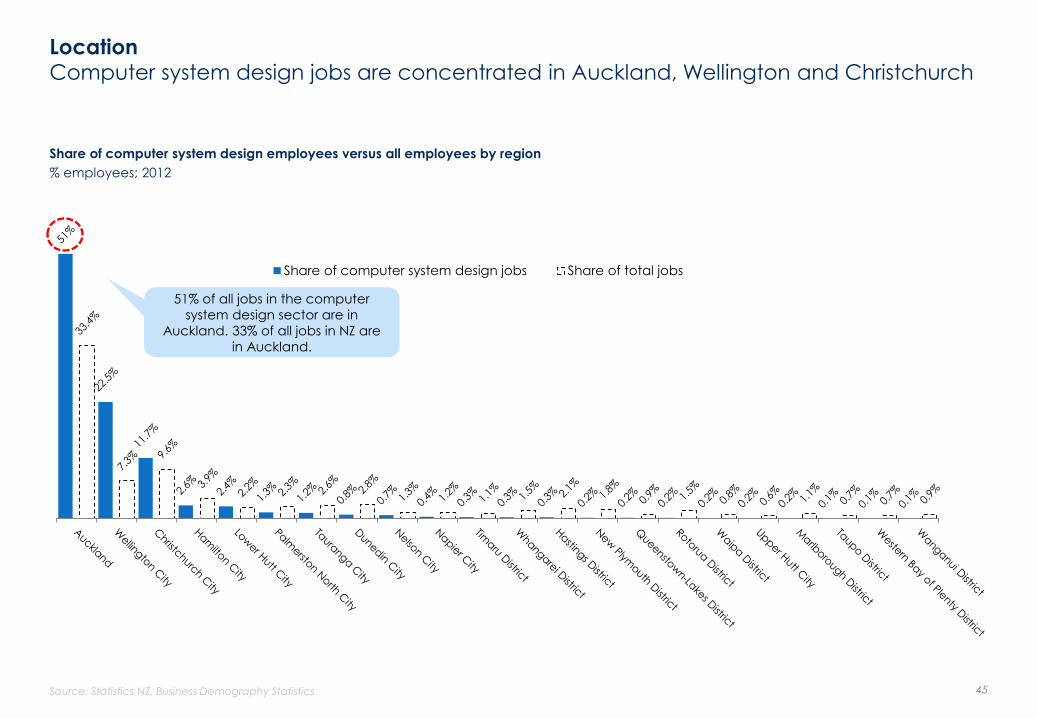
Location Computer system design jobs are concentrated in Auckland, Wellington and Christchurch
Share of computer system design employees versus all employees by region
% employees; 2012
Source: Statistics NZ, Business Demography Statistics 45
Share of computer system design jobs Share of total jobs
51% of all jobs in the computer
system design sector are in
Auckland. 33% of all jobs in NZ are
in Auckland.

49%
25% 21%
33%
27%
9%
3%
9%
19%
14%
39%
51%
Computer system design Telecommunications NZ average
Managers and professionals Technicians and associated professionals Tradespeople Other
Composition of workforce by occupational group 82% of the workforce in computer system design are managers, professionals or
technicians
Workforce by occupational group*
% workforce; 2012
*Note: Total survey sample is 35,976 firms with six or more employees; 600 of these firms are in computer system design.
Source: Statistics New Zealand, Business Operations Survey (2012) 46
82%
52%
30%

Computer system design wages/salaries Wages/salaries in computer system design are twice the New Zealand average and are
growing faster
Average salary/wages
NZ$; 2009–2011
Growth in average salaries/wages
%; 2009–2011
Note: average wage is calculated by total salaries & wages paid, divided by number. of employees
Source: Statistics New Zealand, Annual Enterprise Survey 47
$93,517 $99,059
$103,563
$47,095 $48,801 $50,351
$0
$20,000
$40,000
$60,000
$80,000
$100,000
$120,000
2009 2010 2011
Computer system design NZ average
5.9%
4.5%
3.6%
3.2%
2009 2010 2011
Computer system design NZ average

30% 30%
36%
29%
11%
13% 12%
20%
13% 13%
15% 14%
5% 6%
5% 6%
0%
5%
10%
15%
20%
25%
30%
35%
40%
2009 2010 2011 2012
Computer systems design; moderately difficult Computer systems design; severely difficult
NZ average; moderately difficult NZ average; severely difficult
Recruitment: managers and professionals Around half of computer system design firms report difficulty recruiting managers and
professionals, with severe difficulty increasing
Computer system design firms reporting severe or moderate difficulty in recruiting managers and professionals*
% firms; 2012
*Note: Total survey sample is 35,976 firms with six or more employees; 600 of these firms are in computer system design.
Source: Statistics New Zealand, Business Operations Survey (2011 & 2012) 48
Moderate plus
severe difficulty in
2012=49%
Moderate plus
severe difficulty in
2009=41%
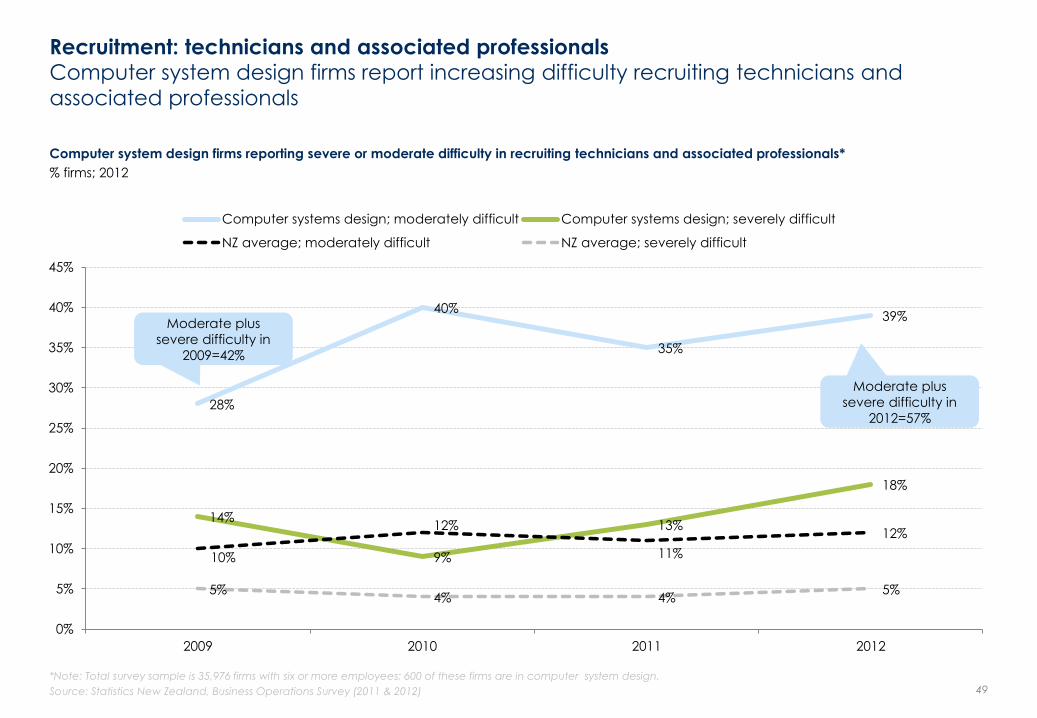
Recruitment: technicians and associated professionals Computer system design firms report increasing difficulty recruiting technicians and
associated professionals
Computer system design firms reporting severe or moderate difficulty in recruiting technicians and associated professionals*
% firms; 2012
*Note: Total survey sample is 35,976 firms with six or more employees; 600 of these firms are in computer system design.
Source: Statistics New Zealand, Business Operations Survey (2011 & 2012) 49
28%
40%
35%
39%
14%
9%
13%
18%
10%
12%
11%
12%
5% 4% 4%
5%
0%
5%
10%
15%
20%
25%
30%
35%
40%
45%
2009 2010 2011 2012
Computer systems design; moderately difficult Computer systems design; severely difficult
NZ average; moderately difficult NZ average; severely difficult
Moderate plus
severe difficulty in
2012=57%
Moderate plus
severe difficulty in
2009=42%

Industry comment: recruitment
• In high tech manufacturing the raw smarts come out of highly trained and expensive individuals, like
electrical engineers and computer engineers that have been through an engineering degree. The raw skill
set you need is rarer and more expensive. Whereas with IT services and software in New Zealand – yes, it
draws on computer science degrees and post-graduate degrees. And some of the really clever software
has been developed by people with PhDs. But there are also a lot of really good web businesses or mobile
app businesses that are being built by people who have had short course training in web development and
mobile app development. And some people are self-taught.
– Partner, technology law firm
• The best guesstimate is that we will need twice as many people working in the technology industry – broadly
defined – as we have today. The biggest bottleneck is the scarcity of people. These are not just IT
occupations, but a whole range of skills such as project managers, marketers, sales people, administrators
and business analysts. These people don‟t all need a degree in computer science. They can come from any
industry, from insurance or banking.
– CE, industry body
• I‟ve been in the IT sector for 30 years, and its been the same for thirty years, It always takes time to find good
people. And if it didn‟t, then they probably wouldn‟t be good. Do I think we need more of them? I don‟t
think the issue is quite as bad for us as it is for the very large corporates, in that they have huge numbers of
people to deal with. Whereas we are more focused on highly specialist type skills.
– CE, small-medium IT product firm
50

Investment in expansion and R&D Nearly half of computer system design firms invested in expansion in 2012; a third also
invested in R&D
Investment in expansion and R&D vs NZ average*
% firms; 2012
*Note: Total survey sample is 35,976 firms with six or more employee; 600 of these firms are in computer system design.
Source: Statistics New Zealand, Business Operations Survey (2012) 51
47%
33%
4%
30%
26%
8%
2%
6%
Businesses that invested in
expansion
Businesses that undertook R&D Less than 50% in-house More than 50% in-house
Computer System Design NZ average
30% of firms that
performed the
majority of their
R&D in-house.
$759 $754
$930
$1,106
$542
$728
$877
$588
$296 $319
$286
$335
2009 2010 2011 2012
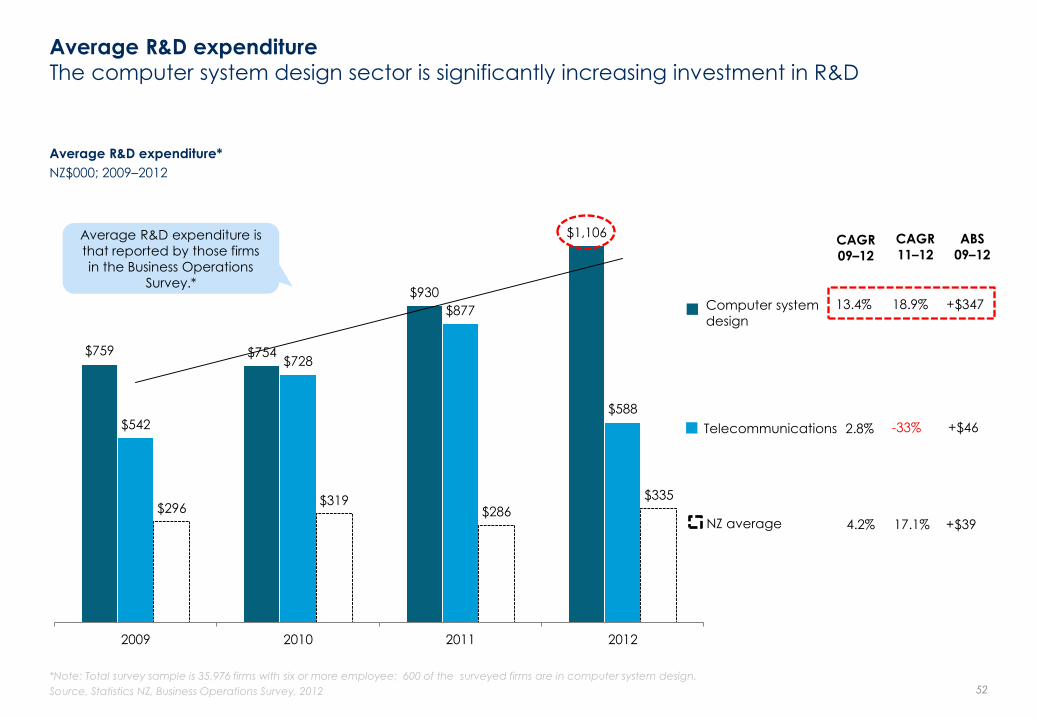
Average R&D expenditure
The computer system design sector is significantly increasing investment in R&D
Average R&D expenditure*
NZ$000; 2009–2012
*Note: Total survey sample is 35,976 firms with six or more employee; 600 of the surveyed firms are in computer system design.
Source, Statistics NZ, Business Operations Survey, 2012 52
CAGR
11–12
ABS
09–12 CAGR
09–12
Computer system
design
NZ average
Telecommunications
18.9% +$347 13.4%
-33% +$46 2.8%
17.1% +$39 4.2%
Average R&D expenditure is
that reported by those firms
in the Business Operations
Survey.*

6%
9%
11%
16%
23%
26%
30%
39%
49%
56%
56%
62%
80%
89%
6%
10%
9%
27%
22%
46%
41%
30%
41%
43%
42%
48%
56%
70%
Crown research institutes, other research institutes, or research…
Government agencies
Universities or polytechnics
Industry or employer organisations
Business from other industries
Suppliers
Professional advisors, consultants, banks or accountants
Other businesses from within the business group
Conferences
Books, journals, patent disclosures or Internet
Competitors and other businesses from the same industry
New staff
Customers
Existing staff
NZ average Computer systems design
Source of ideas for innovation Staff, customers, competitors, and formal and informal business networks are the key
sources of ideas for innovation
Sources of ideas or information for innovation*
% of firms reporting each source; 2011
*Note: Total survey sample is 35,976 firms with six or more employees; 600 of these firms are in computer system design.
Source: Statistics New Zealand, customised data drawn from the Business Operations Survey (2011) 53
Staff and customers
significantly above NZ
average.
Will not total to 100%, as
respondents able to
tick multiple sources.

4%
14%
2%
41%
4%
4%
13%
1%
4%
1%
5%
0.4%
1%
5%
10%
23%
1%
27%
3%
2%
14%
3%
3%
1%
5%
3%
1%
4%
Food, Beverage & Tobacco
Pharmaceuticals, Biotechnology & Life Sciences
Commercial Services & Supplies
Software and Services
Capital Goods
Consumer Durables & Apparel
Technology Hardware & Equipment
Diversified Financials
Consumer Services
Semiconductors & Semiconductors Equipment
Materials
Energy
Media
Health Care Equipment & Services
As a % of total value As a % of total deals
Early stage investment Software and services start-ups are attracting investment
Early stage investment, value and number of deals by industry
% deals and value; 2012
Source: NZVIF, Young Company Finance Report, 2012 54
In 2012 software & services attracted 27% of the
total funds invested, and 41% of all early stage
investment deals. A high number of deals
compared to value indicates lower capital
requirements for IT start-ups.
It is assumed that most of these firms are
classified as computer system design.
Energy, 2%
2% Food /
beverage,
3%
Media /
comms, 7%
Technology,
12%
Other /
undiscolsed,
14%
IT / software,
21%
Health /
biosciences
38%
Manufacturing
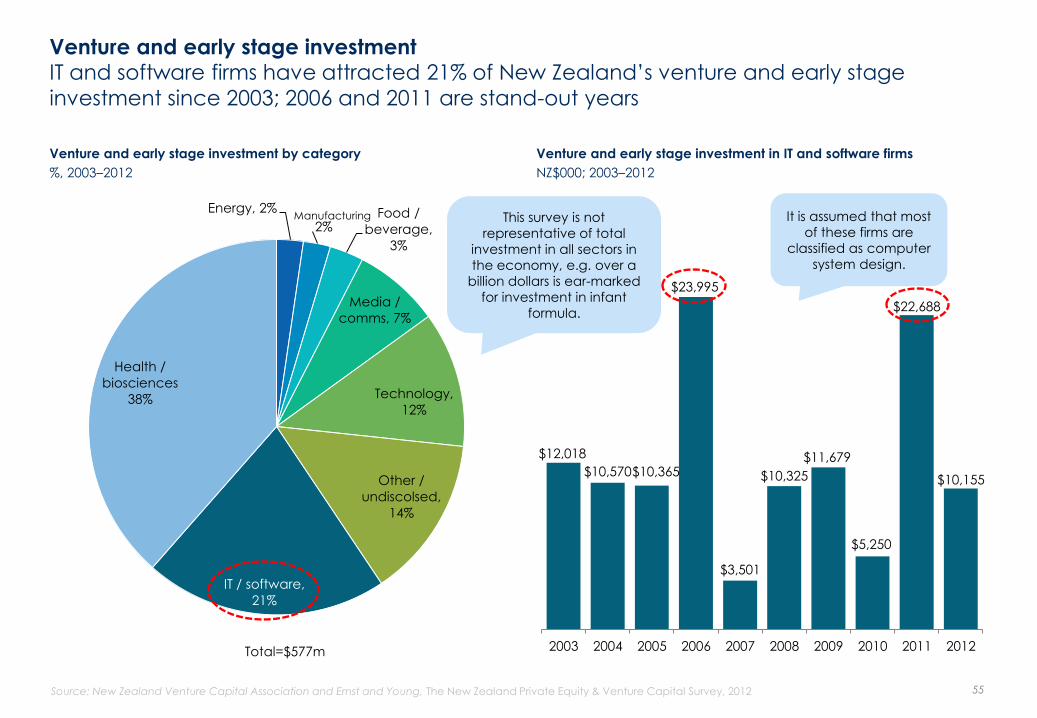
Venture and early stage investment IT and software firms have attracted 21% of New Zealand’s venture and early stage
investment since 2003; 2006 and 2011 are stand-out years
Venture and early stage investment by category
%, 2003–2012
Venture and early stage investment in IT and software firms
NZ$000; 2003–2012
Source: New Zealand Venture Capital Association and Ernst and Young, The New Zealand Private Equity & Venture Capital Survey, 2012 55
$12,018
$10,570 $10,365
$23,995
$3,501
$10,325
$11,679
$5,250
$22,688
$10,155
2003 2004 2005 2006 2007 2008 2009 2010 2011 2012Total=$577m
It is assumed that most
of these firms are
classified as computer
system design.
This survey is not
representative of total
investment in all sectors in
the economy, e.g. over a
billion dollars is ear-marked
for investment in infant
formula.
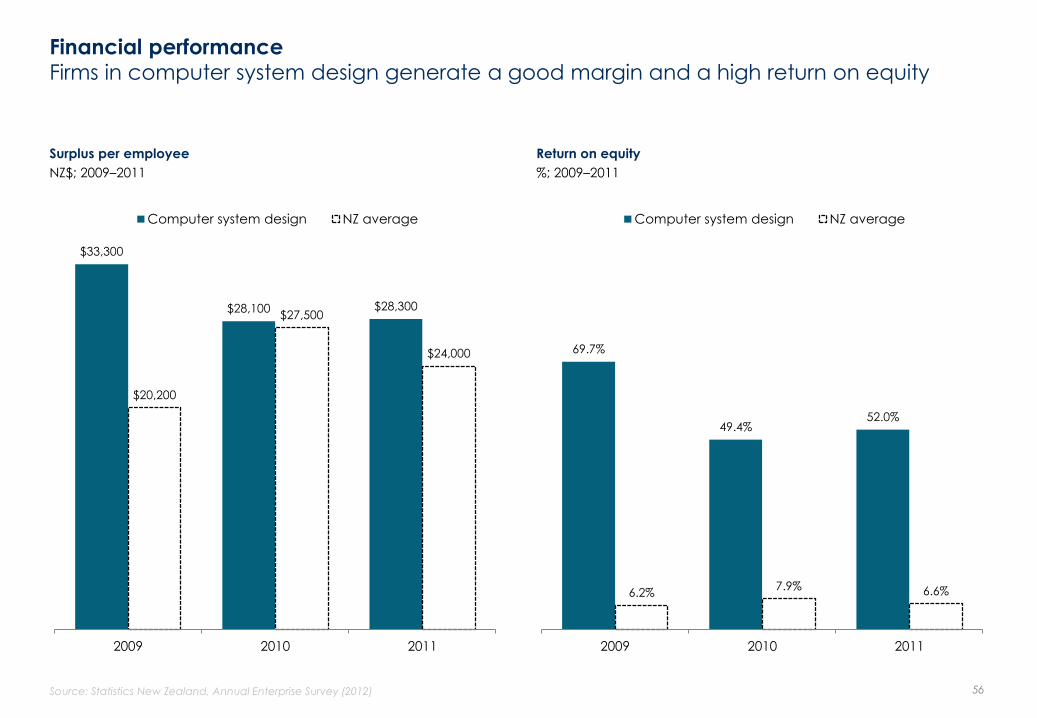
Financial performance Firms in computer system design generate a good margin and a high return on equity
Surplus per employee
NZ$; 2009–2011
Return on equity
%; 2009–2011
Source: Statistics New Zealand, Annual Enterprise Survey (2012) 56
$33,300
$28,100 $28,300
$20,200
$27,500
$24,000
2009 2010 2011
Computer system design NZ average
69.7%
49.4% 52.0%
6.2% 7.9% 6.6%
2009 2010 2011
Computer system design NZ average
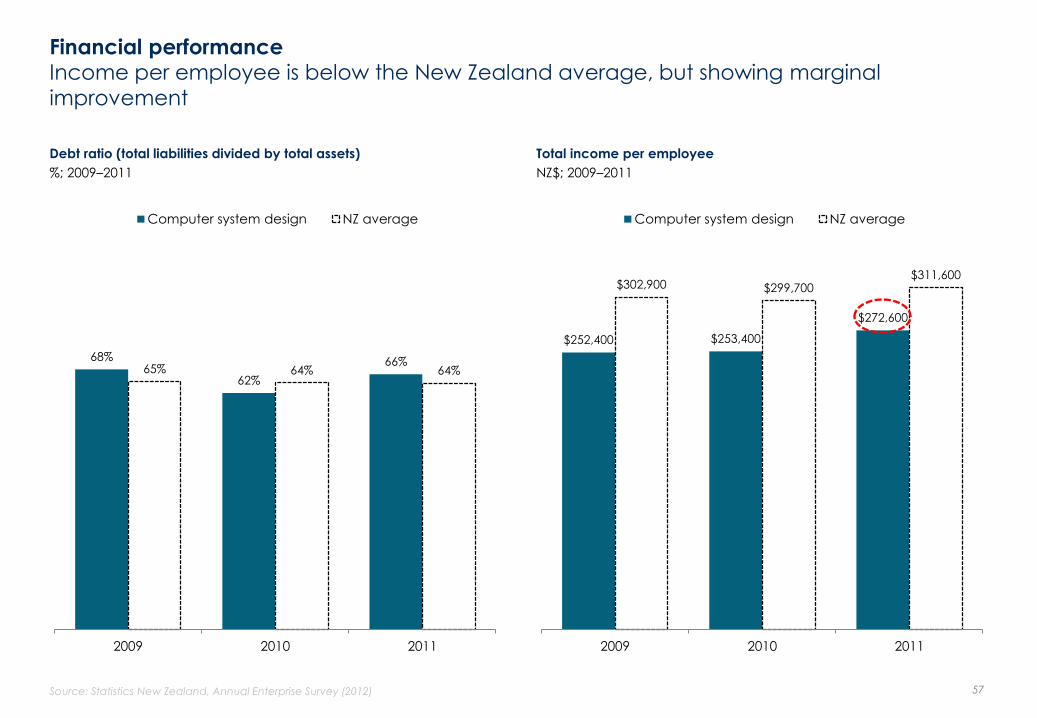
Financial performance Income per employee is below the New Zealand average, but showing marginal
improvement
Debt ratio (total liabilities divided by total assets)
%; 2009–2011
Total income per employee
NZ$; 2009–2011
Source: Statistics New Zealand, Annual Enterprise Survey (2012) 57
68%
62%
66% 65% 64% 64%
2009 2010 2011
Computer system design NZ average
$252,400 $253,400
$272,600
$302,900 $299,700 $311,600
2009 2010 2011
Computer system design NZ average

Strong international connections Foreign investment in computer system design and outward investment by NZ-owned firms
in this sector is significantly higher than NZ average
Computer system design firms with overseas ownership vs NZ
average*
% firms; 2012
Computer system design firms with overseas holdings vs NZ average*
% firms; 2012
*Note: Total survey sample is 35,976 firms with six or more employees; 600 of these firms are in computer system design.
Source: Statistics New Zealand, Business Operations Survey (2012) 58
21%
6%
8%
1%
Computer systems design NZ average
more than 50% foreign owned less than 50% foreign owned
29%
7%
22%
4%
2%
14%
4% 4%
1% 1% 2%
1%
Businesses
with overseas
holdings
Joint venture Acquisition of
existing
overseas
business
Greenfield Other
method
Compter system design NZ average
Method of gaining overseas
ownership or shareholding
Likely to be sales and support offices as well as
some development activities. Reflects need
to be in-market to sell and support complex
products and services.
Industry comment: foreign investment
• I think that one thing you could consider for the next report is some analysis of the value that acquisitions
have on the local economy. There seems to be a school of thought that the acquisition of a local company
by a foreign multi-national is a bad thing and that jobs will be lost offshore. Whilst that may be the case in
the short term, the return on investment to investors and path to “liquidity events” for start-ups is invaluable
and should not be under estimated. Israel is a very good example of this and they focused on their
economy being an “incubator” for ICT companies.
– CE, small-medium IT product firm
59
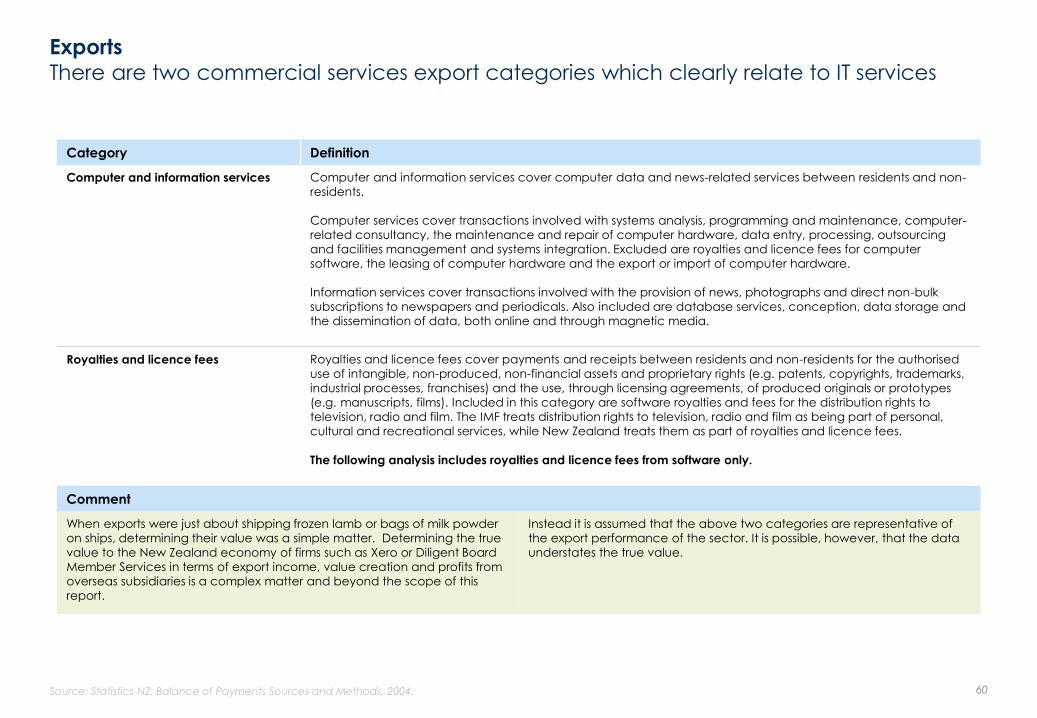
Exports
There are two commercial services export categories which clearly relate to IT services
Category Definition
Computer and information services Computer and information services cover computer data and news-related services between residents and non-
residents.
Computer services cover transactions involved with systems analysis, programming and maintenance, computer-related consultancy, the maintenance and repair of computer hardware, data entry, processing, outsourcing
and facilities management and systems integration. Excluded are royalties and licence fees for computer
software, the leasing of computer hardware and the export or import of computer hardware.
Information services cover transactions involved with the provision of news, photographs and direct non-bulk
subscriptions to newspapers and periodicals. Also included are database services, conception, data storage and
the dissemination of data, both online and through magnetic media.
Royalties and licence fees Royalties and licence fees cover payments and receipts between residents and non-residents for the authorised
use of intangible, non-produced, non-financial assets and proprietary rights (e.g. patents, copyrights, trademarks,
industrial processes, franchises) and the use, through licensing agreements, of produced originals or prototypes
(e.g. manuscripts, films). Included in this category are software royalties and fees for the distribution rights to
television, radio and film. The IMF treats distribution rights to television, radio and film as being part of personal,
cultural and recreational services, while New Zealand treats them as part of royalties and licence fees.
The following analysis includes royalties and licence fees from software only.
Comment
When exports were just about shipping frozen lamb or bags of milk powder
on ships, determining their value was a simple matter. Determining the true
value to the New Zealand economy of firms such as Xero or Diligent Board
Member Services in terms of export income, value creation and profits from
overseas subsidiaries is a complex matter and beyond the scope of this
report.
Instead it is assumed that the above two categories are representative of
the export performance of the sector. It is possible, however, that the data
understates the true value.
Source: Statistics NZ: Balance of Payments Sources and Methods, 2004. 60

Trade balance: royalties and licence fees received for software New Zealand pays twice as much in royalties and licence fees for imported software as it
receives from exported software
Source: Statistics NZ: Balance of Payments 61
$88 $106 $105 $112 $117
$157 $132
$171 $174 $169 $173 $205
$260 $267
2006 2007 2008 2009 2010 2011 2012
Exports Imports
Royalties and licence fees received for software; exports versus imports
NZ$m; 2006–2012
CAGR
06–12
7%
7.7%
June years
Deficit in 2012
= $135m.
Imports twice that of
exports.

Trade balance: computer and information services Exports of computer and information services have grown faster than imports
Computer and information services: exports versus imports
NZ$m; 2006–2012
Source: Statistics NZ: Balance of Payments 62
$288 $312 $353 $405 $444
$504 $531
$401 $420 $505
$576 $529 $623 $649
2006 2007 2008 2009 2010 2011 2012
Exports ImportsCAGR
06–12
11%
8%
June years
Deficit in 2012
= $118m.

Royalties and
license fees
for computer
services $50. $67. $73. $62. $80. $102. $102. $113. $113.
$150. $141.
$214.
$256. $221. $265.
$277.
$315. $333.
$403. $412.
$508. $518.
$264
$323
$294
$327
$357
$417 $435
$516 $525
$658 $659
2002 2003 2004 2005 2006 2007 2008 2009 2010 2011 2012
Export growth Exports of IT services have grown at 10% per annum since 2002, driven by computer and
information services
IT services exports by category
NZ$m; 2002–2012
Source: Statistics NZ: Balance of Payments 63
Total
CAGR
11–12
ABS
06–12
CAGR
02–12
0.2% +395 10%
2% +304 9%
-6% +91 11%
Computer
and
information
services
March years
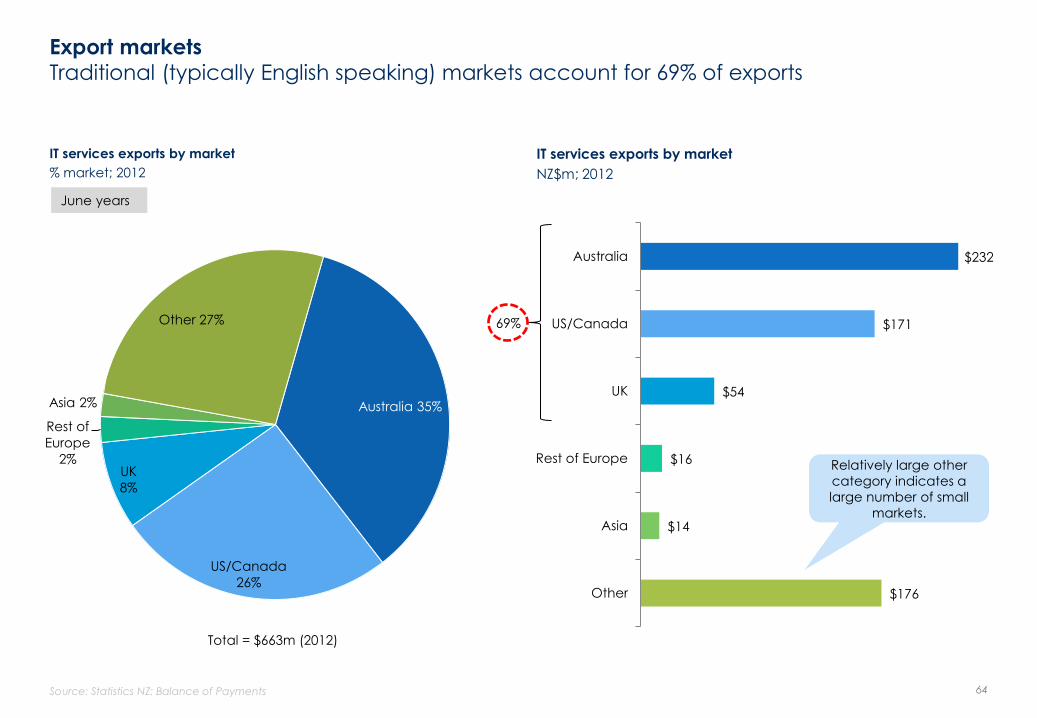
Australia 35%
US/Canada
26%
UK
8%
Rest of
Europe
2%
Asia 2%
Other 27%
Export markets
Traditional (typically English speaking) markets account for 69% of exports
IT services exports by market
% market; 2012
IT services exports by market
NZ$m; 2012
Source: Statistics NZ: Balance of Payments 64
$176
$14
$16
$54
$171
$232
Other
Asia
Rest of Europe
UK
US/Canada
Australia
Total = $663m (2012)
Relatively large other
category indicates a
large number of small
markets.
June years
69%
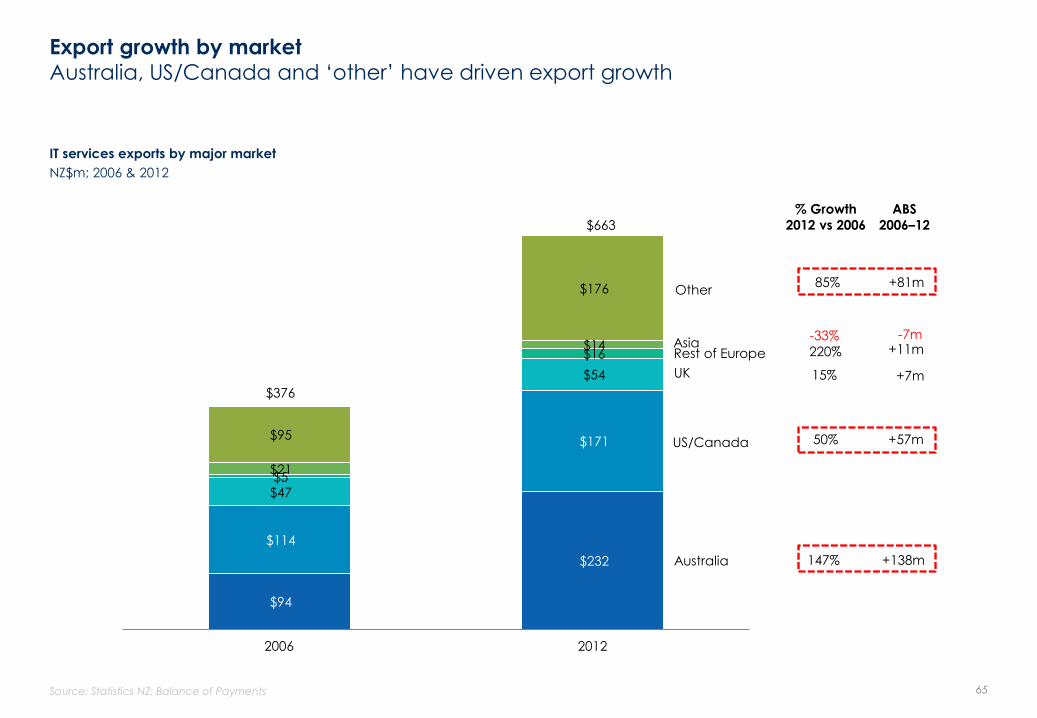
Export growth by market Australia, US/Canada and ‘other’ have driven export growth
IT services exports by major market
NZ$m; 2006 & 2012
Source: Statistics NZ: Balance of Payments 65
$94
$232
$114
$171
$47
$54
$5
$16
$21
$14
$95
$176
2006 2012
Other
Asia Rest of Europe
UK
US/Canada
Australia
% Growth
2012 vs 2006
ABS
2006–12
+81m 85%
-7m -33% +11m 220%
+7m 15%
+57m 50%
+138m 147%
$663
$376

Barriers to exporting for existing exporters Access to finance and distance are the top barriers; exchange rate is less of a barrier than
for other sectors
Number of exporting firms reporting the following factors as barrier to exporting
% exporting firms; 2011
Source: Statistics NZ: Business Operations Survey, 2011 66
30% 30%
27% 26%
25%
15%
32%
43%
17%
24%
32% 32%
37%
21%
18%
Limited access to finance Distance from markets Exchange rate volatility Other Limited experience in
expanding beyond NZ
Computer systems design High technology manufacturing All sectors
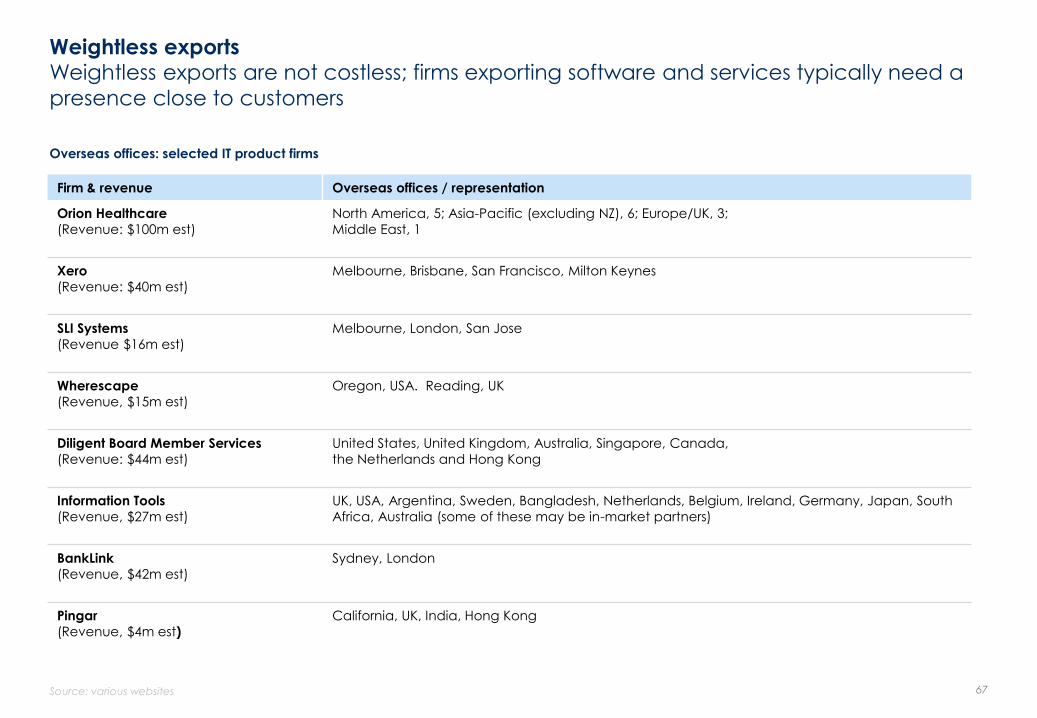
Weightless exports Weightless exports are not costless; firms exporting software and services typically need a
presence close to customers
Firm & revenue Overseas offices / representation
Orion Healthcare
(Revenue: $100m est)
North America, 5; Asia-Pacific (excluding NZ), 6; Europe/UK, 3;
Middle East, 1
Xero
(Revenue: $40m est)
Melbourne, Brisbane, San Francisco, Milton Keynes
SLI Systems
(Revenue $16m est)
Melbourne, London, San Jose
Wherescape
(Revenue, $15m est)
Oregon, USA. Reading, UK
Diligent Board Member Services
(Revenue: $44m est)
United States, United Kingdom, Australia, Singapore, Canada,
the Netherlands and Hong Kong
Information Tools
(Revenue, $27m est)
UK, USA, Argentina, Sweden, Bangladesh, Netherlands, Belgium, Ireland, Germany, Japan, South
Africa, Australia (some of these may be in-market partners)
BankLink
(Revenue, $42m est)
Sydney, London
Pingar
(Revenue, $4m est)
California, UK, India, Hong Kong
Overseas offices: selected IT product firms
Source: various websites 67

Weightless exports: industry comment
• Our market basically is completely off-shore. Ninety per cent of our revenue is from the US, but we do have
customers in Europe and are chasing a few in Asia. Our chief executive has spent most of the last three
years in the US. You have to educate the market on how to use our product. You‟ve got to be there to get
wins. You can‟t do that remotely. It‟s only really in the last six months that we‟ve got the funding to start
building the team on the ground there.
– Executive, small IT product business
• „Weightless‟ is a bit of a misnomer. There is a substantial cost overseas incurred in delivering your products
and services to customers. Yes, you don‟t have to pay for a ship. But you can‟t sit in New Zealand and sell
and support your products entirely over the Internet. Delivering software over the Internet is weightless, but it
would be very rare that that was all that was involved. Normally you have to have people conducting sales
in market and providing after-sales support and maintenance. Customisation, though, can be brought back
to New Zealand.
– Partner, technology law firm
• I don‟t see in any way that people are going to value knowledge less in years to come. And I don‟t see any
way that new technologies are going to eliminate the incredible value of being right there… there is a huge
amount of evidence to suggest that in many cases face to face contact and electronic technologies are
compliments rather than substitutes. If you look at actually when people call each other, they are more likely
to call each other if they are physically close to each other. The most famous example of geographic
concentration in the world today is the highest tech industry with the biggest ability to actually connect
electronically – Silicon Valley. So its very hard to make a case from the evidence that e-technologies are
going to make in any sense face-to-face contact obsolete, and there are a lot of things to suggest it‟s going
to create a more interactive, more urban world.
– Edward Glaeser, Fred and Eleanor Glimp Professor at the Department of Economics, Harvard
University, London Schools of Economics Public Lecture podcast, 14 March 2011
68

TELECOMMUNICATIONS
69

Telecommunications Telecommunications is made up of five sub-sectors covering a range of activities (e.g.
wired versus mobile networks)
70
Sub-sector Description ANZSIC code Example firms
Wired
telecommunications
network operation
Firms engaged in:
• international telephone network operation (wired)
• local telephone network operation (wired)
• long distance telephone network operation (wired)
• telecommunications network operation (wired)
J5801 Chorus
Other
telecommunications
network operation
Firms engaged in:
• mobile telecommunications network operation
• satellite telecommunications network operation
• wireless telecommunications network operation
J5802 2Degrees
Other
telecommunications
services
Firms engaged in providing a range of other telecommunication services
such as paging services and other specialised telecommunications
applications. Also included are telecommunications resellers purchasing
access and network capacity from telecommunication carriers
J5809 Callplus
Internet service
providers and web
search portals
Firms engaged in providing internet access services. Also included are firms
which provide web search portals used to search the Internet
J5910 Inspire.net
Telecommunication
goods wholesaling
Firms mainly engaged in wholesaling telecommunication goods, e.g. mobile
phones; communications equipment, electric cable ducting systems,
telephone accessories etc
F3493 Atrax Group

Telecommunications: example firms The sector is dominated by a few large companies with a number of smaller providers
Brief profile of selected firms in the telecommunications sector
2012 or as available
Source: * from 2012 annual report . **Kompass estimate 71
Firms Revenue Number of employees Ownership Description
Telecom $4,576m* 6948 Listed (NZX) Full range of telecommunications services
Vodafone $1620m* 1938 Listed (LSE;
NASDAQ)
Full range of telecommunications services
Chorus $613m
(7 months)*
2500 Listed (NZX) Own and manage the local telephone
exchanges, cabinets and copper and fibre
cables
Kordia $399m* 784 NZ Government Broadcasting transmission and
telecommunications services
Alcatel-Lucent $236m** 600 Listed (Euronext;
NYSE)
Provider of telecommunications solutions and
equipment
2Degrees $185m 300 NZ/Foreign Mobile telecommunications
Citylink $8.2m** 32 NZ private Telecommunications services and broadband
connectivity
Farmside $21m (est) 80 NZ private Satellite telecommunications network operator
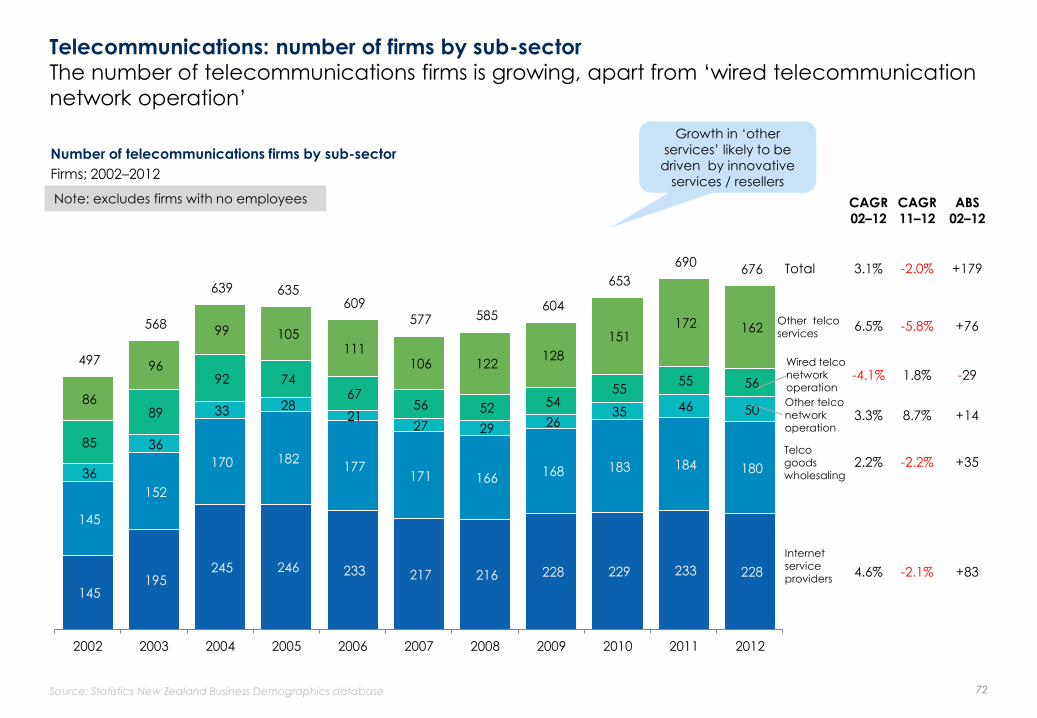
145 195
245 246 233 217 216 228 229 233 228
145
152
170 182 177
171 166 168 183 184 180 36
36
33 28 21
27 29 26 35 46 50
85
89
92 74 67
56 52 54 55
55 56
86
96
99 105 111
106 122 128
151 172 162
497
568
639 635 609
577 585 604
653
690 676
2002 2003 2004 2005 2006 2007 2008 2009 2010 2011 2012
Telecommunications: number of firms by sub-sector The number of telecommunications firms is growing, apart from ‘wired telecommunication
network operation’
Number of telecommunications firms by sub-sector
Firms; 2002–2012
Source: Statistics New Zealand Business Demographics database
Growth in ‘other
services’ likely to be
driven by innovative
services / resellers
72
Telco goods wholesaling
Other telco network operation
Other telco services
Internet service providers
Total
Wired telco network operation
CAGR
11–12
ABS
02–12
CAGR
02–12
-5.8%
-2.2%
+14
+35
1.8% -29
6.5%
3.3%
2.2%
-4.1%
-2.1% +83 4.6%
8.7%
+76
-2.0% +179 3.1%
Note: excludes firms with no employees

Telecommunications: number of employees by sub-sector Following four years of no growth, employment grew in 2012 driven by ‘other
telecommunications network operation’
Number of telecommunications employees by sub-sector
Employees; 2002–2012
Note: Statistics New Zealand Business Demographics database (excludes department stores) 73
Telco goods wholesaling
Other telco network operation
Other telco services
ISPs
Total
Wired telco network operation
CAGR
11–12
ABS
02–12
CAGR
02–12
690 790 770 660 770 740 830 660 730 790 820
1,420 1,080 1,340 1,720 1,830 1,720 1,910 2,070 1,910 1,910 1,840
1,980 1,870
2,120 2,420
2,620 2,590 2,160 2,260 2,270 2,540 3,200
6,200
5,510 5,690
6,280
6,710 7,700
8,780 8,480 8,290 8,100
8,360 380
380 260
190
170
170
200 460 630 690
760
10,670
9,630 10,180
11,270
12,100
12,920
13,880 13,930 13,830 14,030
14,980
2002 2003 2004 2005 2006 2007 2008 2009 2010 2011 2012
10.1%
-3.7%
+1,220
+420
3.2% +2,160
7.2%
4.9%
2.6%
3.0%
3.8% +130 1.7%
26.0%
+380
6.8% +4,310 3.5%
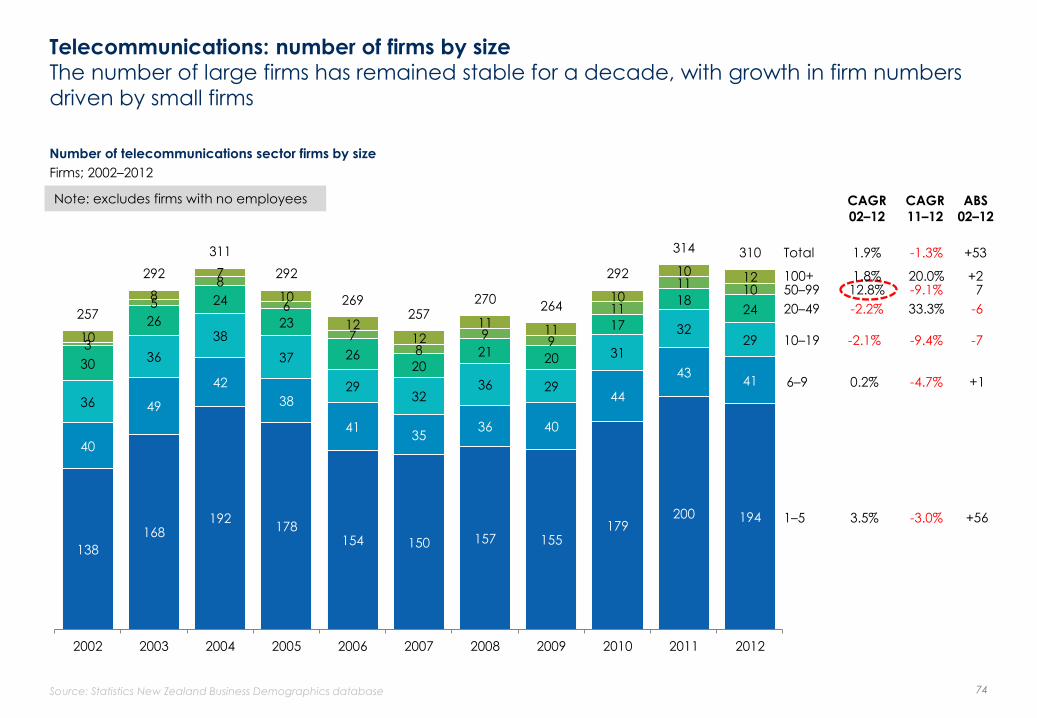
12.8%
138
168 192
178 154 150 157 155
179 200 194
40
49
42
38
41 35
36 40
44
43 41
36
36
38
37
29 32
36 29
31
32 29
30
26
24
23
26 20
21 20
17
18 24
3
5
8
6
7 8
9 9
11
11 10
10
8
7
10
12 12
11 11
10
10 12
257
292
311
292
269 257
270 264
292
314 310
2002 2003 2004 2005 2006 2007 2008 2009 2010 2011 2012
Telecommunications: number of firms by size The number of large firms has remained stable for a decade, with growth in firm numbers
driven by small firms
Number of telecommunications sector firms by size
Firms; 2002–2012
Source: Statistics New Zealand Business Demographics database 74
10–19
20–49
50–99 100+
-9.1%
-9.4%
-6
-7
20.0% +2
-2.2%
-2.1%
1.8%
6–9 -4.7% +1 0.2%
1–5 -3.0% +56 3.5%
33.3%
CAGR
11–12
ABS
02–12
CAGR
02–12
Total -1.3% +53 1.9%
Note: excludes firms with no employees
7

-2.4%
-1.9% -11.6% +10 0.0% 0.3%
Telecommunications: employment by firm size Large firms account for three-quarters of employment and have driven employment
growth
Number of telecommunications sector employees by firm size
Employees; 2002–2012
Note: Statistics New Zealand Business Demographics database (excludes department stores) 75
340 380 470 420 370 370 350 370 410 420 410 290 350 300 280 300 240 260 280 310 300 300 460 480 510 510 380 430 470 400 450 430 380
980 830 750 760 790 620 620 640 500 560 740
190 280 570 430 460 530 580 550 770 760 730
8,430 7,300
7,570 8,890
9,780 10,750
11,590 11,700 11,400 11,580 12,440
10,670
9,620 10,180
11,280
12,100
12,930
13,880 13,930 13,830 14,050
14,980
2002 2003 2004 2005 2006 2007 2008 2009 2010 2011 2012
10–19 20–49
50–99
100+
-3.9%
-240 -80
7.4% +4,010
14.4%
-2.8%
4.0%
6–9 1–5 +70 1.9%
32.1%
+540
CAGR
11–12
ABS
02–12
CAGR
02–12
Total 6.6% +4,310 3.5%

76

THE DIGITAL ECONOMY
77

Moore’s Law Computing power is growing at an exponential rate
Microprocessor transistor counts 1971–2011
Number of transistors
Source (chart): Wgsimon, "Transistor Count and Moore's Law - 2011.svg" via Wikipedia used under a Creative Commons Attribution-ShareAlike license: http://creativecommons.org/licenses/by-sa/3.0/ 78
iPhone 1 (2007): 620MHz
ARM CPU, 128 megabytes
of memory.
iPhone 5 (2012): 1,300 MHz
dual core CPU (2x iPhone1)
with a gigabyte of RAM (8x
iPhone 1).
Named after Intel founder
Gordon E Moore, Moore's
Law is the observation that
over the history of
computing hardware, the
number of transistors on
integrated circuits doubles
approximately every two
years. The effect of this is
that computing
performance is improving
exponentially.

Impact of Moore’s Law New applications are driving disruptive change in social and economic activities
• Computer power is getting bigger and cheaper at rates that are really hard to wrap your mind around. Moore‟s Law says
that computing power essentially doubles every 18 to 24 months, and you think „I can get my mind around doubling‟.
When you do that 10, 20 times, our minds can‟t picture that kind of exponential growth…. What‟s different now is that
each doubling is on a much larger base than before… A huge underappreciated force and one that‟s getting bigger all
the time… is the astonishing abilities that computers and robots are now demonstrating, that were the stuff of science
fiction even 10 years ago.
– Andrew McAfee, Principal Research Scientist, MIT Centre for Digital Business, interview on GlobalBiz, BBC podcast,
30 March 2013
• In 2004 we used to teach a book that had a set of technologies that humans could do well and a set of technologies
that machines could do well. The canonical example they gave, that humans could do well and machines could not,
was driving a truck. There was just too much real time information coming in. There are no formal rules…. I was teaching
my students as recently as 2005 that that was something machines just weren‟t going to be able to do anytime soon.
– Andrew McAfee, Principle Research Scientist, MIT Centre for Digital Business, interview on GlobalBiz, BBC podcast,
30 March 2013
• With digitisation, the change that can happen in all industries is massive…. We have a rare transition happening right
now. Not all generations get to live through a radical transformation. Most get to optimise current assumptions. And I
believe the biggest challenge for management is that you need to radically challenge existing assumptions, because
otherwise what you are doing is creating incremental improvement. And if you see what happened to the music industry,
and if you see what‟s happening in the other extreme, in mining, these are not incremental. These are pretty radical
adjustments to business models.
– Jim Hagemann Snabe, co-Chief Executive, SAP, London School of Economics Public Lecture, 21 February 2013
• Part of the technology change related to microprocessor transistor counts, is the move to multicore and parallel
processing. This involves a radical paradigm shift in software engineering for computer intensive applications (a rapidly
growing area with image, sound and signal processing in particular, and now reaching handheld computing); this has
major implications for computer programming education.
– New Zealand ICT industry specialist, 2013
79

The digital economy
ICT is driving change in every sector, as these examples show; arguably ‘every company is
now a software company’*
Sector Firm Examples
Food and beverage Fonterra • Fonterra’s online auction Global Dairy Trade platform is changing the nature of price discovery.
• Fonterra’s Crawford Street facility includes a high-tech cool store with automated stacking
robots.
Mining Rio Tinto • Rio Tinto is to become the owner of the world's largest fleet of driverless trucks after it signed a
deal to buy at least 150 from Komatsu Limited over the next four years... These 150 new trucks will
work with our pioneering Operations Centre that integrates and manages the logistics of 14
mines, three ports and two railways. – Rio Tinto website
Manufacturing and
services converging
Tait Communications • Tait Communications reports that services now account for 25% of sales from services. Software is
embedded in products.
• We are still fixated on this manufacturing versus services distinction, and if you look at what
manufacturing does… it does these designs, it writes this software, it invests in these new business
processes. All of which you might regard as service activity . The boundaries between these two
industry activities are getting very blurred. – Jonathan Haskel, Professor of Economics at Imperial
College Business School, London, interview on Peter Day’s In Business, BBC podcast, 4 April, 2013
Media TVNZ
Sky TV
• The popularity of TVNZ Ondemand continues to go from strength to strength with video streams
up a massive 41 per cent year-on-year in 2012. In 2012 the most watched programme on TVNZ
Ondemand was home-grown soap Shortland Street, achieving more than 4.9 million streams.
– press release, TVNZ, 26 February 2013
• Coliseum Sports Media is set to deliver to New Zealanders all 380 games of the English football
Premier League via an online platform after out-bidding Sky TV for the rights.
Retailing All retailers • A Roy Morgan poll found that 65 per cent of people over 14 bought something online in
December 2012 – nzherald.co.nz, 4 April 2013.
• Online sales are changing retailing. The Internet has revolutionised completely everything… retail
has got to become a really sophisticated animal. – retired fashion designer Ashley Fogel, Radio NZ
interview, 2012
Agriculture Re Gen Ltd • Re Gen technology takes farm level data on key variables such as rainfall and soil and
continuously sends this information through the Internet to a central database. The Re Gen
solution synthesises thousands of individual measurements, best practice guidelines, regional
council regulations and farm-specific limitations into a simple daily text message, providing a
recommendation to the farmer to guide effluent irrigation. – www.regnerated.co.nz
*Source: David Kirkpatrick: Now Every Company is a Software Company, 30 November, 2011. Available at www.forbes.com
80

ICT occupations There are 18 occupations classified as ICT; many ICT workers are employed in other sectors
in the economy
ICT occupations
• ICT Managers • Computer Network Professionals
• ICT Trainers • ICT Support and Test Engineers
• ICT Sales Professionals • Telecommunications Engineering Professionals
• Web Designers • Electronic Engineering Draftspersons, Technicians
• Electronics Engineers • ICT Support Technicians
• ICT Business and Systems Analysts • Telecommunications Technical Specialists
• Multimedia Specialists and Web Developers • Electronics Trades Workers
• Software and Applications Programmers • Telecommunications Trades Workers
• Database & Systems Administrators & ICT Security • ICT Sales Assistants
Source: Employment estimates, MBIE 81

162
431
472
606
669
1,053
1,159
1,360
1,862
1,942
2,020
2,705
3,262
3,444
4,518
4,662
4,938
5,858
21,129
Petroleum & minerals
Accommodation & restaurants
Agriculture, forestry & fishing
Property, rental & hiring services
Arts & recreation
Utilities
Logistics
Administrative & support services
Retail trade
Health
Other services
Financial & insurance
Construction
Wholesale trade
Education
All manufacturing
Media & telecommunications
Government, defence & public…
Professional services
53
225
299
305
404
615
869
1,215
1,474
1,614
2,270
2,627
3,333
3,384
4,175
4,256
4,315
4,322
15,313
Petroleum & minerals
Accommodation & restaurants
Arts & recreation
Agriculture, forestry & fishing
Property, rental & hiring services
Utilities
Logistics
Health
Retail trade
Administrative & support services
Other services
Financial & insurance
Education
Construction
Wholesale trade
All manufacturing
Media & telecommunications
Government, defence & public…
Professional services
Total ICT workers by New Zealand sector, 2003 versus 2012 The economy has added 11,184 workers in ICT occupations since 2003; a third are
employed in the professional services sector
Number of workers in ICT occupations by sector
ICT workers; 2003
Number of workers in ICT occupations by sector
ICT workers; 2012
Source: Detailed Employment Estimates, MBIE analysis, calculated from the Household Labour Force Survey and the Linked Employer-Employee Data and historical censuses. 82
Total ICT workers
in 2012 = 62,252
+11,184.
Total ICT workers
in 2003 = 51,068.
Includes the
computer system
design sub-sector.

Absolute change in ICT jobs by sector, 2003–2012
The professional services sector accounted for 52% of growth in ICT jobs; wholesale trade
reduced its ICT workforce
Absolute change in number of workers in ICT occupations by sector
ICT workers; 2003–2012
Source: Detailed Employment Estimates, MBIE analysis, calculated from the Household Labour Force Survey and the Linked Employer-Employee Data and historical censuses. 83
-731
-254
-250
-122
78
109
167
202
206
290
370
388
406
438
623
727
1,185
1,536
5,816
Wholesale trade
Administrative & support services
Other services
Construction
Financial & insurance
Petroleum & minerals
Agriculture, forestry & fishing
Property, rental & hiring services
Accommodation & restaurants
Logistics
Arts & recreation
Retail trade
All manufacturing
Utilities
Media & telecommunications
Health
Education
Government, defence & public safety
Professional services
These jobs may have
been outsourced to
firms in professional
services, such as
Datacom or Fujitsu.
52% of job
growth since
2003.
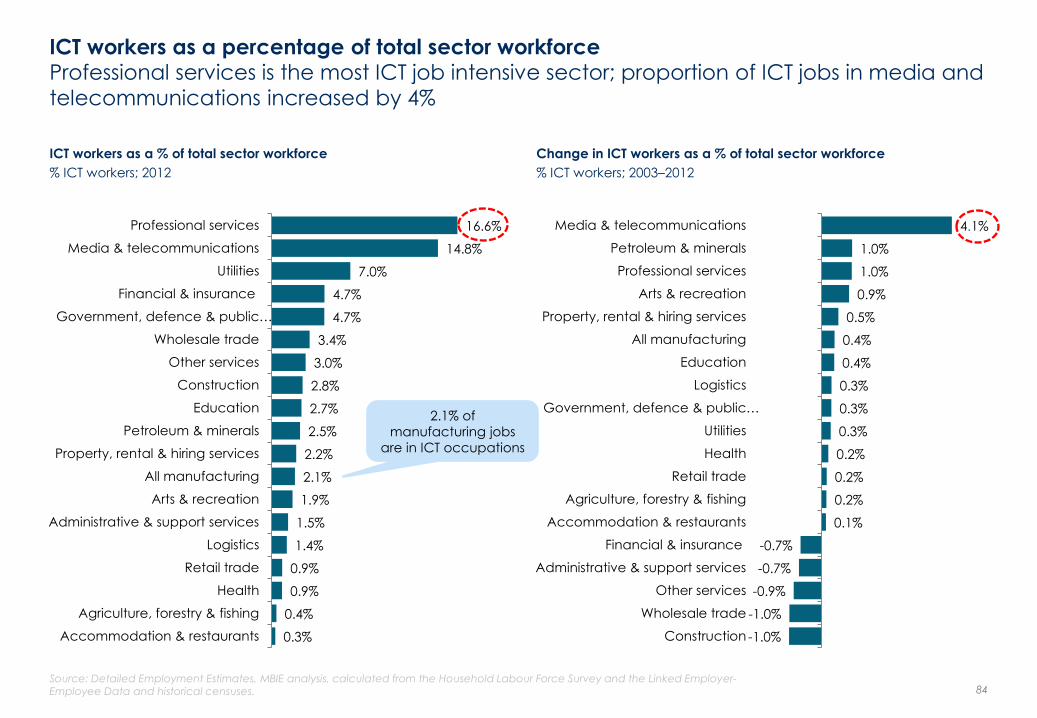
C
0.3%
0.4%
0.9%
0.9%
1.4%
1.5%
1.9%
2.1%
2.2%
2.5%
2.7%
2.8%
3.0%
3.4%
4.7%
4.7%
7.0%
14.8%
16.6%
Accommodation & restaurants
Agriculture, forestry & fishing
Health
Retail trade
Logistics
Administrative & support services
Arts & recreation
All manufacturing
Property, rental & hiring services
Petroleum & minerals
Education
Construction
Other services
Wholesale trade
Government, defence & public…
Financial & insurance
Utilities
Media & telecommunications
Professional services
-1.0%
-1.0%
-0.9%
-0.7%
-0.7%
0.1%
0.2%
0.2%
0.2%
0.3%
0.3%
0.3%
0.4%
0.4%
0.5%
0.9%
1.0%
1.0%
4.1%
Construction
Wholesale trade
Other services
Administrative & support services
Financial & insurance
Accommodation & restaurants
Agriculture, forestry & fishing
Retail trade
Health
Utilities
Government, defence & public…
Logistics
Education
All manufacturing
Property, rental & hiring services
Arts & recreation
Professional services
Petroleum & minerals
Media & telecommunications C
ICT workers as a percentage of total sector workforce Professional services is the most ICT job intensive sector; proportion of ICT jobs in media and
telecommunications increased by 4%
ICT workers as a % of total sector workforce
% ICT workers; 2012
Change in ICT workers as a % of total sector workforce
% ICT workers; 2003–2012
Source: Detailed Employment Estimates, MBIE analysis, calculated from the Household Labour Force Survey and the Linked Employer-Employee Data and historical censuses. 84
2.1% of
manufacturing jobs
are in ICT occupations

Services exports attributed
to the ICT sector
(OECD definition)
$1,119m
Goods exports
attributed to ICT sector
(OECD definition)
$731m
Computer services exports
from other sectors
$140m
Communications services
exports from other sectors
$74m
Software exports from
other sectors
$9m
Digital economy exports Exports attributed to the digital economy are between $1 and $2b, depending on the
definition
Digital economy exports by ICT sector and all other sectors
Exports, NZ$m, 2012
Source: Statistics NZ; MBIE analysis 85
Total exports = $2,073m
Treat as illustrative
Includes goods exports from those
high technology firms also classified
as ICT manufacturers.
Includes communications exports.
Excludes some categories that
may include revenues derived from
digital products, e.g. royalties.
Many non-IT firms may export IT
services or software, e.g. manufacturers (Framecad and Tait
Communications are examples).
This total double counts exports
from other sectors, so is not
additional.
In terms of the digitisation of
economic activities, all exports will
be ICT enabled in one form or another, e.g. through RFID tags,
tracking, logistics, electronic
payments systems.

86

APPENDIX glossary, terms, definitions, sources and
limitations
87

88
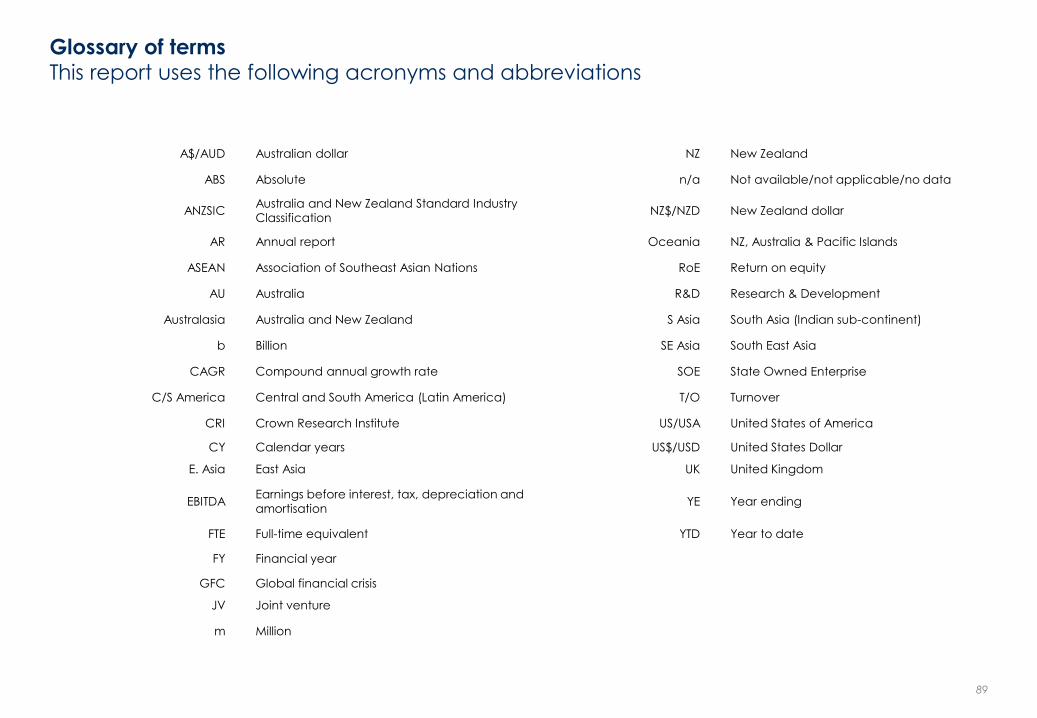
Glossary of terms This report uses the following acronyms and abbreviations
A$/AUD Australian dollar NZ New Zealand
ABS Absolute n/a Not available/not applicable/no data
ANZSIC Australia and New Zealand Standard Industry
Classification NZ$/NZD New Zealand dollar
AR Annual report Oceania NZ, Australia & Pacific Islands
ASEAN Association of Southeast Asian Nations RoE Return on equity
AU Australia R&D Research & Development
Australasia Australia and New Zealand S Asia South Asia (Indian sub-continent)
b Billion SE Asia South East Asia
CAGR Compound annual growth rate SOE State Owned Enterprise
C/S America Central and South America (Latin America) T/O Turnover
CRI Crown Research Institute US/USA United States of America
CY Calendar years US$/USD United States Dollar
E. Asia East Asia UK United Kingdom
EBITDA Earnings before interest, tax, depreciation and
amortisation YE Year ending
FTE Full-time equivalent YTD Year to date
FY Financial year
GFC Global financial crisis
JV Joint venture
m Million
89

Applying the OECD’s definition, the four industries below are classified as part
of the ICT sector.
Note: how statisticians define the industry and how the industry sees itself
may be very different.
ICT definition OECD definition for information and communications technology (ICT)
*Australia & New Zealand Standard Industrial Classification 2006 (ANZSIC).
Source: Statistics NZ; OECD definitions (ISIC 3.1 version)
90
The OECD definition includes telecommunications goods and services, but
excludes internet publishing and broadcasting. The ICT sector is defined as:
• goods and services which enable the function of information processing
and communication by electronic means including transmission and
display
• goods which use electronic processing to detect, measure and/or
record physical phenomena or control a physical process.
ANZSIC code* Description New Zealand examples
Telecommunications
J580100 Wired telecommunications network operation Chorus
J580200 Other telecommunications network operation 2Degrees
J580900 Other telecommunications services CallPlus
J591000 Internet service providers and web search portals Inspire.net
F349300 Telecommunication goods wholesaling Atlas Gentech
IT services (software and computer services)
L663900 Other goods and equipment rental and hiring not elsewhere classified Vidcom New Zealand
M700000 Computer system design and related services Orion Health
J542000 Software publishing Pingar
J592100 Data processing and web hosting services Revera
J592200 Electronic information storage services Paymark
S942200 Electronic (except domestic appliance) and precision equipment repair and maintenance Kinetics Group Ltd
ICT manufacturing
C242100 Computer and electronic office equipment manufacturing Smartrak
C243100 Electric cable and wire manufacturing General Cable Superconductors
C242900 Other electronic equipment manufacturing Rakon
C242200 Communication equipment manufacturing Tait Communications
C241900 Other professional and scientific equipment manufacturing Atrak Group
IT wholesaling (Mainly importers, equipment providers)
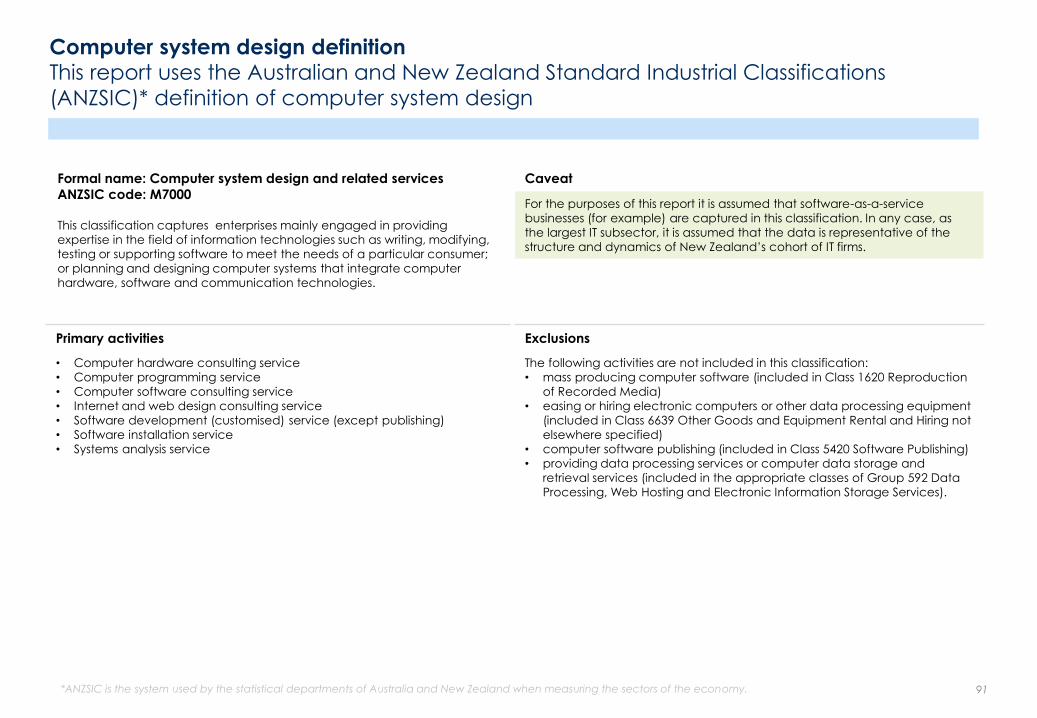
Computer system design definition This report uses the Australian and New Zealand Standard Industrial Classifications
(ANZSIC)* definition of computer system design
91
Caveat
For the purposes of this report it is assumed that software-as-a-service
businesses (for example) are captured in this classification. In any case, as
the largest IT subsector, it is assumed that the data is representative of the
structure and dynamics of New Zealand’s cohort of IT firms.
Formal name: Computer system design and related services
ANZSIC code: M7000
This classification captures enterprises mainly engaged in providing
expertise in the field of information technologies such as writing, modifying,
testing or supporting software to meet the needs of a particular consumer;
or planning and designing computer systems that integrate computer
hardware, software and communication technologies.
*ANZSIC is the system used by the statistical departments of Australia and New Zealand when measuring the sectors of the economy.
Primary activities
• Computer hardware consulting service
• Computer programming service
• Computer software consulting service
• Internet and web design consulting service
• Software development (customised) service (except publishing)
• Software installation service
• Systems analysis service
Exclusions
The following activities are not included in this classification:
• mass producing computer software (included in Class 1620 Reproduction
of Recorded Media)
• easing or hiring electronic computers or other data processing equipment
(included in Class 6639 Other Goods and Equipment Rental and Hiring not
elsewhere specified)
• computer software publishing (included in Class 5420 Software Publishing)
• providing data processing services or computer data storage and
retrieval services (included in the appropriate classes of Group 592 Data
Processing, Web Hosting and Electronic Information Storage Services).

Terms and definitions The report uses the following economic metrics
Term Definition Comment
Nominal GDP
(gross domestic product)
The value of goods and services produced in New Zealand, after
deducting the cost of goods and services used in the production
process. ‘Nominal’ means not adjusted for inflation.
Cross-cutting sectors (excluding tourism) Value added has been used to provide
indicative estimates. These have not been
verified through the System of National Accounts.
Real GDP
(gross domestic product)
GDP adjusted to remove the effect of price changes/inflation to
show the change in the volume of goods and services produced in
New Zealand. In this report, it is expressed in constant 2010 prices.
Cross-cutting sectors (excluding tourism) Data not available.
Goods exports The value of goods of domestic origin (excluding re-exports)
exported from New Zealand to another country.
Note: sector exports values will exclude items suppressed in
accordance with Statistics NZ's confidentiality policy. Exclusions are
noted where applicable.
All sectors: Merchandise (goods) exports have
been obtained by matching commodities to the
ANZSIC06 industry that characteristically
produces them (Statistics NZ custom job).
Employment The number of people who earned money from employment (wages
and salary earners) and/or self-employment. For tourism it is full-time
equivalent (FTE) employees producing goods and services sold
directly to tourists.
Cross-cutting sectors (excluding tourism) Statistics NZ, Linked Employee Employer
Database (LEED), ( custom job).
Tourism Direct employment in tourism (FTEs) and
employment (FTEs) in tourism as a % of total.
Productivity A measure of how efficiently inputs are used within the economy to
produce outputs. Productivity is calculated by dividing the sector’s
real GDP by the number of hours paid. Real GDP per hour paid is
used.
For the cross-cutting sectors nominal GDP per employee is
substituted.
Cross-cutting sectors (excluding tourism) For cross-cutting sectors real GDP is replaced by
nominal GDP, and hours paid is replaced by
number of employees; hence calculation is
nominal GDP by number of employees.
Investment in fixed assets
(gross fixed capital formation)
A measure of the outlays of producers on durable fixed assets (e.g.
buildings, vehicles, plant and machinery, hydro-electric construction,
roading and improvements to land). 'Gross' indicates that consumption
of fixed capital is not deducted from the value of the outlays.
Cross-cutting sectors (excluding tourism) Uses additions less disposals of fixed assets, (custom
job). Note: this data has not been through the
System of National Accounts, so is indicative only.
Number of firms
(number of enterprises)
The number of businesses or service entities operating in the sector in
New Zealand. It covers all types of business or service entities, including
companies, self-employed individuals, voluntary organisations and
government departments.
Cross-cutting sectors (excluding tourism) Uses customised Business Demography Statistics,
number of enterprises.
92
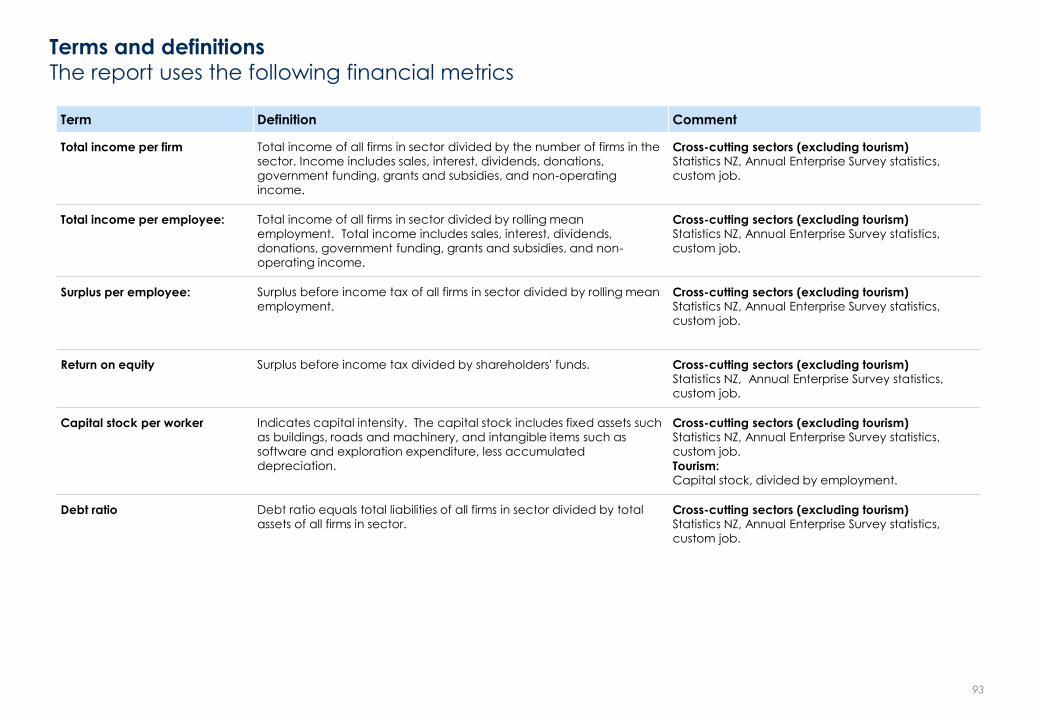
Terms and definitions The report uses the following financial metrics
Term Definition Comment
Total income per firm Total income of all firms in sector divided by the number of firms in the
sector. Income includes sales, interest, dividends, donations,
government funding, grants and subsidies, and non-operating
income.
Cross-cutting sectors (excluding tourism) Statistics NZ, Annual Enterprise Survey statistics,
custom job.
Total income per employee: Total income of all firms in sector divided by rolling mean
employment. Total income includes sales, interest, dividends,
donations, government funding, grants and subsidies, and non-
operating income.
Cross-cutting sectors (excluding tourism) Statistics NZ, Annual Enterprise Survey statistics,
custom job.
Surplus per employee: Surplus before income tax of all firms in sector divided by rolling mean
employment.
Cross-cutting sectors (excluding tourism) Statistics NZ, Annual Enterprise Survey statistics,
custom job.
Return on equity Surplus before income tax divided by shareholders' funds. Cross-cutting sectors (excluding tourism) Statistics NZ, Annual Enterprise Survey statistics,
custom job.
Capital stock per worker Indicates capital intensity. The capital stock includes fixed assets such
as buildings, roads and machinery, and intangible items such as
software and exploration expenditure, less accumulated
depreciation.
Cross-cutting sectors (excluding tourism) Statistics NZ, Annual Enterprise Survey statistics,
custom job.
Tourism: Capital stock, divided by employment.
Debt ratio Debt ratio equals total liabilities of all firms in sector divided by total
assets of all firms in sector. Cross-cutting sectors (excluding tourism) Statistics NZ, Annual Enterprise Survey statistics,
custom job.
93

Sources: economic data The following sources were used for economic data
Metric Source
Standard ANZSIC sectors
Source
tourism
Source
ICT
Nominal GDP Statistics New Zealand, Infoshare Database,
System of National Accounts 1993, SND,
GDP(P), Nominal, Actual, ANZSIC06 industry
groups (Annual–Mar).
Statistics NZ, Tourism Satellite Account: 2012,
Table 1 Tourism expenditure by component,
Direct tourism value added.
Statistics NZ, Value added estimates from
customised Annual Enterprise Survey tables.
Note: this data has not been through the
System of National Accounts, so is indicative
only.
Real GDP Statistics New Zealand, Infoshare Database,
National Accounts, System of National
Accounts 1993, SND, GDP(P), Chain-volume,
Actual, ANZSIC06 industry groups (Annual– k
Mar). Adjusted so that 2010 real GDP = 2010
Nominal GDP. Does not incorporate revisions
published by Statistics NZ in December 2012.
n/a
Goods exports Statistics NZ, merchandise exports, obtained
by matching commodities to the ANZSIC06
industry that characteristically produces
them. Note: sector exports values will exclude items suppressed in accordance
with Statistics NZ's confidentiality policy. For
more information, see
http://www.stats.govt.nz/about_us/policies-
and-protocols/trade-confidentiality.aspx
Statistics NZ, merchandise exports, obtained
by matching commodities to the ANZSIC06
industry that characteristically produces
them.
94

Sources: economic data continued
Metric Source
standard ANZSIC sectors
Source
Tourism
Source
ICT
Employment Statistics New Zealand, Table Builder, Linked
Employer-Employee Data (LEED) Tables
(annual), Table 1.6: Main Earnings Source by
Industry (NZSIOC).
Statistics NZ, Tourism Satellite Account: 2012,
Table 4, Direct employment in tourism (FTEs)
and Employment (FTEs) in tourism as a
percentage of total. See
http://www.stats.govt.nz/browse_for_stats/in
dustry_sectors/Tourism/tourism-satellite-
account-2012/tourism-employment.aspx for more information on the tourism FTE
measure.
Statistics NZ, LEED custom job.
Productivity Real GDP divided by hours paid. Hours paid
data from Statistics NZ, Infoshare Database,
Productivity Input Series –- Industry Level
(ANZSIC06) (Annual–Mar), Hours, Gross.
Manufacturing hours paid for 2010 split into
manufacturing sub-sectors using QES hours
paid and rated back using productivity
indexes from Statistics NZ.
Substituted nominal GDP per employee. Substituted nominal value
added/employment.
Investment in
fixed assets
Statistics New Zealand, Infoshare database,
System of National Accounts 1993 - SND,
Series, GDP(E), Nominal, Actual, Asset type
(Annual–Mar), Gross Fixed Capital
Formation.
Statistics NZ, Tourism Satellite Account - TSA,
Table: Gross Fixed Capital Formation by
Asset Type and by Industry (ANZSIC06)
(Annual-Mar). NB data only available for
certain years up to 2009.
Statistics NZ, Additions less disposals of fixed
assets from customised Annual Enterprise
Survey tables. Note: this data has not been
through the System of National Accounts, so
is indicative only. The all sector total
excludes some industries – see note page
following.
Number of
firms
Statistics NZ Table Builder, Business
Demography Statistics, Detailed Industry for
Enterprises, number of enterprises.
n/a Customised Business Demography Statistics,
number of enterprises.
95

Sources: financial data The following sources were used for financial data
Metric Source
standard ANZSIC sectors
Source
Tourism
Source
ICT
Surplus per
employee
Statistics NZ, Annual Enterprise Survey
release, surplus per employee count. The all
sector total excludes some industries. See
note below.
n/a Statistics NZ, Customised Annual Enterprise
Survey data, surplus per employee count.
Return on
equity
Statistics NZ, Annual Enterprise Survey
release, return on equity. Total excludes
some industries – see note below.
n/a Statistics NZ, Customised Annual Enterprise
Survey data, return on equity.
Debt ratio Statistics NZ, Annual Enterprise Survey
release, total liabilities (current and other)
divided by total assets. The all sector total
excludes some industries. See note below.
n/a Statistics NZ, customised Annual Enterprise
Survey data, total liabilities (current and
other) divided by total assets.
Capital stock
per worker
Statistics NZ, National Accounts (Industry
Benchmarks): Year ended March 2010, Table
14 Net capital stock by industry, current
prices (replacement cost), 1987–2010,
divided by employment.
Statistics NZ, Tourism Satellite Account,
capital stock, divided by employment. Note:
capital stock data is only available for some
years up to 2009 and does not incorporate
the National Accounts revisions published in
November 2012.
Substituted with fixed assets per worker from
Statistics NZ, Customised Annual Enterprise
Survey data, fixed tangible assets divided by
employment. Note: the fixed assets data
has not been through the system of National
Accounts, so is indicative only. The all sector
total excludes some industries - see note
below.
Note: AES data excludes residential property operators, foreign government representation, religious services, private households employing staff and
superannuation funds.
96
Example firms: sources and limitations
The example firms are sourced form the Kompass database (quoted with
permission) Management Magazine’s top 200 firms (2012) plus various
websites, annual reports and the TIN 100 publication (2012).
Firms allocated to sectors in this report may not match firms included in official statistics. Statistics NZ does not release frim level data. In most cases
numbers employed and turnover quoted for example firms are estimates.
MBIE welcomes corrections to the example firms’ data.
Other sources
Other data sources, such as the Comtrade database, are noted on the
page on which they occur.
Business Operations Survey
The Business Operations Survey collects information on the operations of New
Zealand businesses. This information is used to quantify business behaviour,
capacity, and performance. The survey gives insights into business activities,
barriers and motivations behind New Zealand business operations.
Data from the Business Operations Survey was used to calculate: • barriers to innovation and exporting • rates of innovation and R&D by sector • the rate of outward direct investment and foreign direct investment by
sector • percentage of firms in a sector reporting overseas income
Size of business operations survey
The survey is run annually and typically information is collected from
approximately 36,000 firms operating in New Zealand with six employees or
more.
Customised data for the Sectors Report
Data for the cross-cutting sectors, information and communications
technology, high technology manufacturing, tourism, knowledge intensive
services and some of the manufacturing sectors was provided by Statistics NZ
as a custom job. This data may be below the level the survey is designed for
and so should be treated with caution.
Detailed information on the Business Operations Survey is available from the
www.stats.govt.nz
Business Operations Survey, ‘example’ firms and other sources
97

Services exports
Statistics New Zealand publishes services exports data by service type as part
of its balance of payments statistics every quarter. These are calculated using
a variety of different surveys and administrative data sources.
In this report, we have allocated exports of transportation, insurance and
government services not included elsewhere to the logistics, finance & insurance, and government sectors respectively.
Commercial services by sector came from an industry breakdown from the
Census of International Trade in Services and Royalties: Year ended June
2011 (not available for 2012).
There is no breakdown of travel exports by sector. Travel exports includes all
spending on goods and services by non-resident visitors to New Zealand. It
overlaps considerably with tourism exports (see below), but includes
spending by international students here for more than a year as well as those here for up to a year (whereas tourism only includes those here for up to a
year) and excludes tourists’ international airfares (which are included in
tourism, but are part of transportation exports in the Balance of Payments).
Classifying exports by sector
Statistics on exports are collected according to product or service type and
not according to the sector that generates the exports.
Statistics New Zealand collects goods trade statistics using the New
Zealand Harmonised System Classification 2012 (NZHSC). This is based on the
World Customs Organization’s (WCO) Harmonized Commodity Description
and Coding System (HS).
Firms are classified into sectors using the Australia and New Zealand
Industrial Classification (ANZSIC) system.
To obtain insight into the export performance of sectors for this report, Statistics New Zealand prepared a concordance that maps HS codes (how
goods exports are classified) to ANZSIC codes (how sectors are classified).
This concordance allocates exports to sectors based on the type of product
the sector is most likely to produce. Hence logs and fruit are attributed to
the agriculture, forestry & fishing sector, while sawn wood products are
attributed to the wood & paper sector, and milk powder and frozen beef
are attributed to food & beverage manufacturing.
Treat with caution
The export data for sectors provided in this report is believed to be broadly
correct, but should be treated with caution. The method used means that
some sectors which clearly do export, have no or few exports allocated.
The clearest example is the wholesaling sector. Many wholesalers operating
in New Zealand export products on behalf of the producers of those
products, or purchase and on-sell them overseas. These exports are
attributed to the sector that manufactured, grew, harvested or mined
them, rather than to the wholesaling sector. Experimental data from
Statistics New Zealand indicates that the value of goods exports by wholesale trade firms was around $8b in 2011.
Exports by sector limitations This report attributes exports to sectors by mapping products and services to the sector
most likely to produce them
98

FURTHER READING
99

Further reading: information on the New Zealand economy
Publication Available from
The Regional Economic Activities Report, 2013
The Regional Economic Activity Report presents available official economic data on New
Zealand’s 16 regions. The report, which will be annual, provides regional economic
information sourced from a number of government agencies.
www.mbie.govt.nz
Situation and Outlook for Primary Industries (SOPI) 2012
Published annually, this report provides up-to-date information about the performance of
New Zealand’s primary sectors – dairy, meat and wool, forestry, horticulture, arable and,
for the first time, seafood – and gives independent forecasts of future prospects.
www.mpi.govt.nz
The Food and Beverage Information Project reports
The project pulls together all the available information on the food and beverage industry
into one place, in a form which is familiar and useful to business. Over 20 reports are
available on every aspect of New Zealand’s food industry, including information on
export market and investment opportunities. New and updated reports are released
annually.
www.foodandbeverage.govt.nz
100

Further reading: the Government’s Business Growth Agenda reports
Publication Available from:
Building innovation
The building innovation work stream of the Business Growth Agenda aims to grow New
Zealand’s economy by encouraging and enabling investment in research and
development, and lifting the value of public investments in science and research.
www.mbie.govt.nz
Export markets
The export markets work stream of the Business Growth Agenda aims to increase exports
by New Zealand businesses, which is necessary to lift New Zealand’s economic growth
and living standards.
www.mbie.govt.nz
Building infrastructure
The building infrastructure work stream of the Business Growth Agenda aims to provide
the physical platform that will support sustained economic growth.
www.mbie.govt.nz
Natural resources
The Building Natural Resources work stream of the Business Growth Agenda aims to make
better use of New Zealand’s abundant natural resources, so we can continue to grow our
economy and look after our environment.
www.mbie.govt.nz
Skilled and safe workplaces
The skilled and safe workplaces work stream of the Business Growth Agenda aims to
improve the safety of the workforce and build sustained economic growth through a
skilled and responsive labour market.
www.mbie.govt.nz
Building capital markets
The building capital markets work stream of the Business Growth Agenda aims to ensure
New Zealand has high performing capital markets that support investment, growth and
jobs.
www.mbie.govt.nz
101

102
The Ministry of Business, Innovation & Employment (MBIE) welcomes comment and feedback on this report, and on the measures the Government is taking to facilitate the development of a competitive and successful ICT sector. Email [email protected]


104