information and communication technology infusion model...
TRANSCRIPT
International Journal of Finance and Banking Research 2017; 3(4): 57-69
http://www.sciencepublishinggroup.com/j/ijfbr
doi: 10.11648/j.ijfbr.20170304.12
ISSN: 2472-226X (Print); ISSN: 2472-2278 (Online)
Information and Communication Technology Infusion Model for Microfinance Bank in the Nigeria
Idowu Peter Adebayo1, Balogun Jeremiah Ademola
1, Komolafe Olufemi
2,
EGEJURU Ngozi Chidozie1
1Department of Computer Science and Engineering, Obafemi Awolowo University, Ile-Ife, Nigeria 2Engineering Materials Development Institute, Federal Ministry of Science & Technology, Akure, Nigeria
Email address:
[email protected] (I. P. Adebayo)
To cite this article: Idowu Peter Adebayo, Balogun Jeremiah Ademola, Komolafe Olufemi, EGEJURU Ngozi Chidozie. Information and Communication
Technology Infusion Model for Microfinance Bank in the Nigeria. International Journal of Finance and Banking Research.
Vol. 3, No. 4, 2017, pp. 57-69. doi: 10.11648/j.ijfbr.20170304.12
Received: June 29, 2017; Accepted: July 13, 2017; Published: November 1, 2017
Abstract: This study was motivated by the need of the identification of the ICT devices used in the Nigerian microfinance
sector and the formulation of infusion models for each identified ICT device. 126 Structured questionnaires were used to
collect information regarding the use of the ICT devices used among respondents of nine (9) microfinance institutions selected
from South-Western Nigeria. The different ICT devices identified consisted of smartphones, SMS, e-mails, computer
hardware, telephone banking, magnetic ink character recognition (MICR) cheque, bank websites or mobile banking
applications, teleconferencing, electronic point-of-sale (E-POS) services and financial ERP software applications. The results
showed that majority of respondents who used ICT tools were customers who were traders with a majority age group of around
21-30 years. The results of the study also showed that all ICT tools were adopted in the same year (1999) by bank staffs. The
results showed that although all the ICT devices identified were adopted in the same year, it was observed that about 65% of
the respondents adopted smartphones and SMS while less than 16% of the respondents acquainted themselves with the other
devices. Polynomial functions of degree, m were used to formulate the infusion model for each ICT devices identified based on
the yearly cumulative distribution of the number of users. The infusion models formulated can be used to estimate the number
of users of ICT devices for any given year from the year of adoption of the ICT device.
Keywords: Information and Communications Technology, Devices in Use, Infusion Modeling, Agricultural Institute
1. Introduction
Microfinance institutions (MFIs) are institutions that
provide financial services to poor and low-income
households (and their microenterprises), allowing them to
better manage their risks, achieve consistent consumption
patterns, and develop an economic base [1]. Information and
communications technology (ICT) as the use of electronic
devices for sending-out, storing and receiving information
[2]. ICT is an umbrella term that involves any
communication application or device, encompassing;
television, radio, satellite systems, cellular phones, computer
hardware and software. According to Idowu et al. [3], the last
few years has witnessed incredible swift and dynamic
execution of ICT which has turned the world into a global
village. Investments in ICT have become crucial
organizational strategies for survival and competitive
advantage. The development in the sector permeates every
human activity: social, economic, cultural, religious, political
etc. [4]. Technology innovation has influenced the
performance of banks and tremendous achievements were
achieved in banks networking, service delivery, profitability
and customers responses. Microfinance loans tend to have
high interest rates in order to recover the high costs of loan
administration. ICT can allow MFIs to lower the cost of loan
administration, and thus, offer more affordable and flexible
loan products to clients [5].
Microfinance is defined as a small-scale financial service
for both credit and deposits specifically designed for
individuals who farm, fish or herd; operate small or
microenterprises that produce, recycle, repair, or trade goods;

58 Idowu Peter Adebayo et al.: Information and Communication Technology Infusion
Model for Microfinance Bank in the Nigeria
work to gain wages or commissions; gain income from
renting out small amounts of land, vehicles, draft animals, or
machinery and tools in developing countries, both in the rural
and urban areas [6]. It is a provision of financial services for
the poor, in which microfinance products are tailored to meet
the needs of the poor by using collateral substitution, client
participation and taking the service to the poor [7]. At
present, the disbursement and payment of microfinance
funding are accelerated through cash and cheque-based
economies [8]. However, the paper-based system is deemed
to be slow and prone to human error, as well as requiring a
major annual reconciliation process that involves clients
submitting their passbooks to calculate and update their
interest charges.
A study by CGAP [9] found that ICT was being used for
three different purposes of microfinance worldwide, which
are M-commerce, E-money and as a branchless banking
channel. M-commerce is the application of current and
emerging information and communication technology that
includes landline telephone, fax, mobile phone, electronic
mail and other internet-based services to conduct businesses
[10]; while E-money, or popularly known as e-cash, is a
digital equivalent to paper currency and coins that enables
secure and anonymous purchases to be made on various
items online [11]. Further, a branchless banking channel is a
channel that delivers financial services outside the context of
conventional bank branches by means of information
communication technologies [12]. In enhancing the operation
of all microfinance institutions, the European Microfinance
Network [13] suggested three types of technology that could
be put in place – technology for running the business, client-
facing technology and process automation technology. This
advancement is applicable for both Islamic and conventional-
oriented microfinance institutions [14].
In running the business, a thorough Management
Information System should be in place to ensure that
automatic data flow is generated from portfolio management
applications to the financial accounting software without any
fear of data entry duplication [15]. The function of the
Management Information System is also important for
providing easy access, detailed and up-to-date information on
clients’ accounts, balance of disbursements and payments
[16]. Client-facing technology could be applied for the
disbursal of loans and collection of loan payments through
cashless or electronic payment channels, such as mobile
banking, Internet-based banking, Automated Teller Machines
(ATMs), debit and credit cards, also Point of Sale (POS)
devices at retailers [17]. Accordingly, the activities of
disbursements, repayments, deposits, withdrawals and money
transfers could be completed faster outside of the branch
offices of microfinance institutions, with better control and
minimum room for error [1]. Process automation or
workflow technologies make use of client relationship
management systems and mobile solutions in automating
several aspects of the loan application process, which
includes data gathering, analysis and credit assessment to
easily monitor, change and improve process flows.
In Nigeria, O’Flynn [8] found that the means of electronic
payment had been increasingly helpful in tackling issues of
inflation that make cash transactions a burden to the
microfinance institutions as well as the recipients. The issue
of inflation arises, as with more recipients being brought in,
there will be more cash to be handled and, hence, an
increment on the cost of cash administration and
management [18]. The migration to cashless payment
increases personal security thereby reducing the need to carry
large quantities of cash and promotes efficient, secure and
convenient transactions. Furthermore, the inducement of
cashless transactions provides a route to access and engage
the nation’s diverse unbanked population in the national
finance system. Ahmad [19] identified various issues that
surround the slow progress of ICT infusion in microfinance
institutions. These include the insufficient organizational and
human capacity; unavailability of suitable applications for
microfinance; diversity in business processes and frequent
changes in procedures; risk of technological failure; diversity
of geography and language; unavailability of vendors and
their capacity to implement and support ICT solutions; high
cost of ICT for microfinance institutions; lack of
commitment of management and key decision-makers within
microfinance institutions; and also the lack of awareness
about the importance of technology.
Nations have also enjoyed an unparalleled increase in
productivity as well as sustainable economic growth and
development due to this evolving trend. However, this
laudable development has not been evenly spread. It is no
longer news that Information and Communication
Technology (ICT) is arguably the most rapidly growing
segment of the world ecosystem [20]. Investments in ICT
have become crucial organizational strategies for survival
and competitive advantage. From time immemorial,
Information has always played a prominent role in human
life but the emergence of social progress and the vigorous
development in science and technology has immeasurably
increased the role of information in every facet of human
endeavor [21]. All over the world, ICT are changing the way
that things are being done in most organizations today
including the financial sectors. Developing countries like
Nigeria are not left out in this journey to the adoption of ICT
in the banking operations of Nigeria but the gap in
knowledge is the ability to understand the rate of adoption
and the activities associated with such adoptions among
Nigerian banks. There is the need of an infusion model that
can be used to estimate the number of people adopting ICT
devices given a period of time from the time of adoption,
hence this study.
2. Related Works
Bada [1] investigated the extent to which Microfinance
Institutions (MFIs) use ICT to deliver business services and
train staffs in Uganda. The data collected from the survey
was analyzed quantitatively and qualitatively. The analysis
results indicate that the usage of ICT in microfinance
International Journal of Finance and Banking Research 2017; 3(4): 57-69 59
business is still low. The usage is fair in business process
automation but none in professional skills enhancement
through e-learning. Based on the findings of the research it
was concluded that there is need to experiment e-learning for
professional skills development in Ugandan microfinance
institutions. Furthermore, research is needed to test the level
of computer technology acceptance in microfinance business.
Dauda and Akingbade [22] assessed employees’ and
customers’ responses of technology innovation on the
performance of Nigerian banks. Fifteen (15) major banks
were selected for the research with two (2) questionnaires
used to test whether there is no significant relationship
between technology innovation and customer’s satisfaction;
and between technological innovation and Nigerian banks
employee’s performance. Pearson correlation co-efficient
was used to analyze the hypotheses. Findings revealed that
technological innovation influenced banks employee’s
performance, customer’s satisfaction and improvement in
banks profitability. The study recommends effective
management of technological innovation for improved
employees performance, customer’s satisfaction, sustainable
profit, increased return on investment, returns on equity, and
to promote competitiveness in the Nigerian banking industry.
Agbolade [21], in his study proposed a relationship
between the adoption of ICT in Nigerian banks to the level of
profitability of the banks. Using a primary data sourced
through a structured questionnaire administered to selected
banks in South-west Nigeria and the Ordinary Least Square
approach econometric techniques, this study examined the
nature of the relationship that exist between Banks
Profitability and the Adoption of Information and
Communication Technology. The data analysis showed that a
positive correlation exists between ICT and banks
profitability in Nigeria. This implies that a marginal change
in the level of the investment and adoption of ICT in the
banking industry will result to a proportionate increase in the
profit level. This is confirmed by the level of the regression
coefficient as well as the factor analysis which revealed that
an insignificant size of profit exist without the introduction of
the ICT.
3. Materials and Methods
This study made use of structured questionnaire as the
instrument of data collection from respondents of the selected
location in Nigeria to elicit information about the ICT
devices used among respondents selected from microfinance
banks. This study considered respondents selected from nine
(9) microfinance institutions located in Nigeria, namely:
i. Access Bank;
ii. Diamond Bank;
iii. First City Monument Bank (FCMB);
iv. First Bank;
v. Guaranty Trust Bank;
vi. Imowo Microfinance Bank;
vii. Lift Above Poverty Organization (LAPO);
viii. Skye Bank; and
ix. Wema Bank.
The instrument of data collection was used to collect
information from the respondents of the study, which
included: demographic information, ICT components used at
each sites alongside the impact of the ICT components.
Following the collection of data from the respondents, the
data was analyzed using standard descriptive statistics tools:
tables for data presentation and graphs for data presentation.
The ICT infusion model was formulated using polynomial
expressions of degree, m estimated from cumulative total of
users for each year from the year of infusion of each device.
The study population identified for this study is the
customers and staffs of microfinance institutions. 126
questionnaires were distributed among the respondents with
the necessary information provided.
This study incorporated the use of descriptive statistical
techniques for the purpose of analyzing the data collected for
this study from the respondents. The descriptive statistics
methods used helped in the simplification of the data
collected in a sensible way by the provision of descriptive
summary using frequency tables and charts. The ICT
infusion model was formulated using the Microsoft® Excel’s
built-in functionality for estimating the trend line of graphical
tables and charts – which in this case is a polynomial
function of degree, m. For the purpose of this study, the IT
infusion model was formulated as a function of the number
of years; x from the base year, �� up to a required year ��
using a polynomial equation of degree, m for each identified
IT component. Equation 1 shows how to determine number
of years, x that is required to determine the number of users
of the ICT devices by the year, �� from the base year, ��.
� = �� −�� + 1 (1)
The number of ICT devices adopted by the respondents of
the nine (9) microfinance institutions for each year, � was
considered as a sequence of terms (equation 2) following
which the cumulative total for each successive year was
determined till the present year - 2016 (equation 3).
Assuming an ICT device which was used starting from a base
year, Y0 = 2001; it will be discovered that the total number of
terms in the sequence of users from 2001 till 2015 is t =
2015-2001+1=15 years.
� =�, , �, �, . . . . . . . . . . . , �� (2)
The cumulative total number of ICT devices used by
respondents of the 9 locations for each year from the base year
till the present year was considered as a series of terms
(equation 3). In equation (2), it is observed that each � for
1 ≤ � ≤ 15 represents the number of users of the IT device
for each successive year from 2001 till 2015. Equation (2) was
converted to a sequence of the cumulative sum of users for
each successive year (equation 3). Thus each �� 1 ≤ � ≤ 15
represents the cumulative total number of users of ICT devices
x years after the base year of infusion, Y0 (see equation 4).
�� = �, �� + �, �� + +��, . . . . . . �� + … . . +��� (3)
�� =��, � , ��, ��, . . . . . . . . . … . . , ��� (4)

60 Idowu Peter Adebayo et al.: Information and Communication Technology Infusion
Model for Microfinance Bank in the Nigeria
Where:
�� = �, � = �� + �, ……… . , ��� = �� + … . . +���
Hence, the infusion model is thus a polynomial equation of
degree m which is the best line fit of the cumulative number
of users of each ICT device by year, Yx - x years after the
base year, Y0. Thus, the IT infusion model is a polynomial fit
of equation (4) expressed in terms of x (the number of years
after the base year). Hence, the IT infusion model is
expressed as shown in equation (5).
���� = � + �� +�� +. . . . . . . +��� (5)
Where a, b, c, d �ℝ
4. Results and Discussions
After distribution of the questionnaires among the
respondents selected from the nine (9) microfinance
institutions using the 126 questionnaires a number of results
were identified. Based on the findings of this study, the ICT
tools investigated among the 126 respondents chosen for this
study were: of smartphones, SMS, e-mails, computer
hardware, telephone banking, magnetic ink character
recognition (MICR) cheque, bank websites or mobile banking
applications, teleconferencing, electronic point-of-sale (E-
POS) services and financial ERP software applications.
Following the results of the demographic information of
the respondents in order to identify those that make use of
these ICT tools within the Nigerian microfinance sector, it
was observed that there were more male users (54.8% of
respondents) than there were female users (45.2%) of ICT
tools working in the locations selected (Table 1). The results
also showed that users within the age interval of 21-450 years
(40.5% for the interval 21-30 and 26.2% for the interval 31-
40) were more likely to use ICT tools compared to other
respondents (Table 2).
Table 1. Sex of respondents selected for this study.
Gender TOTAL %
Male 69 54.76
Female 57 45.24
Total 126 100
Table 2. Age group of respondents selected for this study.
Age-group TOTAL %
less than 20 24 19.05
21-30 51 40.48
31-40 33 26.19
41-50 14 11.11
above 50 1 0.79
Missing 3 2.38
Total 126 100
Based on their marital status, the results showed that there
is an equal distribution of married and single users of ICT
devices among the respondents representing 49.2% each
(Table 3). Based on the category of job description assigned
to each of the respondents in their respective location,
majority of the respondents were customers with majority
being traders (33.3%) and students (29.4%) and the majority
staffs being loan officer (7.9%) (Table 4).
Table 3. Marital Status of respondents selected for this study.
Marital Status TOTAL %
Married 62 49.21
Single 62 49.21
Missing 2 1.59
Total 126 100
Table 4. Job description of the respondents selected for this study.
Designation Total %
Student 37 29.37
ATM 3 2.38
Customer Service 2 1.59
Loan Officer 10 7.94
Trader 42 33.33
Artisan 6 4.76
Teller 6 4.76
Teacher 9 7.14
Analyst 1 0.79
Civil-servant 5 3.97
Missing 5 3.97
Total 126 100.00
Based on information regarding the educational
qualification of the respondents selected for this study;
19.1% had OND, 39.7% had BSc/BA, 1.6% had MSc/MA,
9.5% had NCE, 7.14% had SSCE and 18.3% had HND while
4.76% did not provide information regarding their
educational qualification (Table 5).
Table 5. Education qualification of respondents selected for the study.
Qualification TOTAL %
OND 24 19.05
BSc/BA 50 39.68
MSc/MA 2 1.59
NCE 12 9.52
SSCE 9 7.14
HND 23 18.25
Missing 6 4.76
Total 126 100
Based on the proficiency of the respondents regarding
computer use; 2.4% of respondents were poor, 6.4% were
fair, 36.5% were average, 45.2% were good while 7.9% were
excellent; the results further revealed that the majority of the
respondents were good with their knowledge of the computer
followed by those that had average skills in computer use
(Table 6).
Table 6. Computer compliance among respondents selected for the study.
Compliance TOTAL %
Poor 3 2.38
Fair 8 6.35
Average 46 36.51
Good 57 45.24
Excellent 10 7.94
Missing 2 1.59
Total 126 100
International Journal of Finance and Banking Research 2017; 3(4): 57-69 61
Results and discussion of ICT infusion models
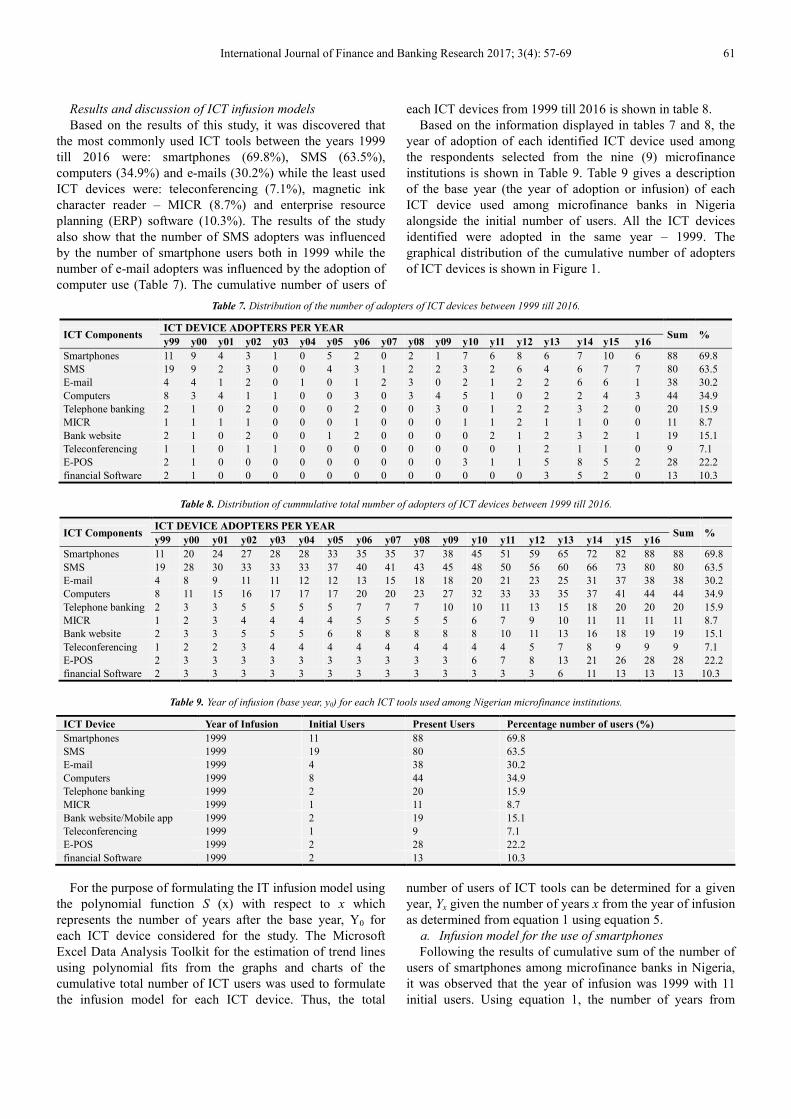
Based on the results of this study, it was discovered that
the most commonly used ICT tools between the years 1999
till 2016 were: smartphones (69.8%), SMS (63.5%),
computers (34.9%) and e-mails (30.2%) while the least used
ICT devices were: teleconferencing (7.1%), magnetic ink
character reader – MICR (8.7%) and enterprise resource
planning (ERP) software (10.3%). The results of the study
also show that the number of SMS adopters was influenced
by the number of smartphone users both in 1999 while the
number of e-mail adopters was influenced by the adoption of
computer use (Table 7). The cumulative number of users of
each ICT devices from 1999 till 2016 is shown in table 8.
Based on the information displayed in tables 7 and 8, the
year of adoption of each identified ICT device used among
the respondents selected from the nine (9) microfinance
institutions is shown in Table 9. Table 9 gives a description
of the base year (the year of adoption or infusion) of each
ICT device used among microfinance banks in Nigeria
alongside the initial number of users. All the ICT devices
identified were adopted in the same year – 1999. The
graphical distribution of the cumulative number of adopters
of ICT devices is shown in Figure 1.
Table 7. Distribution of the number of adopters of ICT devices between 1999 till 2016.
ICT Components ICT DEVICE ADOPTERS PER YEAR
Sum % y99 y00 y01 y02 y03 y04 y05 y06 y07 y08 y09 y10 y11 y12 y13 y14 y15 y16
Smartphones 11 9 4 3 1 0 5 2 0 2 1 7 6 8 6 7 10 6 88 69.8
SMS 19 9 2 3 0 0 4 3 1 2 2 3 2 6 4 6 7 7 80 63.5
E-mail 4 4 1 2 0 1 0 1 2 3 0 2 1 2 2 6 6 1 38 30.2
Computers 8 3 4 1 1 0 0 3 0 3 4 5 1 0 2 2 4 3 44 34.9
Telephone banking 2 1 0 2 0 0 0 2 0 0 3 0 1 2 2 3 2 0 20 15.9
MICR 1 1 1 1 0 0 0 1 0 0 0 1 1 2 1 1 0 0 11 8.7
Bank website 2 1 0 2 0 0 1 2 0 0 0 0 2 1 2 3 2 1 19 15.1
Teleconferencing 1 1 0 1 1 0 0 0 0 0 0 0 0 1 2 1 1 0 9 7.1
E-POS 2 1 0 0 0 0 0 0 0 0 0 3 1 1 5 8 5 2 28 22.2
financial Software 2 1 0 0 0 0 0 0 0 0 0 0 0 0 3 5 2 0 13 10.3
Table 8. Distribution of cummulative total number of adopters of ICT devices between 1999 till 2016.
ICT Components ICT DEVICE ADOPTERS PER YEAR
Sum % y99 y00 y01 y02 y03 y04 y05 y06 y07 y08 y09 y10 y11 y12 y13 y14 y15 y16
Smartphones 11 20 24 27 28 28 33 35 35 37 38 45 51 59 65 72 82 88 88 69.8
SMS 19 28 30 33 33 33 37 40 41 43 45 48 50 56 60 66 73 80 80 63.5
E-mail 4 8 9 11 11 12 12 13 15 18 18 20 21 23 25 31 37 38 38 30.2
Computers 8 11 15 16 17 17 17 20 20 23 27 32 33 33 35 37 41 44 44 34.9
Telephone banking 2 3 3 5 5 5 5 7 7 7 10 10 11 13 15 18 20 20 20 15.9
MICR 1 2 3 4 4 4 4 5 5 5 5 6 7 9 10 11 11 11 11 8.7
Bank website 2 3 3 5 5 5 6 8 8 8 8 8 10 11 13 16 18 19 19 15.1
Teleconferencing 1 2 2 3 4 4 4 4 4 4 4 4 4 5 7 8 9 9 9 7.1
E-POS 2 3 3 3 3 3 3 3 3 3 3 6 7 8 13 21 26 28 28 22.2
financial Software 2 3 3 3 3 3 3 3 3 3 3 3 3 3 6 11 13 13 13 10.3
Table 9. Year of infusion (base year, y0) for each ICT tools used among Nigerian microfinance institutions.
ICT Device Year of Infusion Initial Users Present Users Percentage number of users (%)
Smartphones 1999 11 88 69.8
SMS 1999 19 80 63.5
E-mail 1999 4 38 30.2
Computers 1999 8 44 34.9
Telephone banking 1999 2 20 15.9
MICR 1999 1 11 8.7
Bank website/Mobile app 1999 2 19 15.1
Teleconferencing 1999 1 9 7.1
E-POS 1999 2 28 22.2
financial Software 1999 2 13 10.3
For the purpose of formulating the IT infusion model using
the polynomial function S (x) with respect to x which
represents the number of years after the base year, Y0 for
each ICT device considered for the study. The Microsoft
Excel Data Analysis Toolkit for the estimation of trend lines
using polynomial fits from the graphs and charts of the
cumulative total number of ICT users was used to formulate
the infusion model for each ICT device. Thus, the total
number of users of ICT tools can be determined for a given
year, Yx given the number of years x from the year of infusion
as determined from equation 1 using equation 5.
a. Infusion model for the use of smartphones
Following the results of cumulative sum of the number of
users of smartphones among microfinance banks in Nigeria,
it was observed that the year of infusion was 1999 with 11
initial users. Using equation 1, the number of years from
62 Idowu Peter Adebayo et al.: Information and Communication Technology Infusion
Model for Microfinance Bank in the Nigeria
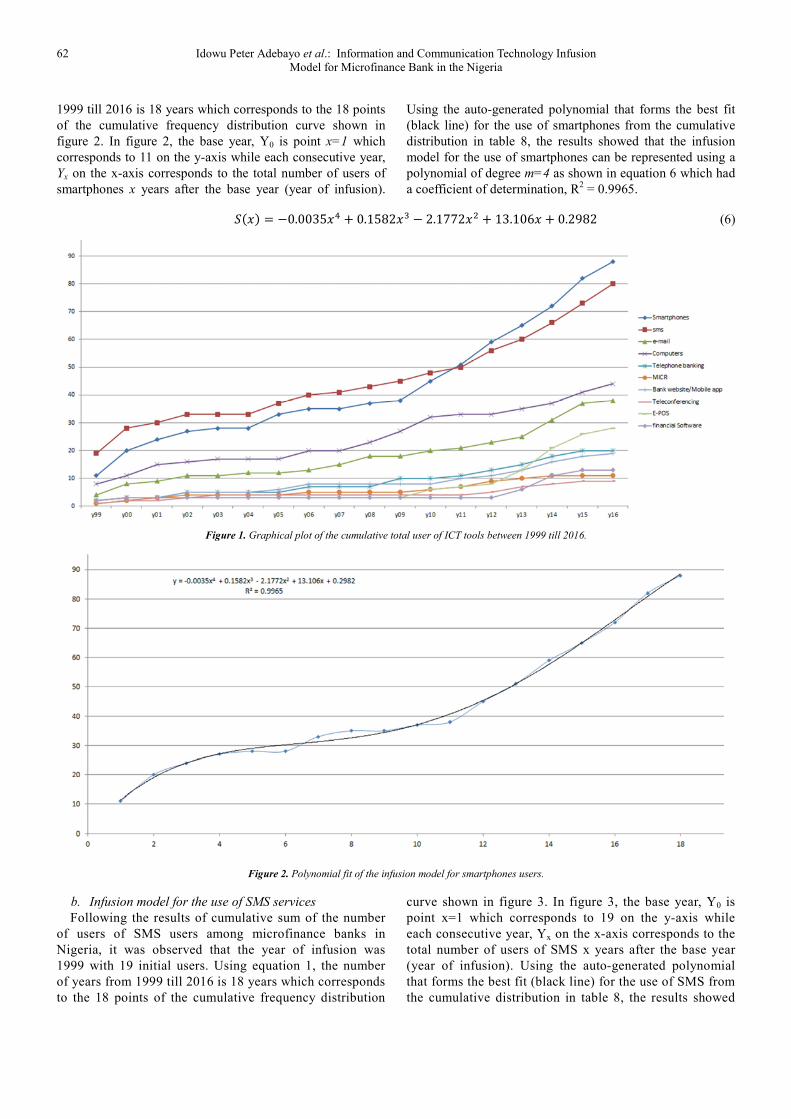
1999 till 2016 is 18 years which corresponds to the 18 points
of the cumulative frequency distribution curve shown in
figure 2. In figure 2, the base year, Y0 is point x=1 which
corresponds to 11 on the y-axis while each consecutive year,
Yx on the x-axis corresponds to the total number of users of
smartphones x years after the base year (year of infusion).
Using the auto-generated polynomial that forms the best fit
(black line) for the use of smartphones from the cumulative
distribution in table 8, the results showed that the infusion
model for the use of smartphones can be represented using a
polynomial of degree m=4 as shown in equation 6 which had
a coefficient of determination, R2 = 0.9965.
���� = −0.0035�� � 0.1582�� � 2.1772� � 13.106� � 0.2982 (6)
Figure 1. Graphical plot of the cumulative total user of ICT tools between 1999 till 2016.
Figure 2. Polynomial fit of the infusion model for smartphones users.
b. Infusion model for the use of SMS services
Following the results of cumulative sum of the number
of users of SMS users among microfinance banks in
Nigeria, it was observed that the year of infusion was
1999 with 19 initial users. Using equation 1, the number
of years from 1999 till 2016 is 18 years which corresponds
to the 18 points of the cumulative frequency distribution
curve shown in figure 3. In figure 3, the base year, Y0 is
point x=1 which corresponds to 19 on the y-axis while
each consecutive year, Yx on the x-axis corresponds to the
total number of users of SMS x years after the base year
(year of infusion). Using the auto-generated polynomial
that forms the best fit (black line) for the use of SMS from
the cumulative distribution in table 8, the results showed
International Journal of Finance and Banking Research 2017; 3(4): 57-69 63
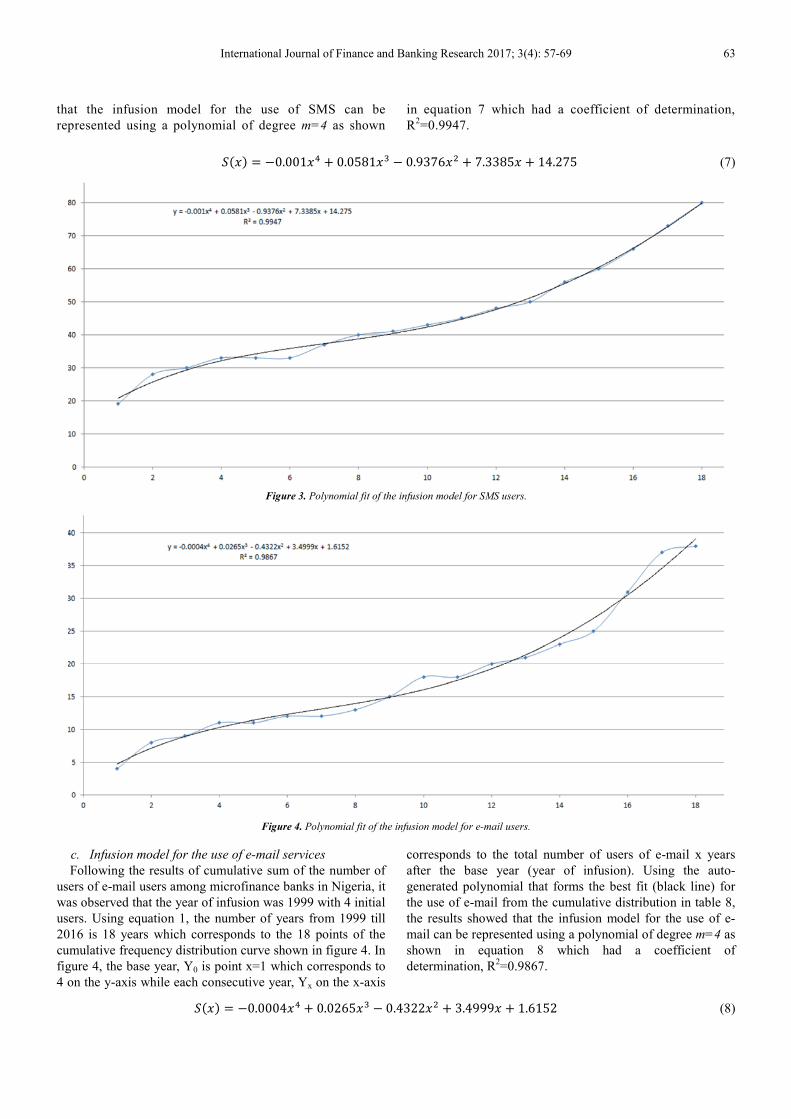
that the infusion model for the use of SMS can be
represented using a polynomial of degree m=4 as shown
in equation 7 which had a coefficient of determination,
R2=0.9947.
���� = −0.001�� � 0.0581�� � 0.9376� � 7.3385� � 14.275 (7)
Figure 3. Polynomial fit of the infusion model for SMS users.
Figure 4. Polynomial fit of the infusion model for e-mail users.
c. Infusion model for the use of e-mail services
Following the results of cumulative sum of the number of
users of e-mail users among microfinance banks in Nigeria, it
was observed that the year of infusion was 1999 with 4 initial
users. Using equation 1, the number of years from 1999 till
2016 is 18 years which corresponds to the 18 points of the
cumulative frequency distribution curve shown in figure 4. In
figure 4, the base year, Y0 is point x=1 which corresponds to
4 on the y-axis while each consecutive year, Yx on the x-axis
corresponds to the total number of users of e-mail x years
after the base year (year of infusion). Using the auto-
generated polynomial that forms the best fit (black line) for
the use of e-mail from the cumulative distribution in table 8,
the results showed that the infusion model for the use of e-
mail can be represented using a polynomial of degree m=4 as
shown in equation 8 which had a coefficient of
determination, R2=0.9867.
���� � �0.0004�� � 0.0265�� � 0.4322� � 3.4999� � 1.6152 (8)
64 Idowu Peter Adebayo et al.: Information and Communication Technology Infusion
Model for Microfinance Bank in the Nigeria
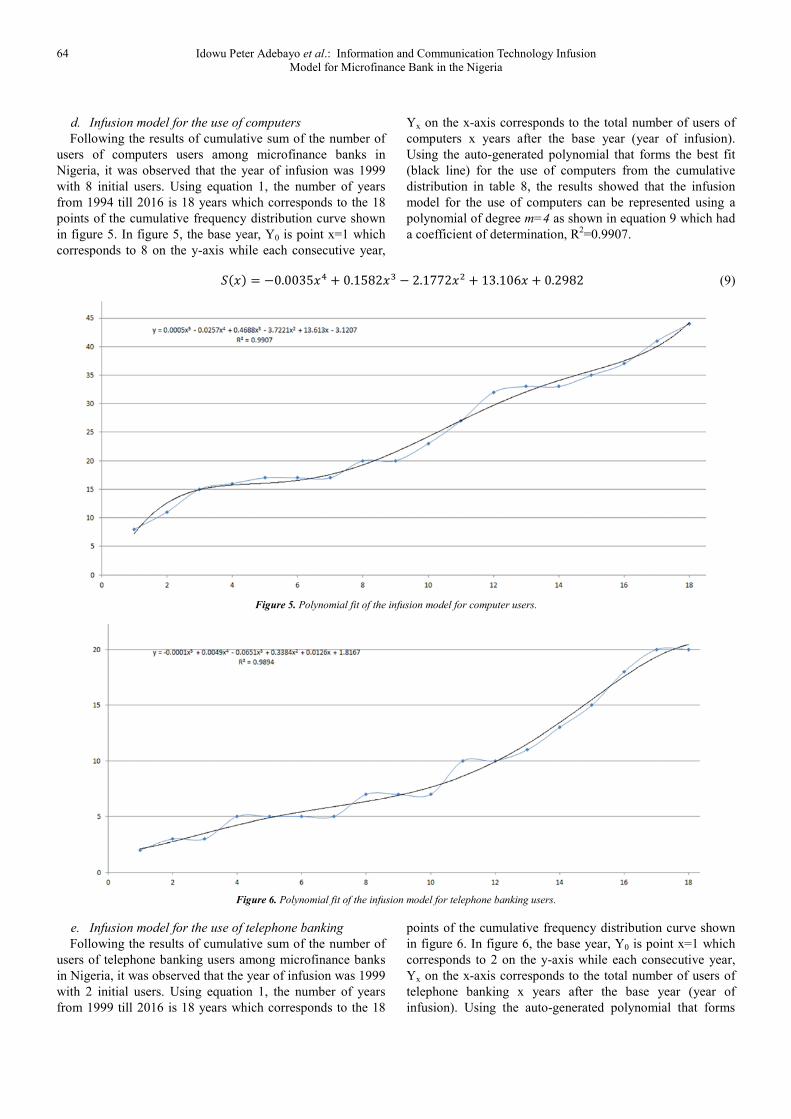
d. Infusion model for the use of computers
Following the results of cumulative sum of the number of
users of computers users among microfinance banks in
Nigeria, it was observed that the year of infusion was 1999
with 8 initial users. Using equation 1, the number of years
from 1994 till 2016 is 18 years which corresponds to the 18
points of the cumulative frequency distribution curve shown
in figure 5. In figure 5, the base year, Y0 is point x=1 which
corresponds to 8 on the y-axis while each consecutive year,
Yx on the x-axis corresponds to the total number of users of
computers x years after the base year (year of infusion).
Using the auto-generated polynomial that forms the best fit
(black line) for the use of computers from the cumulative
distribution in table 8, the results showed that the infusion
model for the use of computers can be represented using a
polynomial of degree m=4 as shown in equation 9 which had
a coefficient of determination, R2=0.9907.
���� = −0.0035�� � 0.1582�� � 2.1772� � 13.106� � 0.2982 (9)
Figure 5. Polynomial fit of the infusion model for computer users.
Figure 6. Polynomial fit of the infusion model for telephone banking users.
e. Infusion model for the use of telephone banking
Following the results of cumulative sum of the number of
users of telephone banking users among microfinance banks
in Nigeria, it was observed that the year of infusion was 1999
with 2 initial users. Using equation 1, the number of years
from 1999 till 2016 is 18 years which corresponds to the 18
points of the cumulative frequency distribution curve shown
in figure 6. In figure 6, the base year, Y0 is point x=1 which
corresponds to 2 on the y-axis while each consecutive year,
Yx on the x-axis corresponds to the total number of users of
telephone banking x years after the base year (year of
infusion). Using the auto-generated polynomial that forms
International Journal of Finance and Banking Research 2017; 3(4): 57-69 65
the best fit (black line) for the use of telephone banking from
the cumulative distribution in table 8, the results showed that
the infusion model for the use of telephone banking can be
represented using a polynomial of degree m=5 as shown in
equation 10 which had a coefficient of determination,
R2=0.9894.
���� = −0.0001�� � 0.0049�� � 0.065�� � 0.338� � 0.0126� � 1.8167 (10)
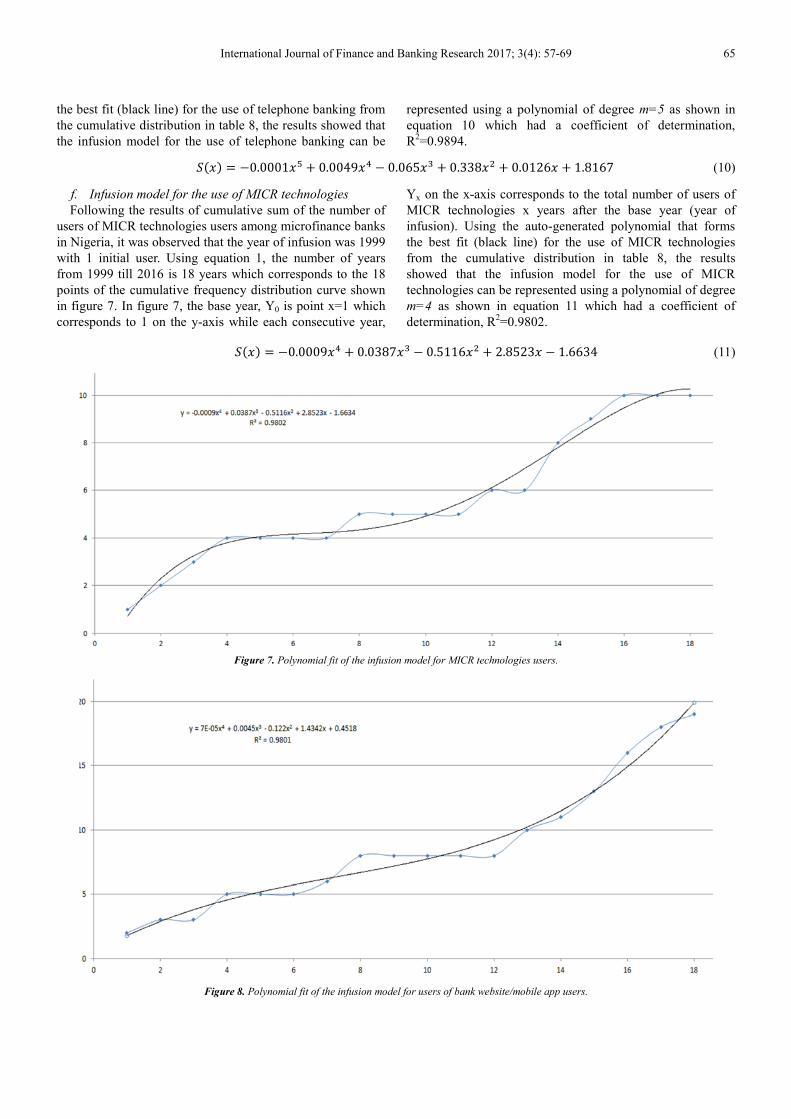
f. Infusion model for the use of MICR technologies
Following the results of cumulative sum of the number of
users of MICR technologies users among microfinance banks
in Nigeria, it was observed that the year of infusion was 1999
with 1 initial user. Using equation 1, the number of years
from 1999 till 2016 is 18 years which corresponds to the 18
points of the cumulative frequency distribution curve shown
in figure 7. In figure 7, the base year, Y0 is point x=1 which
corresponds to 1 on the y-axis while each consecutive year,
Yx on the x-axis corresponds to the total number of users of
MICR technologies x years after the base year (year of
infusion). Using the auto-generated polynomial that forms
the best fit (black line) for the use of MICR technologies
from the cumulative distribution in table 8, the results
showed that the infusion model for the use of MICR
technologies can be represented using a polynomial of degree
m=4 as shown in equation 11 which had a coefficient of
determination, R2=0.9802.
���� � �0.0009�� � 0.0387�� � 0.5116� � 2.8523� � 1.6634 (11)
Figure 7. Polynomial fit of the infusion model for MICR technologies users.
Figure 8. Polynomial fit of the infusion model for users of bank website/mobile app users.
66 Idowu Peter Adebayo et al.: Information and Communication Technology Infusion
Model for Microfinance Bank in the Nigeria
g. Infusion model for the use of bank website/mobile
application
Following the results of cumulative sum of the number of
users of bank website/mobile application users among
microfinance banks in Nigeria, it was observed that the year
of infusion was 1999 with 2 initial users. Using equation 1,
the number of years from 1999 till 2016 is 18 years which
corresponds to the 18 points of the cumulative frequency
distribution curve shown in figure 8. In figure 8, the base
year, Y0 is point x=1 which corresponds to 2 on the y-axis
while each consecutive year, Yx on the x-axis corresponds to
the total number of users of bank website/mobile application
x years after the base year (year of infusion). Using the auto-
generated polynomial that forms the best fit (black line) for
the use of bank website/mobile application from the
cumulative distribution in table 8, the results showed that the
infusion model for the use of bank website/mobile
application can be represented using a polynomial of degree
m=5 as shown in equation 12 which had a coefficient of
determination, R2=0.9802.
���� = −0.0001�� � 0.0049�� � 0.065�� � 0.338� � 0.0126� � 1.8167 (12)
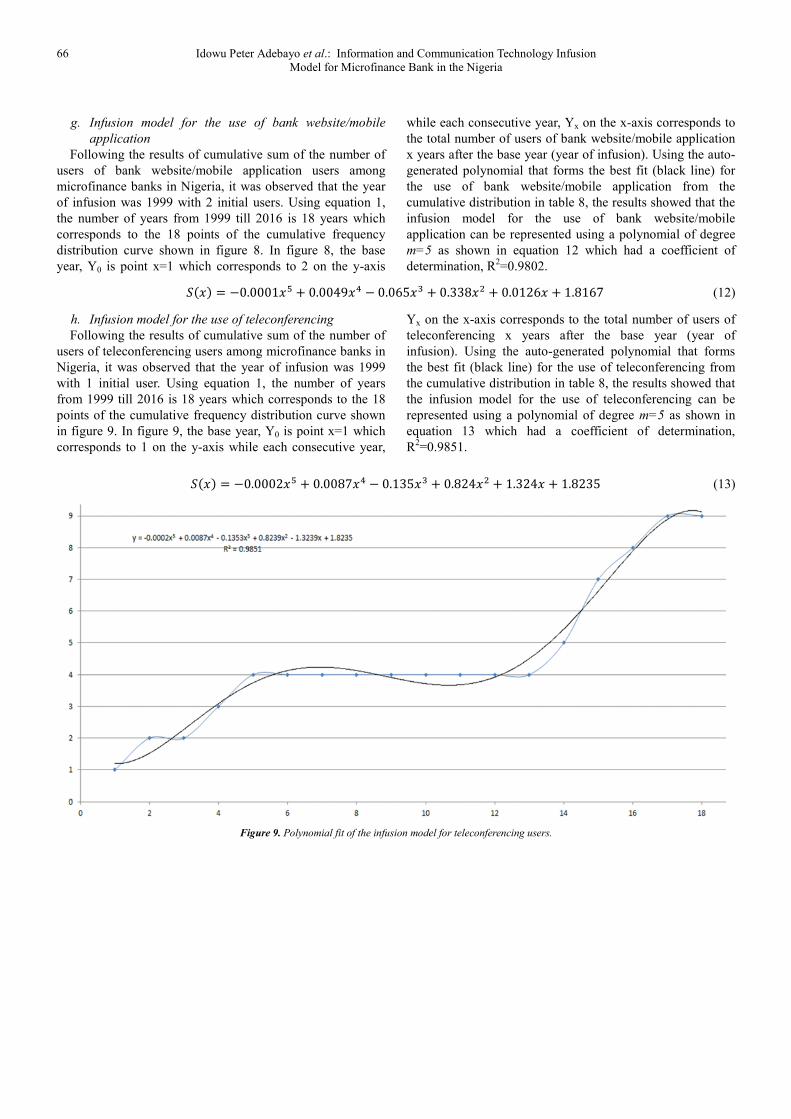
h. Infusion model for the use of teleconferencing
Following the results of cumulative sum of the number of
users of teleconferencing users among microfinance banks in
Nigeria, it was observed that the year of infusion was 1999
with 1 initial user. Using equation 1, the number of years
from 1999 till 2016 is 18 years which corresponds to the 18
points of the cumulative frequency distribution curve shown
in figure 9. In figure 9, the base year, Y0 is point x=1 which
corresponds to 1 on the y-axis while each consecutive year,
Yx on the x-axis corresponds to the total number of users of
teleconferencing x years after the base year (year of
infusion). Using the auto-generated polynomial that forms
the best fit (black line) for the use of teleconferencing from
the cumulative distribution in table 8, the results showed that
the infusion model for the use of teleconferencing can be
represented using a polynomial of degree m=5 as shown in
equation 13 which had a coefficient of determination,
R2=0.9851.
���� � �0.0002�� � 0.0087�� � 0.135�� � 0.824� � 1.324� � 1.8235 (13)
Figure 9. Polynomial fit of the infusion model for teleconferencing users.

International Journal of Finance and Banking Research 2017; 3(4): 57-69 67
Figure 10. Polynomial fit of the infusion model for E-POS users.
i. Infusion model for the use of E-POS
Following the results of cumulative sum of the number of
users of E-POS users among microfinance banks in Nigeria,
it was observed that the year of infusion was 1999 with 2
initial users. Using equation 1, the number of years from
1999 till 2016 is 18 years which corresponds to the 18 points
of the cumulative frequency distribution curve shown in
figure 10. In figure 10, the base year, Y0 is point x=1 which
corresponds to 2 on the y-axis while each consecutive year,
Yx on the x-axis corresponds to the total number of users of
E-POS x years after the base year (year of infusion). Using
the auto-generated polynomial that forms the best fit (black
line) for the use of E-POS from the cumulative distribution in
table 8, the results showed that the infusion model for the use
of E-POS can be represented using a polynomial of degree
m=4 as shown in equation 14 which had a coefficient of
determination, R2=0.9796.
���� = −0.0006�� � 0.038�� � 0.559� � 2.6778� � 0.509 (14)
Figure 10. Polynomial fit of the infusion model for E-POS users.
68 Idowu Peter Adebayo et al.: Information and Communication Technology Infusion
Model for Microfinance Bank in the Nigeria
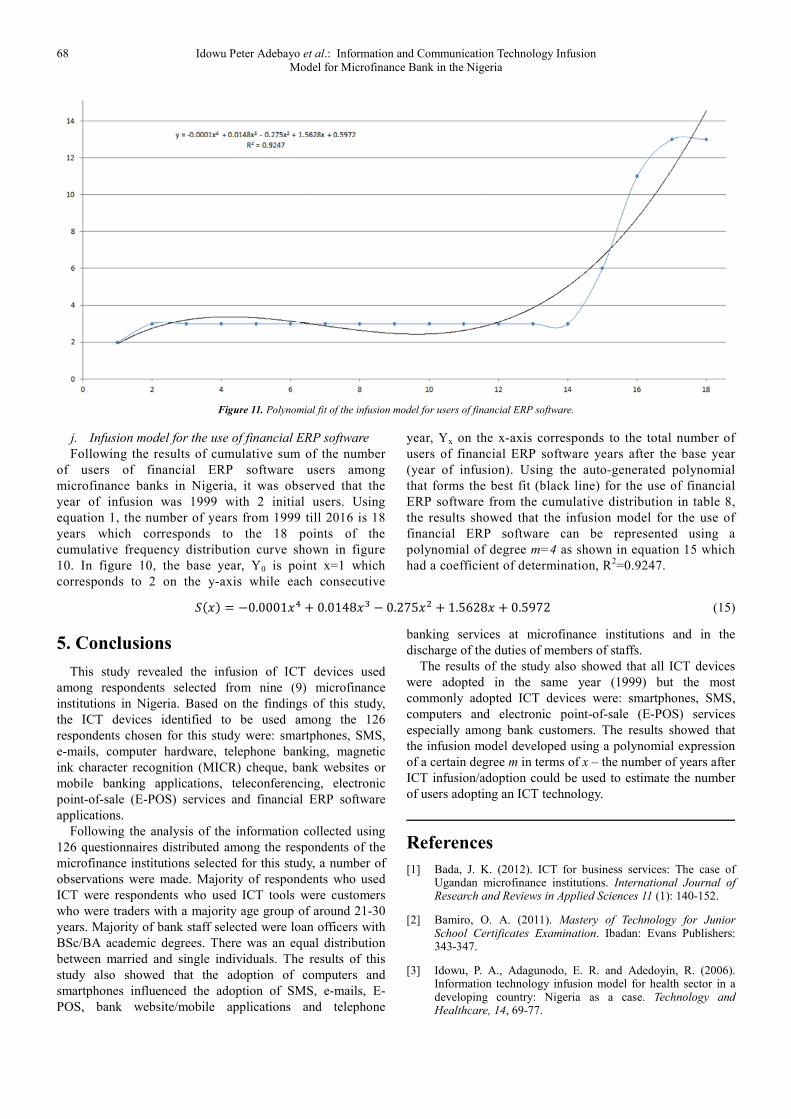
Figure 11. Polynomial fit of the infusion model for users of financial ERP software.
j. Infusion model for the use of financial ERP software
Following the results of cumulative sum of the number
of users of financial ERP software users among
microfinance banks in Nigeria, it was observed that the
year of infusion was 1999 with 2 initial users. Using
equation 1, the number of years from 1999 till 2016 is 18
years which corresponds to the 18 points of the
cumulative frequency distribution curve shown in figure
10. In figure 10, the base year, Y0 is point x=1 which
corresponds to 2 on the y-axis while each consecutive
year, Yx on the x-axis corresponds to the total number of
users of financial ERP software years after the base year
(year of infusion). Using the auto-generated polynomial
that forms the best fit (black line) for the use of financial
ERP software from the cumulative distribution in table 8,
the results showed that the infusion model for the use of
financial ERP software can be represented using a
polynomial of degree m=4 as shown in equation 15 which
had a coefficient of determination, R2=0.9247.
���� = −0.0001�� � 0.0148�� � 0.275� � 1.5628� � 0.5972 (15)
5. Conclusions
This study revealed the infusion of ICT devices used
among respondents selected from nine (9) microfinance
institutions in Nigeria. Based on the findings of this study,
the ICT devices identified to be used among the 126
respondents chosen for this study were: smartphones, SMS,
e-mails, computer hardware, telephone banking, magnetic
ink character recognition (MICR) cheque, bank websites or
mobile banking applications, teleconferencing, electronic
point-of-sale (E-POS) services and financial ERP software
applications.
Following the analysis of the information collected using
126 questionnaires distributed among the respondents of the
microfinance institutions selected for this study, a number of
observations were made. Majority of respondents who used
ICT were respondents who used ICT tools were customers
who were traders with a majority age group of around 21-30
years. Majority of bank staff selected were loan officers with
BSc/BA academic degrees. There was an equal distribution
between married and single individuals. The results of this
study also showed that the adoption of computers and
smartphones influenced the adoption of SMS, e-mails, E-
POS, bank website/mobile applications and telephone
banking services at microfinance institutions and in the
discharge of the duties of members of staffs.
The results of the study also showed that all ICT devices
were adopted in the same year (1999) but the most
commonly adopted ICT devices were: smartphones, SMS,
computers and electronic point-of-sale (E-POS) services
especially among bank customers. The results showed that
the infusion model developed using a polynomial expression
of a certain degree m in terms of x – the number of years after
ICT infusion/adoption could be used to estimate the number
of users adopting an ICT technology.
References
[1] Bada, J. K. (2012). ICT for business services: The case of Ugandan microfinance institutions. International Journal of Research and Reviews in Applied Sciences 11 (1): 140-152.
[2] Bamiro, O. A. (2011). Mastery of Technology for Junior School Certificates Examination. Ibadan: Evans Publishers: 343-347.
[3] Idowu, P. A., Adagunodo, E. R. and Adedoyin, R. (2006). Information technology infusion model for health sector in a developing country: Nigeria as a case. Technology and Healthcare, 14, 69-77.

International Journal of Finance and Banking Research 2017; 3(4): 57-69 69
[4] Idowu, P. A., Eyitope, O and Idowu, B. (2003). Information and Communications Technology in Nigeria - The Health Sector Experience. Journal of Information Technology Impact, 3 (2), 69-73.
[5] Frankiewicz, C. (2003). Information Technology as a strategic tool for Microfinance in Africa. A seminar Report, April 26-27, 2016 at Nairobi, Kenya.
[6] Srinivasan, R. and Sriram, M. S. (2003). Microfinance: An introduction. IIMB Management Review: 52 – 53.
[7] Mishra, B. L. and Chowbwy, M. (2009). Impact assessment of technology adoption in microfinance in India. Working Paper, Centre for Microfinance Research, Bankers Institute of Rural Development, Chandragupta Institute of Management, Patna.
[8] O’Flynn, M. (2008). ePayment: Powering West Africa. Card Technology Today: 10 – 11.
[9] CGAP Microfinance Gateway (2013). Technology FAQs. Retrieved from http://www.microfinancegateway.org/p/site/m/template.rc/1.11.48240/1.26.9192
[10] Laudon, D. P. and Laudon, J. P. (2001). Management Information System: Organization and Technology in the Network Enterprises 4th edition. Prentice Hall International, U. S. New American Corporation, New York: Dutton.
[11] Turban, E. and King, D. (2003). Introduction to E- Commerce. New Jersey: Pearson Education.
[12] Khattab, I., Balola, Y and Eldabi, T. (2012). Factors influencing branchless banking for microfinance in Sudan: Theoretical perspectives and future directions. In the Proceedings of the European, Mediterranean & Middle Eastern Conference on Information Systems.
[13] European Microfinance Network (2012). The use of technology in microfinance. Retrieved from http://www.fgda.org/dati/ContentManager/files/The-use-of-technology-in-Microfinance. pdf on June 23, 2016.
[14] Epstein, M. J. and Yuthas, K. (2010). Mission impossible: diffusion and drift in the microfinance industry. Sustainability Accounting, Management and Policy Journal 1 (2): 201 - 221.
[15] Microfinance Africa (2011). Pakistan: Branchless banking carries out Rs 59bn transactions till September. Retrieved from http://microfinanceafrica.net/tag/branchless-banking/ on June 25, 2016.
[16] Conflux Technologies (2010). Management Information System for Microfinance Institute. Retrieved from http://www.confluxtechnologies.com/1/post/2010/06/management-information-system-for-microfinance-institute.html on June 23, 2016.
[17] Dailey, P. and Firpo, J. (2007). Microfinance and branchless banking: Models, constraints and recommendations. In Proceedings of the Widening Harmonized Access to Microfinance (WHAM) and Advancing Microfinance for Post- disaster Economic Reconstruction (AMPER) Projects.
[18] Akintaro, S. (2011). Going Cashless: Knock! Knock!! Here comes the e-era. Retrieved 19 June 2013 from http://www.ittelecomdigest.com/cover12-dec.htm on June 24, 2016.
[19] Kruger, H., Drevin, L. and Steyn, T. (2006). A framework for evaluating ICT security awareness. In Proceedings of International Information Security South African Conference at North-West University - Potchefstroom Campus, Johannesburg (5-7 July, 2006). ISBN: 1-86854-636-5.
[20] Agbolade, O. K. (2011). Information and Communication Technology and Banks Profitability in Nigeria. Australian Journal of Business and Management Research 1 (4): 102 – 107.
[21] Dauda, Y. A. and Akingbade, W. A. (2011). Technology Innovation and Nigerian Banks Performance: The assessment of employees’ and customer’s responses. American Journal of Social and Management Sciences 2 (3): 329 – 340.