informal care: choice or constraint? · pdf fileinformal care: choice or constraint?...
TRANSCRIPT

Informal care: choice or constraint?Al-Janabi, Hareth; Carmichael, Fiona; Oyebode, Jan R.
DOI:10.1111/scs.12441
License:Other (please specify with Rights Statement)
Document VersionPeer reviewed version
Citation for published version (Harvard):Al-Janabi, H, Carmichael, F & Oyebode, JR 2017, 'Informal care: choice or constraint?' Scandinavian Journal ofCaring Sciences. DOI: 10.1111/scs.12441
Link to publication on Research at Birmingham portal
Publisher Rights Statement:This is the peer reviewed version of the following article: [FULL CITE], which has been published in final form at [Link to final article using theDOI]. This article may be used for non-commercial purposes in accordance with Wiley Terms and Conditions for Self-Archiving.
General rightsUnless a licence is specified above, all rights (including copyright and moral rights) in this document are retained by the authors and/or thecopyright holders. The express permission of the copyright holder must be obtained for any use of this material other than for purposespermitted by law.
•Users may freely distribute the URL that is used to identify this publication.•Users may download and/or print one copy of the publication from the University of Birmingham research portal for the purpose of privatestudy or non-commercial research.•User may use extracts from the document in line with the concept of ‘fair dealing’ under the Copyright, Designs and Patents Act 1988 (?)•Users may not further distribute the material nor use it for the purposes of commercial gain.
Where a licence is displayed above, please note the terms and conditions of the licence govern your use of this document.
When citing, please reference the published version.
Take down policyWhile the University of Birmingham exercises care and attention in making items available there are rare occasions when an item has beenuploaded in error or has been deemed to be commercially or otherwise sensitive.
If you believe that this is the case for this document, please contact [email protected] providing details and we will remove access tothe work immediately and investigate.
Download date: 21. May. 2018

Informal care: choice or constraint?Al-Janabi, Hareth; Carmichael, Fiona; Oyebode, Jan R.
Document VersionPeer reviewed version
Citation for published version (Harvard):Al-Janabi, H, Carmichael, F & Oyebode, JR 2017, 'Informal care: choice or constraint?' Scandinavian Journal ofCaring Sciences.
Link to publication on Research at Birmingham portal
General rightsWhen referring to this publication, please cite the published version. Copyright and associated moral rights for publications accessible in thepublic portal are retained by the authors and/or other copyright owners. It is a condition of accessing this publication that users abide by thelegal requirements associated with these rights.
• You may freely distribute the URL that is used to identify this publication.• Users may download and print one copy of the publication from the public portal for the purpose of private study or non-commercialresearch.• If a Creative Commons licence is associated with this publication, please consult the terms and conditions cited therein.• Unless otherwise stated, you may not further distribute the material nor use it for the purposes of commercial gain.
Take down policyIf you believe that this document infringes copyright please contact [email protected] providing details and we will remove access tothe work immediately and investigate.
Download date: 24. Mar. 2017

1
Informal care: choice or constraint?
Hareth Al-Janabi1*, Fiona Carmichael2, Jan Oyebode3
1 Health Economics Unit, Institute of Applied Health Research, University of Birmingham, UK
2 Business School, University of Birmingham, UK
3 Faculty of Health Studies, University of Bradford, UK
*Corresponding author at: Public Health Building, University of Birmingham, Edgbaston,
Birmingham, UK, B15 2TT. Tel: +44 1214158483. Email: [email protected]
Acknowledgements: The authors wish to thank the survey respondents, Phil Chan and Bristol City
Council for collecting the 2009 quality of life data, and Sabina Sanghera for comments on an earlier
draft of the paper. The authors also wish to thank participants at the British Society of Gerontology
(Keele, 2012) and International Association for Feminist Economics (Palo Alto, 2013) where earlier
versions of this work were presented. Hareth Al-Janabi was supported through this work by an MRC
early career fellowship in economics of health (G1002334).
Author contributions: HA conducted the data analysis and wrote the first draft of the manuscript. All
authors contributed to the study design, study conduct and later drafts of the manuscript.
Funding: Hareth Al-Janabi was supported through this work by an MRC early career fellowship in
economics of health (G1002334).
Ethical approval: The study is based on data collected as part of a local government survey of quality
of life of local residents. The local government organisation has an internal ethical review process for
their survey work.

2
Abstract
Background: ‘Choice’ is increasingly pursued as a goal of social policy. However the degree to which
choice is exercised when entering an informal caring role is open to debate.
Aim: In this study, we examined the degree of choice and constraint in entering a caring role, and the
relationship between choice and carers’ wellbeing.
Methods: Data were derived from 1100 responses to a postal survey conducted in a British City.
Statistical tests of association and multivariable regression modelling were applied to study the
factors associated with choice in entering a caring role and the association that choice in entering a
caring role had with carers’ wellbeing.
Results: We found that informal care was generally perceived to be a free choice, albeit in most cases,
a choice that was also constrained by duty, financial or social resources. Having a sense of free choice
in entering care was strongly and positively associated with the carer’s wellbeing.
Conclusion: The study findings are consistent with a view that enabling individuals to have more
choice in their caring roles may be beneficial.
Key words: informal care, choice; motivation; wellbeing; quality of life; survey
Word count: 5214

3
INTRODUCTION
Rising healthcare costs mean that governments increasingly look to the family for care for individuals
unable to look after themselves (1, 2). In the UK, 2011 Census figures suggested that over six and a
half million people, just over 10 percent of the population, were involved in family (informal) care of
an adult or disabled child (3). 38 percent of carers in England and Wales were estimated to provide 20
or more hours of care a week with 23 percent providing 50 or more hours of informal care (3).
Informal care can be very demanding, often requiring individuals to sacrifice their own health (4),
work (5) and relationships (6). While many people willingly care for a loved one at times of need, the
degree to which they exercise a choice in doing so is open to debate. Given the increased attention to
choice for care recipients in policy-making (7), it is worth examining the degree to which providing
informal care is perceived to be free choice by the individuals concerned.
The focus in this study is on choice in taking on the caring role. The issue of degree of choice within
the caring role, for example in relation to combining work and care, is discussed elsewhere (8). Choice
on entry to a caring role refers to the degree to which the carer has a sense of freedom about whether
to opt into the role. A perceived lack of choice could be related to particular social or environmental
constraints. In contrast, the conscious exercising of choice to take on a caring role could be related to
one or more motivations for caring.
The reasons why so many individuals decide to engage in informal care, particularly when it is very
time intensive are not well understood. At one end of the spectrum, there is the view that people who
become carers do so because they feel obliged to act as a carer when a family member becomes ill (9-
11). This sense of responsibility or duty is tied to social norms (12) and may allow little room for
manoeuvre. For example, a social norm that children should care for their ageing parents, as legally
formalised through the French obligation alimentaire system, would oblige people to provide elder
care, although this could be shared among siblings or one or more siblings could take overall
responsibility. The responsibility view suggests that demand will create its own supply and this
perspective is supported to some extent by evidence that the proportion of women providing

4
intensive (>15 hours per week) out-of-home care in the USA is identical across pre-baby boomer and
baby boomer cohorts (13).
Carers may be constrained by factors other than duty. Carers are often in poor financial circumstances
(14); this may limit private care options, and inhibit carers’ ability to exercise choice about entering
caring. There may also be few, if any, other care options within the family. This may arise as a result
of a physical absence of other family members to care or because certain members of the family are
unwilling to take on a caring role (15, 16).
At the other end of this spectrum is the view is that a decision to undertake care is essentially a
rational choice. This decision reflects individual cost benefit calculations linked to factors such as
loss of income, ill-health or increased stress due to caring responsibilities and any avoidance of guilt,
satisfaction or ‘process utility’ derived from the provision of informal care (17). The rational choice
perspective is supported by evidence that individuals in full time employment and higher earners are
less likely to take on intensive caring responsibilities (18). The rational choice perspective suggests
that whether or not the supply of informal care will increase to meet any rise in demand will depend
on trends in employment and policies to support working carers.
A pragmatic approach would suggest that the degree of choice available to potential carers will differ
depending on their individual circumstances and those of the people needing care; for some the
degree of choice may be more constrained than for others. The nature of these circumstances might
also change over time and as people age. The critical feminist economics discourse on altruism,
reciprocity and norms of responsibility provides some insights on these potential influences. Folbre
((19), p.75) defines caring as ‘labor undertaken out of affection or a sense of responsibility for other
people, with no expectation of immediate pecuniary reward’. The concept of reciprocity for either
tangible or emotional services is linked to systems of gift giving (19) and precautionary expectations
about an individual’s own future care needs. Reciprocity implies the existence of a prior or extant
relationship (20); for example, elder care by children reciprocates the original gift of the parent’s care.

5
To date, there has been relatively limited empirical study of the degree to which family members feel
they are exercising choice in taking on a caring role (8). One recent US study of older carers found
under half of carers perceived their care to be a free choice (21). Similar findings have been reported
in the UK, with the 2009/10 Survey of Carers in the Household suggestion that many carers
perceived little or no conscious choice in caring. In this study 54% stated that caring was expected of
them (i.e. it’s what families do), 15% stated the care recipient would not want anyone else doing the
caring and 12% reported that no-one else was available (22).
The high proportion of carers who feel constrained in their caring role is underscored by related
research on the reasons for caring. A study of Dutch carers found that the most common reason for
caring was ‘duty’ and that other constraints such as being ‘the only one...available’ were also
mentioned as important factors (17). Cicerelli found that caregiving was motivated by both a sense of
obligation and a sense of attachment (23); and a stronger sense of obligation was associated with
greater feelings of burden. In contrast, a Europe-wide study of carers found “emotional bonds” (i.e.
love and affection) were the principle motivation for providing care (24). Duty, obligation, and a lack
of other alternatives were highlighted in far fewer cases. The importance of emotional bonds in
motivating care and sustaining carer wellbeing has also been found in the context of dementia care,
where pre-existing relationships characterised by reciprocity were associated with higher carer
wellbeing (25). Given the context for informal care, it can be seen that the constraints placed by
normative and societal pressures, as well as necessity, are likely to limit objective choice to provide
family care, but also that the anticipated rewards of caregiving may lead some to take on the role of
carer out of choice.
The evidence on caring and wellbeing suggests that, in general, more intensive caring roles, and
specifically transitions into caring roles are associated with lower levels of wellbeing (26-29). The
negative effects on wellbeing are especially strong for carers who are closely related to the care
recipient (27). In terms of exercising choice about entering caring, Schulz et al (21) found that a lack of

6
choice among carers of older people was associated greater emotional stress, physical strain and
negative health effects. Exercising choice to enter a caring role may indicate that the carer thinks they
will be able to handle the caring role. Indeed it has been suggested that the negative impact of caring
on wellbeing may stem from the loss of autonomy and choice that an intensive caring role imposes
(27). Furthermore autonomy over one’s life is seen as intrinsic to wellbeing in self-determination
theory (30) and the capability approach (27). As such, it seems likely that greater choice to enter a
caring role will be associated with higher levels of wellbeing, whether the focus is on hedonic
wellbeing (indicated by traits such as happiness and life satisfaction) or eudemonic wellbeing
(indicated by traits such as capability and flourishing).
Our study addresses a gap by examining both choice and constraints in relation to entering caring.
This is important because choice and constraints are likely to act simultaneously and may play a large
role in the carer’s subjective experience of caring. Our objectives were to: (i) establish the degree to
which individuals perceive caring to be choice or a constraint; (ii) identify whether the degree of
choice varies according to carers’ characteristics and caring role; and (iii) estimate the association
between choice in caring and the carer’s wellbeing. We investigated these issues using data from a
survey of individuals living in a large city in the UK.
METHODS
This study is a secondary analysis of cross-sectional data collected through a local government survey
of residents’ quality of life. The survey covered a range of aspects of individuals’ lives, including a
module of question about the provision of informal care. The informal care questions covered the
individual’s decision to provide care; these survey data therefore offered an opportunity to study the
decision to care amongst a heterogeneous group of carers in a community setting. Alongside data on
informal care, data were collected on individuals’ socio-demographic circumstances and wellbeing
and these data were used to examine the factors associated with choice in caring and the relationship
between wellbeing and perceived choice in caring. Details of the survey, the construction of the choice
in caring variable, and the subsequent analysis are reported below.
7
The Quality of Life Survey
The data used in the study came from the 2009 Bristol City Council Quality of Life Survey (31). This is
an annual postal survey of 25,000 representative residents of Bristol. Residents are randomly selected
from the Electoral Register for this voluntary postal survey every September. The survey covers a
range of topics relevant to the local authority, including the individual’s local area, home, lifestyle,
wellbeing and socio-demographic characteristics. In 2009, respondents were also surveyed about their
informal care. To identify those providing informal care, respondents were asked, as part of the
survey, whether they “looked after, or gave any help or support to family members, friends, neighbours or
others because of long-term physical or mental ill-health or disability, or problems related to old age”. The full
question, provided in the appendix, closely resembles the question used in the UK population census.
Respondents who indicated that they provided informal care were asked to complete a set of
additional questions about their informal care provision. These are abbreviated and listed below:
How many hours of care are provided per week? (< 20 hours / 20-49 hours / 50 hours +)
How old is the care recipient? (0-17 years / 18-64 years / 65 years and over)
What is the health of the care recipient like? (good/ fair / bad)
Are you the main carer for this person? (yes / no)
Do you help with personal care? (yes / no)
Do the following features of care provision apply?
o I provide care because it is my duty? (yes / no)
o I had a free choice to provide care? (yes / no)
o There was no-one else to provide care? (yes / no)
o There was no money for paid care? (yes / no)
Respondents also completed the Carer Experience Scale (Al-Janabi et al., 2008) - a six-item scale
measuring carer quality of life. No questions were included on other aspects of informal care
provision, for example, on the duration of caring, the carer-recipient relationship, the carer’s marital
status, whether they co-resided with the care recipient or whether they had multiple caring roles.

8
5771 individuals responded to the survey, of whom 1,100 (19%) indicated that they provided some
informal care in a typical week. This survey met the Local Authority standards of conduct, was
compliant with UK law on data protection, and participation was both anonymous and voluntary.
Creating a variable to indicate perceived ‘choice in caring’
We combined the responses to the four questions concerning individuals’ decision to care to
simultaneously examine carers’ perceptions of choice and constraints in caring. This allowed for a
more nuanced analysis than simply studying the responses to the four questions in isolation. To
investigate the degree to which caring was perceived to be a free choice, carers were categorised into
three groups. In the first group were carers who reported caring was a free choice, and not
constrained by duty, finances or social support (‘free-choice’ carers). A second group comprised those
carers who reported caring was a free choice, but also reported that at least one of the constraints was
also present (‘constrained choice’ carers). The third group comprised carers who indicated that caring
was not a free choice (‘unfree’ carers).
Predictors of choice in caring
The analysis involved two stages. The first investigation focused on identifying whether perceived
choice in caring (as measured by the new three category variable) was affected by socio-demographic
factors and the nature of the caring role entered into. To examine the effect of socio-demographic
factors, we examined variables related to demography (age, sex, health status), culture (religion,
ethnicity) and empowerment (qualifications, home ownership, and receipt of benefits). For caring
role, we examined variables related to the nature of caring role (primary or secondary), the provision
of personal care, hours of caring, the health status of the care recipient, and the age of the carer
recipient. We used cross-tabulations to explore the magnitude of associations between perceived
choice in caring and these variables and, given the ordinal nature of the perceived choice variable,
used Kruskall-Wallis tests to identify statistical significance of any associations.

9
Associations between choice in caring and carer wellbeing
The second stage of the investigation focused on the relationship between perceived choice in caring
and carers’ subsequent wellbeing. We examined individuals’ hedonic wellbeing (32) using two
survey questions about their happiness and satisfaction with life. The happiness question had four
possible responses on a Likert scale ranging from ‘not at all happy’ to ‘very happy’. The life
satisfaction question was rated from 1 (‘completely dissatisfied’) to 10 (‘completely satisfied’). We
examined individuals’ eudemonic wellbeing (33) using the ICECAP-O (34) capability questions and ,
for carers, additionally, the Carer Experience Scale (35). The ICECAP-O measure comprises questions
about five core capabilities in life and responses can be scored to generate an overall score between 0
(no capability) and 1 (full capability) for the respondent (34). The Carer Experience Scale comprises
questions about six aspects of care-related quality of life and responses can be scored to generate a
score between 0 (worst caring experience) and 100 (best caring experience) (36). The life satisfaction
and happiness questions are listed in the appendix along with the ICECAP-O and CES items.
To analyse the relationship between the measures of wellbeing and perceived choice in caring and
wellbeing we used Kruskall-Wallis (non-parametric) tests. We then used multivariable regression
modelling, to allow for the fact that the relationship between wellbeing and perceived choice in caring
may be confounded by other factors. This involved modelling wellbeing responses as a function of
the degree of choice in caring (‘free’, ‘constrained’ or ‘unfree’) controlling for socio-demographic and
care-related factors. We estimated the regression model where the dependent (wellbeing) variable
was (i) life satisfaction; (ii) happiness (iii) capability (ICECAP-O score) and (iv) caring experience
(CES) score.
10
RESULTS
Sample characteristics
Of the 1100 carers who responded to the quality of life survey, 798 (73%) answered the question about
whether their decision to care was a free choice. The analyses that follow focus on these individuals.
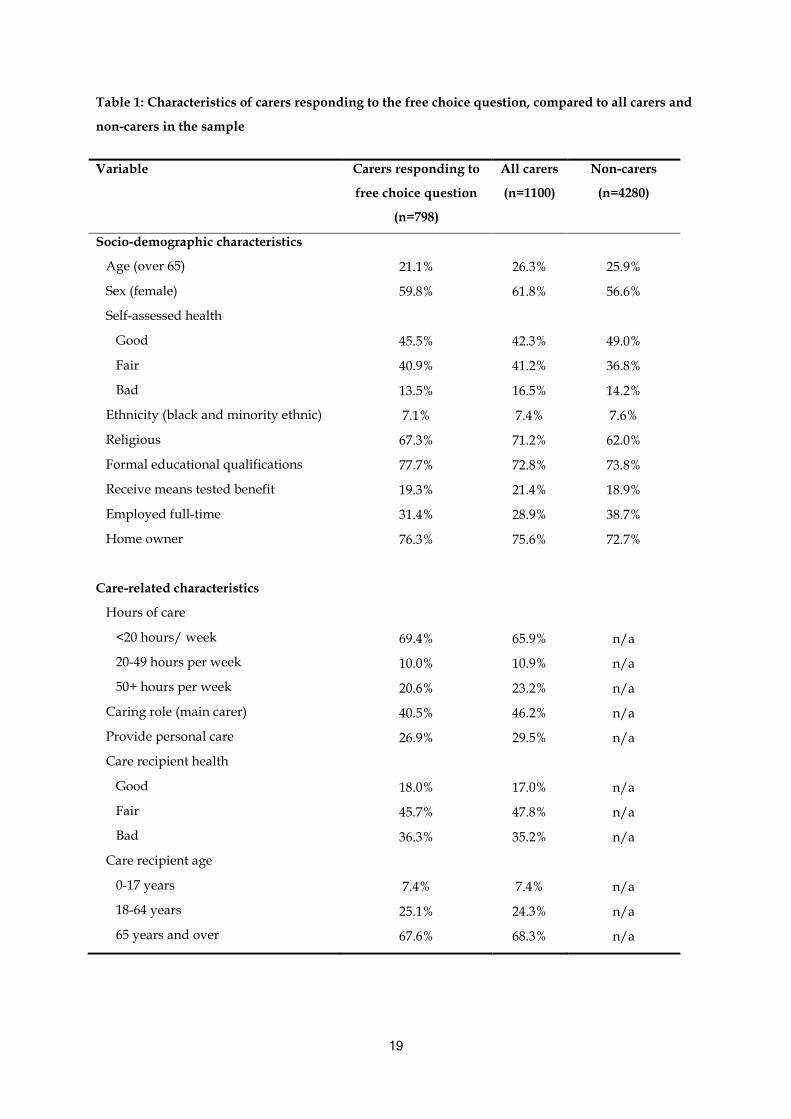
To set the sample of carers in context, Table 1 shows the characteristics of these carers in comparison
with all carers that responded to the survey and the non-carer survey respondents. The carers who
responded to the questions about choices and constraints were more likely (p<0.05) to be younger,
male, have qualifications, be employed, not be in receipt of benefits and be non-religious. They were
also less likely to care for someone in bad health, be a main carer, care for 50+ hours per week and
provide personal care.
Insert Table 1 around here
Table 2 shows, that in terms of the decision to provide care, more than four-fifths of carers indicated
that their decision to provide care was a free choice, and over half that they cared out of a sense of
‘duty’. Around a third indicated that no one else was available (39.5%) or that there was no money for
paid care (32.5%).
Insert Table 2 around here
Perceived choice in caring
Following the creation of the new variable (see Figure 1), around a third (32.6%) of individuals were
‘free choice’ carers. Around half (48.7%) were classified as perceiving a ‘constrained choice’ in caring.
Just over a sixth (18.7%) of individuals were classified as ‘unfree’ as they responded negatively to the
question on free choice indicating that they did not perceive caring as a free choice. This comprises
16.1% of the sample who indicated that they were ‘constrained’ by duty, a lack of others to care
and/or lack of money and 2.5% who responded ‘no’ to the free choice question but did not tick any of

11
the options about constraints (unfree and constrained by something other than duty a lack of others
to care or lack of money for paid care).
Insert Figure 1 around here
Table 3 reports the associations between carers’ perceived choice and socio-demographic
characteristics of the carer and the caring role entered into. Carers who perceived themselves to be in
bad health were more likely to feel constrained in their caring role (p=0.03). Also carers who received
state benefits were also more likely to see themselves as constrained (p=0.05). However, none of the
other characteristics of the carers were related to the perception of choice in the decision to care (at
p<0.05)). In contrast, choice in caring was related to most of the characteristics of the caring role.
Perceived choice was lower amongst carers who undertook a primary caring role, provided personal
care, cared for 50+ hours per week or cared for someone in bad health. Perceived choice was
unrelated to the age of the care recipient. These results indicate that those carers providing the most
intensive care (longer hours or personal care and/or in a main caring role caring for someone likely to
have more intense care needs) perceived themselves as having the least choice in relation to their
caring commitment.
Insert Table 3 here
Table 4 shows that carers included in this sample recorded slightly lower levels of wellbeing (whether
hedonic or eudemonic) on average than non-carers. The mean caring experience in this sample is
rated as slightly worse in this sample (mean 69 vs 72) than recorded in a recent study of carers of
patients at end-of-life (37).
Insert Table 4 here

12
Table 5 documents associations between wellbeing and perceived choice in caring. Across all
measures of wellbeing, higher levels of choice are associated with higher wellbeing. In all cases the
association between wellbeing and choice in caring was strongly significant (p<0.01). Carers who care
as a result of a free choice (only) also scored higher than non-carers in terms of life satisfaction
(p=0.06), happiness (p=0.09) and capability (p=0.02). Conversely, carers who report a lack of free
choice in caring, report levels of life satisfaction (p<0.01), happiness (p<0.01) and capability (p<0.01)
below the level reported by non-carers.
Insert Table 5 here
The regression models express wellbeing in terms of carers’ life satisfaction, capability and caring
experience (Table 6) and carers’ happiness (Table 7). The reported regressions in Table 6 were
estimated using ordinary least squares (OLS). As a sensitivity analysis we also estimated the life
satisfaction model using ordered logit and the carers’ capability model using a double-censored Tobit
(censored at 0 and 1). The OLS regression models confirm that the strong association between choice
in caring and wellbeing persists when controlling for the presence of other contextual variables
relating to the characteristics of the carer and the caring situation. The results from sensitivity
analyses (available on request) also demonstrate the same pattern of strong association between
freedom of choice and carer wellbeing, albeit with some minor differences in the significance of
contextual variables.
Insert Tables 6 and 7 here
Controlling for other factors, having a constrained choice in caring (relative to no free choice) was
associated, on average, with:
Higher life satisfaction (nearly half a point, on a 1 to 10 scale);
Higher capability (0.02 points on a 0 to 1 scale);
Better caring experience (6.7 points on a 0-100 caring experience scale);

13
Lower odds of reporting being unhappy (odds ratio 0.68).
Controlling for other factors, having a free and unconstrained choice in caring (relative to no free
choice) was associated with even stronger associations with life satisfaction, capability, caring
experience and happiness. The magnitude of these associations with wellbeing can be put into
context by comparing them with other factors associated with wellbeing. For example, in terms of life
satisfaction, the positive impact of free (unconstrained) choice is greater than the positive impact of
having educational qualifications or home ownership. In terms of capability, the positive impact of
free choice is comparable to the positive association with home ownership.
DISCUSSION
This study suggests that people often see participation in informal care as both a choice and a
constraint. In this survey, around half the sample of UK carers described their decision to provide
informal care as a free choice but constrained by a sense of duty, financial resource, or lack of social
support. Most socio-demographic factors were not related to the perception of choice in caring.
Conversely, aspects of the caring role linked to caring intensity (such as being a primary carer and
providing personal care) were strongly associated with a perception of less choice. The perception of
choice was strongly related to carers’ subsequent wellbeing, controlling for the fact that those carers
who perceived free choice tended to have less intensive caring roles.
The finding that many people perceived some form of constraint in caring is not surprising, given
previous research (17, 23, 38). This corresponds with other studies in the UK and Netherlands (17, 22)
which suggest that duty and an expectation that care will be provided are prime factors behind the
decision to care. However the high proportion of carers who felt their decision was a free choice even
though constraints were present is more intriguing. Viewed from the rational choice perspective,
which is based on the notion of a human being weighing up cost-benefits of his or her decisions, this
could be seen as reflecting the complex reality of the decision to care. It is consistent, for example,

14
with the carer needing to make a series of decisions regarding the choice to care in the face of a range
of constraints. People may enter and exit caring, make decisions about how much care to provide and
what tasks they can undertake. There may be an element of choice in some aspects of these decisions
and not in others. For instance, Arksey and Glendinning (8) draw a distinction between the decision
to enter a caring role and the choices within the caring role. Furthermore, decisions about caring are
neither made in a vacuum nor at a single moment in time and therefore scope for choice about caring
can vary over life-courses; for example because of age and wider social factors including changing
gender norms (39, 40) as well as gaps and transitions in careers, family environments (41), and other
more temporally proximal events (42).
It is also possible that while the decision to take on caring is constrained by economic, social and
normative pressures, and might not appear by others to be chosen, nonetheless, the person taking on
this role benefits from perceiving it as being chosen from free will. Psychological theory and research
suggests and demonstrates that people are meaning-making beings, and that subjective meanings
often mediate between a situation and a person’s reaction to it (43). Having a sense of perceived
control is vitally connected to well-being (44) and generating a belief that one has entered into
caregiving through choice is a protective coping strategy that is likely to enable a carer to continue
with their role without resentment (45). It may be much better for a person’s health to see him or
herself as having taken on caring not due to societally imposed duty, but due to his or her
internalised values about the importance of looking after close family members. It may be the value of
perceived control that is responsible for the majority of carers in our sample falling into the group of
those with ‘constrained choice’.
The lack of association between perceived choice and socio-demographic characteristics was
unexpected. We did not find that perceived choice was any lower for example for women or those
with less financial capability, for example. This may be because the perception of choice to provide
care is highly subjective. It might also be because choice in caring is more strongly influenced by other
lenses such as the kin relationship between carer and recipient, for example, there may be less

15
perceived freedom in the decision to undertake spousal or parental care than care for an elderly
relative or friend; or the degree of prior attachment, for example, a daughter who feels close to her
elderly mother may choose to take on the role of caring, over and above other siblings who do not feel
as emotionally close.
We also found that choice in caring was strongly linked with the entry into secondary caring roles,
especially where the recipient was not in ‘bad’ health and when no personal care was provided. One
interpretation is that the perception of choice about the decision to provide care is evaluated in the
context of the intensity of ongoing care provision, as much as in relation to the initial decision to
provide care. In situations where a care role is less intensive, the carer takes on the role knowing he or
she retains some freedom to live life other than through caring. In circumstances where care needs are
more intensive, becoming the primary carer will constrain or force other roles to be abandoned or
neglected. Furthermore the carer may not be in a position to withdraw if the one cared for is in poor
health. In these circumstances, it becomes harder to generate a narrative of choice, hence the
association of lower choice with being a primary carer, providing personal care and caring for
someone in poor health.
While a positive relationship between choice in caring and wellbeing was expected, the magnitude of
the effect found in this study is worth emphasising. Choice in caring seems as important in terms of
the carer’s wellbeing, if not more so, than ‘objective’ factors for example whether the carer provides
personal care or whether the care-recipient is in good health. Choice in caring may therefore be a
valuable target for policy-makers concerned about improving carer wellbeing. Future research might
focus on developing an understanding of the degree to which social policy can expand perceived
choice in caring and which aspects of choice can and ought to be targeted. It is important to highlight
that choice is important not only in entry to the caring role, but also within the caring role. As a result
there may be gains to carers from expanding choice in the amount and type of social care support (46)
and combining work and care (8, 47). Interventions for carers of people with long-term conditions
include elements aimed at increasing perceived control and capability (48). Further development and

16
evaluation of such approaches through media other than 1:1 therapy, such as social media or self-help
networks could be a further way forward.
It is important, however, not to draw definitive conclusions about a causal link between choice in
caring and wellbeing. This is a cross-sectional study and it could be the case that carers with better
wellbeing were more able to exercise choice about whether to take on a caring role, or their higher
well-being made them more likely to feel as if they had choice to take on the role. Furthermore, the
lack of some key variables means that we are unable to describe the sample as comprehensively as we
would have liked, and examine other potentially relevant factors in relation to carers’ choices and
constraints. A range of factors, in addition to duty, family support and financial resources are likely to
motivate and constrain decisions in relation to providing informal care. For example we did not
explore some of the positive motivations for care, such as emotional bonds, that have been
highlighted in other studies (24, 25). Finally, a limitation of this work is the low response rates to both
the quality of life survey as whole and the questions about choices and constraints in caring. Some
carers may have found these questions difficult to answer or intrusive. This may have created some
selection bias, for example carers who responded to these questions were more likely to be in higher
socio-economic groups than those who did not answer the questions and less likely to be in intensive
caring roles. When considering the generalisability of the results, it is also important to note that the
analysis is limited to a sample of carers living in one city in England.
CONCLUSION
This study suggests that, for many, entry into caring is perceived as both a choice and a constraint.
Perception of choice in entering caring is positively associated with wellbeing. Further research is
needed to specify aspects of caring where free choice generates higher wellbeing and whether these
can be enhanced by social policy. Nevertheless this study suggests, in general terms, that there may
be significant benefits to carers from enhancing their choice on entry to a caring role.

17
Reference List
1. HM Government. Recognised, valued and supported: next steps for the carers strategy. 2011. 2. Pickard L, Wittenberg R, Comas-Herrera A, King D, Malley J. Care by spouses, care by children: projections of informal care for older people in England to 2031. Social Policy & Society. 2007;6(3):353-66. 3. ONS. 2011 Census Analysis: Unpaid care in England and Wales, 2011 and comparison with 2001. 2013. 4. Pinquart M, Sorensen S. Differences between caregivers and noncaregivers in psychological health and physical health: a meta-analysis. Psychology and Aging. 2003;18(2):250-67. 5. Carmichael F, Charles S. The opportunity costs of informal care: does gender matter? Journal of Health Economics. 2003;22(5):781-803. 6. Pitkeathley J. It's my duty, isn't it? London: Souvenir Press; 1989 1989. 7. Department of Health. Equity and excellence: liberating the NHS. London: 2010 8. Arksey H, Glendinning C. Choice in the context of informal care‐giving. Health & Social Care in the Community. 2007;15(2):165-75. 9. Graham H. Caring: a labour of love. London: Routledge; 1983. p. 13-30. 10. Badgett L, Folbre N. Assigning care: gender norms and economic outcomes. International Labour Review. 1999;138(3):311-26. 11. Twigg J, Atkin K. Carers Perceived: policy and practice in informal care. Buckingham, UK: Open University Press; 1994 1994. 12. Della Giusta M, Jewell S. Unpaid work and conformity: why care? Cambridge Journal of Economics. 2015;39:689-710. 13. Jacobs J, Van Houtven C, Laporte A, Coyte P. Baby boomer caregivers in the workforce: do they fare better or worse than predecessors? Canadian Centre for Health Economics, 2014 Working paper no. 2014-02. 14. Carers UK. Facts about carers 2014. http://www.carersuk.org/for-professionals/policy/policy-library/facts-about-carers-2014. 15. Qureshi H, Walker A. The caring relationship: elderly people and their families. Basingstoke: MacMillan Education Ltd; 1989 1989. 16. Szinovacz M, Davey A. The division of parent care between spouses. Ageing & Society. 2008;28:571-97. 17. Brouwer W, Van Exel J, Van Den Berg B, Van Den Bos G, Koopmanschap M. Process utility from providing informal care: the benefit of caring. Health Policy. 2005;74:85-99. 18. Carmichael F, Charles S, Hulme C. Who will care? Employment participation and willingness to supply informal care. Journal of Health Economics. 2010;29(1):182-90. 19. Folbre N. "Holding hands at midnight": The paradox of caring labour. Feminist Economics. 1995;1(1):73-92. 20. Adams V, Sharp R. Reciprocity in Caring Labor: Nurses’ Work in Residential Aged Care in Australia. Feminist Economics. 2013;19(2):100-21. 21. Schulz R, Beach S, Cook T, Martire L, Tomlinson J, Monin J. Predictors and consequences of perceived lack of choice in becoming an informal caregiver. Aging & Mental Health. 2012;16(6):712-21. 22. The NHS Information Centre. Survey of carers in households 2009/10. NHS, 2010. 23. Cicirelli V. Attachment and obligation as daughters' motives for caregiving behavior and subsequent effect on subjective burden. Psychology and aging. 1993;8(2):144-55. 24. World Health Organisation. Dementia: a public health priority. Geneva, Switzerland: WHO, 2012. 25. Quinn C, Clare L, Woods B. The impact of the quality of relationship on the experiences and wellbeing of caregivers of people with dementia: A systematic review. Aging and Mental Health. 2009;13(2):143-54. 26. Hirst M. Carer distress: a prospective, population-based study. Social Science and Medicine. 2005;61:697-708.
18
27. Dolan P, Peasgood T, White M. Do we really know what makes us happy? A review of the economics literature on the factors associated with subjective well-being. Journal of Economic Psychology. 2008;29(1):94-122. 28. Van Den Berg B, Ferrer-i-Carbonell A. Monetary valuation of informal care: the well-being valuation method. Health Economics. 2007;16:1227-44. 29. Marks N, Lambert J, Choi H. Transitions to caregiving, gender and psychological well-being: a prospective US national study. Journal of Marriage and Family. 2002;64:657-67. 30. Deci E, Ryan R. "What" and "why" of goal pursuits: human needs and the self-determination of behavior. Psychological Enquiry. 2000;11(4):227-68. 31. Bristol City Council. The quality of life in Bristol. http://www.bristol.gov.uk/page/council-and-democracy/quality-life-bristol. 32. Kahneman D, Sugden R. Experienced Utility as a Standard of Policy Evaluation. Environmental & Resource Economics. 2005;32(1):161-81. 33. Sen A. The idea of justice. London: Allen Lane; 2009. 34. Coast J, Flynn T, Natarajan L, Sproston K, Lewis J, Louviere J, et al. Valuing the ICECAP capability index for older people. Social Science and Medicine. 2008;67(5):874-82. 35. Al-Janabi H, Coast J, Flynn T. What do people value when they provide unpaid care to an older person? A meta-ethnography with interview follow-up. Social Science and Medicine. 2008;67(1):111-21. 36. Al-Janabi H, Flynn T, Coast J. Estimation of a preference based Carer Experience Scale. Medical Decision Making. 2011;31(3):458-68. 37. Hoefman R, Al-Janabi H, McCaffrey N, Currow D, Ratcliffe J. Measuring caregiver outcomes in palliative care: a construct validation study of two instruments for use in economic evaluations. Quality of Life Research. 2014;In press:1-19. 38. Parveen S, Morrison V, Robinson C. Ethnic variations in the caregiver role: A qualitative study. Journal of health psychology. 2011;16(6):862-72. 39. Moen P, Robison J, Fields V. Women's work and caregiving roles: A life course approach. Journal of Gerontology. 1994;49(4):S176-S86. 40. Farré L, Vella F. The intergenerational transmission of gender role attitudes and its implications for female labour force participation. Economica. 2013;80(318):219-47. 41. Loretto W, Vickerstaff S. The relationship between gender and age. In: Parry E, Tyson S, editors. Managing an age diverse workforce. Basingstoke: Palgrave Macmillan; 2011. p. 59-79. 42. Loretto W, Vickerstaff S. The domestic and gendered context for retirement. Human relations. 2013;66(1):65-86. 43. Peterson C, Seligman M. Causal explanations as a risk factor for depression: theory and evidence. Psychological review. 1984;91(3):347. 44. Wawrziczny E, Berna G, Ducharme F, Kergoat M, Pasquier F, Antoine P. Modeling the Distress of Spousal Caregivers of People with Dementia. Journal of Alzheimer's Disease. 2016(Preprint):1-14. 45. Au A, Lau K, Sit E, Cheung G, Lai M, Wong S, et al. The role of self-efficacy in the Alzheimer's family caregiver stress process: A partial mediator between physical health and depressive symptoms. Clinical Gerontologist. 2010;33(4):298-315. 46. Pickard L, King D, Brimblecombe N, Knapp M. The effectiveness of paid services in supporting unpaid carers’ employment in England. Journal of social policy. 2015;44(03):567-90. 47. Bryan M. Access to flexible working and informal care. Scottish Journal of Political Economy. 2012;59(4):361-89. 48. Chenoweth L, Stein-Parbury J, White D, McNeill G, Jeon Y, Zaratan B. Coaching in self-efficacy improves care responses, health and well-being in dementia carers: a pre/post-test/follow-up study. BMC health services research. 2016;16(1):1.
19
Table 1: Characteristics of carers responding to the free choice question, compared to all carers and
non-carers in the sample
Variable
Carers responding to
free choice question
(n=798)
All carers
(n=1100)
Non-carers
(n=4280)
Socio-demographic characteristics
Age (over 65)
Sex (female)
Self-assessed health
Good
Fair
Bad
Ethnicity (black and minority ethnic)
Religious
Formal educational qualifications
Receive means tested benefit
Employed full-time
Home owner
Care-related characteristics
Hours of care
<20 hours/ week
20-49 hours per week
50+ hours per week
Caring role (main carer)
Provide personal care
Care recipient health
Good
Fair
Bad
Care recipient age
0-17 years
18-64 years
65 years and over
21.1%
59.8%
45.5%
40.9%
13.5%
7.1%
67.3%
77.7%
19.3%
31.4%
76.3%
69.4%
10.0%
20.6%
40.5%
26.9%
18.0%
45.7%
36.3%
7.4%
25.1%
67.6%
26.3%
61.8%
42.3%
41.2%
16.5%
7.4%
71.2%
72.8%
21.4%
28.9%
75.6%
65.9%
10.9%
23.2%
46.2%
29.5%
17.0%
47.8%
35.2%
7.4%
24.3%
68.3%
25.9%
56.6%
49.0%
36.8%
14.2%
7.6%
62.0%
73.8%
18.9%
38.7%
72.7%
n/a
n/a
n/a
n/a
n/a
n/a
n/a
n/a
n/a
n/a
n/a

20
Table 2: Choice in the decision to care (n=1100)
Characteristics of the decision to provide care
Yes No No response*
I had a free choice to provide care
I provide care because it is my duty
There was no-one else to provide care
There was no money for paid care
649
569
297
219
149
256
392
428
302
275
411
453
*the non-respondents are very highly correlated across questions, so for example only 28 carers did not answer the free choice question, but did subsequently answer the question about money for paid care.

21
Table 3: Associations between individual characteristics and perceived choice in providing informal care (n=798)
Variable
‘Free choice’
carers
(n=260)
‘Constrained
choice’ carers
(n=389)
‘Unfree’
carers
(n=149)
Signif.
(p-value)
Socio-demographic characteristics
Age (%65+)
Sex (% female)
Health status (% bad)
Ethnicity (% BME)
Religious (% yes)
Qualifications (% yes)
Means tested benefit (% yes)
Employed full-time (% yes)
Home ownership (% yes)
Care-related characteristics
Hours of care per week (% >50 hours)
Caring role (% main carer)
Personal care (% providing)
Care recipient health (% bad/very bad)
Care recipient age (% over 65)
24.4%
64.6%
9.7%
3.5%
68.1%
76.6%
15.9%
32.7%
77.3%
7.7%
17.9%
15.6%
28.8%
68.6%
19.3%
52.9%
14.3%
9.7%
71.0%
78.5%
19.7%
30.3%
76.0%
23.2%
46.5%
29.2%
34.8%
70.0%
19.9%
66.0%
17.6%
6.4%
64.7%
77.0%
24.6%
32.1%
76.1%
35.8%
65.0%
41.0%
53.5%
59.6%
0.46
0.75
0.03
0.12
0.52
0.87
0.05
0.82
0.98
<0.01
<0.01
<0.01
<0.01
0.53
Note: significance of associations calculated using Kruskall-Wallis test

22
Table 4: Wellbeing of carers and non-carers
Wellbeing variable
Carers (n=798)
Non-carers (n=4280)
Happiness (% ‘very happy’ or ‘quite happy’)
Life satisfaction (mean, on 0 to 10 scale)
Capability (mean, on a 0 to 1 scale)
Caring experience (mean, on a 0 to 100 scale)
88.8%
7.14
0.817
69.6
90.4%
7.35
0.820
n/a

23
Table 5: Associations between wellbeing and perceived choice in providing informal care
Variable
‘Free’
carers
(n=260)
‘Constrained’
carers
(n=389)
‘Unfree’
carers
(n=149)
Signif.
(p-value)
Non-carers
(n=4280)
Happiness (% happy)
Life satisfaction (mean (sd))
Capability (mean (sd))
Caring experience (mean (sd))
93.8%
7.54 (1.80)
0.845 (0.10)
75.4 (13.4)
86.4%
7.07 (1.96)
0.810 (0.14)
69.9 (16.5)
81.1%
6.58 (1.85)
0.783 (0.13)
61.2 (17.7)
<0.01
<0.01
<0.01
<0.01
90.4%
7.35 (1.94)
0.820 (0.14)
n/a
Note: significance of associations calculated using Kruskall-Wallis test

24
Table 6: OLS regression models of the association between wellbeing and free choice in caring (n=798)
Independent variable MODEL 1
Life satisfaction
1-10 scale
MODEL 2
Capability wellbeing
0-1 scale
MODEL 3
Caring
experience
0-100 scale
Socio-demographic variables
Age (65+)
Sex (female)
Health (bad)
Ethnicity (BME)
Religious (yes)
Qualifications (yes)
Means tested benefit (yes)
Employed full-time (yes)
Home ownership (yes)
Care-related variables
Caring hours (50 hours +)
Caring role (main carer)
Personal care (provided)
Care recipient health (bad)
Care recipient age (over 65)
Choice in caring
Unfree
Constrained
Free
R2
Sample size (n)
0.79*** (0.20)
0.26 (0.15)
-1.14*** (0.21)
-0.58* (0.29)
0.27 (0.15)
0.33 (0.18)
-0.36 (0.19)
0.27 (0.16)
0.35* (0.17)
-0.14 (0.22)
-0.14 (0.17)
-0.18 (0.17)
-0.12 (0.15)
0.06 (0.12)
omitted
0.45* (0.19)
0.72*** (0.22)
0.156
688
-0.005 (0.013)
0.004 (0.009)
-0.107*** (0.013)
-0.044* (0.018)
0.020* (0.009)
-0.012 (0.011)
-0.026* (0.012)
0.005 (0.010)
0.042*** (0.011)
-0.003 (0.014)
-0.008 (0.011)
0.007 (0.011)
-0.009 (0.009)
0.014* (0.007)
omitted
0.019 (0.012)
0.047*** (0.013)
0.210
679
-0.8 (2.0)
2.3 (1.4)
-8.5*** (1.9)
-4.5 (2.6)
1.4 (1.4)
-4.1* (1.7)
-10.0*** (1.8)
0.2 (1.5)
2.6 (1.6)
-2.6 (2.0)
-5.4*** (1.6)
0.7 (1.5)
-2.9* (1.4)
-1.6 (1.1)
omitted
6.7*** (1.7)
10.4*** (2.0)
0.254
568
*p<0.05 ; ** p<0.01; *** p<0.001 Note: cell values represent the beta coefficients in the regression models, with standard errors in parentheses.

25
Table 7: Ordered logit regression model of the association between happiness and free choice in caring (n=798)
Independent variable MODEL 4
Happiness
(1-4)
Socio-demographic variables
Age (65+)
Sex (female)
Health (bad)
Ethnicity (BME)
Religious (yes)
Qualifications (yes)
Means tested benefit (yes)
Employed full-time (yes)
Home ownership (yes)
Care-related variables
Caring hours (50 hours +)
Caring role (main carer)
Personal care (provided)
Care recipient health (bad)
Care recipient age (over 65)
Choice in caring
Unfree
Constrained
Free
Pseudo R2
Sample size (n)
0.81 (0.19)
0.81 (0.14)
4.06*** (1.06)
2.44* (0.88)
0.69* (0.12)
1.03 (0.22)
1.62* (0.15)
1.08 (0.21)
0.50*** (0.11)
1.18 (0.31)
1.24 (0.25)
1.21 (0.17)
1.02 (0.18)
0.95 (0.13)
omitted
0.68 (0.16)
0.43*** (0.11)
0.081
688
*p<0.05 ; ** p<0.01; *** p<0.001 Note: cell values represent odds of appearing in a worse happiness state, with standard errors in parentheses.

26
Figure 1: Construction of the choice variable
Yes (649)
Was informal care a free choice?
No (149) Not answered (302)
Were one or more specified constraints ticked yes?
Were one or more specified constraints ticked yes?
No (260) – free choice
carers
Yes (389) - constrained
choice carers
Carers excluded (see Table 1)
No (20) – unfree carers
Yes (129) – unfree carers

27
Supplementary material: Key questions from the Quality of Life survey
Identification of carers
Do you look after, or give any help or support to family members, friends, neighbours or others
because of long-term physical or mental ill-health or disability, or problems related to old age?”
(Please tick time spent in a typical week. Do not count anything you do as part of your paid
employment)
No
Yes, 1-19 hours per week
Yes, 20-49 hours per week
Yes, 50+ hours per week
Decision to care
Thinking about your decision to provide care, please tick ‘yes’ or ‘no’ to the following questions:
I provide care because it is my duty
I had a free choice to provide care
There was no-one else to provide care
There was no money to provide care
Happiness
Taking all things together, would you say you are? (Please tick 1 box)
Very happy
Quite happy
Not very happy
Not at all happy
28
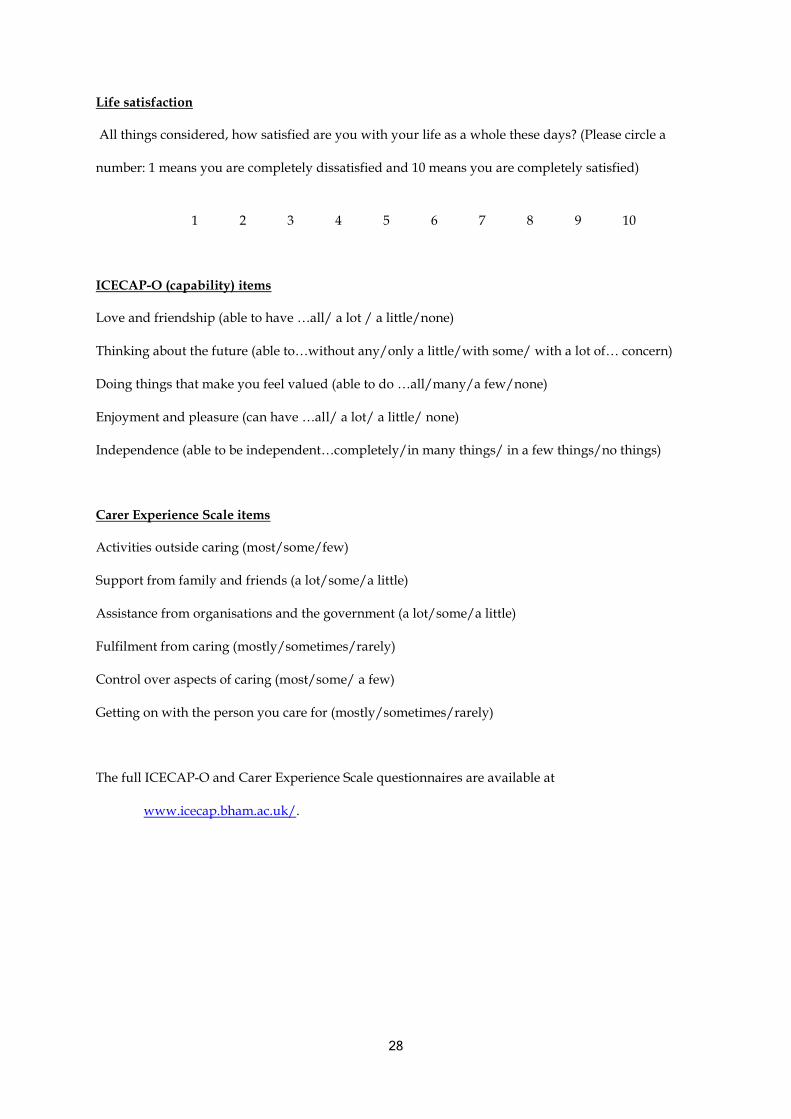
Life satisfaction
All things considered, how satisfied are you with your life as a whole these days? (Please circle a
number: 1 means you are completely dissatisfied and 10 means you are completely satisfied)
1 2 3 4 5 6 7 8 9 10
ICECAP-O (capability) items
Love and friendship (able to have …all/ a lot / a little/none)
Thinking about the future (able to…without any/only a little/with some/ with a lot of… concern)
Doing things that make you feel valued (able to do …all/many/a few/none)
Enjoyment and pleasure (can have …all/ a lot/ a little/ none)
Independence (able to be independent…completely/in many things/ in a few things/no things)
Carer Experience Scale items
Activities outside caring (most/some/few)
Support from family and friends (a lot/some/a little)
Assistance from organisations and the government (a lot/some/a little)
Fulfilment from caring (mostly/sometimes/rarely)
Control over aspects of caring (most/some/ a few)
Getting on with the person you care for (mostly/sometimes/rarely)
The full ICECAP-O and Carer Experience Scale questionnaires are available at
www.icecap.bham.ac.uk/.