infor business intelligence servicescontacting infor if you have questions about infor products, go...
TRANSCRIPT

Infor Business Intelligence ServicesRelease 11.0.x

Copyright © 2015 Infor
Important NoticesThe material contained in this publication (including any supplementary information) constitutes andcontains confidential and proprietary information of Infor.
By gaining access to the attached, you acknowledge and agree that the material (including anymodification, translation or adaptation of the material) and all copyright, trade secrets and all otherright, title and interest therein, are the sole property of Infor and that you shall not gain right, title orinterest in the material (including any modification, translation or adaptation of the material) by virtueof your review thereof other than the non-exclusive right to use the material solely in connection withand the furtherance of your license and use of software made available to your company from Inforpursuant to a separate agreement, the terms of which separate agreement shall govern your use ofthis material and all supplemental related materials ("Purpose").
In addition, by accessing the enclosed material, you acknowledge and agree that you are required tomaintain such material in strict confidence and that your use of such material is limited to the Purposedescribed above. Although Infor has taken due care to ensure that the material included in this publicationis accurate and complete, Infor cannot warrant that the information contained in this publication iscomplete, does not contain typographical or other errors, or will meet your specific requirements. Assuch, Infor does not assume and hereby disclaims all liability, consequential or otherwise, for any lossor damage to any person or entity which is caused by or relates to errors or omissions in this publication(including any supplementary information), whether such errors or omissions result from negligence,accident or any other cause.
Without limitation, U.S. export control laws and other applicable export and import laws govern youruse of this material and you will neither export or re-export, directly or indirectly, this material nor anyrelated materials or supplemental information in violation of such laws, or use such materials for anypurpose prohibited by such laws.
Trademark AcknowledgementsThe word and design marks set forth herein are trademarks and/or registered trademarks of Infor and/orrelated affiliates and subsidiaries. All rights reserved. All other company, product, trade or servicenames referenced may be registered trademarks or trademarks of their respective owners.
Publication Information
Release: BI 11.0.0
Publication Date: August 21, 2015

Contents
Contacting Infor..............................................................................................................9
BI Dashboards...............................................................................................................11Layout concepts.......................................................................................................................................11
Positioning content...............................................................................................................................16Auto-sizing dashboards........................................................................................................................17
Adding content to dashboards.................................................................................................................18Adding dashboard content from a content connection.........................................................................19Adding dashboard content from a WebView........................................................................................19Enabling interaction mode....................................................................................................................20Widget properties.................................................................................................................................21Copying widgets...................................................................................................................................24Relational queries - Query & Analysis Query Editor............................................................................24
Removing content....................................................................................................................................31Communication between widgets............................................................................................................32
Creating parameter connections..........................................................................................................33Editing parameter connections............................................................................................................34Splitting parameter connections...........................................................................................................34Report jumps........................................................................................................................................35Creating and editing VebView widget parameters...............................................................................35
Dashboard management.........................................................................................................................36Opening dashboards............................................................................................................................36Searching dashboards.........................................................................................................................37Moving dashboards and folders...........................................................................................................37Creating dashboards............................................................................................................................38Creating folders and subfolders...........................................................................................................38Copying dashboards............................................................................................................................39Renaming dashboards and folders......................................................................................................39Removing dashboards and folders......................................................................................................39Saving dashboards..............................................................................................................................40Managing dashboard and dashboard folder permissions....................................................................41
Dashboard settings..................................................................................................................................42Helper lines..........................................................................................................................................42Snapping..............................................................................................................................................42Auto-hide toolbar..................................................................................................................................43Automatic refresh.................................................................................................................................43Setting the start screen........................................................................................................................43
Infor Business Intelligence Services | 3
Contents

Setting the language............................................................................................................................44Content connections............................................................................................................................44
Dashboard properties..............................................................................................................................48General................................................................................................................................................48Protected application component dashboards.....................................................................................48Layout properties.................................................................................................................................49Specifying the theme............................................................................................................................50
Sharing dashboards.................................................................................................................................50Creating dashboard links.....................................................................................................................51Exporting dashboards..........................................................................................................................52Importing dashboards..........................................................................................................................53
BI Application Manager................................................................................................55Using predefined dashboards..................................................................................................................55Creating dashboards...............................................................................................................................56User and Permission Management.........................................................................................................56
Creating a basic user...........................................................................................................................57Register Windows users and user groups...........................................................................................57Assigning users or groups to application roles....................................................................................58Creating basic groups..........................................................................................................................58Creating application roles.....................................................................................................................58Editing application permissions............................................................................................................59Creating repository roles......................................................................................................................61Editing repository permissions.............................................................................................................61
Global Settings........................................................................................................................................62Managing applications.........................................................................................................................63Repository............................................................................................................................................63Global Data Sources............................................................................................................................64Attachments.........................................................................................................................................64Language settings................................................................................................................................65
How to customize an Infor BI Services application..................................................................................67Downloading the original application...................................................................................................68Downloading OLAP database..............................................................................................................68Importing custom reports.....................................................................................................................68
OLAP.......................................................................................................................................................69
BI Self-Service...............................................................................................................71Creating content with Infor BI Self-Service templates.............................................................................71
Picking your chart.................................................................................................................................72Exploring your data..............................................................................................................................73Using the Chart Guide..........................................................................................................................73Adding a chart to favorites...................................................................................................................74
4 | Infor Business Intelligence Services
Contents

Glossary.........................................................................................................................75.dat...........................................................................................................................................................75alias.........................................................................................................................................................75Application composer..............................................................................................................................75application key.........................................................................................................................................75application................................................................................................................................................76application processes package...............................................................................................................76application component.............................................................................................................................76attribute....................................................................................................................................................76authentication..........................................................................................................................................76base element...........................................................................................................................................77Best Practices..........................................................................................................................................77business intelligence................................................................................................................................77cache.......................................................................................................................................................77caption.....................................................................................................................................................77cell graphic...............................................................................................................................................78cell reference...........................................................................................................................................78check in and check out............................................................................................................................78client list...................................................................................................................................................78combo box...............................................................................................................................................79conditional formatting...............................................................................................................................79content developer....................................................................................................................................79cubes.......................................................................................................................................................79custom hierarchies...................................................................................................................................79custom list................................................................................................................................................80dashboard................................................................................................................................................80data area..................................................................................................................................................80database independent reporting..............................................................................................................80DataLink list.............................................................................................................................................80design, view, and debug modes..............................................................................................................81dimension................................................................................................................................................81drill-down.................................................................................................................................................81dynamic report.........................................................................................................................................81elements..................................................................................................................................................82filter..........................................................................................................................................................82flag...........................................................................................................................................................82formatting.................................................................................................................................................82formulas...................................................................................................................................................82function....................................................................................................................................................83global list..................................................................................................................................................83hierarchy..................................................................................................................................................83
Infor Business Intelligence Services | 5
Contents

history......................................................................................................................................................84hyperblock...............................................................................................................................................84intrinsic attributes.....................................................................................................................................84jumps.......................................................................................................................................................84key performance indicator (kpi)...............................................................................................................85level.........................................................................................................................................................85list designer..............................................................................................................................................85list object..................................................................................................................................................85lists...........................................................................................................................................................86list view....................................................................................................................................................86local lists..................................................................................................................................................86MDX.........................................................................................................................................................86multidimensional databases....................................................................................................................87multilingual string.....................................................................................................................................87named sets..............................................................................................................................................87null and zero values.................................................................................................................................87Olap.........................................................................................................................................................88OLAP Server............................................................................................................................................88OLAP metadata hierarchy.......................................................................................................................88permissions..............................................................................................................................................88point of view (pov)....................................................................................................................................88project......................................................................................................................................................89ragged hierarchy......................................................................................................................................89registration...............................................................................................................................................89relational reporting...................................................................................................................................89relational list.............................................................................................................................................89report catalog...........................................................................................................................................90report templates.......................................................................................................................................90report wizard............................................................................................................................................90repository.................................................................................................................................................90sealed application....................................................................................................................................91server list.................................................................................................................................................91sibling.......................................................................................................................................................91sorting......................................................................................................................................................91slicing.......................................................................................................................................................91splashing..................................................................................................................................................92splitter......................................................................................................................................................92string hierarchy........................................................................................................................................92structure selection....................................................................................................................................92styles........................................................................................................................................................92style sheets..............................................................................................................................................93unique name............................................................................................................................................93
6 | Infor Business Intelligence Services
Contents

variable....................................................................................................................................................93visible area...............................................................................................................................................93WebView widget......................................................................................................................................93widget......................................................................................................................................................94widget communication.............................................................................................................................94write back.................................................................................................................................................94xml variable..............................................................................................................................................94
Infor Business Intelligence Services | 7
Contents

8 | Infor Business Intelligence Services
Contents
Contacting Infor
If you have questions about Infor products, go to the Infor Xtreme Support portal.
If we update this document after the product release, we will post the new version on this website. Werecommend that you check this website periodically for updated documentation.
If you have comments about Infor documentation, contact [email protected].
Infor Business Intelligence Services | 9

10 | Contacting Infor
Contacting Infor

BI Dashboards
In Infor BI Dashboards and Infor Motion Dashboards on iPad, you can combine and layout reports fromApplication Studio WebServices report catalogs, and Web content, to create dashboards which canbe shared with other users. Or, you can view individual reports or Web pages full-screen.
Infor Motion Dashboards and Infor BI Dashboards are cross-platform applications. That is, changesmade to the content and properties of dashboards in one instance of the application are available inall instances of the application. If two users make changes to the same dashboard, both can save theirchanges. But the user who saves last is prompted that a newer version of the dashboard exists. Theuser has the option to overwrite the changes, or to save the dashboard under a new name.
When you sign in, a start screen is displayed. The start screen can be a new dashboard, blank exceptfor the Infor logo, or a specified dashboard. In either case, you can open a saved dashboard from thedashboard browser, create a dashboard, or you can start adding reports and Web content straightaway.
You can add content in three ways:
• Drag items from a content connection and arrange them to form a dashboard. Each contentconnection is named and displayed in the toolbar.
• Specify one or more WebView widgets to add content from the Web.• Click a report or WebView to display it full-screen.
If you display content full-screen, you can resize it by clicking Edit Dashboard and dragging its bordersor, by pushing, adding another item of content next to it.
Layout conceptsYou can resize and reposition dashboard content much as you like, but there are some constraints.For example, a minimum size can be specified for reports. This might prevent you placing a reportwidget in certain positions.
This topic is an overview of some basic layout concepts.
Infor Business Intelligence Services | 11
BI Dashboards

HotspotsDashboards have hotspots at their corners and edges. Widgets have hotspots at their edges andcenters.
A hotspot is displayed when, whilst dragging a widget, the mouse pointer is over the hotspot.
If you pause over the hotspot, a preview is displayed beneath the widget. The preview indicates theposition the widget will occupy if you drop it.
As you add content, further hotspots become available.
Initially, the hotspots at the edges of a dashboard occupy a position mid-way along the length of theedge. Here, when dropped, Widget I expands horizontally along the length of the edge. It also expandsvertically to occupy half the available space.
But in this second example, the left and bottom edges of the dashboard are already partially occupiedby Widgets I and II, leaving an empty space between the bottom of Widget I and the top edge of WidgetII.
When Widget III is dragged over the space at the left hand edge, a hotspot is displayed. When dropped,Widget III contracts vertically to occupy the empty space, and expands horizontally to occupy half theavailable space.
12 | Infor Business Intelligence Services
BI Dashboards

TileHere, Widget II is dropped when the mouse pointer is above a hotspot of Widget I. Widget II captureshalf the space occupied by Widget I:
SwapTo swap the positions of two widgets, drag one widget over the other and drop when the central hotspotsare aligned:
Infor Business Intelligence Services | 13
BI Dashboards

Note: Swapping might not be possible if the widgets contain reports for which a minimum size hasbeen specified.
Push and crushTo push one widget with another, use one of these the options while dragging the widget: press theShift key, or press both mouse clicks. If a widget is pushed against an edge of the dashboard, it iscompressed. It does not return to its original size if the pushing widget is withdrawn.
If you withdraw the pushing widget before you drop it, the crushed widgets revert to their originaldimensions.
Push betweenTo push a widget between adjacent widgets , drag it over the adjacent widgets, press Shift, and thendrop the widget:
14 | Infor Business Intelligence Services
BI Dashboards

FillIn the properties of a widget you can specify that the widget automatically expands horizontally orvertically to fill the available space. This is important in creating dashboards which auto-size. You canplace widgets at either end of a widget that has horizontal or vertical fill:
1 Drag a widget over the end of a widget with horizontal or vertical fill.2 Drop the widget when a hotspot is displayed at the edge of the widget underneath.
The filled widget shrinks to accommodate the new widget but retains its fill setting. It will expand againif Widget II is removed:
Infor Business Intelligence Services | 15
BI Dashboards
ShortcutsYou can use these keyboard shortcuts when you drag or resize widgets:
• Ecs: To undo resizing or repositioning of a widget, press the Ecs key before you release the mousebutton.
• O: To keep a widget's original size, press and hold the O key while you drag it into position on adashboard. The widget will not automatically resize to fit an available space.
• R: To keep a widget's height to width ratio, press and hold the R key while you drag its borders toresize it.
• S: To temporarily toggle helper lines and snapping or off, press the S key while dragging a widget.
Positioning content
To position content, the dashboard must be in edit mode:
• New dashboards are editable by default• If you add content to an existing dashboard, and you have edit permission, the dashboard is
automatically editable.
To reposition existing content, click Edit Dashboard in the toolbar to enable edit mode.
In an editable dashboard, the borders of existing widgets are highlighted.
When you place the mouse pointer over a widget, the border changes color and the widget controlsare enabled.
A widget displays a preview if you drag it over an existing widget. The preview indicates where thewidget will be placed when dropped, and its dimensions. The preview displays a rectangular hotspotwhen the mouse pointer is halfway along an edge of an existing widget or the edge of the dashboard.
Drop a widget:
• Where required, in a blank dashboard.• When its preview is displayed in the position you require. The dropped widget will be resized to fit
the space indicated by the preview.• When the hotspot is displayed: If the hotspot is on an existing widget, the dropped widget cuts the
existing widget in half, vertically or horizontally, according to whether the hotspot is on a vertical orhorizontal border. If the hotspot is on an edge of the dashboard, the dropped widget snaps to theedge and occupies the available length.
• When the mouse pointer on a dragged widget is directly over an existing widget. The widgets swapplaces. Or, if the dragged widget is dragged from a content connection, it replaces the existingwidget.
Note: Swapping might not be possible if the widgets contain reports for which a minimum size hasbeen specified.
16 | Infor Business Intelligence Services
BI Dashboards
To insert a widget between two widgets that are touching, drag the widget over the border where thewidgets touch and press Shift. Drop the widget before releasing the Shift key. The added widget retainsits dimensions or shrinks if there is not enough room for the other widgets to be pushed away. Theexisting widgets shrink to accommodate the new widget.
To push one widget with another, use one of these the options while dragging the widget: press theShift key, or press both mouse clicks. If a widget is pushed against an edge of the dashboard, it iscompressed. It does not return to its original size if the pushing widget is withdrawn.
ShortcutsYou can use these keyboard shortcuts when you drag or resize widgets:
• Ecs: To undo resizing or repositioning of a widget, press the Ecs key before you release the mousebutton.
• O: To keep a widget's original size, press and hold the O key while you drag it into position on adashboard. The widget will not automatically resize to fit an available space.
• R: To keep a widget's height to width ratio, press and hold the R key while you drag its borders toresize it.
• S: To temporarily toggle helper lines and snapping or off, press the S key while dragging a widget.
Auto-sizing dashboardsTo create dashboards which remain usable and attractive on a variety of screen sizes and resolutionsrequires design decisions in both Infor BI Dashboards and Infor BI Application Studio.
In summary, these are the steps required to create dashboards which resize automatically:
Auto-sizingIn Infor BI Dashboards and Infor Motion Dashboards the Auto-size property of each dashboard isenabled by default. But this alone does not ensure that a dashboard will remain usable and attractiveon different screen sizes. The reports need to be able to shrink to a specified minimum size, and thewidgets in which they are displayed must automatically fill the space available to them.
Shrinkage and growthCreate Application Studio reports in which one or more columns and rows can grow or shrink. Youcan allow shrinkage and growth on multiple columns and rows as required. For example, you mightenable growth and shrinkage only on the columns and rows containing a chart. But to enable reportresizing, growth or shrinkage need be enabled on only one column or row.Which columns and rows you allow to grow and shrink, and by how much, depends on their content,and on testing the reports in a variety of screen sizes. The minimum width of a column should be wideenough to display its content in full.
Report sizeAllowing reports to shrink and grow is not sufficient to ensure that they remain usable. To ensure thatwidgets, and the reports they contain, do not become too small, specify a minimum report size. Thecorrect minimum size can only be determined by testing the report to find the smallest size at whichit remains usable, and attractive.
Infor Business Intelligence Services | 17
BI Dashboards

You cannot specify maximum report dimensions in Application Studio. This is because it would resultin empty spaces between widgets if, for example, a dashboard were displayed on a bigger screenthan for which it was designed.
Horizontal and vertical fill in widgetsIn Infor BI Dashboards and Infor Motion Dashboards on iPad, you can specify that widgets automaticallyexpand horizontally or vertically to fill the space available to them. If you have created a dashboard,with widgets containing reports that can shrink and grow, and which have a minimum size; specify thefill characteristics of the widgets. In many cases, you will specify both horizontal and vertical fill. But,in some widgets, you might specify only vertical or only horizontal fill. For example, if the content of areport is primarily horizontal - such as line chart, or a sparkline - you might specify only horizontal fill.
Adding content to dashboards
You can add content to a dashboard:
• From a content connection• From a Web location, in a WebView.
A content connection accesses an Application Studio WebServices report catalog. Content connectionsare listed in the toolbar.
Infor BI Self-Service and relational self-service widgets enable you to create your own content. If theyare installed, the self-service widgets are displayed in folders in a content connection.
To access content that has been added or updated whilst you have been logged on, click Refresh inthe content connection.
A WebView displays Web content from a URL which you specify. You add WebViews from the Toolboxin the toolbar.
How you add the content determines whether the content is displayed placed on the dashboard ordisplayed full-screen:
• To add content to the dashboard, drag the content, or drag WebView from the Toolbox.• To display it full-screen, click the content, or click WebView in the Toolbox.
You can add multiple content widgets and arrange them to form a dashboard.
If you add content full-screen you can resize it or push additional content next to it by clicking EditDashboard to enable edit mode.
See: "Layout concepts" on page 11.
When you add content to a dashboard:
• The dashboard is unlocked for editing.
18 | Infor Business Intelligence Services
BI Dashboards
• The borders of current widgets are highlighted.• Content controls for each widget are displayed when you move the mouse pointer over the widget.
Adding dashboard content from a content connection
To add content to a dashboard from a content connection:
1 On the toolbar, click the content connection which contains the content to add.The folder structure of the report catalog is displayed in the content browser.
2 Browse to the content to add.Reports can display a thumbnail image to help identify them. Thumbnails are specified in Infor BIApplication Studio.
3 Either drag the content to the dashboard or click to open the content, full-screen.4 In a blank dashboard, drop the content where required. In a dashboard with existing content, drop
the content when a preview is displayed on the dashboard.The preview indicates the position the content will occupy. If no preview is displayed, the contentwill not be added.
Note: Report designers can specify preferred and minimum dimensions. Reports are initially displayedwith the preferred width and height, if specified. If a minimum width and height are specified, youcan expand the report but cannot reduce it to less than the minimum specified dimensions. This isimportant when creating resizable dashboards.
See: "Auto-sizing dashboards" on page 17.If, while dragging content to the dashboard, you decide not to place it, drag it back to the top of thedashboard and drop it when the mouse pointer is over the toolbar.
Adding dashboard content from a WebView
To add content to a dashboard through a WebView widget:
1 Click Toolbox on the toolbar.2 Either: drag the WebView widget to the dashboard or click on the WebView widget to add a
full-screen WebView.3 If you drag the WebView:
a Optionally, specify a name for the WebView.b Specify the URL of the content to add.
Infor Business Intelligence Services | 19
BI Dashboards

c If required, click Parameters and specify parameters.See "Parameters".
d Specify fill and scrolling options.See: "Fill" and "Scrolling".
e Click Close.
4 If the WebView is full-screen:a Click Edit Dashboard on the toolbar.
The border of the WebView is highlighted.
b Click in the WebView.The WebView control icons are displayed.
c Click Edit.d Optionally, specify a name for the WebView.e Specify the URL of the content to add.f If required, click Parameters and specify parameters.
See: "Parameters".
g Specify fill and scrolling options.h Click Close
Note: If you follow links in the content to browse to a different URL, and then save the dashboard,the dashboard is saved with the URL specified in the dialog. This differs from Infor Motion Dashboardswhere the last-visited URL is saved with the dashboard.
Enabling interaction modeIf a dashboard is in edit mode and the mouse pointer is over a widget, the widget controls are displayed.
If the widget content allows user interaction, interaction mode enables this in an editable dashboard.For example, an Application Studio report might include drag and drop functionality to enable users toconfigure the report. But if that report is displayed in a widget, dragging will reposition the widget unlessyou first select interaction mode.
Click Interact to enable interaction mode. The interaction mode icon varies according to the contentof the widget.
1 If the dashboard is locked, click Edit Dashboard to enable edit mode.The borders of existing widgets are displayed.
2 Place the mouse pointer over the widget to display its control buttons.3 Click Interact.
20 | Infor Business Intelligence Services
BI Dashboards

Or, double-click in the widget to enable interaction mode.
Widget propertiesThe widget properties are organized in three tabs: general, display, and layout. The widget propertiesare specific to the corresponding widget types: report or WebView widgets.
Report widgets• General:
Jump TargetsAn Application Studio report can contain a jump to a target report. If a widget displays a reportwhich contains a jump, you can specify whether the target report replaces the current content ofthe widget, or it is displayed full-screen.
Content ConnectionThe content connection used. You can use content connections to link widgets on a dashboard.For report content, report parameters are specified in Application Studio.
Report NameThe Application Studio target report name.
Unique NameThe report unique name.
• Display:
HeaderA widget header displays the name of an item of content, at the top of a widget. For reports, forexample, the name is specified in the General tab of the Report Properties pane in ApplicationStudio. You can select to display the widget header by switching on this option.By default the widget headers are not displayed. You can enable the option to create new widgetswith headers in the Settings.
Collapsing DirectionYou can specify that a widget can be collapsed in a selected direction. Collapsing widgets savesspace and is useful when you want to keep a widget on your dashboard, but, for example, you donot use this widget on a daily-basis.
• Layout:
Fill Horizontally and Fill VerticallyYou can specify that a widget automatically occupies all available space at its left and right or aboveit and below it.You can position further widgets at either end of a widget with horizontal or vertical fill. Drag a widgetover the filled widget and drop it when the hotspot is displayed.
Infor Business Intelligence Services | 21
BI Dashboards

Widget MarginsYou can specify if to use the widget margins.By default the widget margins are disabled. You can enable the option to create new widgets withmargins in the Settings.
Note: By default, the marins are set to 10 pixels. The size of the widget margins is set at theapplication level in Repository Administration.
WebView widgets• General:
URLThe URL of the target content of the WbView widget.
ParametersYou can use parameter connections to link widgets on a dashboard. For WebViews, you createthe parameters from parts of the URL. For example, if the URL contained location information, youcould make a location parameter from that part of the URL and use it in communication betweenwidgets. Unlike report parameters, WebView parameters cannot be automatically added to aparameter network.
Allow ScrollingIf the content of a WebView is too large for the widget, scroll bars are displayed. To remove thescroll bars and disable scrolling, turn off Allow Scrolling.
Privileged ContentYou can switch on the privileged content option that opens the WebView content that is blockedby default.
• Display:
HeaderA widget header displays the name of an item of content, at the top of a widget. You can select todisplay the widget header by switching on this option.By default, the widget headers are not displayed. You can enable the option to create new widgetswith headers in the Settings.
Collapsing DirectionYou can specify that a widget can be collapsed in a selected direction. Collapsing widgets savesspace and is useful when you want to keep a widget on your dashboard, but, for example, you donot use this widget on a daily-basis.
• Layout:
Fill Horizontally and Fill VerticallyYou can specify that a widget automatically occupies all available space at its left and right or aboveit and below it.
22 | Infor Business Intelligence Services
BI Dashboards

You can position further widgets at either end of a widget with horizontal or vertical fill. Drag a widgetover the filled widget and drop it when the hotspot is displayed.
Widget MarginsYou can specify if to use the widget margins.By default the widget margins are disabled. You can enable the option to create new widgets withmargins in the Settings.
Note: By default, the marins are set to 10 pixels. The size of the widget margins is set at theapplication level in Repository Administration.
Editing widget properties
To view or edit the properties of a widget:
1 If the dashboard is locked, click Edit Dashboard to enable edit mode.The borders of existing widgets are displayed.
2 Place the mouse pointer over the widget to display its toolbar.3 Click the Properties icon.4 You can edit the header in the Title field of a widget's properties.
Changing the title does not change the report properties in Application Studio.
5 To display widget headers, click the Display tab and click Headers.6 To specify fill and widget margins, click the Layout tab.7 Click Close.
Specifying the collapsing direction
To save space on your dashboard and minimize a widget, you can specify the collapsing direction fora widget.
To specify the collapsing direction of a widget:
1 Click the Edit dashboard icon and click the Properties icon.2 Click the Display tab.3 Click Collapsing Direction and select one of the available directions: top, right, bottom, or left.4 To disable collapsing for a widget, select No Collapsing.5 Click Close.
Infor Business Intelligence Services | 23
BI Dashboards

Copying widgetsYou can save time when you copy and reuse widgets that require elaborate configuration. If youconfigure a widget and would like to use it again, you can easily navigate to this widget by saving awidget copy. Widget copies store the widget and preserve the widget configuration, so you do not needto configure the widget again.
Note: To save copies of widgets you must have view and edit permissions.
To copy a widget, click Edit Dashboard and click Copy Widget in the widget's toolbar.
The copied widget is saved in Toolbox > Widget Copies with its icon, the time stamp, and the widgettitle. You can drag copied widgets from the toolbox to a dashboard.
Editing widget copiesTo edit the properties or delete widget copies:
1 Navigate to Toolbox > Widget Copies .2 Click the settings icon.3 Select to edit properties or delete a widget copy.
Relational queries - Query & Analysis Query EditorSome reports, such as the relational self-service widgets, include buttons and actions that launch theQuery & Analysis Query Definition dialog, in which you can create relational queries. Queries can besummary or detail queries. Values are aggregated in a summary query but not aggregated in a detailquery.
Some of the options when you create a query depend on the type of query, and the type of data itreturns. This is a summary of all available steps when you create a query, but not all steps are requiredby all users:
1 Select the type of query to create .2 Specify the data source and tables to query.3 Specify the table columns to include in the query.4 Specify the extraction type for each column.5 Specify the sign notation of numeric extraction types.6 Specify the scaling for each extraction type.7 Specify the offset and length (for the Segment extraction type only).8 Specify how items are sorted, and the order in which they are sorted.9 Specify required data filters. For example, to extract data where an item has a value greater than
a specified amount.10 Specify additional filter conditions.
24 | Infor Business Intelligence Services
BI Dashboards

Creating content with the Query & Analysis Query EditorTo create content with the Query and Analysis query editor:
1 Open the editor from a report.For example, click Edit query in a relational self-service widget.
2 Select Summary or Detail from the Query Type list.3 From the Product list, select the data source for your query.
Each query has a number of filters for which you must specify values. After you select the datasource, the first filter is added to the Filters table.
4 Click the lookup icon of each item in the Filters table and select a value.After you select a value for a filter further filters are added to the Filter table, until all required filtersare listed.
5 Click the settings icon of each filter and specify the filter options.The options vary according to the type of filter.
6 In the Available columns pane, double-click columns to add them as outputs of your query.
Note: To add filters, in addition to the required filters, click an available column and click the Uparrow.
7 Each output of a query has an extraction type and a sort order.See "Editing extraction types" on page 27 and "Sorting output items" on page 29.
8 Click OK.The results of the query are displayed.
Summary and detail queriesThis topic gives an example of a summary query and of a detail query based on this fictional grocerystore data:
CostQuantityProductProduct IDProduct Category
93Cheese10001Dairy
62Milk10002Dairy
128Apple20001Fruit
45Pineapple20003Fruit
1030Cherries20004Fruit
2010Sandwich loaf30001Bakery
158Sandwich loaf30001Bakery
62Sandwich loaf30001Bakery
93Sandwich loaf30001Bakery
Infor Business Intelligence Services | 25
BI Dashboards

CostQuantityProductProduct IDProduct Category
2520Toast loaf30002Bakery
2510Toast loaf30002Bakery
3515Wholemeal loaf30003Bakery
2510Wholemeal loaf30003Bakery
105Wholemeal loaf30003Bakery
126Cakes30004Bakery
2412Cakes30004Bakery
Summary queryA summary query provides a summarized listing. The result is a row which contains all output dataitems for each summary level. For example, a list of goods and quantities with IDs 30001 to 30003.
In this example:
• The data filter item is Product ID =30001 to 30003• The output data items are Product and Quantity
This table shows the output:
QuantityProduct
23Sandwich loaf
30Toast loaf
30Wholemeal loaf
83Total
Detail queryA detail query provides a detailed listing. The results is a row for each record in the database. Forexample, all products that include the term 'Loaf', and their quantities.
In this example:
• The data filter item is Product =%Loaf%• The output data items are Product and Quantity
This table shows the output:
QuantityProduct
2Sandwich loaf
3Sandwich loaf
8Sandwich loaf
26 | Infor Business Intelligence Services
BI Dashboards
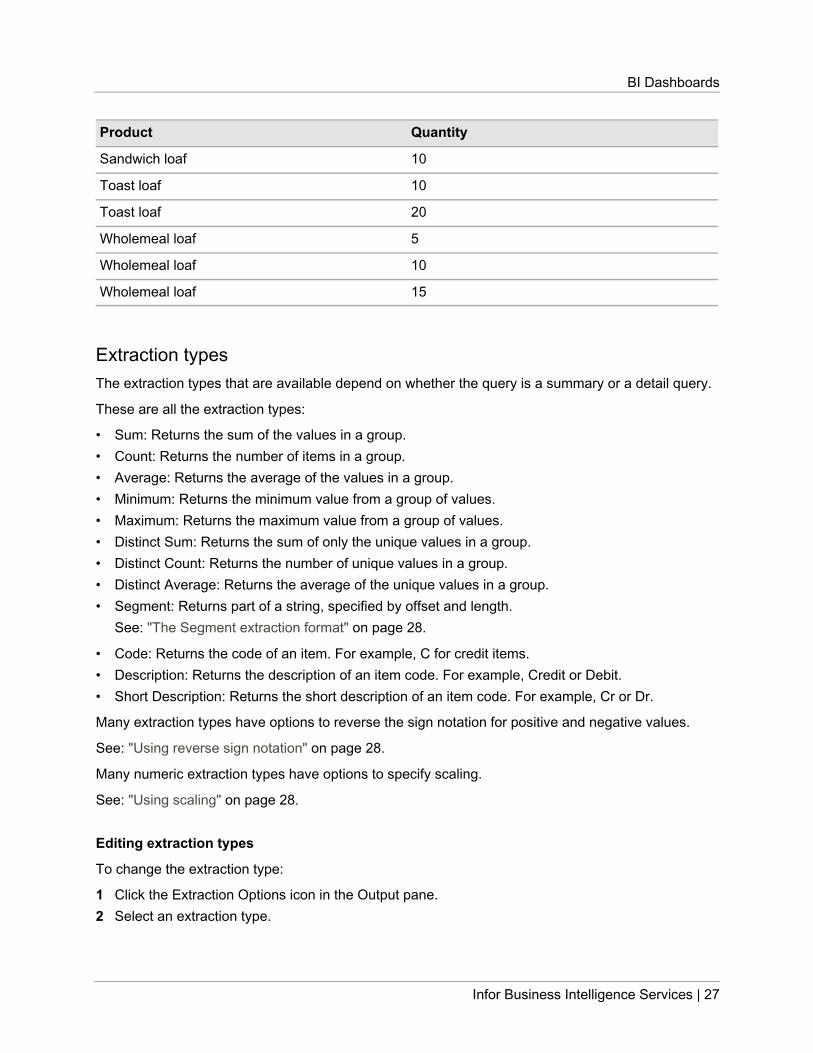
QuantityProduct
10Sandwich loaf
10Toast loaf
20Toast loaf
5Wholemeal loaf
10Wholemeal loaf
15Wholemeal loaf
Extraction typesThe extraction types that are available depend on whether the query is a summary or a detail query.
These are all the extraction types:
• Sum: Returns the sum of the values in a group.• Count: Returns the number of items in a group.• Average: Returns the average of the values in a group.• Minimum: Returns the minimum value from a group of values.• Maximum: Returns the maximum value from a group of values.• Distinct Sum: Returns the sum of only the unique values in a group.• Distinct Count: Returns the number of unique values in a group.• Distinct Average: Returns the average of the unique values in a group.• Segment: Returns part of a string, specified by offset and length.
See: "The Segment extraction format" on page 28.
• Code: Returns the code of an item. For example, C for credit items.• Description: Returns the description of an item code. For example, Credit or Debit.• Short Description: Returns the short description of an item code. For example, Cr or Dr.
Many extraction types have options to reverse the sign notation for positive and negative values.
See: "Using reverse sign notation" on page 28.
Many numeric extraction types have options to specify scaling.
See: "Using scaling" on page 28.
Editing extraction types
To change the extraction type:
1 Click the Extraction Options icon in the Output pane.2 Select an extraction type.
Infor Business Intelligence Services | 27
BI Dashboards

Some extraction types have options to use reverse sign notation for positive and negative values,and to specify a scaling factor.a Optionally, select Reverse Sign.
See: "Using reverse sign notation" on page 28.
b Optionally, select a scaling factor from the list, or specify a scaling factor.See: "Using scaling" on page 28.
3 For segments, click the Offset and Length options to specify the segment.See "The Segment extraction format" on page 28.
The Segment extraction formatThe Segment extraction format extracts a subsection of an output item. It can be used, for example,to extract only the numeric values from an alphanumeric string such as ID235ZA.
Note: Segments are reserved for alphanumeric fields. Segment functionality cannot be applied tonumeric reference fields, where the field is referential.
Segments are specified by offset and length.
For example, to extract the numeric string 235 from the alphanumeric string ID235ZA , specify an offsetof 2 and a length of 3.
The offset of 2 specifies that the first two characters of the string are ignored.
The length of 3 specifies that the extracted string is three characters long.
Using reverse sign notationThe Reverse Sign option changes the display of a numeric output from positive to negative, or fromnegative to positive. For example, display a credit of $100 as $100 or -$100.
Using scalingThe scaling factor performs a simple arithmetical operation on extracted values. It can be defined ifUse Scaling is selected for the selected extraction format.
See: "Changing the extraction format".
By default a scaling factor of /100 is used which divides the extracted amount by factor 100. You canalso the multiplication (*), addition (+), and subtraction (-) operators to scale values. You can use ascaling factor to change units in executive summary reports.
You can add further scaling factors to specify, for example, currency exchange rates.
For example, assume that 1 EURO = $ 1.215 USD. To convert extracted Euro values to dollars, specify' *1.215 ' as the scaling factor.
28 | Infor Business Intelligence Services
BI Dashboards

The scaling factor does not perform any rounding. So, for example, 1354.5658 with a scaling factor of/100 becomes 13.545658.
For accuracy, the scaling factor is performed on the final summary result rather than on individualtransactions. To maximize performance, scaling factor calculations are completed by the server andnot the client PC.
Sorting output itemsYou can specify that data in each output column is sorted in ascending or descending order, and specifythe order in which the columns are sorted. The sort order does not affect the display sequence of theoutput columns.
To specify how the data in a query is sorted:
1 Click the Sort Options icon in the Output pane of the Query & Analysis Query Definition dialog.2 For each column to be sorted, click in the Sorting Type field and select a sorting option.3 Click the Top, Up, Down, and Bottom icons in the toolbar to specify the order in which to sort the
columns.4 Specify whether the query should return all rows, a specified number of rows, or a specified
percentage of rows.
Specifying filtersIn the Columns and Filters dialog, the mandatory filter items are displayed. Which filters are requiredis determined by the DataLink through which Q&A Evolve links to the data source. To add additionalfilters, click the filter icon in the heading of the Filters pane. In the Add Filters pane, click filters to addthem.
Some filters accept multiple values or ranges of values. Select the multi-selection operator to filter onmultiple values or the range operator to filter on non-contiguous ranges.
To specify a filter:
1 Click the filter icon in the heading of the filter.See: "Specifying period filters" on page 31.
2 To change the comparison operator, click the current operator and scroll to select the requiredoperator.Some filters accept multiple values or ranges of values. Select the multi-selection operator or therange operator.Some operators provide options to specify case sensitivity and to use segments. Follow these stepsto enable or disable the case sensitivity and segment options:a Click the Case Sensitive or Segment option on the selected operator.b Enable or disable the Case Sensitive option.
Case sensitivity specifies whether upper and lower case values for a string are treated equally.For example, if Case Sensitive is selected, the strings 'ABC' and 'abc' are not equivalent.
Infor Business Intelligence Services | 29
BI Dashboards

c Enable or disable the Use Segment option.For the Segment option type, click the Offset option and specify an offset.
3 Specify the value of the filter.Specify the value manually or click the lookup icon and select.
4 Some filters accept multiple conditions. Click Add Condition and specify the filter.5 Click Done when you have specified a filter.6 When you have specified all filters, click Done to close the Columns and Filters dialog.
The Done button is disabled if any filter is incompletely specified.
Period filters
The Period lookup lists all available periods. When you select a period it is represented by one of thesecodes in the Filters table:
Offset AvailableExample ToExample FromDescriptionPeriod Code
NoSame or later thanFrom period
Same or earlierthan To period
Specify periodP
Yes2012/0012012/001First period of cur-rent year
PF
Yes2012/0092012/009This periodPA
No2011/0092011/009This period lastyear
PE
No2012/0082012/008Last periodPH
No2012/0102012/010Next periodPN
No2012/0092012/007This quarterQA
No2011/0092011/007This quarter lastyear
QE
No2012/0062012/004Last quarterQH
No2012/0122012/010Next quarterQN
Yes2012/0092012/001Year to dateYA
Yes2012/0012012/001YTD first period ofcurrent year
YF
Yes2011/0092011/001Year to date lastyear
YE
No2011/0132011/001Last year endYH
Yes2012/0132012/001Year balance toend of year
YK
30 | Infor Business Intelligence Services
BI Dashboards
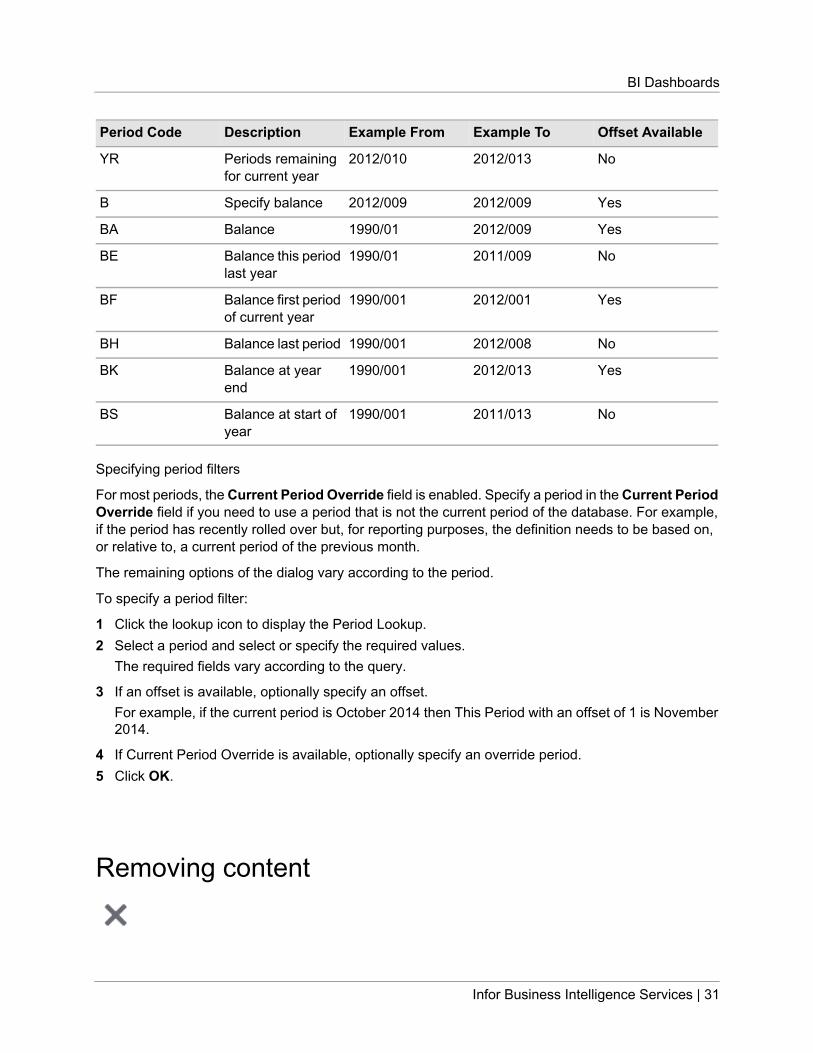
Offset AvailableExample ToExample FromDescriptionPeriod Code
No2012/0132012/010Periods remainingfor current year
YR
Yes2012/0092012/009Specify balanceB
Yes2012/0091990/01BalanceBA
No2011/0091990/01Balance this periodlast year
BE
Yes2012/0011990/001Balance first periodof current year
BF
No2012/0081990/001Balance last periodBH
Yes2012/0131990/001Balance at yearend
BK
No2011/0131990/001Balance at start ofyear
BS
Specifying period filters
For most periods, the Current Period Override field is enabled. Specify a period in the Current PeriodOverride field if you need to use a period that is not the current period of the database. For example,if the period has recently rolled over but, for reporting purposes, the definition needs to be based on,or relative to, a current period of the previous month.
The remaining options of the dialog vary according to the period.
To specify a period filter:
1 Click the lookup icon to display the Period Lookup.2 Select a period and select or specify the required values.
The required fields vary according to the query.
3 If an offset is available, optionally specify an offset.For example, if the current period is October 2014 then This Period with an offset of 1 is November2014.
4 If Current Period Override is available, optionally specify an override period.5 Click OK.
Removing content
Infor Business Intelligence Services | 31
BI Dashboards

To remove a widget, the dashboard must be in edit mode.
If a dashboard is in edit mode and the cursor is over a widget, the widget controls are displayed.
To remove a widget:
1 If the dashboard is locked, click Edit Dashboard to enable edit mode.2 Place the cursor over the widget to display its control buttons.3 Click Remove.
Communication between widgets
In Infor BI Application Studio you can use variables to link reports. For example, use variables to ensurethat a date filter selected in one report is automatically selected when you open another. But dashboardsdisplay multiple reports; some of which need to react to changes in other reports, and some of whichdo not. If you use only variables to link reports, you must refresh the entire dashboard to update thelinked reports. To refresh the linked reports on a dashboard, use report parameters, in addition tovariables, when designing reports.
Report parametersReports are linked if their parameters:
• Have the same names. That is, they refer to the same variable.• Have different names but refer to the same look-up.
Note: Report parameters must be of either Element or Tuple type.
WebView parametersWebViews can also have parameters. You can link WebViews to report widgets and to other WebViewson a dashboard by creating parameters from parts of their URLs.
See: "Creating and editing VebView widget parameters" on page 35
Parameter connectionsThe parameters of multiple widgets can form a parameter connection. For example, if two or morewidgets have Location and Month parameters, there are two possible parameter connections. Youcould add some or all widgets to either, or both connections. For example, to link widgets by location,add the location parameter of each widget to the Location parameter connection.
By default, links between report widgets are detected automatically and the parameter connectionscreated. You can turn off auto-detection and create connections manually.
32 | Infor Business Intelligence Services
BI Dashboards

See: "Creating parameter connections" on page 33.
Note: Connections between report widgets and WebViews are not automatically detected and mustbe created manually.
By default, when you save a dashboard, the values of the parameter connections are saved with it.Those values are selected each time you open the dashboard and are unaffected by changes to thesource report in the report catalog. But sometimes you will want changes in the source report to affectthe dashboard values: for example if the source report is configured to update daily.
The leading widgetYou can turn off storage by selecting a leading widget for the connection from the Initial Value list. Thevalue of a leading widget drives the values of the other widgets in the connection when the dashboardloads. If there are parameters which are not used in a parameter connection you can specify whethertheir values are stored in the dashboard or set by the widget.
Note: A WebView cannot be the leading widget of a parameter connection.
If the leading widget is removed from a dashboard, the initial value automatically reverts to 'stored indashboard'.
Creating parameter connectionsParameter connections represent links between report widgets.
To create a parameter connection manually:
1 Click Dashboard > Widget Communication.The Widget Communication dialog is displayed.
2 Expand a widget in the Widgets and Parameters pane to reveal its parameters.3 Drag a parameter to the New Parameter Connection field of the Parameter Connections pane.
A parameter connection is created.
4 From each widget that you want to include in the connection, drag a parameter of the same typeand drop it on the parameter connection.
Note: A parameter connection can only contain one parameter from each widget.
5 As required, drag further parameters to the New Parameter Connection field to create furtherparameter connections.You can create a parameter connection with only one parameter but this triggers a warning message.You should do this only while designing a dashboard. Remove the connection, or add furtherparameters before making the dashboard available to users.
6 By default, the values of the parameters in a connection are stored in the dashboard and used eachtime the dashboard is opened. To turn off storage, select a widget from the Initial Value list. Theselected widget becomes the leading widget.
Infor Business Intelligence Services | 33
BI Dashboards

Editing parameter connectionsYou can edit connections by dragging parameters in and out of connections or by deleting individualconnections. Or, you can dissolve all connections and, optionally, re-enable auto-detection. You canturn individual connections on or off.
The name and the unique name of parameter connections are generated automatically. You can editthese connection properties using the Widget Communication dialog.
To edit connection properties:
1 Click Dashboard > Widget Communication.The Widget Communication dialog is displayed.
2 Click the Edit icon.3 Edit the name or unique name of the parameter connection.
Splitting parameter connectionsYou can split a parameter connection so that two instances of a widget communicate separately.
For example, you have two widgets. When you select a region in one widget, a chart in the secondwidget updates to display the sales for that region. If you want to compare the sales for two differentregions, the first step is to add a second instance of each widget to the dashboard. The dashboardthen contains four widgets. But if you select a region in either region widget, both charts update todisplay sales for that region. So, the second step is to split the parameter connection so that the firstregion widget only updates the first chart widget and the second region widget only updates the secondchart widget.
To split the parameter connection:
1 Click Dashboard > Widget Communication.The Widget Communication dialog is displayed.
2 Expand the parameter connection in the Parameter Connections pane.The four parameters of the connection are listed: two from the region widget and two from the chartwidget.
3 Drag one of the region widgets to the New Parameter Connection field.A second parameter connection is created, with the same name as the first.
4 Drag one of the chart widgets onto the region widget of the second parameter connection.The Widget Communication dialog displays two parameter connections, each with two parameters.
In the dashboard, you can now select different regions in the two region widgets. The two charts updateindependently.Note: To make it easier to identify the widgets in the Widget Connection dialog, you might rename thewidgets on the dashboard.
34 | Infor Business Intelligence Services
BI Dashboards

Report jumpsAn Application Studio report can contain jumps to other reports. If a widget displays a report whichcontains a jump, you can specify whether the target report replaces the current content of the widget,or it is displayed full-screen as a new dashboard.
By default, the target report will be displayed full-screen.
To specify the behavior of the target report:
1 Click Edit in the widget which contains the source report.2 In the Jump Targets field, select either:
DescriptionOption
The current content of the widget will be replaced.Open in this widget
The target report will be displayed full-screen.Replace dashboard
Creating and editing VebView widget parametersYou can use parameter connections to link widgets on a dashboard. For WebView widgets, you createthe parameters from parts of the URL. For example, if the URL contained location information, youcould make a location parameter from that part of the URL and use it in communication betweenwidgets. Unlike report parameters, WebView parameters cannot be automatically added to a parameterconnection.
See "Communication between widgets" on page 32.
WebView parameters replace part of the URL with ${parameter_name}. You can make parametersfrom a URL, or you can paste in a URL which already contains parameters in the required format. Youcan also use the Link icon to reuse parameters. For example, if you have used the parameters of aURL in a parameter connection but the URL then needs to be changed, you can use Link instead ofremaking parameters for the new URL and then recreating the parameter connection.
1 Click Edit Dashboard to enable edit mode.2 Place the mouse pointer over the widget to display its toolbar and click Properties.3 Specify the URL.4 Click URL Parameters.
If you paste in a URL which contains parameters, the parameters are automatically detected whenyou click URL Parameters. If you click URL Parameters and then paste in the URL, the parametersare not automatically detected. Instead, click Detect Parameters.
5 Select the part of the URL to use and click Make Parameter.6 Specify the default value of the parameter.
In the URL, the parameter is replaced by the default value.
7 To reuse a parameter in another part of the URL, select the text to replace and click the Link icon.To copy a parameter to the end of the URL, place the cursor at the end of the URL and click Link.
Infor Business Intelligence Services | 35
BI Dashboards

8 To delete a parameter, click Delete.9 Click OK.
Dashboard managementClick Dashboards on the toolbar to display the dashboard browser.
In the dashboard browser you can:
DescriptionIcon
Open a dashboard.
Access dashboard and folder options.
Refresh the list of dashboards from the dashboard catalog.
Add a dashboard: a new blank content area is displayed.
Create folders in which to save dashboards.
View or change the name, unique name, or description of foldersor dashboards.
Change the permissions.
Copy dashboards and folders.
Delete folders and dashboards.
Note: The ability to create and edit dashboards and folders depends on user permissions.See: "Managing dashboard and dashboard folder permissions" on page 41 .
Opening dashboards
Dashboards
36 | Infor Business Intelligence Services
BI Dashboards

Dashboards are stored in folders and subfolders in the dashboard browser. You can drag dashboardsto reorder them.
Click folders to access their content and subfolders.
If other users have created dashboards whilst you have been logged on, you can click Refresh to getthe latest dashboards from the dashboard catalog.
To open a dashboard:
1 Click Dashboards on the toolbar.2 Browse to the dashboard to open.
If a dashboard is currently open, its name is highlighted in the dashboard browser.
3 Click the dashboard.Press Ctrl and click to open a dashboard in a new browser tab.
Searching dashboardsThe search feature allows you to search for dashboards in the dashboard browser or you can searchfor reports and other content in the content connections. You can search within folders and sub-foldersof your content structure.
To search for dashboards or content:
1 To search for dashboards, click Dashboards on the toolbar.2 To search for content, click on a content connection.3 Click the search icon and type in the term that you want to search for.
A list of search results is displayed.
Moving dashboards and folders
Dashboards
You can move dashboards, and folders and their contents to different folders in the dashboard browser.
Note: You cannot change property settings, or edit or delete a protected dashboard.
1 Click Dashboards on the toolbar.2 Click on the item that you want to move and drag it.
If you drag an item over a folder, the folder is highlighted. If you want to move an item out of thefolder, drag it until the blue borderline is highlighted.
Infor Business Intelligence Services | 37
BI Dashboards

Creating dashboards
Dashboards
When you sign in, a blank dashboard is displayed. You can open a saved dashboard, add reports froma content connection or add Web content through a WebView.
To create a dashboard:
1 Click Dashboard > New Dashboard.If the current dashboard is unsaved, or there are unsaved changes, you are prompted to save.Otherwise, a blank dashboard is displayed.
2 Open a content connection to add a report, or add a WebView from the Toolbox.
Creating folders and subfolders
Dashboards
If you have the appropriate permissions, you can create folders and subfolders:
• In the dashboard browser• In the Save Dashboard dialog when saving a dashboard.
See "Managing dashboard and dashboard folder permissions" on page 41.
In the dashboard browser, you can use drag and drop to make one folder a subfolder of another.
To create a folder in the dashboard browser:
1 Click Dashboards in the toolbar.2 Either:
a Click New Folder.A folder is created in the root, Dashboards, folder. You can use drag & drop to make one foldera subfolder of another.
b Browse to a folder in which to create a subfolder, click its Settings icon and click New Folderin the menu.A subfolder of the selected folder is created.
3 Specify a folder name and press Enter.
38 | Infor Business Intelligence Services
BI Dashboards

Copying dashboards
Dashboards
You can copy dashboards in the dashboard browser or you can use the Save As and Save a Copyoptions on the toolbar.
See "Using Save As and Save a Copy options" on page 40.
To copy a dashboard in the dashboard browser:
1 Click Dashboards in the toolbar.2 Browse to the dashboard to copy and click its Settings button.
Note: In the dashboard browser, you cannot copy a dashboard which is open.
3 Click Copy.4 Specify the target folder, the name for the dashboard and, optionally, a description.5 Click OK.
The copy of the dashboard is displayed in the same folder as the original. If required, you can thendrag the copy to another folder.
Renaming dashboards and folders
Dashboards
To rename a dashboard or folder:
1 Click Dashboards in the toolbar.2 Browse to the folder or dashboard to rename and click Settings > Properties buttons.3 Specify the new name and click OK.
The new name is displayed.
Removing dashboards and folders
Dashboards
To remove a dashboard or folder:
1 Click Dashboards in the toolbar.2 Browse to the folder or dashboard to remove and click its Settings button.
Infor Business Intelligence Services | 39
BI Dashboards

Note: You cannot remove a dashboard which is open.
3 Click the Remove icon.
Saving dashboards
You are prompted to save a dashboard if:
• You leave a dashboard which has not been saved.• You leave a dashboard which has unsaved changes.
You are also prompted if you click Save, and another user has saved changes to the dashboard duringthe time in which you have had the dashboard open.
See: "Concurrent saving and editing" on page 41.
To save a dashboard:
1 To save changes to a dashboard, click Save on the toolbar.2 To save, when prompted, click Yes.
If the dashboard is unsaved, the Save Dashboard dialog is displayed. Unsaved changes are saved.
3 Specify a dashboard name.Or, to overwrite an existing dashboard, click the dashboard to overwrite. The same name, withoutspaces or special characters, is suggested as the unique name. You can specify a different uniquename.
4 Optionally, specify a description of the dashboard.Dashboard descriptions are displayed in Dashboard Properties.
5 Browse to the folder in which to save the dashboard and click OK.Otherwise, click OK to save the dashboard in the root, Public Dashboards, folder.
Using Save As and Save a Copy options
The Save a Copy option copies a dashboard but keeps the original open. The Save As option opensa new copy of the dashboard and closes the original.
To use Save As, or Save a Copy:
1 Open the dashboard to copy.2 On the toolbar, select either Save As or Save a Copy option.
40 | Infor Business Intelligence Services
BI Dashboards

The Save Dashboard dialog is displayed.
3 Browse to the folder in which to save the copy.Or click Create new folder to create a folder.
4 Select an existing dashboard to replace it or specify a new dashboard name and, optionally, adescription.
5 Click OK.
Concurrent saving and editingInfor Motion Dashboards and Infor BI Dashboards are cross-platform applications. Dashboards canbe edited concurrently in multiple instances of one application or in instances of both applications. Forexample, an Infor BI Dashboards user might make and save changes the content or properties of adashboard whilst you are editing the same dashboard in Infor Motion Dashboards on an iPad. Or twoInfor BI Dashboards users might edit a dashboard concurrently.
In these cases, you are prompted that a newer version of the dashboard exists when "save yourchanges" on page 40. You can:
• Overwrite the newer version with your version• Save the dashboard under a different name.
To overwrite the dashboard, click Overwrite.
Managing dashboard and dashboard folder permissions
Dashboards
This section describes the permission management of dashboards and dashboard folders in Infor BIDashboards.
Note: To manage the permissions of dashboards and dashboard folders, users must have the Administerpermission.
To manage dashboard and dashboard folder permissions:
1 Click Dashboards on the toolbar.2 Click the Settings icon of the dashboard or folder to manage.3 Click Permissions.
The Permissions dialog displays the roles which have been created for the dashboard catalog inRepository Administration. The permissions for each role are displayed. By default, roles inherittheir permissions from the dashboard catalog.
4 To assign or withdraw permissions manually, select or clear the permissions check boxes.If you change a permission manually, the Restore Inheritance button is enabled. If you change thepermissions on a folder, the permissions are inherited by all subfolders and dashboards within it.
Infor Business Intelligence Services | 41
BI Dashboards

5 To restore the inherited permissions of the role, click Restore Inheritance.
Dashboard settingsThis section explains how you can access and change dashboard settings.
Helper lines
Helper lines help you to lay out and align content on a dashboard. The horizontal and vertical helperlines become visible at defined points on the background when "hotspots" on page 11 at the edge orcenter of a widget approach them - for example, when you drag or resize a widget.
Lines are displayed at these points on the X and Y axes of the dashboard: 0.333, 0.5, 0.666. So, forexample, you could resize a widget to occupy precisely a third of the dashboard.
To turn helper lines on or off:
1 Select Settings > Helper Lines.2 Select or clear the Helper Lines check box to toggle helper lines on or off.
Note: To temporarily toggle helper lines and "snapping" on page 42 or off, press the S key whiledragging a widget.
Snapping
Snapping helps you to align widgets precisely. Widgets within the 'snapping distance' are pulled towardshelper lines and the edges of other objects and automatically aligned with them.
To turn snapping on or off:
1 Click Settings.2 Select or clear the Snapping check box to toggle snapping on or off.
Note: To temporarily toggle helper lines and snapping or off, press the S key while dragging awidget. While the S key is pressed, a message indicates whether snapping is on or off.
42 | Infor Business Intelligence Services
BI Dashboards

Auto-hide toolbar
If preferred, you can specify that the toolbar is displayed when you place the mouse pointer at the topof the screen, and then is automatically hidden again:
Note: If the auto-size option is on, hiding the toolbar increases the size of the dashboard.See "Auto-sizing dashboards" on page 17.
To auto-hide the toolbar:
1 Click Settings.2 Select or clear the Auto-hide toolbar check box to toggle auto-hide on or off.
Automatic refresh
The automatic refresh option allows you to refresh the dashboard content automatically.
To set the automatic refresh option:
1 Click Settings.2 Select or clear the Automatic refresh check box.3 Select the interval in minutes.
Default: 15 minutes
Note: If you set the automatic refresh interval to be smaller than the session timeout option, thesession will not time out.
4 Select the countdown option.Default: 30 seconds
Setting the start screen
In the Infor BI Repository you can specify that a specific dashboard, or a blank dashboard, is displayedas the start screen when users sign in to Infor BI Dashboards or to Infor Motion Dashboards. You canalso specify the start screen in Infor BI Dashboards and Infor Motion Dashboards.
Infor Business Intelligence Services | 43
BI Dashboards

To specify a start screen:
1 Select Settings > Start Screen.2 Select one of these options:
DescriptionOption
Opens the default start screen.Default Start Screen
Opens an empty screen after sign-in.Start Empty
Opens a specified dashboards as your start screen. Browse to thedashboard to use as the start screen, or click Use Current to specifythe current dashboard as the start screen.
Dashboard
3 Click OK.
Setting the language
You can specify the language of the dashboard user interface, and of dashboard content, such aswidget headers.
To specify the language of the UI or the content:
1 Select Settings > Language.2 Select the required UI and Content language from the drop-down lists.
The Language list depends on the languages in the repository to which the user is connected andwhich contains the dashboard catalog.If the language selected is not supported by some of the content displayed on the dashboard, thatcontent is displayed in the default language specified for the project in Infor BI RepositoryAdministration. As content can be added from more than one project, ensure that each project hasthe same default language.
Content connectionsAdministrators register access to report catalogs in Infor BI Dashboards through content connections.As a content provider, Infor BI Application Studio WebServices is supported. Content connections arestored on project level in the repository. Content connections must be configured correctly before youcan access any content from report catalogs in Infor BI Dashboards. Dashboards that are based oncontent connections do not work, if the content connections are removed.
You can create, edit, and delete content connections. Additionally, you can change the order in whichthe content connections are displayed in the toolbar.
44 | Infor Business Intelligence Services
BI Dashboards

Note: To administer content connections, you must have these permissions:
• Project permission Edit: The user can manage dashboard catalogs.• Dashboard permission Administer: The user can change the settings of dashboard catalogs.
See the Repository online help for detailed information on how to configure dashboard catalogs,dashboard settings, and dashboard permissions and roles.
The Content Connections page shows this information:
NameThe name of a content connection that is shown in the Dashboards toolbar.
DescriptionThe description of a content connection.
ConnectionThe content connection is shown here. Content connections of Application Studio WebServices reportcatalogs have this format: <Repository>/<Project>/<Report Catalog>.
Note: The content connections that are shown in the list of this page might not be connected. You canleave this page, even if some content connections do not work properly. To ensure that a contentconnection works properly, double-click the content connection from the list. The Content ConnectionEditor dialog opens. Click Test. If a connection is not possible, a message is shown that indicates thereason why the connection cannot be established.
Creating a content connection
See "Content connections" on page 44 for conceptual information about content connection.
To create a content connection:
1 Select Settings > Content Connections.2 Click Create in the toolbar and select the type of content connection to add.
The Content Connection Editor is displayed.
3 Specify this information:
NameSpecify the name of the content connection. When you have created the content connection, thename is shown in the Dashboards toolbar.
Unique NameSpecify the unique name of the content connection. This name identifies a content connection.
DescriptionSpecify a description of the content connection.
Infor Business Intelligence Services | 45
BI Dashboards
Connection modeSelect if the content connection is established automatically after the user has signed in so thereis no delay for establishing connection after the content connection button is clicked.
Base URLSpecify the URL of the Application Studio WebServices server.
Note: This option is not available for Dashboards Service.
RepositorySpecify the repository that contains the project and report catalog data.
Note: This option is not available for Dashboards Service.
Note: See the Repository online help for detailed information on how to configure dashboardcatalogs, dashboard settings, and dashboard permissions and roles.
AuthenticationSelect the authentication system of the user, that is used to sign in to the repository. The user mustbe defined in the RepositoryUser Management. Infor BI supports a number of authentication systemsbut not all systems are supported by all Infor BI products. For Infor BI Dashboards and Infor MotionDashboards you can select one of these authentication systems:
• Existing Connection: Uses the same certificate that users receive when they sign in to Dashboardsas to connect to the report catalog. We recommend that you use this authentication within arepository and if the user management is linked between remote repository and Dashboardsproviding repository.
Note: If you use the Existing Connection option and you use the Basic authentication to accessDashboards, the source system of the content connection and Dashboard authentication mustshare the user management of the same repository.
• Windows: Uses the Windows computer user to log on to the report catalog.• IFS: Uses the IFS computer user to log on to the report catalog.• Basic: Uses a user account from the Basic authentication system.
UserSpecify the sign-in data of the user account.
PasswordSpecify the user password.
ProjectSpecify the project that contains the report catalog to access.
Note: This option is not available for Dashboards Service.
Report CatalogSpecify the report catalog that contains the content to work with.
Note: This option is not available for Dashboards Service.
46 | Infor Business Intelligence Services
BI Dashboards
4 To ensure that your content connection is correctly configured, click Test before you save the contentconnection. If a connection is not possible, a message is shown that indicates the reason why theconnection cannot be established.
5 To save the content connection, click OK. You can immediately use the new content connection inthe Dashboards toolbar.
Editing a content connection
Caution: When you edit content connections, ensure that the connections work properly. Testthe connections, so that dashboards that access content from those connections do not becomeuseless. If you change a content connections, ensure that it provides the same content. Youcan destroy dashboards, if you select a different report catalog in an existing content connectionthat does not contain the reports to use in a dashboard or in which the reports have differentunique names.
To edit a content connection:
1 Select Settings > Content Connections.2 On the Content Connections page, double-click the content connection to edit, or select a content
connection and click Edit in the toolbar.3 In the Content Connection Editor dialog, specify the required information. See "Creating a content
connection" on page 45 for a description of the required field entries.4 To delete a content connection, select the content connection in the list and click Delete.
Caution: Before you remove a content connection, ensure that the connection is not usedby dashboards that would not work properly when they try to access content from thoseconnections. If you remove a content connection, you can destroy dashboards that accessreport catalogs from this connection.
5 To change the order in which the content connections are displayed in the Dashboards toolbar,select a content connection in the list and click the up or down arrows in the toolbar.
6 To ensure that your content connection is correctly configured, click Test before you save the contentconnection. If a connection is not possible, a message is shown that indicates the reason why theconnection cannot be established.
7 To save the changes, click OK. You can immediately use the changed content connection in theDashboards toolbar.
Infor Business Intelligence Services | 47
BI Dashboards

Dashboard properties
To display the Dashboard Properties dialog of a currently open dashboard, select Dashboard >Dashboard Properties.
In the Dashboard Properties dialog you can:
• Rename the currently open dashboard. To rename a closed dashboard, see: "Renaming dashboardsand folders" on page 39.
• Add or edit a dashboard description.• View information about when the dashboard was created and modified.• Specify the size of the dashboard. That is, the size of the area in which you can place content.• Specify whether the widget headers are displayed.• Specify a background color for the dashboard.
There are three tabs: General, Layout, and Theme.
Dashboard browser
To edit the name, unique name, and description of any of your dashboards, navigate to dashboardproperties using the dashboard browser.
General
Select Dashboard > Dashboard Properties and click the General tab.
On the General tab, you can change the name, unique name and description of the current dashboard.
The General tab displays this information:
• The user who created the dashboard and the date and time of creation• The user who last modified the dashboard and the date and time of modification.
Protected application component dashboardsDashboards that are part of an application can be protected.
48 | Infor Business Intelligence Services
BI Dashboards

Note: You cannot change property settings, or edit or delete a protected dashboard.
An application component dashboard has this additional information in the DashboardsPropertiesdialog:
• Application name• Application Version number• Vendor name• Protected Yes or No
Layout propertiesIn the Dashboard Properties dialog, on the Layout tab you can:
• Specify the size of the dashboard,• Set the maximum size of the dashboards,• Specify dashboard margins,• Select to display the Dashboard title bar.
Specifying dashboard sizeBy default, the automatic size of 100% of the screen for dashboard width and height is selected. Youcan also set maximum width and height in pixels. Alternatively, you can set the exact dashboarddimensions in pixels.
If you specify a dashboard size that is smaller than the screen size, the remaining space creates aborder at the sides and the bottom of the dashboard.
Note: If Auto-hide toolbar is selected, the height of the dashboard increases by the height of the toolbar.See "Auto-hide toolbar" on page 43.
To change the dashboard size:
1 Click the Edit dashboard icon and click Dashboards icon > Dashboard Properties.2 Click the Layout tab.3 To set how much percentage of the screen dimensions the dashboard occupies, select Automatic
and specify the width and height of the dashboard in percentages.Optionally, you specify the maximum height and width of the dashboard in pixels.
4 To specify the exact size, select Exact and specify the width or height of the dashboard in pixels.5 To set the current screen size, select Current Screen Size.
The exact dashboard dimensions in pixels are used.
6 Click OK.
Infor Business Intelligence Services | 49
BI Dashboards

Displaying the dashboard title bar
A dashboard title bar displays the name of the dashboards that is specified in Dashboard properties.
By default, the dashboard title bar is not displayed when you create a dashboard, you can change thisoption on the Layout tab.
1 Select Dashboard > Dashboard Properties > Layout.2 To display the title bar of a dashboards, click Show Dashboard Title Bar.
Specifying the theme
Select Dashboard > Dashboard Properties > Theme.
On the Theme tab, you can specify a background color for a dashboard. You can pick a color from apalette, or specify a hexadecimal value.
To specify a background color:
1 Click the color sample.A color picker is displayed.
2 Use the vertical slider to select the area of the color palette which contains the color you want.Or, if you know the hexadecimal value of the color you want, specify it in the field at the top of thecolor picker. You do not need to specify the # symbol.
3 Select the color you require and click OK.
Sharing dashboards
You can quickly make other users aware of dashboards they might be interested in, by sending adashboard link in a template e-mail. The e-mail has the name of the dashboard as its subject and thistext in its body.
You can also share your content by exporting and importing dashboards and folders.
50 | Infor Business Intelligence Services
BI Dashboards
Creating dashboard linksA dashboard link is the URL of a specific dashboard.
Note: Because of limitations of the maximum URL size that are supported by various browsers, thecreated link does not always contain all parameters of the dashboard. Therefore, if the dashboard ischanged after sending the link, the recipient of the dashboard link may see a different view than theview at the time of sending the link.
If required you can then amend the link by adding, for example, username and password parametersto sign in the recipient automatically. See "Manual dashboard links" on page 51 for more informationabout editing the links manually.
1 In an open dashboard, select Share > Create Dashboard Link.2 Select one of the options:
• Simple link - opens the default view of the dashboard.The recipient of a simple link always sees the recently saved dashboard view.
• Full context link - opens the saved view of the dashboard.Even if the dashboard view has been changed, the recipient of the full context link, sees the viewthat was saved at the time when the full context link was created.
• Relative context link - represents the difference between the saved view and the simple link.The relative context link contains any values that were changed since the dashboard view wassaved.
3 Click Send E-Mail
Note: If you use Web-based e-mail, press Ctrl + Send E-Mail to open your e-mail client in a newwindow.
4 Click Close.
The links created by the Create Dashboard Link feature require the recipient to sign in to the dashboard.But you can manually create dashboard links that include sign-in credentials.
Manual dashboard linksYou can manually create dashboard links, or amend links which were created with the Create DashboardLink option.
For Infor BI Dashboards links, you can:
• Specify a project. If a start screen has been specified, it is displayed. Otherwise, a blank dashboardis displayed. The user must sign in manually.http://localhost/Dashboards/api/repository/project
• Display a specific dashboard. The user must sign in manually.http://localhost/Dashboards/api/repository/project/dashboard?name=InforDemo
Infor Business Intelligence Services | 51
BI Dashboards

• Specify a project, a dashboard, and credentials to sign in the user automatically.
Note: Automatic sign-in works only with the Basic authentication enabled.
http://localhost/Dashboards/api/repository/project/dashboard?name=CommsDemo&showheader=false&username=DemoUser&password=DemoPassword
• Specify parameters of the current view.This example specifies:
• connections and their values, respectively: Customer, Measure, Product• a widget with ID 3939fd55-e408-4cf6-987b-50a3eb63afdb and the unconnected parameter
GlobalVariables.Measure
http://localhost/Dashboards/api/repository/project/dashboard?name=AssociativeSalesAnalysis&connections=Customer*%5BCUSTOMER%5D.%5BCustomers%20by%20region%5D.%5B1%5D'Measure*%5BMEASURE_SALES%5D.%5BNet%20amount/revenue%5D.%5B1%5D'Product*%5BPRODUCT%5D.%5BProducts%20by%20item%20group%5D.%5B1%5D'&widgets =3939fd55-e408-4cf6-987b-50a3eb63afdb~GlobalVariables.Measure*%5BMEASURE_SALES%5D.%5BNet%20amount/revenue%5D.%5B1%5D
Infor BI Dashboards links have this syntax:
<protocol>://<server>:[<port>]/<path>/<repository><project>/dashboard?name=<dashboard_uniquename>&[showheader=true]&[username=<user_name>]&[password=<password>]&[connections=<connection_uniquename>]&[widgets=<widget_id>]&[autorefresh=<minutes>]&[showcountdown=<seconds>]
Example: http://localhost/Dashboards/api/repository/project/dashboard?name=CommsDemo&showheader=false&username=DemoUser&password=DemoPassword
Exporting dashboards
You can export dashboards and folders that you want to share with others.
To export dashboards:
1 Select Share > Export Dashboards.2 Select dashboards and folders that you want to export.3 Click Next.
The list of content connection is displayed.
4 Click Finish.Your dashboards are saved with .dashboards extension.
52 | Infor Business Intelligence Services
BI Dashboards

Importing dashboards
You can import dashboards and folders. You need a file with .dashboards extension that was createdin Dashboards.
To import dashboards:
1 Select Share > Import Dashboards.2 Select Import file and Target folder.3 Click Next.4 Select Dashboards and folders that you want to import.5 Click Next.
The list of content connections that are needed by the imported dashboards is displayed.
Note: If the required content connections already exist, they are preselected.
6 Click Next.The detailed information about the dashboards, folders, and content connections is displayed.
7 Click Finish.8 If any of the dashboard or folders exist, select one of these options:
DescriptionOption
The existing folders, dashboards, and any content of theexisting folder will not be imported.
Skip all existing folders anddashboards
The imported dashboards and folders will be renamed byadding a suffix.
Add all
Merge the content of the imported folders into the existingones. If a dashboard already exists, the imported one will beadded and renamed by adding a suffix.
Merge folders and adddashboards
Merge the content of the imported folder into the existing one.Existing dashboards will be replaced by imported ones.
Merge folders and overwriteexisting dashboards
The dashboards are imported to the target folder.
Infor Business Intelligence Services | 53
BI Dashboards

54 | Infor Business Intelligence Services
BI Dashboards

BI Application Manager
BI Application Manager provides administration for Infor BI Services through a web-based interface.You can use a set of predefined dashboards to perform typical administrative tasks. You can alsocreate your own dashboards by organizing Administration widgets on your custom dashboard.
The Administration widgets and corresponding dashboards are organized into these folders:
• User and Permission Management• Global Settings• OLAP
Using predefined dashboardsThe predefined dashboards contain a set of inter-connected Administration widgets that are ready foruse.
To use the predefined administration dashboards, click Dashboards on the toolbar and browse throughthe folders or search for a specific dashboard.
Note: Delivered Administration dashboards are protected and you cannot modify them. To havecustomized dashboards, use the available Administration widgets and create your own dashboards.
To open the predefined dashboards:
1 Open the Dashboards menu.2 Expand available folders:
• "User and Permission Management" on page 56• "Global Settings" on page 62• "OLAP" on page 69
3 Open the dashboard that you want to use.
Infor Business Intelligence Services | 55
BI Application Manager

Creating dashboards
To create a custom dashboard, that contains selected Administration widgets, follow these steps:
1 Open the Dashboards menu and click New Dashboard to create a new dashboard.2 Open the Administration content connection, select a category folder, and drag a selected widget
to your dashboard.3 Add, remove, arrange and resize widgets to design your customized dashboard.4 Click Save and make your dashboard ready to use.
User and Permission ManagementYou can use pre-defined dashboards from the User and Permission Management folder to administerthe corresponding settings:
AdministratorsManage who can administer the repository and applications.
Users and user groupsRegister users and user groups and assign them to application roles.
Application RolesDefine application roles.
You can also use these user management widgets to create custom dashboards:
• Application Permissions• Application Roles• Basic Groups• Repository Permissions• Repository Roles• Users and User Groups
Note: The available dashboards contain widgets that use content connections and communicatebetween each other. If you edit one widget, other widgets that use the same content connections areaffected as well.
56 | Infor Business Intelligence Services
BI Application Manager

Creating a basic user
To create a basic user:
1 In the Users and User Groups widget, click the plus icon and select Create Basic User.2 Specify the user name and description.3 Optionally, you can disable and temporarily restrict an account.4 Click the Password tab.5 Enter and repeat the new password.6 You can select these options:
• User must change password at the next sign in• Password never expires
7 Click the Password Rules tab to specify user-specific settings.
Note: Password rules are inherited from a global security policy. You must first clear the optionInherited and then select the option User-specific to change security settings.
8 Click OK.
Register Windows users and user groups
To register an existing Windows user or user group:
1 In the Users and User Groups widget, click the plus icon and select Register Windows User andUser Groups.
2 Specify the search elements:a Enter a user or user group name.b Optionally, select a type.c Select the domain.
3 Click Search to see results.4 To finalize the registration, select a user or group from the results list, and click Include.5 Click OK to confirm your settings.
Infor Business Intelligence Services | 57
BI Application Manager

Assigning users or groups to application rolesYou can use the User and Permission Management dashboard to create users, user groups and updatetheir permissions. You can also assign users and groups to application roles. The widgets on thisdashboard are connected and there is communication between widgets so by selecting or updating anitem in one widget, the information is propagated to other widgets.
To assign application roles:
1 In the Users and User Groups widget, select the user.2 In the Application Roles widget, select the application from a list and click Edit Application Roles
Assignments.3 Select the application roles to which to assign the user and click Save.4 In the Basic Groups widget, click Edit Basic Group Assignments icon.5 Select the basic groups to which to assign the user and click Save.
Creating basic groups
To create basic groups:
1 In the Basic Groups widget, click Create.2 Specify the name and the description of the basic group.3 Click OK.
Creating application roles
Typically, ech application provides a prebuilt set of application roles. Additionally, you can add newapplication roles using the predefined dashboards.
To create application roles:
1 Click Create in the Application Role widget.2 Specify a name and description.3 In the Rank box, type or select a user role ranking.
As you may assign multiple roles to one user, it can become important to define, which exact roleis going to inherit deterministic values that equip the user with specific settings. For a user withmultiple roles, the settings for an application role with the highest rank are used.
58 | Infor Business Intelligence Services
BI Application Manager
Note: The smaller the number, the higher the rank. Zero value means that no rank is assigned toan application role.
4 Click OK.
Editing application permissions
You can define application roles and modify the permissions for the application roles.
Note: Only users with administrative permissions for a specific application can edit permissionassignments for application roles.
To edit application permissions:
1 Open the Aplication Roles dashboard.2 In the Application Roles widget, select the application from the drop-down list and select the
application role that you want to edit.The application permissions that are assigned to the selected application role are highlighted.
3 Click Edit Application Permissions Assignments and select or deselect the permissions.4 Click Save.
Application permissionsThis section lists the predefined application permissions and their description. The permissions aregrouped by components:
• Application
View ApplicationBearers can view the application. This application permission is assigned to all application roles.
Edit ApplicationBearers can edit the application properties, add lists, calculations, variables, Aliases, tasks, sharedmedia, and to add, update and delete languages and database descriptions. This applicationpermission is assigned to MasterRole and ProjectDesigner application roles.
Administer PermissionsBearers can manage the application permissions. This application permission is assigned to theAdministratorRole and MasterRole application roles.
• Dashboard
View DashboardBearers can view dashboards. This application permission is assigned to all application roles.
Infor Business Intelligence Services | 59
BI Application Manager

Edit DashboardBearers can edit dashboard properties, manage content connection. This application permissionis assigned to MasterRole and ProjectDesigner application roles.
• DataLink
View DataLinkBearers can view DataLink connections. This application permission is assigned to all applicationroles.
Edit DataLinkBearers can configure DataLink connections. This application permission is assigned to MasterRoleand ProjectDesigner application roles.
• OLAP
View OLAPBearers can view OLAP databases and settings. This application permission is assigned to allapplication roles.
Edit OLAPBearers can edit OLAP database settings. This application permission is assigned to MasterRoleand ProjectDesigner application roles.
Import/Export ValuesBearers can import and export OLAP databases. This application permission is assigned to theMasterRole application role.
Edit DimensionsBearers can edit dimensions of OLAP databases. This application permission is assigned to theMasterRole application role.
Edit RulesBearers can edit OLAP rules. This application permission is assigned to the MasterRole applicationrole.
Administer OLAP DatabaseBearers can administer the OLAP permissions. This application permission is assigned toAdministratorRole and MasterRole application roles.
Write ValuesBearers can write values to an OLAP database. This application permission is assigned toMasterRole and ProjectDesigner application roles.
• Reporting
View ReportBearers can view reports. This application permission is assigned to all application roles.
Edit ReportBearers can edit reports. This application permission is assigned to MasterRole and ProjectDesignerapplication roles.
60 | Infor Business Intelligence Services
BI Application Manager

Browse Folders/ReportsBearers can browse folders and reports. This application permission is assigned to MasterRole,ProjectDesigner, and ViewRole application roles.
Creating repository roles
You can use predefined repository roles available in BI Application Manager.
1 Open the Administrators dashboard.2 In the Repository Roles widget, click Create.3 Specify a name and description.4 Click OK.
Editing repository permissions
To edit repository permission assignments:
1 Open theAdministrators dashboard.2 In the Repository Roles widget, select the role that you want to modify.3 Click Edit 'Repository Permissions' Assignments.4 Select the repository permissions that you want to apply to this role.5 Click Save.
Repository permissionsThis table shows the predefined repository permissions and their descriptions:
DescriptionRepository permission
Bearers can define and configure the SSO systemto be used, add, and remove users and user
Administer Users and Groups
groups. This repository permission is assigned tothe Repository Administrator role.
Infor Business Intelligence Services | 61
BI Application Manager

DescriptionRepository permission
Bearers can change the password to the applica-tion. This repository permission is assigned to theChange Password role.
Change Password
Bearers can perform repository level administrationtasks, for example, history management, database
Administer Repository
interface managemen. This repository permissionis assigned to the Repository Administrator role.
Bearers can install new applications. This reposi-tory permission is assigned to Application Creatorand Repository Administratos roles.
Create Application
Bearers can manage the Configuration service,repository assignments, and administer OLAP
Administer Farm
database. This repository permission is assignedto the Farm Administrator role.
Bearers can view existing log entries. This reposi-tory permission is assigned to Farm Administrator,Log Administrator, and Log Viewer roles.
View Log
Bearers can create log definitions. This repositorypermission is assigned to Farm Administrator andLog Administrator roles.
Administer Log
Global SettingsGlobal Settings allow you to manage applications, attachments, set the language, manage authenticationsettings, pending operations, and global data sources.
You can use predefined dashboards listed in the Global Settings folder or the corresponding widgets.
• To deploy, update and configure applications, use the Applications dashboard or the correspondingManage Applications widget.
• To manage authentication settings and handle pending operations, you can use the Repositorydashboard or the corresponding: Authentication Provider Settings and Pending Operations widgets.
• To manage attachments, use the Attachments dashboard or widget .• To add or delete languages for your application or import and export strings, use the Language
Settings dashboard or the corresponding Languages and Strings widgets.• To view global data sources for applications, use the Global Data Sources dashboard or the
corresponding Global Data Sources widget.
62 | Infor Business Intelligence Services
BI Application Manager

Managing applications
You can install, update, and customize your Infor BI Services applications. To manage applications,you need to take the applications offline and later put it back online. In the Application Details section,you can view application properties, configuration tasks, and update the history.
To delete an application, you need to first take it offline.
Installing a BI application1 Select Dashboards > Global Settings > Applications.
The Applications dashboard opens.
2 Click the Install app icon.3 Click Install.4 After successful installation, click Done.
The newly installed application is listed in the Applications dashboard.
Updating an ApplicationTo update an application:
1 Select Dashboards > Global Settings > Applications.The Applications dashboard opens.
2 Select the application3 Click Take Offline.4 Click Update.
The Update Application window is displayed.
5 Select an application file with the .biapplication extension and click Next.6 Follow the Update Application wizard.7 Select the application and click Put Online.
RepositoryThe Repository dashboard is a predefined dashboard that you can use to manage authenticationsettings and handle pending operations.
Infor Business Intelligence Services | 63
BI Application Manager

Authentication Provider SettingsYou can enable or disable authentication providers or change settings of a selected authenticationprovider.
Pending OperationsYou can access the list of pending operations and group the operations by user or object type. In thePending Operations widget, you can see if any actions have not been finished and which userchecked-out which objects. Select the items that you want to check in and click the check mark toaccept the selected changes.
Global Data SourcesThe Global Data Sources dashboard is a predefined dashboard that you can use to view global datasources for Infor BI Services applications. Global data sources are cloud-related mechanisms thatautomatically map relational Infor BI data sources to those of an entire tenant.
In the Global Data Sources dashboard, users can view the list of global data sources for applicationsand edit their descriptions. Users cannot change their unique names, database types, databaseproviders, or connection settings. Users are able to delete permanently global data sources. This actioncannot be undone. Users cannot add back global data sources that were removed.
AttachmentsAttachments are files which are stored in an application. The attachments contain this metadatainformation:
File nameRepresents the name of the attached file.
Note: The file names are not unique. You can upload files with the same name as long as the uniquename is different.
Unique nameIdentifies the attachment. The unique name can be used by OLAP to refer to the attachment.You can reference attachments by their unique names, for example, when you define attachment-relatedactions in Application Studio
SizeRepresents the size of the attachment.
Relative pathInternal address to the physical attachment in the storage system.
You can use the Attachments widget to perform these actions:
• Import attachment
64 | Infor Business Intelligence Services
BI Application Manager
• Export attachment• Delete attachment• Replace attachment• Download attachment
Managing attachmentsYou can manage attachments that are part of your application.
To manage attachments:
1 To navigate to the predefined dashboard: select Dashboards > Global Settings > Attachments.2 To import an attachment:
a Click the import icon.b Browse the attachment file with the .attachments extension.c Select the option to choose when importing the attachments if an attachment with the same name
already exists.
3 To export an attachment:a Click the export icon.b Select the export mode.
FullAttachment links and attachment files are exported.
Attachment linksOnly attachment links are exported. When imported, the same attachments must exist in thestorage at the same locations otherwise the links will not work.
If you want to export filtered attachments only, use the filter functionality and select the Exportfiltered attachments only option.
c Select to Save the file and click OK.
4 To replace an attachment, click the replace icon.5 To download an attachment, click the download icon.6 To delete the attachment file, click the delete icon.
To delete more attachments at once, select the attachments and click the delete icon.
Language settingsYou can use the Language Settings dashboard to manage languages and translation strings for yourapplication or you can use the full-screen widgets from the Administration content connection.
You can use these widgets to manage language settings:
• Languages
Infor Business Intelligence Services | 65
BI Application Manager
• Strings
Use the Languages widget to manage available languages for your application. You can add, activate,deactivate, and edit properties of languages.
Use the Strings widget to manage translation strings. You can manually add or import new strings toyour application and edit or export existing strings.
Managing languagesTo manage languages for your application, you can use the Language Settings dashboard and thecorresponding Languages widget.
1 To open the predefined Language Settings dashboard, select Dashboards > Global Settings >Language Settings.
2 To open the Languages widget full-screen, select Administration > Global Settings > Languages.3 To add a new language, click the add icon, select one or more languages to add and click OK.
You can select to show languages with or without country specification.
4 To change the language properties, click the properties icon.5 To activate or deactivate a language, select and clear the check box, respectively.
Note: To deactivate the default language, select a different language that contains translation of allstrings and click Make default.
6 To delete a language from your application, click the delete icon.
Note: The default language and languages that are part of the application are protected and cannotbe deleted.
Managing translation stringsTo manage translation strings, use the Strings widget. You can sort the table with translation stringsby type, unique name, description, or by any of the available languages .
1 To open the predefined Language Settings dashboard, select Administration > Global Settings> Language Settings.
2 To open the Strings Settings widget full-screen, select Administration > Global Settings > Strings.3 To import the translations from a file:
a Cick the import icon.b Browse the import file and click OK.
Use a .csv, .xml, or a .zip file.
4 To manually add or update translations, type the values in the appropriate language column.5 To export translation strings:
a Click the export icon.b Select the file format.
66 | Infor Business Intelligence Services
BI Application Manager

c Select the languages that you want to export.d If you applied some filters and want to export only the filtered strings, select the check box.e Click OK.The strings are exported to a file named Application name_Strings.
How to customize an Infor BI Services applicationYou can extend a BI application and add custom reports using OLAP data. The following processoutlines the required procedures and indicates components that are involved in various stages.
To customize your application:
1 In the Applications dashboard:
• Download the original BI Application package.See: "Downloading the original application" on page 68.
• Download the latest OLAP database with your customized data and structure.See: "Downloading OLAP database" on page 68.
2 Import the downloaded content packages to an environment with a corresponding version of classicInfor BI components:
• In Infor BI Repository, import the original BI Application package with the *.biapplicationextension.For more information about importing repository data, see Infor BI Repository Online Help.
• In Infor BI Application Studio, import the original BI Application package with the *.biapplication extension.For more information about importing an application component, see Infor BI Application StudioOnline Help.
• In Infor BI OLAP Administration, import the downloaded OLAP database with the *.app_olapextension.
• In Infor BI Application Engine Process Editor, if the BI application uses Application Engineprocesses, import the original BI Application package with the *.biapplication extension.For more information about importing Infor BI Application Engine processes, see ApplicationEngine User Guide.
3 Create or update the reports with the Infor BI Application Studio full client.4 In Application Studio, export customized reports for the Infor BI Services application.5 Import customized reports in the Applications dashboard.
Infor Business Intelligence Services | 67
BI Application Manager

Downloading the original applicationYou can download the original application using the BI Application Manager application.
To download the original application:
1 Select Dashboards > Global Settings > Applications.The Applications dashboard opens.
2 Click Download > Original Application Installable.3 Click Download Exported Application.
The .biapplication file is downloaded and can be imported to Application Studio, RepositoryAdministration, and Infor BI Application Engine Process Editor.
Downloading OLAP databaseThe delivered reports use sample data that may differ from the data that you want to analyze. You cancustomize reports to reflect your data structure. To customize the reports, download your OLAP databaseusing the BI Application Manager application.
To download your OLAP database:
1 Select Dashboards > Global Settings > Applications.The Applications dashboard opens.
2 Click Download > OLAP Database.3 Click Download Exported OLAP Database.
The .app_olap file is downloaded and can be imported to Infor BI OLAP Server.
Importing custom reportsYou can import custom reports to your BI application.
To import custom reports:
1 Select Dashboards > Global Settings > Applications.The Applications dashboard opens.
2 Select the application to which you want to add the customized reports.3 Click Take Offline.4 Click Import Reports.
The Import Reports wizard is displayed.
5 Select the file with the customized reports with the .app_reports extension and click Next.6 To resolve any conflicts, select one of the options for the listed conflicts.
68 | Infor Business Intelligence Services
BI Application Manager

The .app_reports file may contain objects with the same names that are already present in theapplication. The Import wizard lists all the conflicts and you must select one of the available optionsto resolve those conflicts:
DescriptionOptionImports the reports with new name.Import with new name
Overwrites the existing reports with the newly imported ones.Overwrite
7 Click Import.8 Click Finish.
OLAPYou can use the OLAP widgets and the predefined OLAP dashboard to manage database nodes andusers and to manage settings for Infor BI OLAP Service.
DatabasesThe dashboard shows the list of available databases, cluster nodes, and connected users. Databaseswith offline applications are also shown. Databases are grouped by tenant. Tenants and databaseswithin tenant groups are sorted alphabetically. Tenant groups are collapsible.
Infor Business Intelligence Services | 69
BI Application Manager

70 | Infor Business Intelligence Services
BI Application Manager

BI Self-Service
With Infor BI Self-Service, you can browse and analyze multidimensional data using a pre-defined setof diagram templates or explore your data using the Ad-hoc analysis. You can use the web-based InforBI Self-Service application to create reports and dashboards.
The Infor BI Self-Service Home page offers links to ad-hoc analysis module, the chart guide, pre-definedchart templates, and favorites.
Creating content with Infor BI Self-Service templatesApplication Studio provides a package of templates from which you can create reports.
Single steps required to create reports vary depending on the template, but they all share some commonbasics: You can select a database and a database cube. In some of the templates, you can also selectelements from one or more dimensions. For example, to create a bar chart you specify which elementsform the category and measure axes. Some templates also provide options to specify the appearanceof the report.
All templates include an element picker. You can use this to filter values in other reports. For example,on a dashboard, place a chart displaying sales by region, and the element picker. Configure the elementpicker to display elements from a Region dimension. Selecting different regions in the element pickerchanges the data displayed in the chart. This communication between the chart widget and the elementpicker is handled automatically but can be configured.
Each report created from a template has a settings icon to display report options. Options vary dependingon the report. They include, for example, options to change report filters. Tabular reports, in which onedimension forms the rows and another forms the columns, also have options on the column dimension.These include selecting which elements form the columns, and suppressing zero values.
To create a report:
1 In your content connection, browse to the BI Self-Service Home page.2 If you do not know what visualization works best for your data, select the Explore Your Data option.3 If you know what diagram to use to visualize your data, select the Pick Your Chart option.
Infor Business Intelligence Services | 71
BI Self-Service

Picking your chartIf you already know what type of visualization you need, you can select a template chart to create areport based on pre-defined diagrams.
These are the available groups of diagrams that you can choose from:
• Column Charts• Bar Charts• Line Charts• Pie and Donut Charts• Actual-Budget Comparisons• Portfolio• Other Charts
To analyze your data using a selected chart:
1 Select Dashboards > Home.2 And select a chart from the Pick your chart widget.3 Specify the data source:
DatabaseSpecifies the database alias.
ModelSpecifies the data model.
4 Define filters and axes.a For each hierarchy, you can filter or select elements.b To define access, drag and drop a selected hierarchy on the row or column axes.
You can also select if to suppress zero or empty values using the options icon. You can switchthe axes, remove the hierarchies and select the attributes that you want to display.
5 Browse your dataYou can adjust the rows and column, switch the axes, add tuple values, and select the filters andattributes that you want to display.
6 In the Widget Options you can specify the title and description of your widget.
Note: The default title and description is generated and updated automatically, but if you specifythe title or description they will not be updated automatically.
7 Click Next.The selected diagram is displayed.
72 | Infor Business Intelligence Services
BI Self-Service

Exploring your dataYou can explore your data using an Ad-hoc analysis. You need to specify which dimensions, hierarchies,and elements will form the view of the data. While the data source selection shows only which dimensionor hierarchy will be used as filter and which will be on the axes, the Ad-hoc analysis shows actualvalues and thus allows slicing, dicing, and exploring the data.
The Ad-hoc analysis offers basic statistical functions, such as sum, minimum, maximum, average,absolute, and relative dispersion of range on rows and columns.
To explore your data using the Ad-hoc analysis:
1 Select Dashboards > Home.2 Click on the Explore Your Data widget.3 Specify the data source:
DatabaseSpecifies the database alias.
ModelSpecifies the data model.
4 Define filters and axes.a For each hierarchy, you can filter or select elements.b To define access, drag and drop a selected hierarchy on the row or column axes.
You can also select if to suppress zero or empty values using the options icon. You can switchthe axes, remove the hierarchies and select the attributes that you want to display.
5 Browse your dataYou can adjust the rows and column, switch the axes, add tuple values, and select the filters andattributes that you want to display.
6 In the Widget Options you can specify the title and description of your widget.
Note: The default title and description is generated and updated automatically, but if you specifythe title or description they will not be updated automatically.
7 Click Next.The selected diagram is displayed.
Using the Chart GuideTo select the chart to visualize your data, use the Chart Guide on the Infor . The Chart Guide helpsyou decide which chart to use for your data analysis.
Follow the chart guide to review existing categories and select a chart that suits your needs.
Infor Business Intelligence Services | 73
BI Self-Service

Adding a chart to favoritesAfter you create a chart the suits your needs, you can add this chart to favorites.
1 Select Options icon > Add to Favorites.2 To manage your favorites, open the Infor BI Self-Service homepage and click Manage All. You can
view, edit, or delete the views from your favorites.3 Click Close.
74 | Infor Business Intelligence Services
BI Self-Service

Glossary
.datIs an export package file that contains an entire Repository, that is user management, permissionmanagements, and report catalogs that are packaged independently from the database system.
aliasIn Application Studio and Office Plus, databases are accessed through aliases. If the database orserver name changes, the reports continue to work. You use aliases to get data from different databasesfor use in reports.Different alias types access different database types.
Application composerIs a stand-alone tool which builds the final application from individual content sub-packages createdby individual applications, for example, Repository, Application Studio, Dashboards. This tool is a wizardthat gathers the required information for the application package descriptor.
application keyIs a software key for Application Composer that certifies the content of your component. The applicationkey computes and encrypts the digital signature of the package content. You can access the providerand application information, import, or remove the application key.
Infor Business Intelligence Services | 75
Glossary

applicationIs a business application that contains various application components, configuration information, andmetadata. Infor content teams or Infor partners apply business logic to general business cases anddevelop business applications. Use the Application Composer wizard to create a self-containedapplication that is imported to a BI platform or to upgrade an existing application in the BI platform.
application processes packageContains the definitions of application processes for App Engine service.
application componentConsists of content from a BI application, including reports, templates, style sheets and databasealiases. The application usually includes name and description of the content, but can contain informationabout groups and roles for some components. You can upload various application components tocreate an application that you can deliver to a BI platform installation. Consists of a collection of reports,templates, style sheets and database aliases.
attributeAdd information to a database dimension. A dimension containing product details may include thenames of the product managers as an attribute. Or, if the product names and codes in the dimensionare not familiar to users or customers, ’friendly’ names might be used as attributes. Attributes arecreated in the OLAP database. Application Studio contains some intrinsic attributes. You cannot writeback values to intrinsic attributes. In Analysis Services, OLAP attributes are called element properties.
authenticationThe system of authentication defines how users connect to the database and to any aliases. The defaultsystems available for databases are Windows and Basic. You can register other systems in the repository(for example, LDAP). You may use the same method of authentication to connect to an alias as youuse to connect to the database, or use a different method.
76 | Infor Business Intelligence Services
Glossary

base elementThese are the elements at the lowest level of the dimension hierarchy. That is, these elements haveno children. In a cube, actual physical data is stored in cube cell addresses that are made up of onlybase elements. A cube cell that contains one or more consolidated or rules elements in its cell address,is a calculated cell and cannot store an item of data. The values of these cells are calculated from datain base cells.
Best PracticesThe Best Practices sample database is supplied with Application Studio and Office Plus. It includesthe several cubes which contain sample sales and finance data and sample reports.
business intelligenceBusiness Intelligence refers to a broad set of technologies and applications that support organizations’decision making by enabling them to collect, analyze and distribute data. Often this data is in differentlocations and formats and is used for different purposes by the various departments within anorganization. Business Intelligence solutions consolidate data from different sources to help companiesmake better decisions about their businesses.
cacheMakes data retrieval faster and more efficient by storing frequently requested data locally instead ofon the database server. You can specify whether values and attributes are cached and how often acache is updated. If a number of concurrent users are writing-back data to the database, it may benecessary to update a cache more frequently in order to maintain data consistency. This may outweighthe benefits of caching. If so, caching can be turned off.
captionEach element of a dimension has a unique name (generated by the OLAP server), an element nameand a caption. The element name is the “friendly name” of the element. For example, in the sampledatabase supplied with Infor BI Office Plus, Europe is an element name in the Region dimension. Itsunique name is [Region].[All Regions].[Europe]. The caption is the localized element name. If Caption
Infor Business Intelligence Services | 77
Glossary

is selected as the display format, but the element name has not been translated, the element name isdisplayed. Whether element names are unique depends on the database provider. Elements namesare unique in OLAP. But captions are not unique. For example, the caption January exists for everyyear in the Time dimension.
cell graphicGraphics can be stored in the repository. You reference them in reports by using a user-defined formatinstruction with this syntax: [Graphic graphic_name] . The graphic is displayed if the cell containsa value. Key Performance Indicator (KPI) formulas provide a convenient method of using graphics inthis way.
cell referenceIn the worksheet, each cell is referenced by column letter and row number (for example, A1). They caninstead be referenced by row number and column number (for example, R1C1).
check in and check outEnsure that only one user can change the definition of a report at any time. Whilst a report is checkedout to you, other users can see it but not make any changes to it. The report is shown in their view ofthe Report Catalog but is highlighted with a white cross. When you check it in, it can be opened byother users. If another user opens the report it becomes checked out to them. Users can also checkout reports by right-clicking them in the Report Catalog and selecting Check-in/out >Check-out. Whenyou create a report it is checked out to you. It is not visible to other users until you check it in. VersionHistory keeps a record of which users have checked objects in and out and of any amendments made.
client listThe dimension elements of a multidimensional database are held in lists. For client lists, completedimensions are cached on the client and the lists are extracted from the cache. For server lists, queriesare sent to the server to retrieve the lists.
78 | Infor Business Intelligence Services
Glossary

combo boxA combo box is one of three types of list object in Application Studio (the others are list boxes andoption buttons). They are called list objects because they must be associated with a list and theircontents can be configured in the List Designer. A combo box displays the first element of a list andhas a button for accessing further elements. They act as slicers in Application Studio, allowing usersto select a different slice of the data.
conditional formattingFormats data according to whether it meets a condition (or where the product of a formula in other cellsmeets a specified condition). Several different conditions can be set for a single cell. The first truecondition is applied.Whether a cell is editable can also be made conditional.Conditions can be valuesor the products of formulas. You can use a mix of value and formula conditions in a single cell.
content developerIs an Infor or Infor partner content developer who creates business applications.
cubesA multidimensional database is stored in a cube. As in a spreadsheet, data is held in cells and can beretrieved by formulas. Unlike spreadsheets, cubes are multidimensional – they are collections ofdimensions. For example, a three-dimensional cube might contain Region, Account and Month as itsdimensions. To this could be added Products, for example, as a fourth dimension. Each cell in a cubeis unique and can be referenced with formula called a cube reference. For example: =[Europe ,Units, January, Product1]
custom hierarchiesAdd features without using scripting or additional ’helper’ databases. For example, you could create acustom hierarchy containing different units of measure, or different number formats, from which userscould select. The OLAP Metadata hierarchy is a custom hierarchy which contains details of the databasealiases to which you are connected.
Infor Business Intelligence Services | 79
Glossary

custom listA list created on a custom hierarchy. Custom lists can be multilingual string lists or metadata lists.
dashboardDisplays content, arranged to provide an 'at a glance' overview of key data. The content has links tofurther, detailed, content. A dashboard is analogous to the dashboard or instrument panel in a motorvehicle. Often, dashboard content consists of single charts. In Infor Motion Dashboards and Infor BIDashboards, the dashboard content can include Web content as well as reports. The content is displayedin widgets. Widgets can communicate and the selections users make in one widget automaticallyupdate the content of other widgets.
data areaA section of the List Designer which is enabled when you sort or filter data and select Value as the sortor filter type. In the Data Area you define the slice of data you want to filter or sort.
database independent reportingReports can be independent of any specific data source. This is achieved by using variables to holdreport parameters.
DataLink listA DataLink is a pre-defined, or custom designed, interpretive layer that links a client application suchas Application Studio with the underlying transactional layer of a database. It contains the businesslogic, localization and security to provide a single, consistent, view of the data to all users. A DataLinkis one of several possible data sources that can be used by Application Studio. A DataLink list is a listcreated in Application Studio from elements held in the source database. You connect to a datalinkthrough a database alias.
80 | Infor Business Intelligence Services
Glossary

design, view, and debug modesYou define reports in Design Mode, test them in Debug Mode and display them in View Mode.Debug Mode has characteristics of Design Mode and View Mode and can be a useful debugging tool.Debug Mode lays out the data as it will appear in View Mode but also displays the contents of formulas.Also it displays only a preview of the full data. This allows report designers to test reports without loadingall the data.
dimensionDimensions, with cubes and elements, are a fundamental building block of a multidimensional database.A multidimensional database contains cubes which contain dimensions. A dimension is a group ofsimilar items or a list of related elements. For example, a Region dimension may contain the namesof various countries as its elements. Dimensions do not contain values but organise the elements theycontain.
drill-downReports which display all their data at once may not be convenient to use. With drill-down you candisplay an overview of the data but give users the ability to reveal further layers of data as required.For example, one user may be interested in seeing sales of a particular product group or individualproduct in all years. Another may be interested in seeing sales of all products in a particular quarter ormonth. Each user can drill-down through the products or years to see only the data they require. Youdrill-down by expanding and collapsing the tree structures of the lists containing the data.
dynamic reportA dynamic report lets users select different views of the available data without having to edit anyformulas or functions. It contrasts with a static report which may, for example, use a formula to returnthe total actual sales of a product for the year 2004. To display the sales for 2005, or to see the budgetedrather than actual sales, you would have to edit the formula, or add further cells and formulas to thereport. In Application Studio, hyperblocks, list objects and variables are used to make reports dynamic.Variables can be used throughout Application Studio. Report templates use only variables. The sametemplate can be used with different data sources.
Infor Business Intelligence Services | 81
Glossary

elementsElements are the values in a multidimensional database. Elements are one of the three fundamentalbuilding blocks of a multidimensional database. The others are dimensions and cubes. Similar or relatedelements are grouped into dimensions which are grouped to form a cube. In a Time dimension, forexample, the years 2005, 2006 and 2007 would all be elements, as would 1st Quarter, 2nd Quarter,3rd Quarter, 4th Quarter and each of the individual months. These are all consolidated elementsbecause they comprise elements at a lower level in the hierarchy. An element at the lowest level ofthe hierarchy is a base element.
filterFilters are used to specify whether particular data is displayed in a report. A common use of a filter isto exclude zero values. You can filter data whose caption, unique name, attribute or value meets criteriayou set. You can also create a filter with an MDX statement.
flagFlags are part of the Descendants function. This is in the Structure Selection section of the List Designer.It lets you choose a specific level of a list as the Parent and return its descendants. You can also choosethe level at which the descendants are displayed. Different flags are available to provide further flexibility.For example, the Self and After flag returns the descendants of the selected level and of the levelsbelow it.
formattingCell formatting lets you change the appearance of cells and their contents. You can also specify whethera cell is writable or read-only. If you use a lot of non-default formats in your reports, it may be usefulto create styles for each.
formulasCan be entered directly into cells, selected in the Insert Function dialog or you can use the Edit OLAPFormula dialog. The Edit OLAP Formula dialog offers three key types of formula. These are Cell Valueformulas, Attribute formulas and KPI (Key Performance Indicator) formulas. The Edit OLAP Formula
82 | Infor Business Intelligence Services
Glossary

dialog creates the default formulas for the three types. These are ROC, ROA and ROK formulasrespectively. An ROC formula returns a numeric or text value from an OLAP data cube. An ROA formulareturns an attribute from the attribute table of a dimension.An ROK formula returns a result accordingto which KPI and KPI type is selected. The result can be displayed graphically or as a value. ROC andROA formulas are read only. But, by changing ROC formulas to RWC ,or ROA formulas to RWA thevalues they return can be written back to the database. ROC and ROA formulas are read only. But, bychanging ROC formulas to RWC ,or ROA formulas to RWA the values they return can be written backto the database. Other formulas are used to act in various ways on cell values or attributes.
functionIn Application Studio and Office Plus the Insert Function dialog lists and categorizes all the functionsthat can be used. Most of these are common to a variety of software applications. Most work the sameway in Application Studio and Office Plus as they do in other applications. Also, Application Studioincludes some special functions. These are listed, and categorized as ’Special” ’functions in the InsertFunction dialog.
global listLists, whether they are server lists or client lists, can be local or global. A local list is available only ina single report. Global lists are available to all users. So, changing the definition of a global list canaffect the reports of other users.
hierarchyMultidimensional databases are particularly suited to data that has a hierarchical structure. That is,data that can be ranked according to, for example, importance, size, age etc. Common analogies forhierarchical structures are tree structures or parent-child relationships. In Application Studio and OfficePlus, data is referred to as parent, child or sibling data. Time is a good example of hierarchical data;ranked as Year, Quarter, Month, Week, Day. Year, Quarter, Month and Week are all parents of at leastone other element. Quarter, Month, Week and Day are all children of at least one other element. Parentsare usually aggregates of their children. Elements at the same level of the hierarchy are siblings ofeach other. An element with no children is a base element. Parents are referred to as consolidatedelements.
Infor Business Intelligence Services | 83
Glossary

historyThe Version History feature saves changes to reports and folders in the Repository. You can retrieveearlier versions of reports and determine who created each version. When you first start ApplicationStudio, you are prompted to enable the version history feature.
hyperblockOne of several objects used to display the contents of a list in a report. It has a key output cell and avalue cell. The key output cell contains the reference to the list. Typically, you put a formula in the valuecell to retrieve a slice of data. Unlike other list objects (for example, a combo box) a hyperblock existsonly in Design Mode. In View Mode, only its output is visible. In View Mode the value cell is copiedonce for every element of the list. If the value cell contains a formula, a value is calculated and displayedfor each element of the list. Hyperblocks can display lists horizontally or vertically. Often, two hyperblocks(one horizontal and one vertical) are nested with their value cells overlapping, and a formula placed inthe value cell. In View Mode, the lists form the X and Y axes of the report and the formulas generatethe report data.
intrinsic attributesIn addition to attributes that you create in the OLAP database, Application Studio includes a numberof intrinsic attributes that can be used in reports. These include Element Name, Description and LevelNumber. It is not possible to write back values to the intrinsic attributes.
jumpsIn Application Studio, one of several types of action that can be configured in a cell or list object. Jumpsare often used to navigate between reports. They can also be used within the report in which they arecreated. In this case they can be used to populate variables or pass a value to a list object. Jumps canbe made conditional, so that they only occur if a particular condition is met, or so that they have differenteffects depending on which of several conditions applies.
84 | Infor Business Intelligence Services
Glossary

key performance indicator (kpi)Measures of an organization’s performance in achieving quantifiable objectives. Examples are NetProfit, Production Costs and Cost of Sales. They can be displayed in reports either graphically or asvalues, using KPI formulas. Different graphics are used to highlight data that falls within certainranges.Every cube, by default, includes a Measures dimension. Elements of the dimension can beused as KPIs.
levelHierarchies can have different numbers of levels. For example, a Product hierarchy containing, AllProducts, Product Groups, Product Sub-groups and Products is a four-level hierarchy. A Time hierarchycontaining Year, Quarter, Month, Week and Day is a five-level hierarchy. In the list designer you canspecify that only list elements at a particular level of the hierarchy are displayed (for example, onlyproduct sub-groups). In the List Designer you can specify the level by its name. Levels also havenumerical identities. The parent or root level of a hierarchy is at Level 1 and the levels and sub-levelsare Level 2, Level 3 etc. In the Client List Designer, level-based selection uses level numbers insteadof name. By using the GETLEVEL function with conditional formatting, you can specify a level by itsnumber and give it a different format from the other levels.
list designerYou create reports by displaying the contents of lists and manipulating them with formulas. Often, youdo not want to display the entire contents of a list in a report. The List Designer lets you specify whichelements to display. In the List Designer for server lists you use structure selection, filters, sorting,attributes and a series of advanced features.There is a separate list designer for client lists. This hasa different layout from the server list designer but provides essentially the same functionality.
list objectObjects in reports which display the contents of lists and from which users can select. List objects arecombo boxes, list boxes, and option buttons. These list objects can also pass and accept variablesand be configured to trigger actions when a selection is made. Hyperblocks are also list objects but,unlike the others, are not displayed in reports. Instead, only their contents are displayed.A list of theobjects used in a report is displayed in the Accessories pane of the Repository Explorer, in the ReportObjects folder.
Infor Business Intelligence Services | 85
Glossary

listsThe dimensions and elements of a multidimensional database are held in lists. A list represents a listof element names in a database. You can filter or sort them as required. You can use lists in a report,for example, in hyperblocks or combo boxes/list views. When a repository is created, a list isautomatically generated for each dimension. A list is a subset of the dimension, defined by variousrules and criteria. There are different types of list and the type is determined by the database aliasbeing used (for example, relational lists are used with relational databases). These two fundamentaldifferences distinguish different types of list.
• The first is where the rules which define the list are calculated. For server and relational (SQL) lists,the calculation is done on the server. For client lists and custom lists, it is done on the client.
• The second fundamental difference is whether the list is global or local. Changes to a global listaffect all reports and objects that reference it. Changes to local lists only affect the objects in thereport in which the list is used. Both global and local lists can be client or server based.
list viewList objects (combo boxes, list boxes and option buttons) display the contents of lists. As each objectis placed in a report it is named, by default, Listview[n], where n is a sequential number. Variousproperties of list objects can be returned with formulas (for example, =ListView[n].ElementCountreturns the number of elements in the list). You can change the default name and use it in the formulas.
local listsWhether they are server lists or client lists, lists can be local or global. A local list is available only in asingle report. Global lists are available to all users. So, a change to the definition of a list can affect thereports of other users.
MDXA query language for reporting on multidimensional data sources. It is, essentially, the OLAP equivalentof SQL for relational databases. Custom MDX can be used, for example, for structuring, sorting andfiltering server lists in the List Designer or for creating calculated list elements.
86 | Infor Business Intelligence Services
Glossary

multidimensional databasesMultidimensional databases, such as OLAP, present data hierarchically by using cubes, dimensionsand elements. A cube is a collection of dimensions which contain a number of elements. You mayhave, for example, a Sales cube containing a Product dimension containing individual product elements;a Time dimension containing years as its elements, and a Region dimension containing countries.These hierarchical structures are difficult to represent efficiently in SQL. Multidimensional databasesare particularly useful where the data has a Time dimension and so are often used in planningapplications.
multilingual stringYou can save strings in the Table of Names and Texts, with translations in different languages. TheTRANSLATESTRING function displays the translated string when the report is viewed in anotherlanguage.
named setsNamed Sets are customised lists which can be used in place of, or with, the levels in a dimension. Forexample a Region dimension might contain the regions Asia, Europe, Middle East, Americas, NorthAmerica, South America, Australia/Pacific and Africa, but not the EMEA region (Europe, Middle Eastand Africa). A named set could be used for the EMEA region.Named sets are created in the OLAP database where they are referred to as Subsets.
null and zero valuesThere are four types of data that can be saved in a cube: null values, zero values, non-zero values andstrings. A cell that has a null value is empty. A cell with a zero value contains the figure 0. This issignificant because zero can be used in calculations but null cannot. In no circumstances are null valuesand zero values the same thing. A common feature of multidimensional databases is that they can be“hypersparse”. That is, no values exist for many combinations of elements. This may happen, forexample, because a product is introduced or discontinued part-way through a year. Both null and zerovalues in reports can be suppressed by using filters.
Infor Business Intelligence Services | 87
Glossary

OlapOn Line Analytical Processing. Olap tools are designed to allow fast and efficient analysis of data heldin a database. Olap tools have been developed for most database models.
OLAP ServerOLAP is a real-time, multidimensional Olap database which is used, typically, in corporate performancemanagement and business intelligence solutions. The multidimensional data model is particularly suitedto data with a hierarchical structure.
OLAP metadata hierarchyA default, custom hierarchy that lets you access, in a single report, all the database aliases you arelogged on to and their cubes, dimensions and elements. It is displayed in the Custom Hierarchies nodeof the Accessories pane in the Repository Explorer and can be used in reports in the same way asother hierarchies and lists.
permissionsUsers and groups can be given different access permissions to administrative functions in the Repositoryand to reports. These permissions are granted through membership of a role and include restrictionsfor designing reports, viewing reports, creating projects and report catalogs, creating and deletingusers, etc.
point of view (pov)A POV can contain up to 10 POV objects which appear, in a uniform layout at the top of each reportin the POV group. POV objects are combo boxes which, like combo boxes in reports, act as slicers –enabling users to select a different view of the data.The POV editor allows report designers to customizethe layout and appearance of the POV view.
88 | Infor Business Intelligence Services
Glossary

projectYou use projects to save groups of reports on specific topics. Each project can have its own userpermissions and administration rights. Projects and report catalogs are created and administered inthe Repository. The Repository is administered through registrations. Each registration of a Repositoryobject contains database connection information for the Repository, which includes database name,type, location and type of authentication. Each registration contains a Projects folder which can containa number of report catalogs.
ragged hierarchyIn hierarchies, child elements are at a lower level than their parents. In a non-ragged hierarchy, thelevel of a child element is immediately below that of its parent. In a ragged hierarchy, at least one parentelement has children which are at two or more levels below it.
registrationEach data source in the repository Repository has a separate registration. Each registration containsdetails of the database and its connection string, and the authentication system used to connect.
relational reportingReporting from a relational database. You can combine data from multidimensional and relational datasources in one report.
relational listA list built from a relational data source. These can be used in reports together with multidimensionallists.
Infor Business Intelligence Services | 89
Glossary

report catalogA report catalog is a component of the Repository which holds data about the structure of reports withina project. Typically, a report catalog contains a set of related reports. For example, the Best PracticesTemplates database supplied with Application Studio contains the Best Practices Templates project.This contains the Best Practices Templates report catalog which is a series of sample reports basedon the Best Practices Templates database alias. The Report Catalog is also a pane in the RepositoryExplorer. It lists the report catalog, database aliases and reports you have access to.
report templatesEnable users to create more complex reports than they might be able to on their own (or have time tocreate). A report template specifies the data structure of a report rather than its visual appearance -but can be used with style sheets. Report templates are not based on a single data source. They usevariables throughout. The variables are presented in the Report Wizard as report parameters for whichusers supply values.
report wizardUsed to create reports from report templates. Report templates use variables. These variables aredisplayed in the Report Wizard as report parameters. Different users, using different data sources, canuse the same template to create reports.
repositoryThe repository is a store for objects that the various Infor BI products have in common. A repository isstored in a relational database. The database can be SQL Server or Oracle and can store more thanone repository. Essentially a repository contains users, groups, roles, projects and report catalogs.Users and groups can each be elements of several different roles. Users and groups gain variousaccess permissions to the projects and report catalogs through their membership of roles. In a repository,permissions are set at these levels: Repository, User Management, Projects, Report catalogs. Whenyou create reports you create them within a report catalog which is within a project. The project is withina repository. A repository does not contain the database(s) on which you report. Each report catalogis a repository containing a reference to the database. As well as this information about the data source,the report catalog contains users and permissions and information about reports. The repository installedwith Infor BI is called Best Practices Templates and contains several projects and report catalogs.
90 | Infor Business Intelligence Services
Glossary

sealed applicationAn application that has been created with an application key. You can seal an application to ensurethat the application is not altered by unauthorized persons.
server listThe dimension elements of a multidimensional database are defined by lists. For server lists, queriesare sent to the server to get the lists. For client lists, complete dimensions are cached on the client,and the lists are extracted from the cache.
siblingElements that are at the same hierarchy level and which are children of the same parent, are siblings.
sortingThe order in which the data is displayed in lists can be sorted alphabetically or numerically in ascendingor descending order. Data can also be sorted with variables or custom MDX statements. If you sortdata by values, you must define the area of data to which to apply the sort.
slicingIn many reports, one dimension forms the rows, another forms the columns, and one or more of theremaining dimensions are used as slice dimensions. For example, in a report on product sales byregion, the region dimension might form the rows and the product dimension the columns. If SalesChannel were the slice dimension, users could select different slices of the data to view by selectingdifferent sales channels. In some reports, users can specify which dimensions form the columns androws and which are used as slicers.
Infor Business Intelligence Services | 91
Glossary

splashingSplashing refers to the distribution of values in a report according to a variety of rules. The Splasheris enabled in a report when a cell allows data to be written back to the database. Because data is onlystored in base elements, you cannot write back data to consolidated elements. But, with the Splasheryou can specify how values written back to base elements affect the consolidated elements they form.The Splasher enables you to select cells and change their values in the database. You might, forexample, create a forecast for a year by increasing the values in a previous year by a particularpercentage.
splitterIf you need to scroll to view all data of a report, you may not see column and row headings. A splitteris a horizontal or vertical line that freezes the position of the cells above it or to the left. By placingsplitters to the right of the row headings and below the column headings, you can see the headingswhile scrolling. In Application Studio you can insert three horizontal and three vertical splitters in onereport.
string hierarchyA string hierarchy is a custom hierarchy, the elements of which are multilingual strings.
structure selectionStructure selection is one of the panes of the List Designer. With it, you specify which list elements aredisplayed in a report. You can select list elements at different levels of a list hierarchy. Structure selectioncan also be used with the other options of the List Designer. These are filtering, attributes and advancedfunctions.
stylesSpecify the report layout. You can apply consistent formatting to components of reports (for example,a consistent heading style).
92 | Infor Business Intelligence Services
Glossary

style sheetsSpecify the layout of the reports that are based on them. They contain formatting instructions for fonts,colors, etc. If you change the style sheet, the formatting of the reports based on it is changed.
unique nameEach element of a dimension has a unique name generated when the dimension is created by theOLAP server. The unique name uniquely identifies an individual value in a multidimensional database.Its format is [Dimension name].[Level 1].[Level 2].[Level n] (for example,[Region].[All Regions].[Europe]). It contrasts with the Caption, or ’friendly name’ of anelement. Generally, captions are more convenient to use than unique name and are used in reportsby default. However, functions operate on unique names, not captions.
variableUsed to represent types of data (numbers, characters or character strings) instead of specific items.When a report is calculated or refreshed, or an action is triggered in it, variables can be filled with actualdata of the specified type. Variables can be used to pass values from one list object to another andcan be used in formulas and actions. Variables can be global or local. A global variable is available toall concurrent users of Application Studio. So changing its value can affect the reports of multiple users.Report variables are available only in a single report.
visible areaYou can hide parts of a report from users by creating a visible area. This is useful, for example, forhiding the tables that produce a graph and displaying only the graph.
WebView widgetAllows you to display content from a Web location in a dashboard. You add WebView widgets fromToolbox in the toolbar.
Infor Business Intelligence Services | 93
Glossary

widgetA container in which a report or Web content is displayed on a dashboard. Widgets can be resized andrepositioned. Communication between widgets means that a selection made in one widget can affectthe display of data in other widgets.
widget communicationWidget parameters are used to establish connections between widgets. For example, if two or morewidgets have both Location and Month parameters, there are two possible parameter connections.Some or all widgets can be part of one or both content connections. For example, the widgets can belinked by location, this means that the Location parameter of each widget is part of the Locationparameter connection.
write backBy default, the values in reports cannot be changed by users. But cells can be made writable. You mayneed to offer users blank cells into which they can insert values, or you may need to make existingvalues editable. The former uses a WBC (Write Back Cell) and the latter a RWC (Read Write Cell)formula.
xml variableA variable defined by the SETPROPERTY function and stored as XML. SETPROPERTY defines a key(for example, a dimension name), properties and values. Each property can have a value. To see theXML definition of a variable, select the variable in the Accessories pane and click the adjacent button.
94 | Infor Business Intelligence Services
Glossary

Index
Aaccessing 18, 44
content 18content connections 44new content 18
accessing content 44add 63, 66
application 63language 66strings 66translation 66
adding 18, 38content 18reports 38WebView 38
adding content 19adding to 74
favorites 74administer 62, 65
global settings 62language settings 65
administration 55–56dashboards 55overview 55
administration widgets 56align 42
content 42widgets 42
aligning 42content 42widgets 42
application 48application component 48application permissions 59application roles 58
assignments 58assign groups 58assign users 58authentication 63
providers 63auto-hide 43
toolbar 43auto-refresh 43
dashboard 43auto-sizing 17
dashboards 17automatic 51
log-on 51sign in 51
average 27distinct 27
Bbackground 50
color 50basic group 58
assignments 58basic user 57BI Services 67
application 67
Cchanging 34, 42
name 34parameter connection 34password 42unique name 34
code 27collapsing direction 23concurrent editing 41connection 32content connection 19
adding content 19content connections 44content language 44copy 24
widget 24copy widget 24copying dashboards 39
save a copy 39count 27
distinct 27create 33, 35, 50–51
connections 33dashboard link 50–51parameter 35
create application roles 58create basic group 58create basic user 57create dashboard 38create dashboards 56create repository roles 61creating 33, 38, 45, 71
connections 33content connections 45dashboards 38folders 38parameter connections 33reports 71subfolders 38
customize 67application 67
customized 67reports 67
Infor Business Intelligence Services | 95

Ddashboard 39, 41, 44, 48–50
auto-size 49background 50color 50description 48language 44layout 49name 48permission management 41save a copy 39save as 39size 49title bar 49–50unique name 48
dashboard actions 36dashboard browser 36dashboard folder 41
permission management 41dashboard link 50–51
sharing 50–51dashboard management 36dashboard name 39dashboard options 39dashboard properties 39, 48–50
general 48layout 49–50theme 50
dashboard settings 39dashboards 11
overview 11session 11
delete 63application 63
deleting 39dashboards 39folders 39
deploy 63application 63
description 27detail query 25download 68
application 68OLAP database 68OLAP db 68original application 68
drag 11drag & drop 20drag and drop 20dropping 16
a widget 16
Eedit 34, 58
application roles 58connections 34
edit (continued)name 34parameter connection 34unique name 34
edit application permissions 59edit mode 20edit repository permissions 61editing 24, 34, 47
a content connection 47connections 34content connections 47parameter connections 34widget 24
element picker 71enable 20
interaction mode 20expand 11, 17
horizontally 11, 17vertically 11, 17
export 52exporting 52
dashboards 52extraction 27
types 27extraction types 27
editing 27
Ffavorites 74fill 11, 17, 23
horizontally 17, 23vertically 17, 23
Ggeneral tab 48global settings 62–63group management 56
Hhelper lines 42hide 43
toolbar 43hotspot 11
Iimport 53, 68
customized report 68report 68
importing 53dashboards 53
independent 34charts 34widgets 34
96 | Infor Business Intelligence Services
Index

install 63application 63
install applications 63interaction mode 20
Jjump targets 23
Llanguage 44
list 44language settings 65–66languages 65–66last modified 48layout 11, 49–50
properties 49–50tab 49–50
layout concepts 11lock 16
dashboard 16log on 51
automatically 51
Mmanage 66
languages 66strings 66
manage applications 63managing permissions 41manual 50–51
dashboard link 50–51maximum 27minimum 17, 27
report size 17modify 59
permissions 59move 37, 48
dashboards 37, 48folders 37, 48
multiple instances 41
Nnew dashboards 38
Oopening 36, 44
content connections 44dashboards 36
option 43organize widgets 56overview 11
Pparameter 32–33
connection 32parameter connection 33–34
new 33parameters 23, 35password 57
rules 57pending operations 63period filters 30–31
specifying 31permission assignments 59permission management 41positioning 16
a widget 16content 16widgets 16
predefined 55dashboards 55
protected 48content 48dashboard 48
protected component 48protected content 48provider 63
settings 63push 11push and crush 11put online 63, 67–68
QQ&A 24–25, 30–31
query editor 25Query & Analysis 24–25, 30–31
Rrank 58register groups 57register users 57relational queries 24–25
creating 25remove content 31remove widgets 31removing 39
dashboards 39folders 39
removing content 31removing widgets 31renaming 39
dashboards 39folders 39
reorder 37dashboard browser 37
Infor Business Intelligence Services | 97
Index

reorganize 38folders 38
report 32parameters 32variables 32
report catalogs 44report jumps 35
setting 35report options 71report size 17report templates 71reports 32
linking 32repositoory 63repository permissions 61repository roles 61
SSave As 40Save Copy 40saving 40
dashboards 40saving dashboards 41scrolling 23
allow 23search dashboard 37searching 37
content 37dashboards 37reports 37
searching content 37segment 27select 43
auto-refresh 43sending 50–51
dashboard link 50–51set 43
start screen 43setting 32–34, 42–45, 47–50
color 50content connections 42, 44–45, 47dashboard color 50dashboard properties 48–50dashboard size 49language 42, 44layout 49–50parameter connection 33–34report parameters 32–33start screen 42–43
share 50–51dashboard link 50–51
sharing dashboards 50–51short description 27show 23, 49–50
title bar 49–50widget header 23
sign in 51automatically 51
sizing 17dashboards 17
snapping 42specify 23
collapsing direction 23specifying 44–45
content connections 45language 44
split 34parameter connection 34
splitting 34parameter connection 34
start screen 43strings 65sum 27
distinct 27summary query 25swap 11
Ttake offline 63, 67–68target report 35template widgets 71theme 50
tab 50tile 11toolbar 43
UUI language 44unlock 16
dashboard 16update 63, 66
application 63translations 66
update applications 63URL parameters 23, 35user groups 57user management 56
Vvendor 48
WWebView 19, 32
adding content 19parameters 19, 32
WebView parameters 23, 35widget 24, 32, 34
copy 24instances 34
98 | Infor Business Intelligence Services
Index

widget (continued)leading 32
widget communication 32, 34widget copy 24
editing 24
widget header 23widget parameters 23, 35widget properties 23windows users 57
Infor Business Intelligence Services | 99
Index

100 | Infor Business Intelligence Services
Index