infographic: manufacturing operations & qlik visual analytics
TRANSCRIPT
of manufacturers say [implementing]
analytics is their highest priority.2
42%
© 2015 QlikTech International AB. All rights reserved. Qlik®, Qlik Sense®, QlikView®, QlikTech®, Qlik® Cloud, Qlik® DataMarket, Qlik® Analytics Platform and the QlikTech logos are trademarks of QlikTech International AB which have been registered in multiple countries. Other marks and logos mentioned herein are trademarks or registered trademarks of their respective owners.
1 Renee Boucher Ferguson, “Data Analytics and the Information Transfer Gap”, MIT Sloan Management Review, September 21, 2012 http://sloanreview.mit.edu/article/data-analytics-and-the-information-transfer-gap/#.UF3DJ1E15f82 Louis Columbus, “10 Ways Analytics Are Accelerating Digital Manufacturing”, Forbes, September 6, 2015 http://www.forbes.com/sites/louiscolumbus/2015/09/06/10-ways-analytics-are-accelerating-digital-manufacturing/
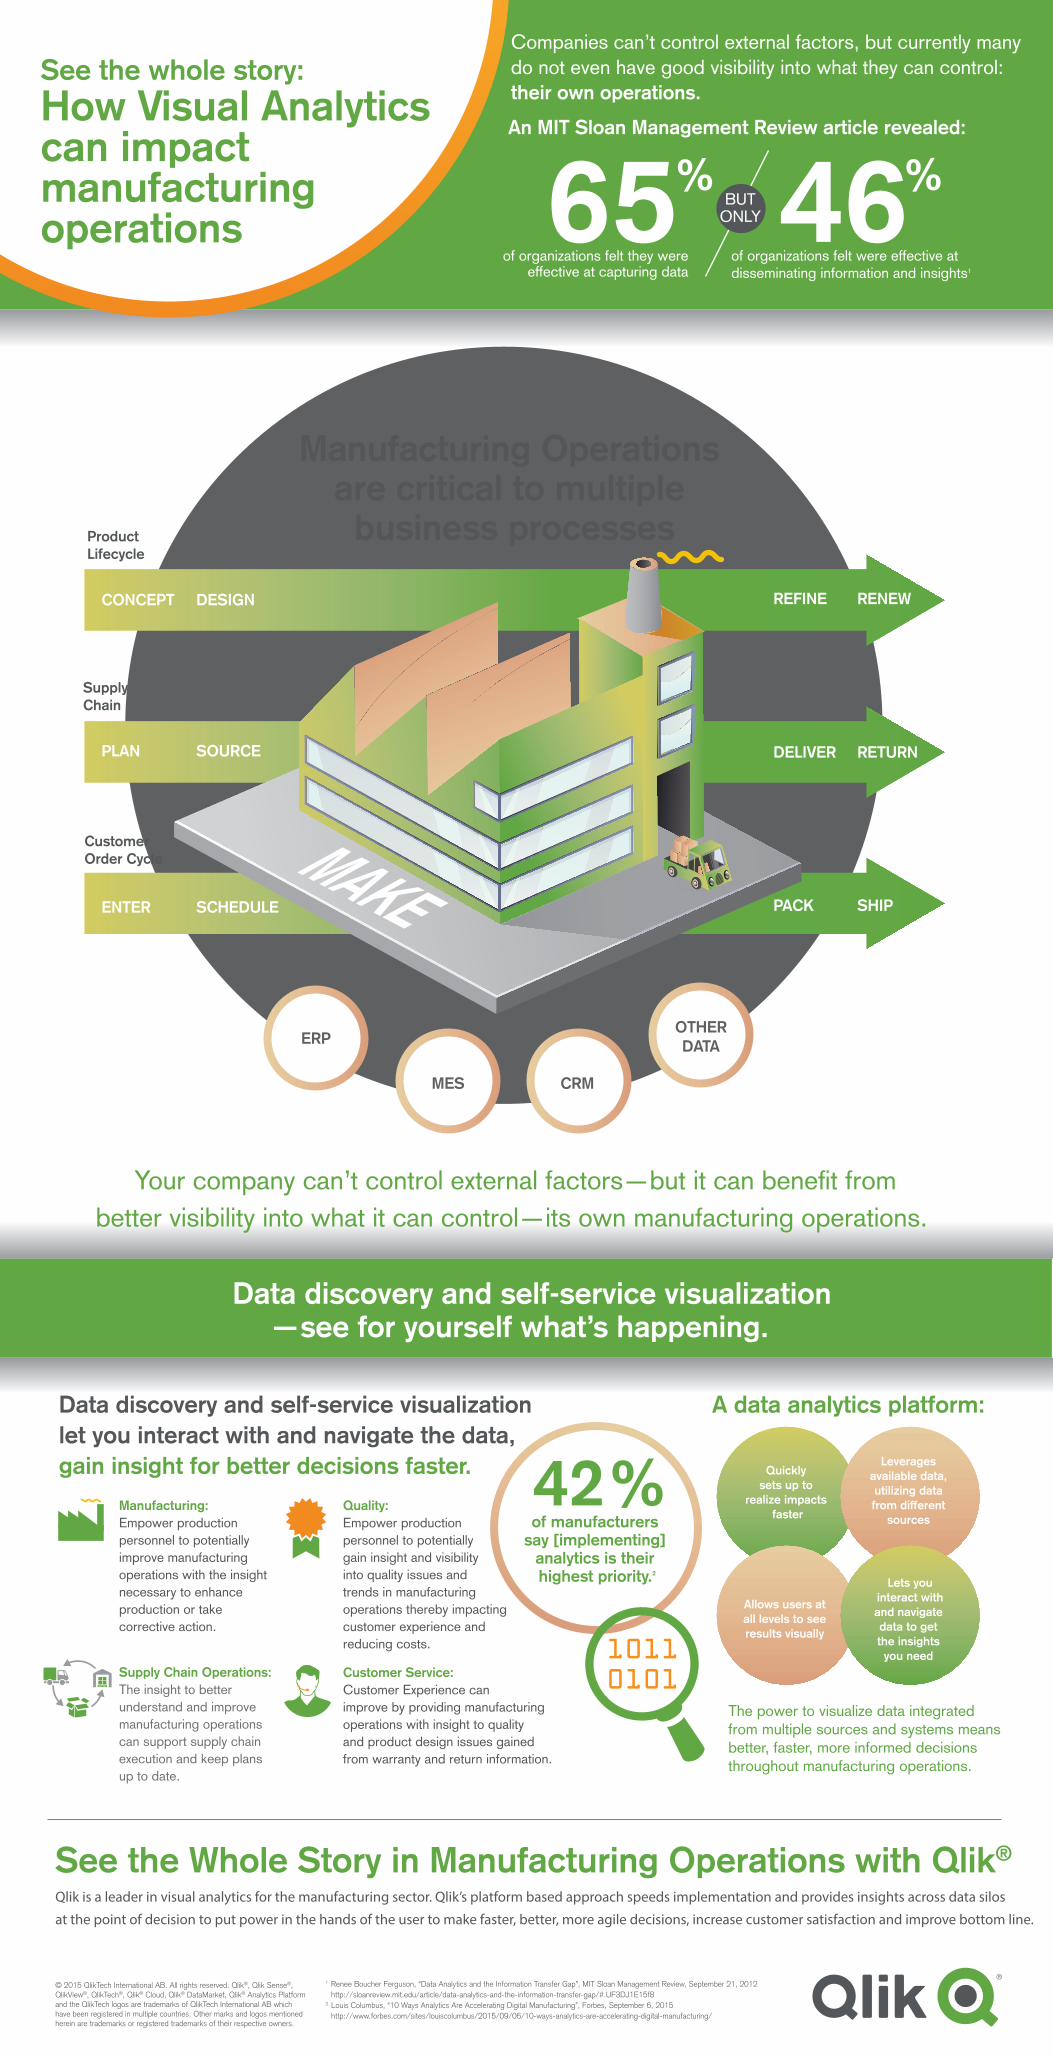
Manufacturing Operations are critical to multiple
business processes
Qlik is a leader in visual analytics for the manufacturing sector. Qlik’s platform based approach speeds implementation and provides insights across data silos
at the point of decision to put power in the hands of the user to make faster, better, more agile decisions, increase customer satisfaction and improve bottom line.
See the Whole Story in Manufacturing Operations with Qlik®
Your company can’t control external factors—but it can benefit from better visibility into what it can control—its own manufacturing operations.
Manufacturing: Empower production personnel to potentially improve manufacturing operations with the insight necessary to enhance production or take corrective action.
Quality: Empower production personnel to potentially gain insight and visibility into quality issues and trends in manufacturing operations thereby impacting customer experience and reducing costs.
Supply Chain Operations: The insight to better understand and improve manufacturing operations can support supply chain execution and keep plans up to date.
Customer Service: Customer Experience can improve by providing manufacturing operations with insight to quality and product design issues gained from warranty and return information.
Data discovery and self-service visualization let you interact with and navigate the data, gain insight for better decisions faster.
Data discovery and self-service visualization—see for yourself what’s happening.
A data analytics platform:
Quickly
sets up to realize impacts
faster
Allows users at all levels to see results visually
Lets you
interact withand navigate data to get the insights you need
Leverages available data, utilizing data from different
sources
The power to visualize data integrated from multiple sources and systems means better, faster, more informed decisions throughout manufacturing operations.
MES
ERPOTHERDATA
CRM
See the whole story: How Visual Analytics can impact manufacturing operations
An MIT Sloan Management Review article revealed:
Companies can’t control external factors, but currently many do not even have good visibility into what they can control: their own operations.
ProductLifecycle
Supply Chain
CustomerOrder Cycle
REFINE RENEW
65of organizations felt they were
effective at capturing data
% 46of organizations felt were effective at disseminating information and insights1
%BUT
ONLY
CONCEPT DESIGN
MAKE
DELIVER RETURN
PACK SHIP
PLAN SOURCE
ENTER SCHEDULE