infographic: canadians lowball how much they drink
DESCRIPTION
CARBC Tele Alcohol Infographic.TRANSCRIPT
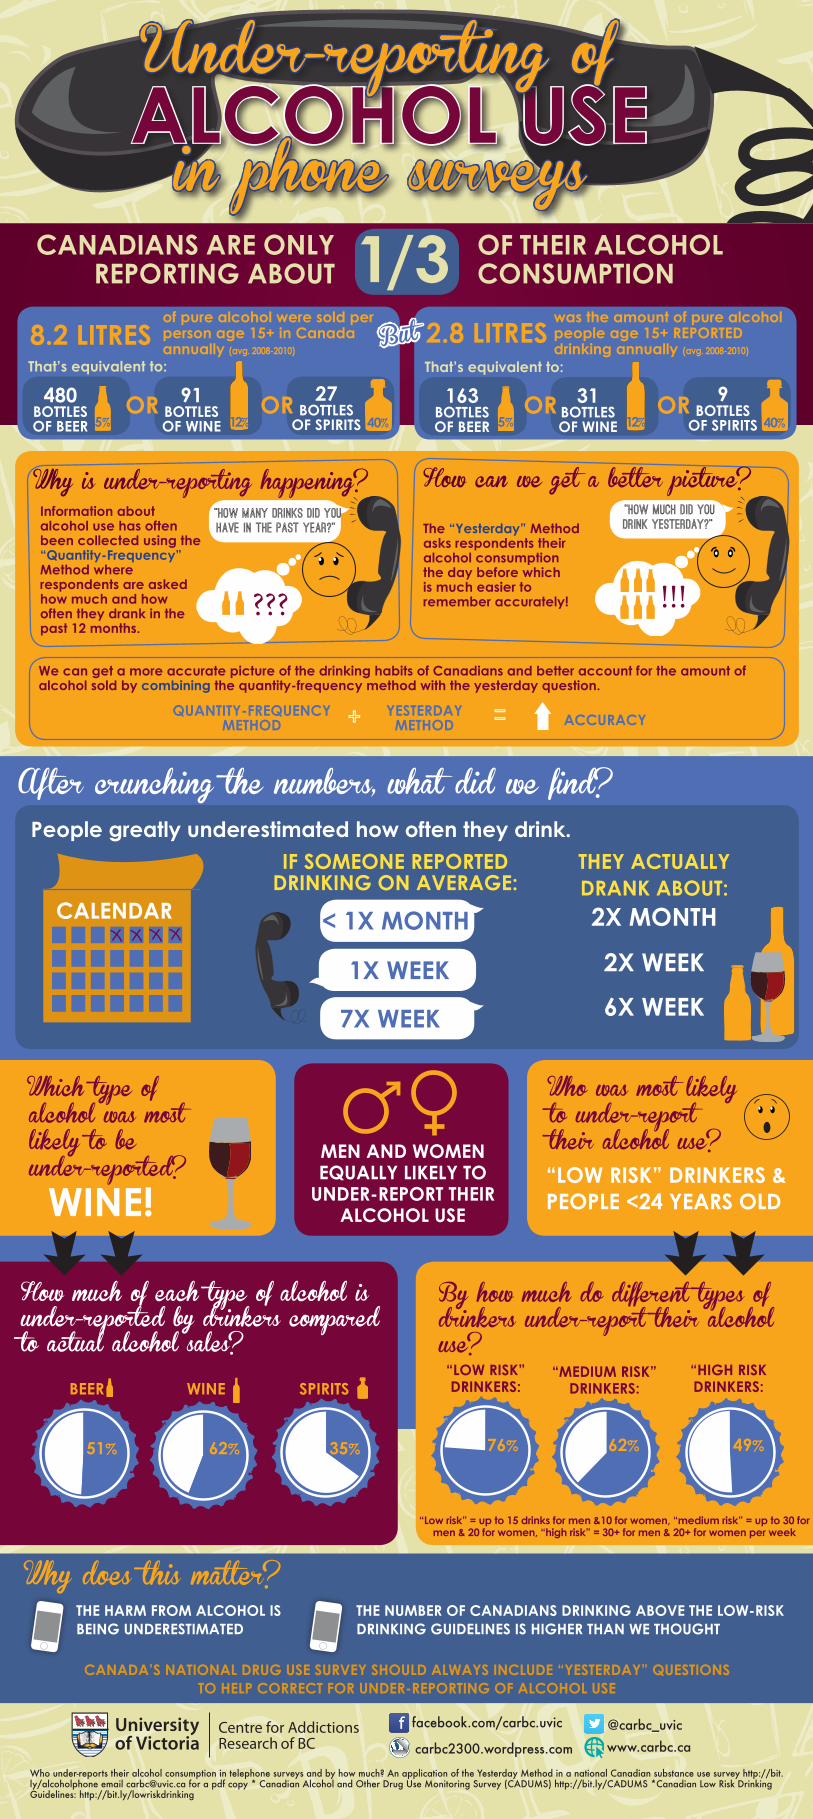
Information about alcohol use has often been collected using the “Quantity-Frequency” Method where respondents are asked how much and how often they drank in the past 12 months.
The “Yesterday” Method asks respondents their alcohol consumption the day before which is much easier to remember accurately!
“how many drinks did you
have in the past year?”
After crunching the numbers, what did we find?
We can get a more accurate picture of the drinking habits of Canadians and better account for the amount of alcohol sold by combining the quantity-frequency method with the yesterday question.
People greatly underestimated how often they drink.
Which type of alcohol was most likely to be under-reported?WINE!
How much of each type of alcohol is under-reported by drinkers compared to actual alcohol sales?
“Low risk” = up to 15 drinks for men &10 for women, “medium risk” = up to 30 for men & 20 for women, “high risk” = 30+ for men & 20+ for women per week
Why does this matter?THE HARM FROM ALCOHOL IS BEING UNDERESTIMATED
CANADA’S NATIONAL DRUG USE SURVEY SHOULD ALWAYS INCLUDE “YESTERDAY” QUESTIONS TO HELP CORRECT FOR UNDER-REPORTING OF ALCOHOL USE
facebook.com/carbc.uvic @carbc_uvic
carbc2300.wordpress.com www.carbc.ca
ALCOHOL USEin phone surveys
Under-reporting of
CANADIANS ARE ONLY REPORTING ABOUT
OF THEIR ALCOHOL CONSUMPTION1/3
8.2 LITRESof pure alcohol were sold perperson age 15+ in Canada annually (avg. 2008-2010)
That’s equivalent to:
480 BOTTLES OF BEER
91BOTTLES OF WINE
OR 27BOTTLES
OF SPIRITS5% 12% 40%
was the amount of pure alcoholpeople age 15+ REPORTEDdrinking annually (avg. 2008-2010)
2.8 LITRESThat’s equivalent to:
163BOTTLES OF BEER
OR 31BOTTLES OF WINE
OR 9BOTTLES
OF SPIRITS5% 12% 40%
“how much did you
drink yesterday?”
How can we get a better picture?Why is under-reporting happening?
IF SOMEONE REPORTED DRINKING ON AVERAGE:
MEN AND WOMEN EQUALLY LIKELY TO
UNDER-REPORT THEIR ALCOHOL USE
51%
BEER
62%
WINE
35%
SPIRITS
By how much do different types of drinkers under-report their alcohol use?“LOW RISK” DRINKERS:
“MEDIUM RISK” DRINKERS:
“HIGH RISK DRINKERS:
But
??? !!!
< 1X MONTH
THEY ACTUALLY DRANK ABOUT: 2X MONTH
2X WEEK
6X WEEK
Who was most likely to under-report their alcohol use?“LOW RISK” DRINKERS & PEOPLE <24 YEARS OLD
THE NUMBER OF CANADIANS DRINKING ABOVE THE LOW-RISK DRINKING GUIDELINES IS HIGHER THAN WE THOUGHT
Who under-reports their alcohol consumption in telephone surveys and by how much? An application of the Yesterday Method in a national Canadian substance use survey http://bit.ly/alcoholphone email [email protected] for a pdf copy * Canadian Alcohol and Other Drug Use Monitoring Survey (CADUMS) http://bit.ly/CADUMS *Canadian Low Risk Drinking Guidelines: http://bit.ly/lowriskdrinking
76% 62% 49%
YESTERDAYMETHOD
QUANTITY-FREQUENCYMETHOD ACCURACY+ =
CALENDAR
OR
1X WEEK
7X WEEK