info vis final paper olga paraskevopoulou
TRANSCRIPT
8/4/2019 Info Vis Final Paper Olga Paraskevopoulou
http://slidepdf.com/reader/full/info-vis-final-paper-olga-paraskevopoulou 1/23
MA in New Media and CultureInformation Visualization project
Final paper
Olga Paraskevopoulou
Student No: 6248217
Politwittic: visualizing tweets about the 2011 provincial elections in
The Netherlands
Introduction
The Politwittic project emerged from a four month, multi-disciplinary,
academic collaboration and research. The main research interest that drove the project
was the exploration of how digital, aggregated data can be visualized meaningfully in
order to provide insights for a specific event. The focus of our project moved towards
visualizing user-generated content about the provincial Dutch elections that were held
on March 2nd
and Twitter was chosen as our source of digital information.
This paper will conceptually discuss aspects of the project and will argue why
Twitter may prove to be a rich source of data concerning a current event, such as, the
provincial elections. It will provide background information about the emergence and
proliferation of microblogging practices and attempt to review in more detail the
research possibilities that stem from the exploration of data collected from Twitter
providing examples of existing information visualization projects. It will furthercontextualize the Dutch elections explaining why they were of specific importance
8/4/2019 Info Vis Final Paper Olga Paraskevopoulou
http://slidepdf.com/reader/full/info-vis-final-paper-olga-paraskevopoulou 2/23
and will make connections to the US elections which have provided various examples
of how digital sources of information may be harnessed and visualized providing
different perspectives to view the information that surround us.
Throughout our research process we were interested in discovering what is left
unseen in the fast-paced process of communication on Twitter and in finding ways to
structure, leverage and communicate those findings to a wider audience. For that
purpose, our research team built an interactive information visualization prototype
and named it Politwittic. This prototype is visualizing content of tweets related to the
provincial elections demonstrating the evolution of topics of interest over time, as
well as, the number of users engaged in the conversations and their connections
through the practice of retweets.
Social media and politics
Politicians have been experimenting with online communication to engage in
new forms of dialogue with their constituents. In March 2007, the Guardian in Britain
was the first to notice the link between Twitter and politics reporting that the US
Democratic presidential candidate John Edwards was an early adopter of Twitter.com
(Uskali, 2009). Since then, the successful use of social media in the US presidential
campaign of Barack Obama has established online social media as integral parts of
the political campaign toolbox. More precisely, as a result of the 2008 campaign,
Twitter has become a legitimate communication channel in the political arena.
However, as it is often noted, with thousands of people engaging in online
conversations it becomes very difficult, if not impossible, to follow the development
of the topics discussed.
Visualization is a powerful tool for breaking down complex information and
understanding data. Used in the field of politics it can provide unprecedented means
for leveraging transparency in the governmental affairs but also can be used as a tool
for communicating meaningfully information about historical or current political
events and debates. The 2008 US presidential elections were the first to be visualized
in an excessive way. Data sets derived from varied sources -official, historical, real-
time or user-generated- like political websites, campaign material, polls, statistics,

8/4/2019 Info Vis Final Paper Olga Paraskevopoulou
http://slidepdf.com/reader/full/info-vis-final-paper-olga-paraskevopoulou 3/23

8/4/2019 Info Vis Final Paper Olga Paraskevopoulou
http://slidepdf.com/reader/full/info-vis-final-paper-olga-paraskevopoulou 4/23
different candidates are exploiting the medium, and apart from visualizing the
frequency and density of Twitter feeds it also makes visible who tweets and why . It
could, for example, answer the question whether the candidates are using the medium
to interact in real time with the voters or just to send our their message. However, the
attempt to visualize this buzz results in a rather noisy interface. The user has to read a
lot of information of how the system works and also has to change different modes to
get the information that she is possibly interested in. In addition, although access to
the real tweets is made possible it is not realized in a very practical way.
Undoubtedly, the domain of politics is a realm where there is growing interest
in exploring digital, user-generated content, such as Twitter bursts and reactions about
political events. Although the US has led the way to this exponential growth and use
of data related to politics and elections, other countries are also starting to explore this
field. The Netherlands may not have yet a wide collection of visualizations focusing
on elections, but such efforts are expected to become the norm as there is more and
more attention given to real time data sources and content shared online.
For example, for the Provincial Elections on the 2nd
of March,
the Statalyze2 website provided a political barometer based on tweets from various
parties. In addition the website politiekentwitter.nl3, is providing a platform for
aggregating tweets from over 750 politicians and journalists which mainly focus on
political content. Politicians with Twitter accounts are invited to sign up and have
their tweets published on the website. This initiative aims in keeping track of the
politicians activity on Twitter and also provide a means for people interested in
politics to get updated information, participate in the discussions and have access to
an archive of political tweets ordered by the name of the party they represent. Also,
there in an ongoing interest in open data and access to information to foster
transparency and knowledge, as for example, The Network in Transparency and
Impact in Development4.
2
http://www.statalyze.com/hashtags/politiek/ps2011/ 3 http://politiekentwitter.nl
4 http://openforchange.info/

8/4/2019 Info Vis Final Paper Olga Paraskevopoulou
http://slidepdf.com/reader/full/info-vis-final-paper-olga-paraskevopoulou 5/23
Is this interest in online user-generated content justified? Are Dutch politicians
and citizens tweeting their thoughts? In a study carried out by comScore5
in April
2011, it is revealed that “the Dutch social networking market continues to grow
strongly as sites like Facebook, Twitter and Linkedin extend their respective
footprints in the market”. In particular, in their press release it is stated that more than
one in four Dutch Internet users visits Twitter during the course of the month and that
The Netherlands have the highest penetration in Twitter usage amongst all countries
followed by Brazil, Japan and Indonesia.
Although the numbers delivered by this study reinforce assumptions about the
enormous possibilities accompanying this wide adoption, there is a strong belief that
party leaders are using Twitter as an "old politics" send-medium, that they hardly
interact with the voters and that they are just sending out their message. The most
active social Twitterer, the politician actually answering most of the questions
received, is the party leader of the Dutch Party for Animals (a small party). Some of
the bigger parties are reluctant to answer questions. The Dutch Labour leader, for
example, answered none of 245 questions received, and the Dutch right wing leader
Geert Wilders of the PVV only answered one of 378 questions asked via Twitter. In
general it is thought that Dutch politicians are sending out a message rather than
interacting. However, the voters are on Twitter and that was, for instance, clearly
demonstrated when the most recent debate on TV was discussed so much on Twitter
that it became a worldwide trending topic.
Despite the presence of websites dedicated to Twitter feeds, the high
penetration of micro-blogging practices in The Netherlands and the evidence of dense
activity on Twitter, to our knowledge, there is no indication of projects focusing on
visualizing this information. For instance, although the politiek en twitter website is
tailored around the political use of the Twitter service it does not make any efforts to
analyze further this data apart from categorizing it under the different names of the
parties. The only project that was found related to the Dutch elections is an online
interactive data visualization of the election results and local statistics for Dutch
5http://www.comscore.com/Press_Events/Press_Releases/2011/4/The_Netherlands_Ranks_number_
one_Worldwide_in_Penetration_for_Twitter_and_LinkedIn
8/4/2019 Info Vis Final Paper Olga Paraskevopoulou
http://slidepdf.com/reader/full/info-vis-final-paper-olga-paraskevopoulou 6/23
municipalities6. This lack of further investigation and insight in the proliferating
online data and more specifically on Twitter, was one of the main reasons that
motivated the researchers to try to deal with that void.
The Politwittic project focused on the visualization of tweets with political
content in order to investigate who and why is using Twitter and whether Twitter can
inform us about the political landscape in a specific two week timeframe that focused
on the week before and the week after the provincial elections (23rd
of February to 8th
of March 2011). In the following section, we will approach the rise of social
networking sites, and more precisely the case of Twitter, for examining to what extent
it may afford new possibilities for leveraging both the subjective experience and
objective observations, transcending barriers of social time and space, enhancing
collaborative knowledge, as well as, allowing both situational and abstract analysis.
Moreover, it will attempt to give examples why microblogging in general, but also,
more precisely, through the conversational practices that it affords, may provide a
valuable repository for user-generated content about specific events.
Twitter background: Giving voice and listening.
The term Web 2.0, coined by O’Reilly (2004), entails a certain set of qualities,
such as dynamic, user-centered, open, collectively intelligent and a certain set of web
technologies that facilitate easy publishing and content sharing, as well as the
establishment of social networks. It is usually understood as a large-scale shift toward
a collaborative and participatory version of the Web, were users are able to get
involved and create content (Beer, 2009).
Social networks are humming because they fit the spirit of the time, not
because they created the spirit of sharing (Skoler, 2009). They are about listening to
others and responding. Today’s culture emphasizes the importance of giving people
their voice but as the famous cybernetician and constructivist Heinz von Foerster has
claimed, “it’s the listener, not the speaker, who determines the meaning of an
utterance”. For that reason, our project aimed at listening to what twitterers’ had to
6 http://alper.nl/dingen/2010/06/dutchstats-%E2%80%94%C2%A0your-personal-atlas-of-the-
netherlands/
8/4/2019 Info Vis Final Paper Olga Paraskevopoulou
http://slidepdf.com/reader/full/info-vis-final-paper-olga-paraskevopoulou 7/23
say about the 2011 provincial elections and building an interactive visualization that
would enable users to view, search and understand the voice of those tweets.
Twitter was born on 20067
but the exponential growth8
of its annual visitors
soon attracted the attention of scholars on this relatively new microblogging service
and research has tried to investigate Twitter as a platform of mediated inter-personal
communication. One of the first studies identified Twitter as a microblogging tool that
provide a light-weight, easy form of communication which enables users to broadcast
and share information about their activities, opinions and status (Java et al, 2007).
Twitter facilitate instant, online dissemination of short fragments of
information from a variety of official and unofficial sources (Hermida, 2010). The
research investigating the role of Twitter in social life is attempting to provide an
understanding about this microblogging usage, as well as, how it gives birth to
community structures. Java et al. have identified several categories of intention to use
Twitter: daily chatter, conversation, sharing information and reporting news. A
variety of research papers have approached the public timeline to see whether the
“Twittersphere” could reflect the formation of a new public sphere for debate, news
sharing and promotion practices or whether the majority of messages would be
“pointless bubble” (pearanalytics, 2009). Other approaches have investigated
conversational aspects and the possibility of collaboration by examining messages
addressed to specific users, retweets and followers.
Already in their preliminary analysis, Java et al. (2007), concluded that some
users were actually taking advantage of Twitter for informal collaborative purposes,
and conversation was an essential component of that. Huberman (2008) studied
further social interactions within Twitter as he was interested in how many people
each user communicated directly. In his findings he claimed the existence of two
different networks and that in order to assess the size of the social network that
matters it is needed to consider those people who actually communicate through direct
7 Business 2.0 disclosed that Twitter was created in two weeks during March 2006 in San Francisco.
The service is based on users' updates known as tweets. Tweets are text-based posts of up to 140
characters, which is why Twitter is called the “SMS of the Internet” (Uskali, 2009:16)8According to comScore during one year (April 2008 to 2009) Twitter quadrupled its US visitors
http://blog.comscore.com/2009/05/twitter_traffic_quadruples.html
8/4/2019 Info Vis Final Paper Olga Paraskevopoulou
http://slidepdf.com/reader/full/info-vis-final-paper-olga-paraskevopoulou 8/23
messages with each other, as opposed to the network created by the declared
followers and followees. Thus, he concluded that what needs to be found is the hidden
social network as that is the one that matters when trying to rely on word of mouth to
spread an idea, a belief or a trend.
In their research, Honeycutt and Herring (2009), focused on the functions and
uses of the @ sign and the coherence of exchanges in order to determine how well
Twitter supported user-to-user interaction. They revealed a surprising degree of
conversationality, that was facilitated by the use of the @ as a marker of addressivity.
Although, they also shed light on the limitations of the Twitter design at the time,
what was important in their findings was the fact that despite a “noisy” environment
and an interface that was not facilitating conversational use, short, dyadic exchanges
did occur relatively often, along to some longer conversations with multiple
participants.
Considering the fact that Twitter supports a variety of communicative
purposes and in continuation of researching conversationality on Twitter, Boyd
(2010), examined retweeting practices. In her findings it was made obvious that the
stream of messages provided by Twitter allowed individuals to be peripherally aware
of the occurring conversations without the need of direct participation to them. So
when conversations emerge, they are often experienced by broader audiences than just
the interlocutors. In that sense, the act of retweeting can be understood both as a form
of information diffusion and as a means of participating in a diffused conversation.
What also differentiates Twitter as a social medium, and for the researchers
adds value to its content and social structure, is that it has provoked creativity
through its constraints. Johnson (in Hermida, 2010), has described the service as an
example of end-user innovation as users have embraced the technology and its
affordances to develop conventions such as the use of #hashtags and the @user reply.
This structure was initially rough and inconsistent but Twitter developers have now
build the #hashtag convention, the @user reply and retweeting into the system making
it more easier for the users to keep track of the public timeline and social interactions.
8/4/2019 Info Vis Final Paper Olga Paraskevopoulou
http://slidepdf.com/reader/full/info-vis-final-paper-olga-paraskevopoulou 9/23
Boyd (2010), has also mentioned another constraint of the platform as an
actual advantage. The mere fact of the 140-character limitation that enable the brevity
of messages allows them to be produced, consumed, and shared without a significant
amount of effort, allowing a fast-paced conversational environment to emerge. What
she also mentions is that through the varied approaches that users take to route around
these constraints, it is revealed what they value in specific messages and in Twitter as
a conversational environment.
Those findings amongst others, have provided us with a general understanding
of why and how people use these services but they have not explored the use of this
communication medium in specific contexts such as current events. The new Web 2.0
culture values sharing information, experiences, knowledge and voices or others.
Users are more involved in the news-creation process, where feedback happens in real
time and users have the opportunity to interact with each other (Stassen, 2010).
According to Skoler, using networks for the real value they provide means finding
ways to establish relationships and listen to others. In the case of Twitter, that would
require to spend as much time listening on Twitter as we do tweeting.
Learning what is happening: Twitter as an awareness system
The key question for our research was how could a better understanding be
gained of what is happening on Twitter. In other words, how could it be possible for
the voices of thousands of people to be represented and associated to real time events
and how could the temporal evolution of topics of interest be indicated. A way to
provide interpretations about the numerous tweets and gain further insight in the
discussions referring to a specific event, is undoubtedly information visualization.
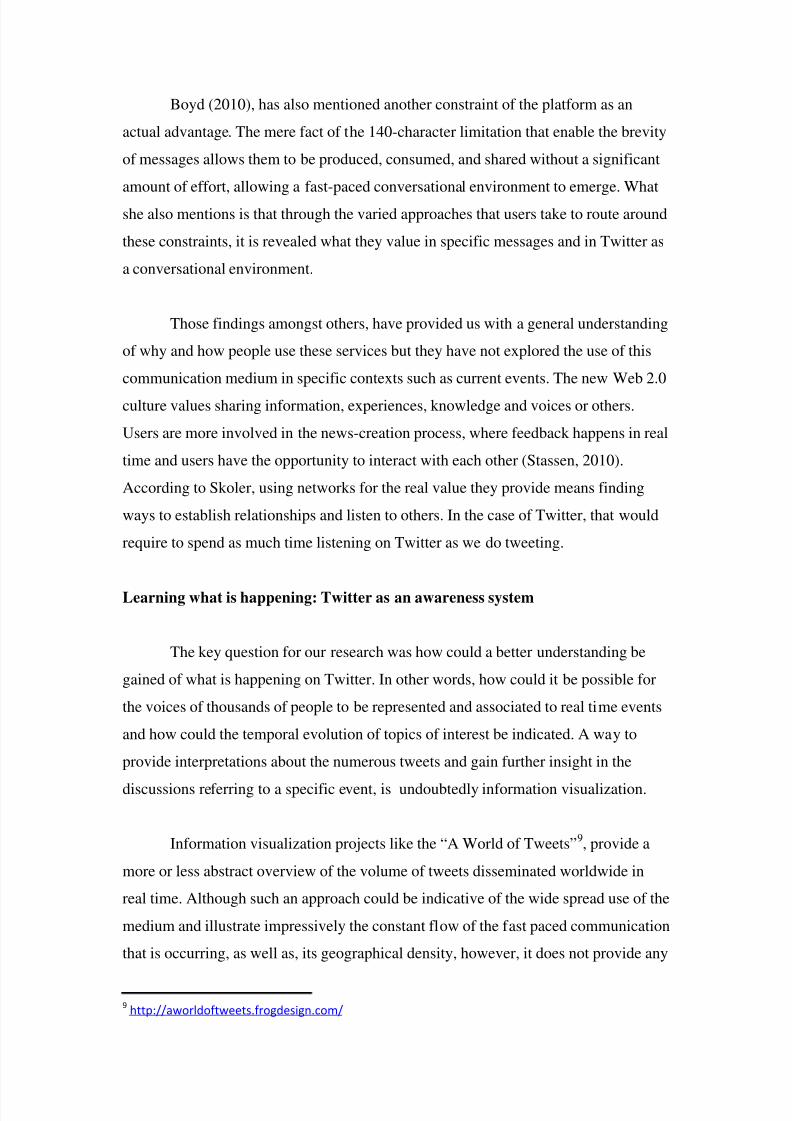
Information visualization projects like the “A World of Tweets”9, provide a
more or less abstract overview of the volume of tweets disseminated worldwide in
real time. Although such an approach could be indicative of the wide spread use of the
medium and illustrate impressively the constant flow of the fast paced communication
that is occurring, as well as, its geographical density, however, it does not provide any
9 http://aworldoftweets.frogdesign.com/
8/4/2019 Info Vis Final Paper Olga Paraskevopoulou
http://slidepdf.com/reader/full/info-vis-final-paper-olga-paraskevopoulou 10/23
insight for the context in which this communication is taking place nor a
comprehension of why and who is contributing to this global conversation.
A world of Tweets: screenshot taken on May 10th, 2011
Nevertheless, as it was argued before, microblogging may prove a valuable
repository of user-generated content that is worth to be further investigated. For that
reason, approaches that invest time in data mining and analysis may reveal and
illustrate how people are engaged in new communication patterns, communicating
their interests or with each other directly. In his weblog10
, Jeff Clark, has numerous
examples that demonstrate his avocation in “discovering patterns in the apparent
chaos of real life data and exploring new techniques for communicating that in a
visually compelling manner”.
With the latest tool that he has built, “Tweet Topic Exlorer”
11
, it is possible toinvestigate which topics are tweeted most often from a given ID. This information is
visualized with the use of clustered word clouds which use word size to indicate
frequency but also use positioning and word color to group highly correlated words
together. What makes this visualization even more interesting is that it also gives
very easy access to the raw data, the actual tweets that were tweeted from the
10 http://neoformix.com
11 http://tweettopicexplorer.neoformix.com/#n=NYTimes

8/4/2019 Info Vis Final Paper Olga Paraskevopoulou
http://slidepdf.com/reader/full/info-vis-final-paper-olga-paraskevopoulou 11/23
particular account investigated. In this sense, the viewer has the opportunity to click
on a word of her interest and see the context in which this word was tweeted.
Tweet Topic Explorer (Jeff Clark, 2011): screenshot taken on May 11th, 2011
With an interest in revealing content about a specific event, the Politwittic
researchers investigated information visualization projects that addressed Twitter
content in relation to specific contexts. In that case, the term “specific context” is
understood as a current important event which may vary from being an international
sport event, a natural disaster to a political speech or elections, or any other large
event that may affect in certain ways peoples’ lives and that has some degree of social
significance. In all those cases, people who are watching, attending, engaging or even
dealing with these different kinds of events, they increasingly share via Twitter brief
and timely pieces of information. These may create an interesting repository of human
expression and could also lead to persistent conversations about those events. As it
has been noted, microblogging communities not only enable participants to share their
experience and shape how observers perceive an event, they are also used to help
participants influence the unfolding of an event and its outcome (Dork et al, 2010).
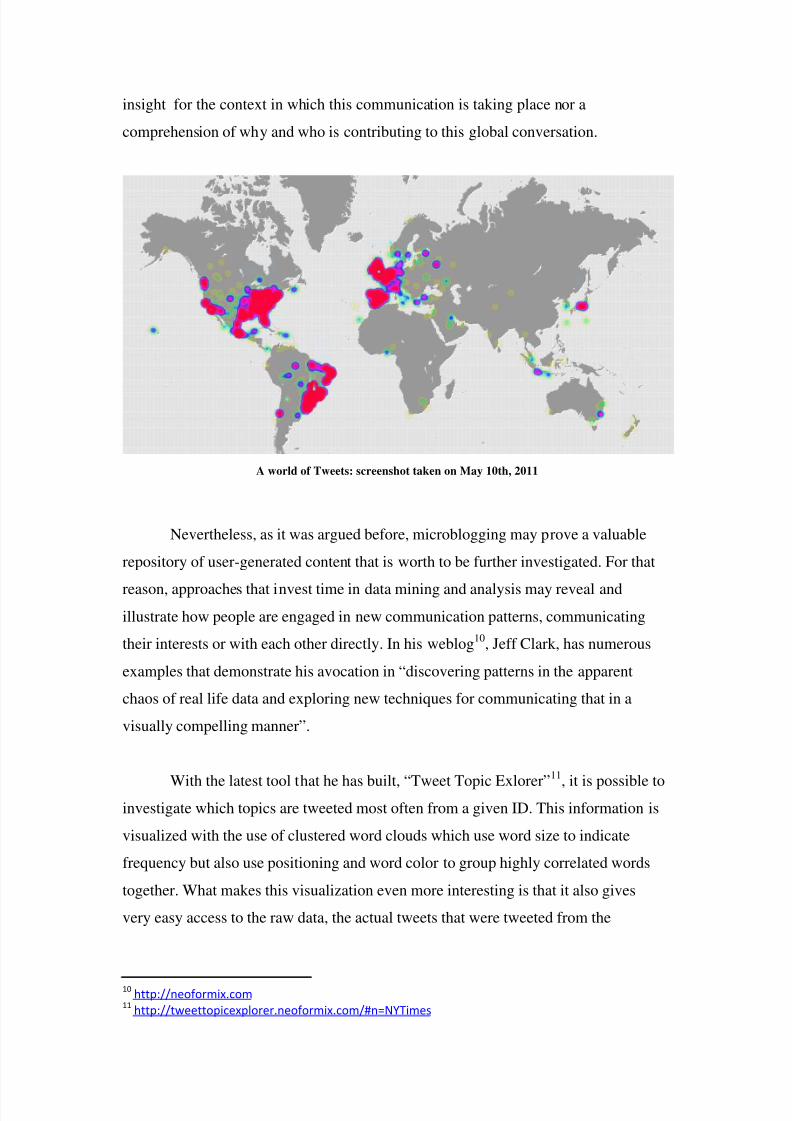
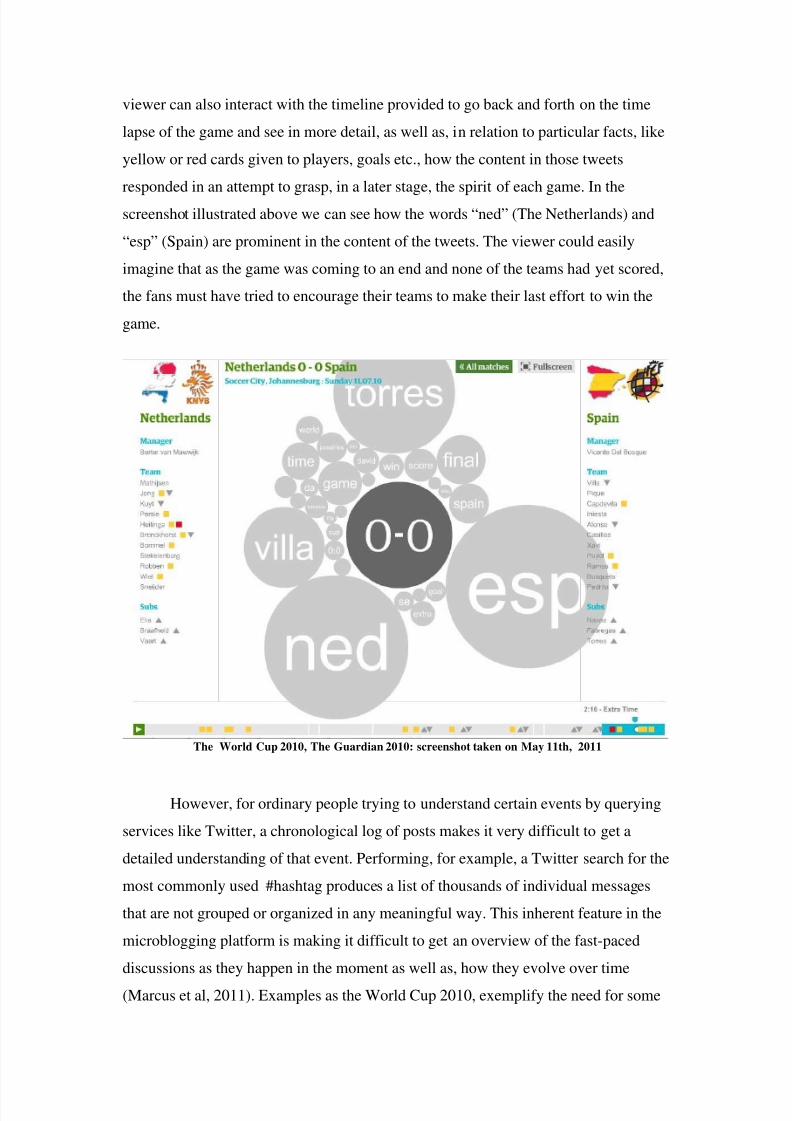
A lively interactive visualization of mentions on Twitter focusing on a very
specific event is provided by the Guardian. This visualization project collected tweets
about every game of The World Cup 2010 and tried to illustrate their content and
evolution during the time period of each game. On the bottom of the visualization the
8/4/2019 Info Vis Final Paper Olga Paraskevopoulou
http://slidepdf.com/reader/full/info-vis-final-paper-olga-paraskevopoulou 12/23
viewer can also interact with the timeline provided to go back and forth on the time
lapse of the game and see in more detail, as well as, in relation to particular facts, like
yellow or red cards given to players, goals etc., how the content in those tweets
responded in an attempt to grasp, in a later stage, the spirit of each game. In the
screenshot illustrated above we can see how the words “ned” (The Netherlands) and
“esp” (Spain) are prominent in the content of the tweets. The viewer could easily
imagine that as the game was coming to an end and none of the teams had yet scored,
the fans must have tried to encourage their teams to make their last effort to win the
game.
The World Cup 2010, The Guardian 2010: screenshot taken on May 11th, 2011
However, for ordinary people trying to understand certain events by querying
services like Twitter, a chronological log of posts makes it very difficult to get a
detailed understanding of that event. Performing, for example, a Twitter search for the
most commonly used #hashtag produces a list of thousands of individual messages
that are not grouped or organized in any meaningful way. This inherent feature in the
microblogging platform is making it difficult to get an overview of the fast-paced
discussions as they happen in the moment as well as, how they evolve over time
(Marcus et al, 2011). Examples as the World Cup 2010, exemplify the need for some

8/4/2019 Info Vis Final Paper Olga Paraskevopoulou
http://slidepdf.com/reader/full/info-vis-final-paper-olga-paraskevopoulou 13/23
sort of data arrangement that is required. Tweets have to be collected, structured,
analyzed and then presented in the most efficient way possible in order to offer a
valuable means of understanding and to be able to provide a certain degree of
understanding about how our collective mind reflects a specific event.
For the researchers, the importance of this data to be explored in the context of
a specific event, stems from certain characteristics of the service. More precisely,
from the emergence of this short, fast and effortless way of communication and the
real-time, light-weight and mobile use of the platform that enables instant updates that
capture user-generated content “at the point of inspiration”. What is more, Twitter has
the potential for direct relevance to our daily activities and to fit communication
practices into certain contextual cues. Context may not be the setting itself, but the
engagement with it, as well as the bias that setting gives to the interactions that occur
within it (McCullough, 2005). Perceptions may be subjective and fleeting, but
grounding life in effective contexts remains absolutely necessary.
Visualizing topics of interest, participants and evolution over time
The body of Twitter research is rapidly expanding from exploring its makeup,
norms and latent data to understand the service’s emerging social role and
conversational patterns. A particular branch of microblogging research analyzes
reactions to current events on Twitter. As it is fast becoming a critical source of
information about world events and there is an increasing interest to track these novel
microblog-based conversations by collecting, aggregating and visualizing tweets
about user-specified events as they unfold over a certain period of time. More
systematic approaches to capture this moment-to-moment pulse of the public
consciousness have inspired the research process and final visualization of the
Politwittic project.
Developed at the MIT, TwitInfo (Marcus et al., 2011), is a system for
visualizing and summarizing events on Twitter. The system tracks keyword mentions
on Twitter and turns them into timeline visualizations which summarize various
topics. In the project’s website the researchers present three feature topics and call for
the viewers to “Find out what Twitter things about everything”. In order for the
8/4/2019 Info Vis Final Paper Olga Paraskevopoulou
http://slidepdf.com/reader/full/info-vis-final-paper-olga-paraskevopoulou 14/23
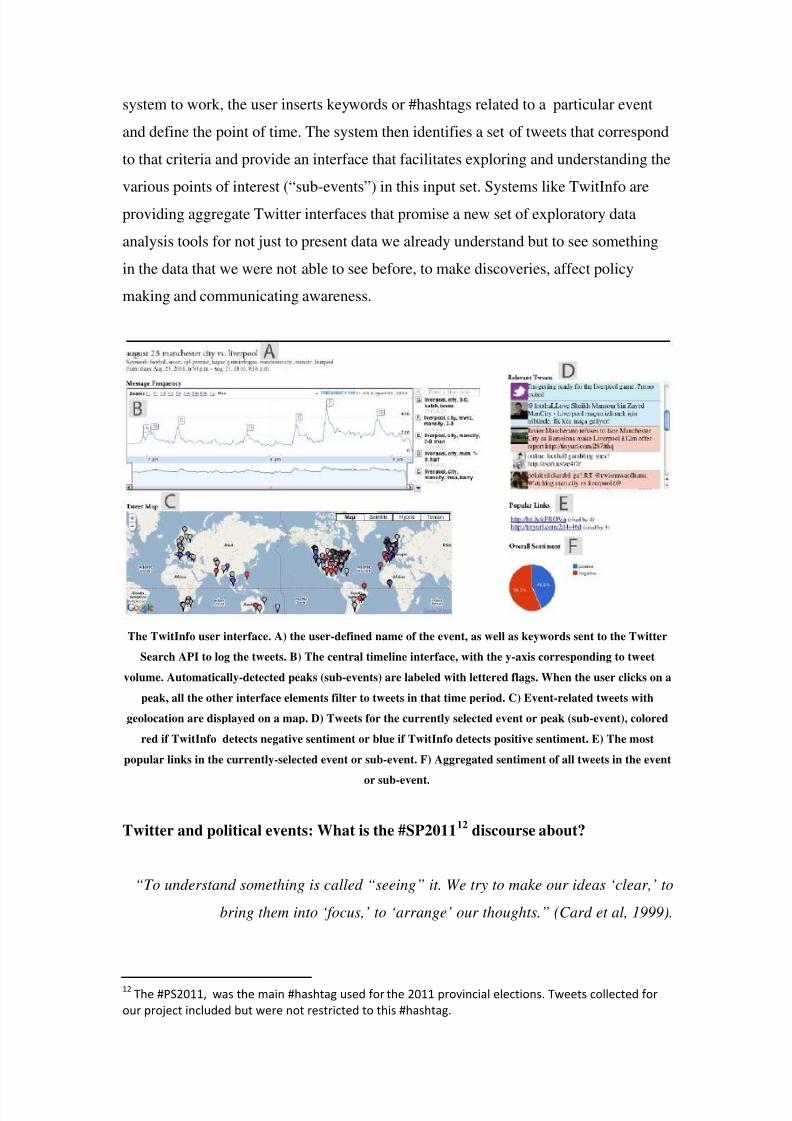
system to work, the user inserts keywords or #hashtags related to a particular event
and define the point of time. The system then identifies a set of tweets that correspond
to that criteria and provide an interface that facilitates exploring and understanding the
various points of interest (“sub-events”) in this input set. Systems like TwitInfo are
providing aggregate Twitter interfaces that promise a new set of exploratory data
analysis tools for not just to present data we already understand but to see something
in the data that we were not able to see before, to make discoveries, affect policy
making and communicating awareness.
The TwitInfo user interface. A) the user-defined name of the event, as well as keywords sent to the Twitter
Search API to log the tweets. B) The central timeline interface, with the y-axis corresponding to tweet
volume. Automatically-detected peaks (sub-events) are labeled with lettered flags. When the user clicks on a
peak, all the other interface elements filter to tweets in that time period. C) Event-related tweets with
geolocation are displayed on a map. D) Tweets for the currently selected event or peak (sub-event), colored
red if TwitInfo detects negative sentiment or blue if TwitInfo detects positive sentiment. E) The most
popular links in the currently-selected event or sub-event. F) Aggregated sentiment of all tweets in the event
or sub-event.
Twitter and political events: What is the #SP201112
discourse about?
“To understand something is called “seeing” it. We try to make our ideas ‘clear,’ to
bring them into ‘focus,’ to ‘arrange’ our thoughts.” (Card et al, 1999).
12The #PS2011, was the main #hashtag used for the 2011 provincial elections. Tweets collected for
our project included but were not restricted to this #hashtag.
8/4/2019 Info Vis Final Paper Olga Paraskevopoulou
http://slidepdf.com/reader/full/info-vis-final-paper-olga-paraskevopoulou 15/23
Awareness is not only gained by looking around us and redefining our
relationship to objects in our vicinity. It is also gained by looking at information that
was once abstract, that had not any obvious spatial mapping, through creative and
intuitive new visual forms and presentations. However, the eyes need to be trained to
see, to decode the thousand words that one picture may worth, in order for people to
gain insight and to become aware. Recent trends in information visualization are
often advocating the benefits of using visuals to raise public awareness (Zambrano &
Engelhardt, 2008). In the same line of thought, what is found common in the
pioneering work of both Neurath and Rosling, is their passion to communicate data
and facts to the people in the most clear and effective way possible in order to educate
them and raise awareness.
Otto Neurath, was the founder of the Vienna Circle, and tireless advocate of
visual education. His claim was that with visual aids, one could create something that
is common to all, that could educate people in various countries. Neurath’s means of
spreading social knowledge were the pictorial statistics of the “Vienna Method,” later
coined ISOTYPE (International System of Typographic Education). The information
visualization guru, H. Rosling has also dedicated his work in communicating real
facts to the world. He co-founded Gapminder, “a non-profit venture promoting
sustainable global development and achievement of the United Nations Millennium
Development Goals by increased use and understanding of statistics and other
information about social, economic and environmental development at local, national
and global levels”.
Inspired by this pioneering work, the aim of the Politwittic project is not only
to visualize the online discourse about the elections, but it also aims to provoke users
to ask questions about the elections, make associations about the data presented to
them and help them see something that were not able to see before. What we are
interested in is not to provide a priori interpretations of the data we collected but to
enable users to make their own suggestions and discoveries.
Studies have confirmed that Twitter can indeed be a valid indicator of political
opinion and political deliberation (Tumasjan, 2010 & Koop and Jansen, 2009). In line
with this approach, the Politwittic research project attempts to built a timeline based
8/4/2019 Info Vis Final Paper Olga Paraskevopoulou
http://slidepdf.com/reader/full/info-vis-final-paper-olga-paraskevopoulou 16/23
visualization for political events and more precisely for the 2011 Provincial Elections
in the Netherlands. The researchers intend is to provide an interactive visualization
dedicated to the online discourse that surrounded the elections and to engage users in
searching words of their interest and discovering what was said about them during the
examined time period. Through this exploratory process the user is able to track
occurring words and see their evolution over time, to find co-occurring words that
specify the context within which the word appeared and to see how many people
participated in the discussion.
Background of the 2011 Provincial Elections in the Netherlands
The members of the States-Provincial are chosen every four years. The
number of members of each States-Provincial depends on the size of the province's
population. Currently, the twelve States-Provincial number 566 members. As an
intermediary level between the state and the municipalities, the twelve Dutch
provinces have limited powers and largely carry out minor administrative duties and
serve as links between the top and lower echelons of government. Yet, the provincial
legislatures are responsible for electing the Senate or Eerste Kamer , which unlike
other indirectly elected upper houses, has the power to veto legislation. The current
Rutte coalition lacks a majority in the Senate, with 35 out of 75 seats. Provincial
elections, thus, carry a much more important national message despite the strength of
some local regionalist parties in certain provinces.
The Provincial elections were held on March 2, 2011. Turnout was 56%, up
from 46% in 2007 and was the highest turnout since 1995. The provincial election
results are widely seen as a referendum on Mark Rutte’s minority coalition between
his conservative liberal VVD and the Christian Democrats and supported by the PVV.
For that reason the cabinet was hoping to win most seats to be able to ease the process
of controversial legislation concerning mostly cuts in funding projects and stricter
laws. However, the alliance is set to fall short of an overall majority in the senate by
one seat, meaning it will be forced to rely on other parties to force through
controversial legislation, such as education cuts and anti-immigration measures. The
exact make up of the 75-seat senate will not be finalized until May 23, when the
provincial councils give their vote.
8/4/2019 Info Vis Final Paper Olga Paraskevopoulou
http://slidepdf.com/reader/full/info-vis-final-paper-olga-paraskevopoulou 17/23
Considering the importance of the elections under these circumstances, the
evidence that the use of Twitter is widely adopted by the Dutch population and the
lack of previous attempts to visualize Twitter data, the researchers engaged
themselves in building an interactive interface that would allow a more insightful
view of the Twitter conversations surrounding the elections. As previously discussed,
the prototype is visualizing content of tweets related to the provincial elections
demonstrating the evolution of topics of interest over time, as well as, the number of
users engaged in the conversations and their connections through the practice of
retweets.
Some initial questions that drove our research were to find out how topics are
changing over time, who are the most active participants and what are certain
participants talking about. As we mentioned earlier, with thousands of people
engaging in political conversation on Twitter it becomes impossible to follow the
development of what is discussed and by whom. Our work addresses this challenge
and attempts to visually represent the voices of thousands of people. By investigating
topics of interest and visualizing the identity and presence of people participating, as
well as, their temporal activity and structure, the researchers attempted to find ways of
listening to all the voices that participated in Twitter conversations and invite the
users to take some their time to hear them and gain an understanding of that discourse.
Our approach in not based on a content analysis of the tweets but intends to
serve more as a political barometer visualizing topics, their context and the number of
users engaged in discussions about them. The topic’s importance is measured by
frequency of mentions and it is showed by the size or the bubble. Questions we
possibly want to answer are: Is there diversity in the topics? Are there many different
issues that concern people or a few are dominating the discourse? Are discussions
polarized or consensus prevails? Are twitterers focusing on local or national issues?
Are political speeches and TV debates defining the discourse on Twitter? How much
impact did TV have? Are the number of mentions to political parties and politicians in
accordance to the exit polls?
8/4/2019 Info Vis Final Paper Olga Paraskevopoulou
http://slidepdf.com/reader/full/info-vis-final-paper-olga-paraskevopoulou 18/23
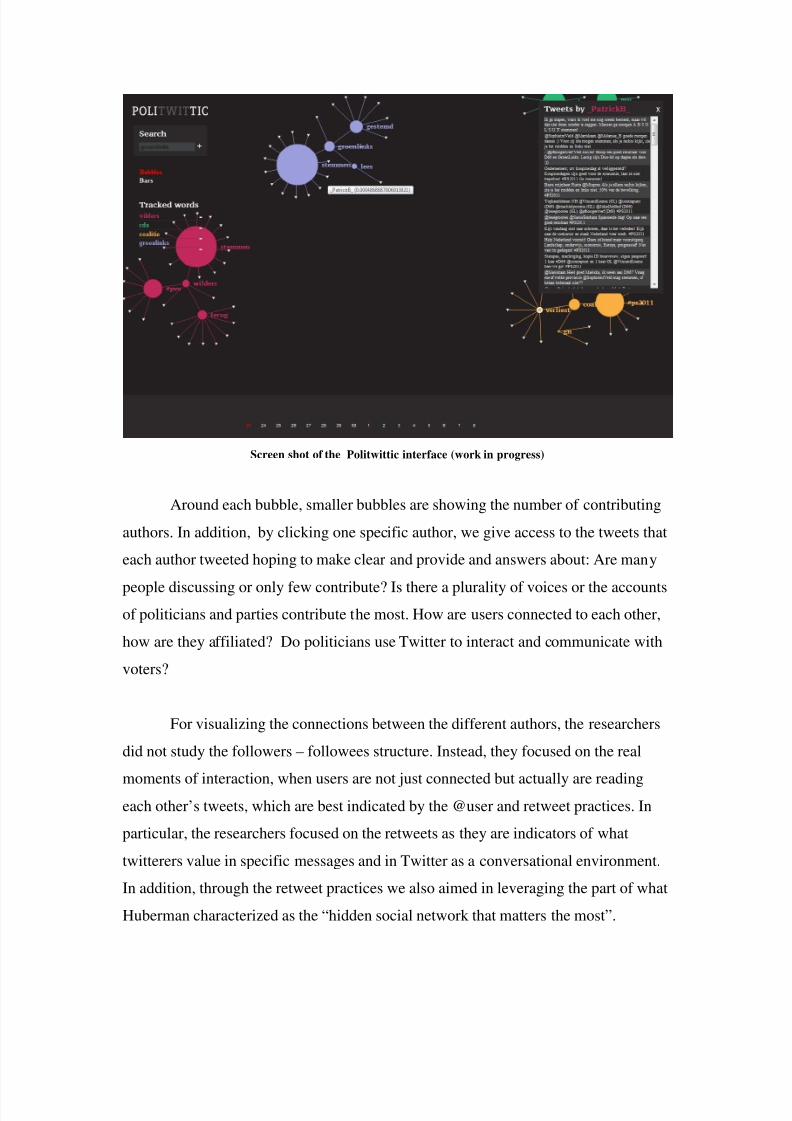
Screen shot of the Politwittic interface (work in progress)
Around each bubble, smaller bubbles are showing the number of contributing
authors. In addition, by clicking one specific author, we give access to the tweets that
each author tweeted hoping to make clear and provide and answers about: Are many
people discussing or only few contribute? Is there a plurality of voices or the accounts
of politicians and parties contribute the most. How are users connected to each other,
how are they affiliated? Do politicians use Twitter to interact and communicate with
voters?
For visualizing the connections between the different authors, the researchers
did not study the followers – followees structure. Instead, they focused on the real
moments of interaction, when users are not just connected but actually are readingeach other’s tweets, which are best indicated by the @user and retweet practices. In
particular, the researchers focused on the retweets as they are indicators of what
twitterers value in specific messages and in Twitter as a conversational environment.
In addition, through the retweet practices we also aimed in leveraging the part of what
Huberman characterized as the “hidden social network that matters the most”.
8/4/2019 Info Vis Final Paper Olga Paraskevopoulou
http://slidepdf.com/reader/full/info-vis-final-paper-olga-paraskevopoulou 19/23
Concluding remarks
Twitter, according to Markopoulos et al. (in Hermida, 2010), represents the
next step in the evolution of communication technologies that have increased the
frequency and amount of information transfer, offering tremendous potential for
innovation and for perceiving the world around us. That is why the researchers value
attempts that seek to harvest Twitter’s content to reveal hidden layers of information
consisting of updates and reports about events on the ground, as well as, exploiting
potentials that stem from such an innovative medium for both personal reflection but
also social awareness.
In order to answer the question of what people are talking about in relation to
the provincial elections, the researchers did not approach the online discourse on
Twitter as separated from the offline. Twitter was approached as an additional
dimension to offline discussions and debates. An online platform on which various
discussions and topics are being held providing an online streaming river of thoughts
out events. However, what differentiates Twitter is the bottom-up structure of the
discourse that reinforces the view of what has been called as the demise of the
gatekeepers role in the Web 2.0 era and the rise of a collaborative and participatory
discourse and culture (Brunx, 2008). Could this egalitarian nature of the internet-
based discussion facilitate democratic, deliberative discussions amongst citizens?
The project aimed at listening to whom (plurality of voices) and what
(diversity of topics) was said about the elections in a two week period. The research
process that preceded the creation of the Politwittic project highlighted the
possibilities and limitations of information visualization attempts to depict the flow of
information and to derive meaning out of this mediated communication. Our work
sought to follow and explore online conversations about the provincial elections and
to represent the conversation topics in the context of their temporal development
together with participants’ activity.
However, as the research prototype is not yet fully functioning we cannot
assess to what extend this was successfully achieved and how informative our attempt
will be. We hope that several of the questions that drove our research will be
8/4/2019 Info Vis Final Paper Olga Paraskevopoulou
http://slidepdf.com/reader/full/info-vis-final-paper-olga-paraskevopoulou 20/23
answered and in accordance to our findings to further develop our idea to be most
representative possible of the online Twitter discourse. Above all, we would like to
explore and possibly answer the question whether Twitter, as an innovative service
that attracts more and more users annually, may serve as a vehicle for political
deliberation that leverages the plurality of voices and the variety of topics of interest.
Total count of 5700 words
8/4/2019 Info Vis Final Paper Olga Paraskevopoulou
http://slidepdf.com/reader/full/info-vis-final-paper-olga-paraskevopoulou 21/23
Bibliography
Beer D. (2009) “Power through the algorithm? Participatory web cultures and
the technological unconscious”, New Media Society 2009: 11: 985, Published by
Sage.
Boyd, D., Golder S., and Lotan G. (2010), “Tweet, Tweet, Retweet:
Conversational Aspects of Retweeting on Twitter.” HICSS-43. IEEE: Kauai, HI,
January 6.
Bruns A. (2008) “Blogs, Wikipedia, Second Life, and Beyond: From
Production to Produsage”, New York: Peter Lang.
Card, et al. (1999). Readings in Information Visualization: Using Vision to
Think. Academic Press, Morgan Kaufman Publishers.
Dork M., et al (2010), “A Visual Backchannel for Large-Scale Events”, posted
online 24 October 2010
Hermida A. (2010), “TWITTERING THE NEWS: The emergence of ambient
journalism”, Journalism Practice, Volume 4, Issue 3 August 2010, pages 297 – 308.
Honeycutt C. & Herring S. (2009), “Beyond Microblogging: Conversation and
Collaboration via Twitter”, Proceedings of the Forty-Second Hawai’i International
Conference on System Sciences (HICSS-42). Los Alamitos, CA: IEEE Press.
Huberman B. et al. (2008), “Social networks that matter: Twitter under
the microscope”, Social Computing Lab, HP Laboratories, Palo Alto, CA 94304
Cornell University, Ithaca, NY 14850.
Java A. et al (2007), “Why We Twitter: Understanding Microblogging
Usage and Communities”, Joint 9th WEBKDD and 1st SNA-KDD Workshop ’07 ,
August 12, 2007, San Jose, California , USA .

8/4/2019 Info Vis Final Paper Olga Paraskevopoulou
http://slidepdf.com/reader/full/info-vis-final-paper-olga-paraskevopoulou 22/23
Kwak H. et al. (2007), What is Twitter, a Social Network or a News Media?,
International World Wide Web Conference Committee (IW3C2), April 26–30, 2010,
Raleigh, North Carolina, USA.
Koop R. & Jansen H. (2009), Political Blogs and Blogrolls in Canada :
Forums for Democratic Deliberation? Social Science Computer Review 2009 27: 155
originally published online 24 February 2009.
Marcus A., et al (2011), “TwitInfo: Aggregating and Visualizing Microblogs
for Event exploration”, CHI, Vancouver, BC, Canada. Accessed on
12/4/2011 http://people.csail.mit.edu/marcua/papers/twitinfo-chi2011.pdf
McCullough M. (2005), Digital Ground: Architecture, Pervasive Computing,
and Environmental Knowing, The MIT Press.
Pearanalytics (2009), Twitter Study – August 2009, last accessed on 14th
of
May 2011: http://www.pearanalytics.com/blog/wp-content/uploads/2010/05/Twitter-
Study-August-2009.pdf .
Stassen W. (2010), “Your news in 140 characters: exploring the role of social
media in journalism”, Global Media Journal, African Edition 2010, Vol 4 (1).
Skoler M. (2009), “Why the News Media Became Irrelevant—And How
Social Media Can Help”, last accessed on 14th
of May 2011:
http://www.nieman.harvard.edu/reportsitem.aspx?id=101897
Tumasjan A. et al. (2010), “Predicting Elections with Twitter:
What 140 Characters Reveal about Political Sentiment”, in the Proceedings of the
Fourth International AAAI Conference on Weblogs and Social Media.
Uskali T. (2009), “Weak Signals in Innovation Journalism – Cases Google,
Facebook and Twitter”, Innovation Journalism VOL. 6, NO. 6, Jun 1 2009.
8/4/2019 Info Vis Final Paper Olga Paraskevopoulou
http://slidepdf.com/reader/full/info-vis-final-paper-olga-paraskevopoulou 23/23
Zambrano & Engelhard (2008). Diagrams for the Masses: Raising Public
Awareness – From Neurath to Gapminder and Google Earth. In G. Stapleton, J.
Howse, and J. Lee (Eds.): Diagrams, LNAI 5223, pp. 282–292, 2008. © Springer-
Verlag Berlin Heidelberg.