influences of orography and coastal geometry on a
TRANSCRIPT

Influences of Orography and Coastal Geometry on a Transverse-Mode Sea-EffectSnowstorm over Hokkaido Island, Japan
LEAH S. CAMPBELLaAND W. JAMES STEENBURGH
Department of Atmospheric Sciences, University of Utah, Salt Lake City, Utah
YOSHINORI YAMADA
Meteorological Research Institute, Japan Meteorological Agency, Ibaraki, Japan
MASAYUKI KAWASHIMA AND YASUSHI FUJIYOSHI
Institute of Low Temperature Science, Hokkaido University, Sapporo, Japan
(Manuscript received 29 September 2017, in final form 24 April 2018)
ABSTRACT
Sea-effect snowstorms generated over the Sea of Japan produce consistent and often heavy snowfall
throughout the winter season, impacting downstream communities in northern and central Japan. Here, we
use observations and Weather Research and Forecasting (WRF) Model simulations to examine the pre-
cipitation distribution produced by transverse-mode sea-effect snowbands that interacted with the moun-
tainous terrain circumscribing Ishikari Bay, Hokkaido Island, Japan, on 12 January 2014. The bands observed
here were horizontal convective rolls aligned normal to the mean flow and were ;10 km wide and up to
;100 km long. The bands approached Ishikari Bay at intervals of;10–16min, intensifying as they progressed
through a quasi-stationary, elongated enhancement region that paralleled the Shakotan Peninsula and ex-
tended into the Ishikari plain. Hydrometeor advection, through an ascent region over the northeast slope of
the Shakotan Peninsula, and along clockwise-turning trajectories steered by the boundary layer directional
shear, contributed to sustained precipitation enhancement along a curve in the elongated enhancement region
near the entrance to Ishikari Bay. Downstream, orographic flow deflection by the coastal mountains, likely
accentuated by thermal and roughness gradients along the Shakotan Peninsula’s shoreline, produced con-
vergence and ascent along the elongated enhancement region. This study demonstrates the impact of
downstream topography on sea-effect snowstorms and has implications for improving the prediction of
snowfall in this and other lake- and sea-effect regions.
1. Introduction
Sea- and lake-effect snowstorms impact urban and ru-
ral communities with intense, continuous, and often ex-
tremely localized snowfall (e.g., Magono et al. 1966;
Niziol et al. 1995; Eito et al. 2005; Laird et al. 2009;
Kristovich et al. 2017). Nearly omnipresent sea-effect
snowfall generated over the Sea of Japan affects western
Japan during the Asian winter monsoon (see Fig. 1 for
geographic references), producing mean annual snowfall
accumulations as high as 600 cm in Sapporo onHokkaido
Island (population 1.9 million) and 760cm in Aomori on
Honshu Island (population 300000; Steenburgh 2014).
Some of the deepest seasonal snowpacks in the world are
found in the mountains of western Japan, with average
annual snow depths as high as 6.6m at 1205m MSL
(Yamaguchi et al. 2011). Gaining a better understanding
of the mechanisms controlling the intensity and distri-
bution of sea- and lake-effect snowstorms in Japan and
around the world is important to improve winter storm
forecasts of these frequently impactful events (e.g., Niziol
1987; Kristovich et al. 2017) and has implications for
improving seasonal runoff predictions (e.g., Ellis and
Johnson 2004) and projections of climate change impacts
on snow and freshwater resources (e.g., Kawase et al.
2013; Notaro et al. 2015).
a Current affiliation: Center for Western Weather and Water
Extremes, Scripps Institution of Oceanography, University of
California, San Diego, La Jolla, California.
Corresponding author: Leah S. Campbell, [email protected]
JULY 2018 CAMPBELL ET AL . 2201
DOI: 10.1175/MWR-D-17-0286.1
� 2018 American Meteorological Society. For information regarding reuse of this content and general copyright information, consult the AMS CopyrightPolicy (www.ametsoc.org/PUBSReuseLicenses).
Unauthenticated | Downloaded 02/12/22 04:42 PM UTC

When a cold, continental air mass flows over a rela-
tively warm body of water such as the Sea of Japan or the
Great Lakes of North America, sensible and latent heat
fluxes from the water surface warm, moisten, and de-
stabilize the atmosphere, producing moist convection
that typically extends upward to a capping inversion or
stable layer at the top of the boundary layer (e.g.,
Tsuchiya and Fujita 1967; Niziol 1987; Byrd et al. 1991;
Chang and Braham 1991). Over larger bodies of water
such as the Sea of Japan, or when the prevailing
boundary layer flow is oriented across the short axis of
an elongated body of water, sea- or lake-effect convec-
tion frequently organizes into horizontal roll clouds
oriented parallel to the prevailing flow (e.g., Asai 1970;
Kelly 1982, 1984; Kristovich 1993). Such bands, which
are favored by weak directional boundary layer shear,
are referred to as longitudinal-mode (L mode) bands in
the Japanese literature (e.g., Miura 1986; Yamada et al.
2010). Stronger, quasi-stationary, flow-parallel snow-
bands form in the lee of isolated topographic obstacles
or downstream of concavities in the upstream coast due
to terrain- and thermally driven convergence. Two areas
of such convergence frequently produce these bands
over the Sea of Japan. The first, known as the Japan
Sea polar airmass convergence zone (JPCZ), forms
downstream of the shoreline concavity where the
Korean Peninsula joins the Eurasian coast and im-
pacts Honshu Island (e.g., Hozumi andMagono 1984;
Ohigashi and Tsuboki 2007). The second forms in
response to convergence in the lee of terrain complex-
ities in the Sikhote-Alin range and extends downstream
to Hokkaido Island (e.g., Katsumata et al. 1998; Ohtake
et al. 2009).
A less-studied phenomenon over the Sea of Japan is
transverse-mode (T mode) snowbands, which accoun-
ted for ;12% of observed sea-effect precipitation in a
1-yr study along Honshu’s west coast (Nakai et al.
2005). Transverse-mode bands are quasi-periodic
convective rolls that align parallel to the shear vector
and roughly perpendicular to the mean flow during
periods of strong boundary layer directional shear
(Fig. 2). Tsuchiya and Fujita (1967) first described
transverse-mode bands, including their landfall and
movement through the valleys of Honshu, while Asai
(1972) provides an overview of the band dynamics.
Although this morphology is mentioned frequently
FIG. 1. Topography of (a) East Asia and Japan and (b) western
Hokkaido. Terrain elevation (mMSL) color filled as in scale in (a).
Black box in (a) represents location of (b). Red color fill represents
urban areas. White dot represents location of the Sapporo radar,
cyan dot the ILTSmeteorological station, and red dot the Kitahiroshima
radar. Adapted from maps-for-free.com.
FIG. 2. Conceptual diagram of the relationship between bound-
ary layer winds and transverse-mode bands. Based on Fig. 4 of Asai
(1972).
2202 MONTHLY WEATHER REV IEW VOLUME 146
Unauthenticated | Downloaded 02/12/22 04:42 PM UTC

in the Japanese literature (e.g., Murakami et al. 2003;
Nakai et al. 2003, 2005) and transverse-mode structure
and formation mechanisms were examined in more
detail by Eito et al. (2010), few studies have examined
the precipitation distributions produced by these bands
or their structure, occurrence, and evolution as they
make landfall.
The topography of Japan’s mountainous and relatively
densely populated west coast profoundly shapes the dis-
tribution of precipitation produced by landfalling sea-
effect snowstorms (e.g., Murakami et al. 1994; Nakai and
Endoh 1995). These snowstorms frequently occur in the
absence of synoptically forced precipitation and therefore
are susceptible to mesoscale influences, such as shoreline
geometry, thermally driven wind circulations, orographic
channeling of flow, and the enhancement of precipitation
over coastal terrain.
Previous studies have identified a number of mecha-
nisms that may contribute to the orographic modifica-
tion of sea- and lake-effect precipitation systems, such as
the seeder–feeder effect (Murakami et al. 1994; Nakai
and Endoh 1995), increased ice nucleation over the
terrain (Saito et al. 1996), hydrometeor transport from
overwater ascent maxima to downstream terrain (e.g.,
Alcott and Steenburgh 2013; Campbell and Steenburgh
2017), particle sorting (Magono et al. 1966; Harimaya
and Sato 1992; Harimaya and Kanemura 1995), and
subcloud sublimation (Murakami et al. 1994; Campbell
and Steenburgh 2017). In some cases, orographic lift can
deepen the boundary layer and invigorate convection, as
has been suggested in some studies of sea effect in Japan
(Nakai et al. 1990; Saito et al. 1996). In contrast, Minder
et al. (2015) found that over the more modest Tug Hill
Plateau, downstream of Lake Ontario, most storms be-
come shallower and undergo a convective-to-stratiform
transition. Precipitation enhancement may also be pro-
duced by nonorographic factors, such as interactions of
the incipient flow with land-breeze fronts, katabatic
winds, or complexities in the downstream shoreline
(e.g., Tsuboki et al. 1989; Tachibana 1995; Steenburgh
and Campbell 2017).
Here, we focus on the interactions of a sea-effect
snowstorm with the complex topography of Japan’s
northernmost major island, Hokkaido (Fig. 1). On
Hokkaido, frequent snowfall is generated over the
northern Sea of Japan (a fetch of ;350–400 km in
northwesterly flow) during the months of December,
January, and February. Sea-effect snowstorms impact
coastal terrain features, such as the mountains of the
Shakotan Peninsula (1000–1300m MSL), the Mashike
Mountains (1000–1500m MSL), and the larger, inland
Taisetsu Mountains (1900–2100m MSL). These three
mountain ranges, made up of numerous, cone-shaped
volcanic peaks, surround the expansive Ishikari plain,
which extends east toward the Taisetsu Mountains
from Ishikari Bay and is home to the metropolis of
Sapporo.
Hokkaido’s coastal topography creates poorly un-
derstood, three-dimensional interactions with sea-effect
snowfall that make accurate forecasting of precipita-
tion distribution and amount difficult. For example, the
mountains of the Shakotan Peninsula can act as a barrier
to the incoming northerly-to-northwesterly flow of the
winter monsoon, deflecting and channeling flow into the
Ishikari plain (Kikuchi et al. 1987), an effect that has also
been observed along the coast of the Hokuriku region of
Honshu (Yoshihara et al. 2004). Additionally, conver-
gence in the lee of the coastal peaks around Ishikari Bay
sometimes forms quasi-stationary snowbands that affect
the Ishikari plain (Kikuchi et al. 1987; Fujiyoshi et al.
1992). Given the multifaceted nature of orographic ef-
fects in the region, the accurate forecasting of snowfall
timing and distribution is often difficult.
We specifically examine a sea-effect snowstorm that
impacted Hokkaido Island on 12 January 2014 (all
subsequent years are 2014 unless otherwise stated), fo-
cusing on a 6-h period (0320–0920 UTC 12 January)
when transverse-mode snowbands impacted the Ishikari
Bay region of Hokkaido’s western coast. Of particular
interest is the formation and maintenance of a quasi-
stationary, elongated region of precipitation enhance-
ment, oriented parallel to the Shakotan Peninsula but
orthogonal to the transverse-mode snowbands that pro-
gressed through it, that extended over Ishikari Bay and
into the Ishikari plain. We use radar observations from
the region and Weather Research and Forecasting
(WRF) Model simulations of the event to analyze the
mechanisms that produced the observed distribution of
snowfall. We present our data and methods in section 2,
an overview of the event and the observed reflectivity
structures around Ishikari Bay in sections 3 and 4, model
validation in section 5, and an investigation of the mech-
anisms producing these structures in sections 6 and 7.
Discussion, conclusions, and future work are presented
in section 8.
2. Data and methods
a. Observational data and analyses
To describe the broader synoptic context of the event,
we use the National Centers for Environmental Pre-
diction (NCEP) Final Operational Global Analysis
(NCEP-FNL; NCEP/NWS/NOAA/U.S. Department of
Commerce 2000) for regional upper-air and surface
analyses, visible satellite imagery from the MTSAT-2
JULY 2018 CAMPBELL ET AL . 2203
Unauthenticated | Downloaded 02/12/22 04:42 PM UTC

satellite obtained from Kochi University’s archives,
and twice-daily (0000 and 1200 UTC) upper-air sounding
data from the Japan Meteorological Agency (JMA)
operational sounding site at Sapporo. Surface observa-
tions include liquid precipitation equivalent collected
at a number of sites in the JMA Automated Meteoro-
logical DataAcquisition System (AMeDAS) network of
surface meteorological sites, as well as higher-frequency
observations of liquid precipitation equivalent collected
at 1-min intervals at the Institute for Low Temperature
Science (ILTS) at Hokkaido University, Sapporo (see
cyan dot in Fig. 1b for location). We also present hy-
drometeor size and fall speed observations from a two-
dimensional video disdrometer (2DVD) at ILTS. The
2DVD was used to determine hydrometeor type fol-
lowing equivalent-diameter-to-fall speed relations
presented in Locatelli and Hobbs (1974).
Two radars provide operational coverage of the
Ishikari plain and surrounding terrain. A JMA C-band
radar (5.6-cmwavelength; located at 43.13898N, 141.00978E)is located on the summit of a small mountain (749m
MSL) above the coastal town of Otaru (white dot in
Fig. 1b) and surveys Ishikari Bay and the northwestern
Ishikari plain, but is blocked to the southeast by the
mountains south of the Ishikari plain (Fig. 3a; hereafter
referred to as the Sapporo radar, following JMA con-
vention). Sapporo radar volume scans were georefer-
enced to latitude and longitude coordinates, factoring in a
4/3 Earth radius assumption and standard atmospheric
refraction conditions (Rinehart 1997), and were in-
terpolated to a Cartesian grid with 1.5-km horizontal
and 0.2-km vertical grid spacing for cross sections.
A dual-polarization X-band (3.1-cm wavelength) radar
overseen by the Ministry of Land, Infrastructure,
Transport and Tourism (MLIT) is located in the Ishikari
plain, southeast of Sapporo in the town of Kitahiroshima,
at an elevation of 25m MSL (located at 42.99618N,
141.58448E; red dot in Fig. 1b); it provides coverage
over the Ishikari plain and southern Ishikari Bay but
is blocked by the surrounding mountains (Fig. 3b;
hereafter referred to as the Kitahiroshima radar).
Kitahiroshima radar 1.18 elevation scans were in-
terpolated to a Cartesian grid with 310-m horizontal
grid spacing. Plan view radar reflectivity and radar-
derived precipitation-estimate composites were cre-
ated by using the highest reflectivity value of the
two radars at each overlapping grid point. Radar-
derived precipitation estimates, tuned using surface
precipitation observations from the AMeDAS net-
work, were provided by the JMA and the MLIT for the
Sapporo and Kitahiroshima radars, respectively. The
Sapporo radar was available for the entire period of
study, but the Kitahiroshima radar was only available
before 0600 UTC 12 January. Therefore, for times
before 0600 UTC, we present composite Sapporo/
Kitahiroshima reflectivity and radar-derived precipitation
accumulations, but after 0600 UTC, our analysis is
constrained to data from the Sapporo radar.
b. Numerical model simulations
We used the WRF Model version 3.8.1 with the Ad-
vanced Research core (Skamarock and Klemp 2008) to
simulate the event. All simulations use three one-way
nested domains with 12-, 4-, and 1.33-km grid spacing
FIG. 3. Beam blockage diagrams for (a) Sapporo radar and (b) Kitahiroshima radar, where gray shading rep-
resents beam-blocked areas. White dot represents location of Sapporo radar, red dot represents location of
Kitahiroshima radar, and cyan dot is the location of the ILTSmeteorological station in Sapporo. Terrain contoured
every 400m starting at 150m.
2204 MONTHLY WEATHER REV IEW VOLUME 146
Unauthenticated | Downloaded 02/12/22 04:42 PM UTC

(Fig. 4a), 40 terrain-following half-h levels with the
highest resolution in the boundary layer, and a 5000-m-deep
Rayleigh damping layer at the upper boundary. We
chose a suite of physics parameterizations from a series of
sensitivity studies that examined microphysics, planetary
boundary layer, and radiation schemes, as well as domain
configuration (not shown), and considered configurations
used in prior successful lake-effect simulations (e.g.,
Alcott and Steenburgh 2013; Reeves and Dawson 2013;
Conrick et al. 2015; McMillen and Steenburgh 2015a,b;
Campbell and Steenburgh 2017), ultimately choosing the
configuration that produced precipitation accumulations
that best matched observations. This includes the Noah
land surface model (Chen and Dudhia 2001), Thompson
cloud microphysics scheme (Thompson et al. 2008),
Yonsei University planetary boundary layer parameteri-
zation (Hong et al. 2006), revised MM5 surface layer
parameterization (Jiménez et al. 2012), Rapid Radiative
Transfer Model for GCMs (RRTMG) longwave radia-
tion scheme (Iacono et al. 2008), and Dudhia shortwave
radiation scheme (Dudhia 1989). We use the Kain–
Fritsch 2 cumulus parameterization (Kain 2004) in the
12-km domain only.
All simulations were cold-start initialized at 0600 UTC
11 January and run until 1200 UTC 12 January using
the NCEP-FNL at 18 3 18 grid spacing for initial and
lateral boundary conditions, land surface conditions,
and snow-coverage distribution at 6-h intervals. We use
the Moderate Resolution Imaging Spectroradiometer
(MODIS) International Geosphere–Biosphere Pro-
gram (IGBP) 21-category dataset for land-use charac-
teristics. Sea surface temperatures were modified to
match the daily NCEP/Marine Modeling and Analysis
Branch (MMAB) global sea surface temperature anal-
ysis for 11 and 12 January, which assimilates buoy and
ship data and satellite-retrieved sea surface tempera-
tures at half-degree resolution. We modified the MMAB
sea ice coverage manually based on inspection of MODIS
imagery in cloud-free areas during the days preceding
and following the event. The Sea of Japan was ice free
FIG. 4. (a) WRF simulation domains and (b) Control
and (c) NoTerrain simulated topography in southwest-
ern Hokkaido. Terrain color filled following scale at
bottom right and contoured every 500m. Black boxes in
(a) represent boundaries of WRF domains, and white
box in (a) represents location of (b),(c). Yellow and cyan
dots in (b) represent locations of simulated soundings
used in the study, and the white boxes denote the pe-
rimeter of 10 3 10 grid points around the dots.
JULY 2018 CAMPBELL ET AL . 2205
Unauthenticated | Downloaded 02/12/22 04:42 PM UTC

around Hokkaido Island, but we added sea ice around
Sakhalin Island, north of Hokkaido, and along the
northern Russian shoreline.
We present a simulation (NoTerrain) that is identical
to the Control simulation, except that the terrain over
all of Hokkaido Island is reduced to the elevation of
the Ishikari plain (4m MSL) in all three domains (cf.
Figs. 4b,c). Land use, snow cover, vegetation, and other
land surface characteristics in the modified terrain area
were not changed. The WRF preprocessing system did,
however, adjust the soil temperature, soil moisture, and
skin temperature based on elevation and, at the initial
time step, replaced the atmosphere where the terrain
used to be with lowest-level winds from the NCEP-FNL
and a moist adiabatic temperature profile. Given the
long (.18h) integration time before the onset of our pe-
riod of interest, as well as the similar large-scale conditions
between the Control and NoTerrain runs, we conclude
that the differences between the two runs are attribut-
able to changes in orography. The Read–Interpolate–Plot
(RIP) visualization program (Stoelinga 2009) was used to
calculate air parcel trajectories for the Control and
NoTerrain simulations.
3. Event overview
A broad upper-level trough centered over eastern
Russia and the Sea of Okhotsk produced low-level
westerly-to-northwesterly geostrophic flow over the
northern Sea of Japan for several days leading up to
12 January (not shown). Between 1200 UTC 11 January
and 0000 UTC 12 January, an upper-level short-wave
trough progressed southeastward from interior Asia
to the Pacific coast (not shown), leading to the de-
velopment of a surface trough over the Sea of Japan,
with low-level (850hPa) cold-air advection in its wake
(Figs. 5a,b). Soundings from Sapporo illustrate a deep-
ening of the boundary layer and a strengthening of the
boundary layer directional shear during this period
(cf. Figs. 6a,b). By 0300 UTC, a synoptic-scale cloud
deck associated with the upper-level trough was exiting
the region, and longitudinal- and transverse-mode bands
covered much of the Sea of Japan, the latter dominant
upstream of Hokkaido (Fig. 5c).
Radar imagery shows a broad shield of precipita-
tion associated with the synoptic-scale cloud deck at
0000 UTC 12 January (cf. Figs. 5c, 7a). This precipitation
shield progressed eastward, reaching the Ishikari plain
at ;0200 UTC (Fig. 7b) before exiting the region.
Transverse-mode bands developed over the eastern
Sea of Japan behind the synoptic-scale precipitation
shield, eventually moving over the Ishikari plain and
surrounding topography, where they predominated
FIG. 5. (a) The 0000 UTC 12 Jan NCEP-FNL mean sea level
pressure (hPa; contoured every 2 hPa) andwind barbs (full and half
barbs denote 5 and 2.5m s21, respectively); (b) 0000 UTC 12 Jan
NCEP-FNL 850-hPa temperatures (8C; contoured every 38C)and wind barbs (full and half barbs denote 5 and 2.5 m s21,
respectively); and (c) 0300 UTC 12 Jan visible satellite imagery.
Mean sea level pressure and 850-hPa temperatures smoothed using
a seven-point spectral cowbell filter (Barnes et al. 1996).
2206 MONTHLY WEATHER REV IEW VOLUME 146
Unauthenticated | Downloaded 02/12/22 04:42 PM UTC

from;0320 to 0920 UTC (Figs. 7b–d). These transverse-
mode bands, ;100km long and ;10km wide as they
approached Hokkaido’s coastline at regularly spaced
intervals, formed midway across the Sea of Japan and
were oriented roughly normal to the northwesterly low-
level boundary layer flow (e.g., Figs. 2, 5c, 7).
Between 0320 and 0600 UTC, transverse-mode
bands moving through the Ishikari Bay region in-
tensified preferentially along an elongated enhance-
ment region that began near the tip of the Shakotan
Peninsula, extended along the southern side of Ishikari
Bay, and penetrated into the southwestern Ishikari plain
(e.g., Fig. 7c). A slight backing of band orientation after
;0620 UTC shifted the zone of enhancement so that it was
oriented west–east across Ishikari Bay and extended into
the northern Ishikari plain (cf. Figs. 7c,d). By;0920 UTC,
the final set of transverse-mode bands had progressed
across the region, and convection became disorganized (not
shown), consistent with a lowering of the capping inversion
and decline in directional boundary layer wind shear shown
in the 1200 UTC 12 January Sapporo sounding (Fig. 6c).
Sapporo radar reflectivity frequencies .10dBZ from
0320 to 0600 UTC (Fig. 8) show two distinctive, quasi-
stationary regions of enhanced radar reflectivities. First,
an elongated region of high (.80%) radar echo fre-
quencies extended off Mt. Yobetsu, through Ishikari
Bay, and into the Ishikari plain. Consistent with the
radar reflectivity analyses from representative times
presented above, this feature closely paralleled the coast
of the Shakotan Peninsula from 0320 to 0600 UTC
(Fig. 8) but shifted to a more zonal orientation from
0620 to 0920 UTC (not shown), as suggested by Figs. 7c
and 7d. We hereafter refer to this region of echo en-
hancement as the ‘‘elongated enhancement region’’ for
clarity. Second, a similar banded region of precipita-
tion formed over and extended downstream from the
Mashike Mountains, north of Ishikari Bay. For brevity,
we focus the subsequent analysis on the mechanisms
that produced the elongated enhancement region and
constrain it to the 0320–0600 UTC period, when the
bands’ trajectory passed over Sapporo and the southern
Ishikari plain.
4. Radar reflectivity structures
Higher-frequency (10min) radar imagery from
0310 to 0340 UTC illustrates how the transverse-
mode bands intensified and broadened as they entered
Ishikari Bay and progressed through the elongated
enhancement region (e.g., band Y; Fig. 9), while its
vertical structure is revealed using radially oriented
cross sections of 0320–0600 UTC 10-dBZ echo fre-
quencies (Fig. 10; see inset in Fig 10a for cross-
sectional locations and Fig. 8 for plan view of radar
reflectivity frequencies). Cross section A extends
northwest from the radar along the Shakotan Peninsula
and over Mt. Yobetsu and slices through the northern end
of the elongated enhancement region (cf. Figs. 8, 10a).
Cross section B extends northeast across Ishikari Bay and
the Mashike Mountains. It slices perpendicularly across
the elongated enhancement region, which features a core
of radar reflectivity frequencies .80% that extends to
;1.5km MSL and is ;35km wide (cf. Figs. 8, 10b). A
secondary region of high radar echo frequencies,
FIG. 6. Observed (black) and Control (red) skew T–logp diagrams [temperature (8C; solid line), dewpoint (8C; dashed line), and wind
barbs (full and half barbs denote 5 and 2.5 m s21, respectively)] from Sapporo at (a) 1200 UTC 11 Jan, (b) 0000 UTC 12 Jan, and
(c) 1200 UTC 12 Jan.
JULY 2018 CAMPBELL ET AL . 2207
Unauthenticated | Downloaded 02/12/22 04:42 PM UTC

associated with the enhancement zone extending off the
Mashike Mountains, is also visible in this figure.
The above analysis illustrates that transverse-mode
bands intensified and broadened as they progressed
through Ishikari Bay and into the Ishikari plain,
forming the elongated enhancement region. To better
understand the mechanisms producing the elongated
enhancement region, we now utilize numerical simu-
lations of the event.
5. Model validation
Comparison of the Control simulation to the observed
event focuses on environmental conditions (i.e., sound-
ings), precipitation characteristics, and precipitation
accumulations. Control boundary layer temperature
profiles at Sapporo are within 1–1.58C of the available
observed profiles prior to (0000 UTC 12 January) and
following (1200 UTC 12 January) the study period, but
the simulated boundary layer is not as deep and the
capping inversion is less defined, especially at 0000
UTC (Figs. 6b,c; black lines are observed and red lines
are simulated),1 which is a common issue with WRF
simulations of events featuring sharp capping in-
versions (e.g., Coniglio et al. 2013). The Control
FIG. 7. Composite radar reflectivity (dBZ; color fill as in scale at bottom) at (a) 0000, (b) 0200, and (c) 0400 UTC
12 Jan and (d) Sapporo radar reflectivity (dBZ; color fill as in scale at bottom) at 0900 12 Jan. Terrain contoured every
400m starting at 150m and color filled with gray. Dots represent the locations of the Sapporo radar (white), ILTS
meteorological station (cyan), and Kitahiroshima radar (red).
1 Simulated soundings are averaged over a 10 3 10 gridpoint
square around the observed sounding site. For location of the
sounding site and averaging box, see cyan dot in Fig. 4b.
2208 MONTHLY WEATHER REV IEW VOLUME 146
Unauthenticated | Downloaded 02/12/22 04:42 PM UTC

boundary layer is also drier than observed at 1200
UTC 12 January, likely because the observed sound-
ing passed through a snowband, whereas the Con-
trol sounding passed through a clear region between
snowbands. A Control atmospheric profile taken
through a nearby band produces a nearly identical
temperature and moisture profile as the observed
sounding (not shown). Wind speeds and directions
are a reasonable match, with the exception of somewhat
high simulated wind speeds at 1200 UTC 12 January
(Fig. 6c).
Control produces transverse-mode bands in the
wake of the synoptic-scale precipitation shield, al-
though they are generally shorter, more isolated, and
form closer to the Hokkaido coastline than observed
(cf. Figs. 7, 11). This is consistent with the shallower
boundary layer in Control compared to observed
(Fig. 6), which could result in less directional wind
shear within the boundary layer. Despite this short-
coming, Control produces a very clear elongated en-
hancement region that affects the bands as they
progress through Ishikari Bay and Ishikari plain.
There are two distinctions that complicate the com-
parison of simulated and observed precipitation fea-
tures for these times and others: 1) the Control
reflectivity plots include echoes in regions where the
actual radars are beam blocked, so that in Control we
are able to see radar reflectivity echoes to the south-
west of Ishikari Bay, whereas in observations they
appear confined to the Ishikari Bay region, and 2) the
timing of the synoptic-scale precipitation shield’s
passage, and the subsequent formation of transverse-
mode bands in its wake, lags ;1 h behind observa-
tions. Because of this time lag, we present the Control
0420–0700 UTC period as an analog for the 0320–0600
UTC period presented in observations, a change that
is also reflected in the different times included in
Figs. 7 and 11.
Control cross sections of time–mean (0420–0700 UTC)
hydrometeor mixing ratio along the radar cross sections
presented earlier show similar patterns to the observed
10-dBZ radar echo frequency (cf. Figs. 10a,b, and 12a,b).
Specifically, in cross section A, hydrometeor mixing ra-
tios increase along the southeastern (leeward) side of
Mt. Yobetsu, where the echo frequency maximum occurs
(cf. Figs. 10a, 12a). In cross section B, the size, shape, and
location of the elongated enhancement region are well
represented, especially keeping in mind that radar echo
frequencies in Fig. 10b are not shown below;900mMSL
(cf. Figs. 10b, 12b). These similarities are also reflected in
Control precipitation accumulations, which show good
agreementwith observations and reproduce the elongated
enhancement region as well as the precipitation region
extending off the Mashike Mountains, although the
magnitude of Control accumulations is slightly smaller,
and the elongated enhancement region hugs the terrain
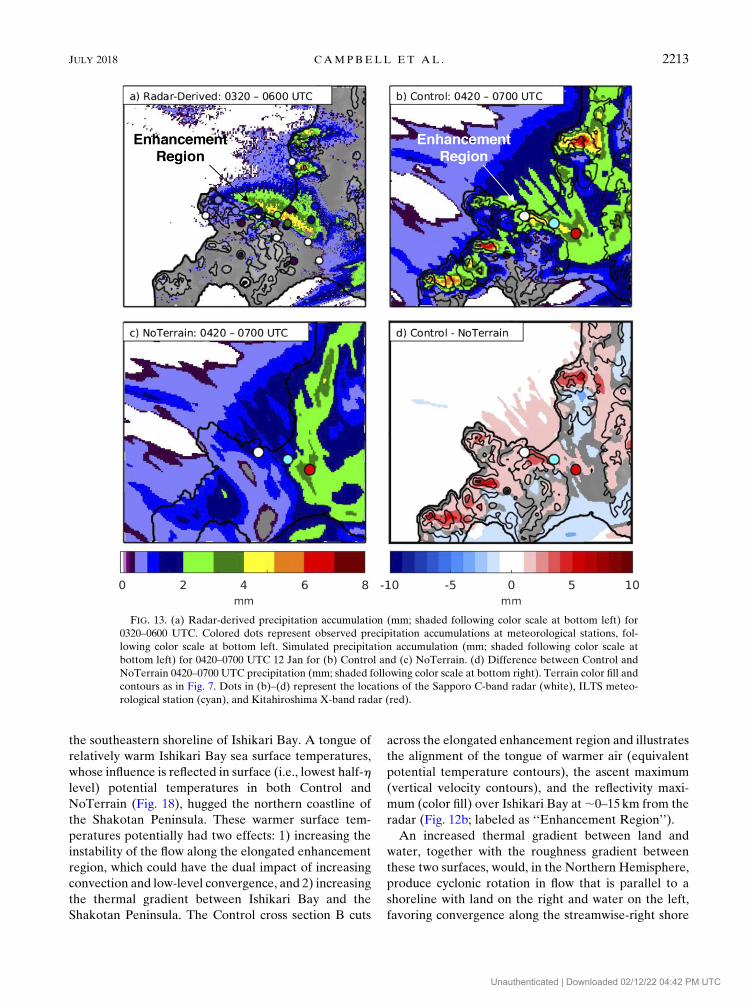
more closely than observed (cf. Figs. 13a,b). The region of
Control accumulated precipitation south of the elongated
enhancement region that does not appear in observations
is produced by the synoptic-scale precipitation shield,
which lingers longer in Control versus observations.
In summary, Control produces transverse-mode bands
during the study period in the appropriate locations,
but they are less organized and developed than ob-
served. Nevertheless, the time–mean reflectivities and
event-total precipitation distribution produce the salient
features of the event, particularly the transition in storm
characteristics over and downstream ofMt. Yobetsu and
the elongated enhancement region. We now focus
our analysis on the processes responsible for these
storm characteristics using the Control and NoTerrain
simulations.
6. Hydrometeor mass growth along the elongatedenhancement region
Control time–mean (0420–0700 UTC) surface (i.e.,
lowest half-h level) divergence fields show a persistent
FIG. 8. Composite radar echo frequency.10 dBZ (%; shaded
following color scale at bottom) for 0320–0600 UTC 12 Jan,
with locations of radar cross sections A and B superimposed as
black lines. Dots represent the locations of the Sapporo radar
(white), ILTS meteorological station (cyan), and Kitahiroshima
radar (red). Terrain color fill and contours as in Fig. 7.
JULY 2018 CAMPBELL ET AL . 2209
Unauthenticated | Downloaded 02/12/22 04:42 PM UTC

region of convergence along the elongated enhance-
ment region (Fig. 14a). Control 900-mMSL ascent fields
show two areas of strong ascent along this convergence
zone (Fig. 14b): off the northwest slope of Mt. Yobetsu
(labeled 1), which is windward with respect to the
northwesterly low-level flow, and around Pt. Takashima
(labeled 2), particularly offshore and across the Ishikari
plain shoreline. A 0440 UTC Control sounding, taken
;100 km northwest of the Shakotan Peninsula and av-
eraged over a square of 103 10 grid points (for location
FIG. 9. Sapporo C-band 0.358-scan radar reflectivity (dBZ; color fill following scale at bottom), at (a) 0310,
(b) 0320, (c) 0330, and (d) 0340 UTC 12 Jan. Terrain color fill and contours as in Fig. 7. For location of area
shown, see inset in (a).
FIG. 10. Frequency of Sapporo radar echoes .10 dBZ (%; color fill following color bar at bottom) along
(a) cross section A and (b) cross section B for 0320–0600 UTC 12 Jan. For locations of cross sections, see
inset in (a).
2210 MONTHLY WEATHER REV IEW VOLUME 146
Unauthenticated | Downloaded 02/12/22 04:42 PM UTC

of sounding, see yellow dot in Fig. 4b), shows a vertical
profile of the simulated winds, boundary layer depth,
and stability upstream of western Hokkaido (Fig. 15).
Directional shear predominated throughout the study
period, with northwesterly low-level (i.e., ,;1300m
MSL) time–mean winds (Figs. 14a, 15) and southwest-
erly time–meanwinds near the top of the boundary layer
(.;1300m MSL; Figs. 14b, 15).
The primary mass growth and loss terms in Control,
which uses the Thompson microphysics scheme, are posi-
tive rates of ‘‘vapor deposition onto snow’’ (hereafter de-
position), negative rates of ‘‘vapor deposition onto snow’’
(hereafter sublimation), and ‘‘snow collecting cloud liquid
water’’ (hereafter accretion). Deposition and accretion
rates both maximize at a height of ;1200m MSL (not
shown) within ascent regions 1 and 2 (cf. Figs. 14b, 16a,b),
increasing hydrometeor mass along the elongated en-
hancement region, while subcloud sublimation reduced
hydrometeor mass over Ishikari Bay and the lowlands, as
well as to the lee (southeast) ofMt. Yobetsu (Fig. 16c). The
location of ascent region 2, along with the collocated de-
position and accretion maxima, is consistent with the ob-
served increase in radar echo frequencies, as well as the
simulated increase in hydrometeor mixing ratio that occurs
within the elongated enhancement region downstream of
Pt. Takashima (e.g., Figs. 7, 8, 11). These two ascent regions
are, therefore, critical to forming and sustaining the elon-
gated enhancement region. The dominance of depositional
growth in Control, which produced an average hydrome-
teor mass over the Ishikari Bay region that was 99%
FIG. 11. Control 875-mMSL reflectivity (dBZ; color fill as in scale at bottom) at (a) 0300, (b) 0500, (c) 0600, and
(d) 0700 UTC 12 Jan. Terrain color fill and contours as in Fig. 7. Black shading represents terrain that rises above
875mMSL. Dots represent the locations of the Sapporo C-band radar (white), ILTSmeteorological station (cyan),
and Kitahiroshima X-band radar (red).
JULY 2018 CAMPBELL ET AL . 2211
Unauthenticated | Downloaded 02/12/22 04:42 PM UTC

snow and 1% graupel, is similar to ratios seen in lake-effect
simulations over the Great Lakes (e.g., Campbell and
Steenburgh 2017). It is also consistent with observations,
where particles observed at ILTS with the 2DVD were,
on average, 92% aggregate or dendritic forms and 8%
lightly rimed particles or graupel (not shown).
Although ascent is strong within regions 1 and 2, as-
cent, deposition, and accretion rates are relatively weak
along the curving portion of the elongated enhancement
region that can be seen in Figs. 8 and 13a, extending off
Mt. Yobetsu. Hydrometeor trajectories ending in this
section, displayed with time–mean (0420–0700 UTC)
1200-m deposition (black contours) and accumulated
precipitation (color fill; Fig. 17a), illustrate how
the simulated distribution of hydrometeor mass growth
and loss could sustain continued precipitation enhance-
ment along this zone. The hydrometeor trajectories pre-
sented here use three-dimensional grid-resolved winds at
10-min intervals, where the vertical component factors
in the hydrometeor fall speed at each grid point, output
from the Thompson cloud microphysics scheme, in ad-
dition to the vertical air velocity. These trajectories be-
gin aloft in the southwesterly flow above ;1500m (see
Figs. 14 and 15 for wind directions) and pass through
the deposition maximum over the northwest slope of
Mt. Yobetsu (cf. Figs. 17a,c), curving as they fall into the
low-level northwesterly flow. This yields a clockwise-
turning pattern of accumulated precipitation at the
surface. At the same time, some hydrometeor mass loss
due to sublimation occurs near the surface over the
water and low-elevation terrain (negative deposition
rates in Fig. 17c represent sublimation). Therefore, hy-
drometeor advection from the primary deposition and
accretion maxima windward of Mt. Yobetsu, along
clockwise-turning trajectories steered by the bound-
ary layer directional shear, is a likely contributor to
the sustained enhancement of precipitation along
the elongated enhancement region, in concert with the
increased hydrometeor growth produced in ascent re-
gions 1 and 2.
7. Mechanisms contributing to convergence alongthe elongated enhancement region
We can use the Control and NoTerrain simulations
to determine if the elongated enhancement zone is
formed by the orography around the Ishikari Bay
region or if there are other contributing factors.
Comparing the Control and NoTerrain accumulated
precipitation reveals that NoTerrain produces less pre-
cipitation overall than Control, notably along the elon-
gated enhancement region (cf. Figs. 13b,c and 13d),
although it does exhibit some similar precipitation ac-
cumulation patterns, such as a precipitation maxi-
mum in the Ishikari plain. North of the Ishikari plain,
NoTerrain precipitation accumulations do increase
just downstream of the shoreline, which is most likely an
effect of the change in surface roughness between water
and land.
Notably, the convergence zone along the primary axis of
the elongated enhancement region is very similar in both
runs, although the magnitude of convergence is stronger
in Control than in NoTerrain and is shifted slightly south
in NoTerrain (cf. Figs. 14a,c). The 900-m vertical veloci-
ties along the elongated enhancement region, however,
are markedly reduced in NoTerrain (cf. Figs. 14b,d). The
strongest ascent maxima in NoTerrain are instead
located along the shoreline north of Ishikari plain.
This suggests that there is a mechanism other than
orography that is producing convergence along the
elongated enhancement region.
As low-level northwesterly flow crossed the Sea
of Japan, it was warmed by sensible and latent heat
fluxes and reached its warmest temperature around
FIG. 12. Control time–mean (0420–0700 UTC 12 Jan) frequency of radar reflectivity values$20 dBZ (%; shaded
following color bar at bottom), positive vertical velocity (black contours at 0.4m s21 intervals), equivalent potential
temperature (K; gray contours at 0.5-K intervals), and cross-section-parallel wind vectors (components are vertical
velocity and cross-section-parallel horizontal wind) along (a) cross section A and (b) cross section B. Scaled as in
inset in upper right of (b). For locations of cross sections, see inset in (a).
2212 MONTHLY WEATHER REV IEW VOLUME 146
Unauthenticated | Downloaded 02/12/22 04:42 PM UTC
the southeastern shoreline of Ishikari Bay. A tongue of
relatively warm Ishikari Bay sea surface temperatures,
whose influence is reflected in surface (i.e., lowest half-h
level) potential temperatures in both Control and
NoTerrain (Fig. 18), hugged the northern coastline of
the Shakotan Peninsula. These warmer surface tem-
peratures potentially had two effects: 1) increasing the
instability of the flow along the elongated enhancement
region, which could have the dual impact of increasing
convection and low-level convergence, and 2) increasing
the thermal gradient between Ishikari Bay and the
Shakotan Peninsula. The Control cross section B cuts
across the elongated enhancement region and illustrates
the alignment of the tongue of warmer air (equivalent
potential temperature contours), the ascent maximum
(vertical velocity contours), and the reflectivity maxi-
mum (color fill) over Ishikari Bay at;0–15km from the
radar (Fig. 12b; labeled as ‘‘Enhancement Region’’).
An increased thermal gradient between land and
water, together with the roughness gradient between
these two surfaces, would, in the Northern Hemisphere,
produce cyclonic rotation in flow that is parallel to a
shoreline with land on the right and water on the left,
favoring convergence along the streamwise-right shore
FIG. 13. (a) Radar-derived precipitation accumulation (mm; shaded following color scale at bottom left) for
0320–0600 UTC. Colored dots represent observed precipitation accumulations at meteorological stations, fol-
lowing color scale at bottom left. Simulated precipitation accumulation (mm; shaded following color scale at
bottom left) for 0420–0700 UTC 12 Jan for (b) Control and (c) NoTerrain. (d) Difference between Control and
NoTerrain 0420–0700 UTC precipitation (mm; shaded following color scale at bottom right). Terrain color fill and
contours as in Fig. 7. Dots in (b)–(d) represent the locations of the Sapporo C-band radar (white), ILTS meteo-
rological station (cyan), and Kitahiroshima X-band radar (red).
JULY 2018 CAMPBELL ET AL . 2213
Unauthenticated | Downloaded 02/12/22 04:42 PM UTC

and divergence along the streamwise-left shore of a lake
or bay (e.g., Alestalo and Savijärvi 1985; Markowski and
Richardson 2010). This effect has been identified, for
example, in numerical simulations of a lake-effect storm
over Lake Ontario (Steenburgh and Campbell 2017). In
this case, the cyclonic rotation of the flow along the
northeastern shoreline of the Shakotan Peninsula, which
is the streamwise-right shore of Ishikari Bay, would add
to convergence along the elongated enhancement re-
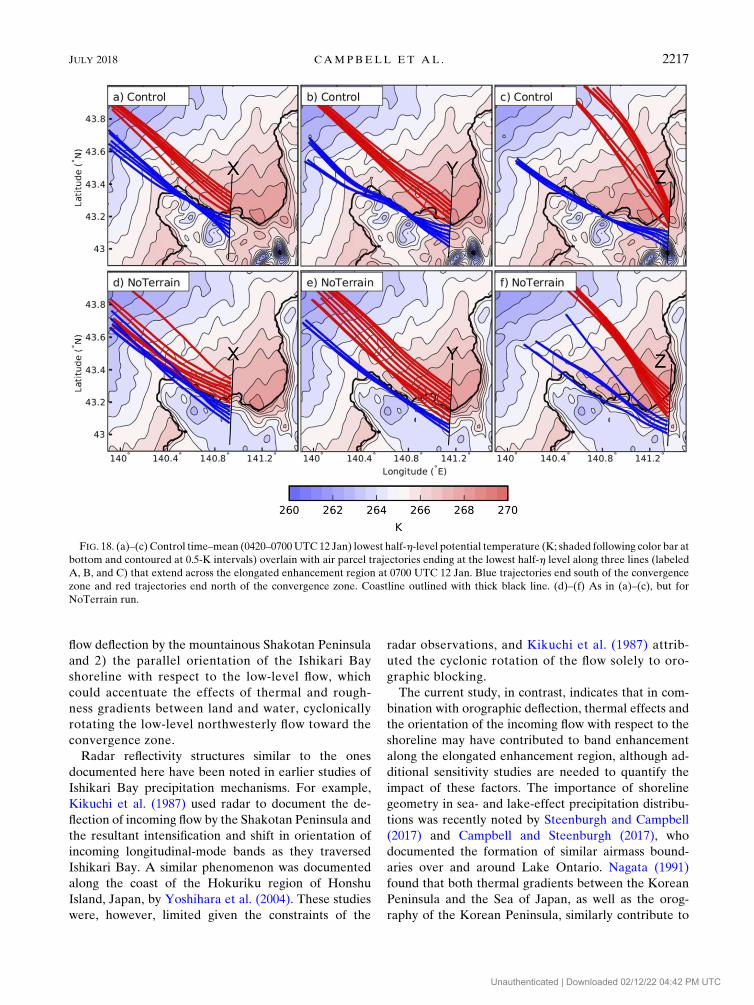
gion. This is illustrated with air parcel trajectories end-
ing along three transects cutting across the elongated
enhancement region, shown in Fig. 18. Here, blue tra-
jectories represent flow on the south side of the con-
vergence zone, and red trajectories represent flow on
the north side. Control trajectories over the Shakotan
Peninsula gradually turn toward Ishikari Bay, contrib-
uting to convergence along the elongated enhancement
region. Although this cyclonic rotation is most distinct
in Control, NoTerrain trajectories also rotate toward
Ishikari Bay but turn more gradually, so that they con-
verge farther south than in Control (cf. Figs. 18b,c and
18e,f), producing the slight southward shift of the con-
vergence zone in NoTerrain (cf. Figs. 14a,c). These
findings suggest that convergence along the elongated
enhancement region is not only produced by the orog-
raphy of the Shakotan Peninsula, as might be initially
assumed, but is also partially a product of the orientation
of the shoreline with respect to the prevailing flow and
convergence driven by thermal and roughness gradients
between land and water.
Control’s more extensive region of ascent over Ishikari
Bay and Ishikari plain, as compared to NoTerrain
(cf. Figs. 14b,d); the stronger and more defined nature
of the elongated enhancement region in Control
(cf. Figs. 14a,c); and the behavior of air parcel trajectories
as they traverse the Shakotan Peninsula (e.g., Fig. 18b),
FIG. 14. Control time–mean (0420–0700 UTC 12 Jan) (a) lowest half-h-level divergence [s21, 31025; shaded
following color bar at left. Values less than 0 (purple shading) indicate convergence, and values greater than
0 (green shading) indicate divergence] and lowest half-h-level wind vectors. (b) Control time–mean (0420–0700 UTC
12 Jan) 900-m MSL vertical velocity (m s21; shaded following color bar at right) and 1800-m MSL wind vectors.
(c),(d) As in (a),(b), but for NoTerrain. Note different vector scales between (a),(c) and (b),(d). Divergence and
potential temperature smoothed using a seven-point spectral cowbell filter (Barnes et al. 1996). Terrain contoured
every 400m starting at 150m.
2214 MONTHLY WEATHER REV IEW VOLUME 146
Unauthenticated | Downloaded 02/12/22 04:42 PM UTC

however, indicate that orography still provides an impor-
tant contribution to convergence along the elongated
enhancement region. The use of indices such as the
Froude number or nondimensional mountain height H
to diagnose flow blocking is difficult in a situation such as
this, with a nonuniform profile of moisture, wind, and
stability impinging on a region of complex topography
(e.g., Reinecke and Durran 2008). However, we do ex-
amine the stability of a simulated atmospheric profile,
taken ;100km northwest of Mt. Yobetsu at 0440 UTC
(Fig. 15). While this profile is potentially unstable below
;300m MSL, it has a bulk Brunt–Väisälä frequency of
0.0054 s21 (calculated following Reinecke and Durran
2008) and an average wind speed of 12.9ms21 between
the surface and 1595m (slightly above crest level
but within the capping inversion). This yields a non-
dimensionalmountain height of 0.67when these values are
used with a mountain height of 1595m. Values much
smaller than unity generally indicate a tendency toward
flow deflection, but this value is near unity, indicating the
possibility of both orographically forced flow deflection
and ascent. These findings are consistent with the presence
of both the ascent maxima found along the northwest-
facing aspects of the terrain along the Shakotan Peninsula
(Fig. 14b) and the deflection of flow by the Shakotan
Peninsula’s orography toward the elongated enhancement
region (cf. Figs. 14a,c; cf. Figs. 18a–c and 18d–f).
These results indicate that the elongated enhance-
ment region is produced by both nonorographic and
orographic factors. Western Hokkaido’s shoreline ge-
ometry, in particular the concave shape of Ishikari Bay
and the orientation of the Shakotan Peninsula on the
streamwise-right side of the low-level flow, adds to
convergence along the elongated enhancement region
due to thermal and roughness gradients between land
and water, and these effects are accentuated by the de-
flection of flow by the Shakotan Peninsula’s orography.
8. Summary and conclusions
This study used observations and WRF simulations
to examine the radar reflectivity structures and pre-
cipitation distribution patterns produced by the in-
teractions of a transverse-mode sea-effect storm with
the complex geography of western Hokkaido Island,
Japan. Our analysis shows that both orographic and
nonorographic effects around Hokkaido’s shoreline
contributed to the observed precipitation distribution.
FIG. 15. (a) Control skewT–logp diagram [temperature (8C; black solid line), dewpoint (8C; red dashed line), and
wind barbs (full and half barbs denote 5 and 2.5m s21, respectively)] from an atmospheric profile taken ;100 km
northwest of the Shakotan Peninsula and averaged over a 10 3 10 square of grid points at 0440 UTC 12 Jan.
(b) Potential temperature (K; black line) and equivalent potential temperature (K; red dashed line) from the same
profile as in (a).
JULY 2018 CAMPBELL ET AL . 2215
Unauthenticated | Downloaded 02/12/22 04:42 PM UTC

Regularly spaced transverse-mode bands, oriented
roughly perpendicular to the northwesterly low-level
boundary layer flow, impacted Hokkaido’s Ishikari Bay
region between 0320 and 0920 UTC 12 January 2014.
The bands were;100 km long and;10km wide as they
entered Ishikari Bay, and they intensified and broad-
ened along a quasi-stationary, elongated enhancement
region that began near Mt. Yobetsu, extended along the
southern side of Ishikari Bay, and penetrated into the
Ishikari plain.
Simulated hydrometeor mass growth along the elon-
gated enhancement region primarily occurred within
twomajor regions of ascent: 1) along the northeast slope
of Mt. Yobetsu and 2) near Pt. Takashima along the
Ishikari Bay shoreline. Hydrometeor advection through
the first ascent region, and along clockwise-turning tra-
jectories steered by the boundary layer directional
shear, contributed to sustained precipitation enhance-
ment along a curving portion of the elongated enhance-
ment region downstream of Mt. Yobetsu. Hydrometeor
mass growth in the second ascent region intensified
echoes as they passed Pt. Takashima and continued
into Ishikari Bay and the Ishikari plain. We identify
two potential contributors to the convergence zone
that sustained hydrometeor mass growth along the
elongated enhancement region: 1) low-level orographic
FIG. 16. Time–mean (0420–0700UTC 12 Jan) hydrometeor mass
tendencies: (a) 1200-m deposition, (b) 1200-m accretion, and
(c) lowest half-h-level sublimation (g kg21 s21, 31024; shaded
following color bars at right), smoothed using a seven-point
spectral cowbell filter (Barnes et al. 1996). White shading de-
notes values of zero for the relevant tendency. Terrain con-
toured every 400 m starting at 150 m, and coastline contoured
with blue line.
FIG. 17. (a) Control time–mean (0420–0700UTC 12 Jan) 1200-m
deposition rate [contoured every 0.3 3 1024 g kg21 s21 starting at
1.2 3 1024 g kg21 s21 and smoothed using a seven-point spectral
cowbell filter (Barnes et al. 1996)] and accumulated precipitation
(mm; color fill following color bar at bottom) overlain with hy-
drometeor trajectories (colored lines) ending along the elongated
enhancement region at 0600 UTC 12 Jan. Terrain color filled
in gray. For location of area shown, see inset in (a). (b) Height
(m MSL) and (c) deposition (positive values) and sublimation
(negative values) rate (g kg21 s21, 31024) of hydrometeor trajec-
tories shown in (a).
2216 MONTHLY WEATHER REV IEW VOLUME 146
Unauthenticated | Downloaded 02/12/22 04:42 PM UTC
flow deflection by the mountainous Shakotan Peninsula
and 2) the parallel orientation of the Ishikari Bay
shoreline with respect to the low-level flow, which
could accentuate the effects of thermal and rough-
ness gradients between land and water, cyclonically
rotating the low-level northwesterly flow toward the
convergence zone.
Radar reflectivity structures similar to the ones
documented here have been noted in earlier studies of
Ishikari Bay precipitation mechanisms. For example,
Kikuchi et al. (1987) used radar to document the de-
flection of incoming flow by the Shakotan Peninsula and
the resultant intensification and shift in orientation of
incoming longitudinal-mode bands as they traversed
Ishikari Bay. A similar phenomenon was documented
along the coast of the Hokuriku region of Honshu
Island, Japan, by Yoshihara et al. (2004). These studies
were, however, limited given the constraints of the
radar observations, and Kikuchi et al. (1987) attrib-
uted the cyclonic rotation of the flow solely to oro-
graphic blocking.
The current study, in contrast, indicates that in com-
bination with orographic deflection, thermal effects and
the orientation of the incoming flow with respect to the
shoreline may have contributed to band enhancement
along the elongated enhancement region, although ad-
ditional sensitivity studies are needed to quantify the
impact of these factors. The importance of shoreline
geometry in sea- and lake-effect precipitation distribu-
tions was recently noted by Steenburgh and Campbell
(2017) and Campbell and Steenburgh (2017), who
documented the formation of similar airmass bound-
aries over and around Lake Ontario. Nagata (1991)
found that both thermal gradients between the Korean
Peninsula and the Sea of Japan, as well as the orog-
raphy of the Korean Peninsula, similarly contribute to
FIG. 18. (a)–(c) Control time–mean (0420–0700UTC 12 Jan) lowest half-h-level potential temperature (K; shaded following color bar at
bottom and contoured at 0.5-K intervals) overlain with air parcel trajectories ending at the lowest half-h level along three lines (labeled
A, B, and C) that extend across the elongated enhancement region at 0700 UTC 12 Jan. Blue trajectories end south of the convergence
zone and red trajectories end north of the convergence zone. Coastline outlined with thick black line. (d)–(f) As in (a)–(c), but for
NoTerrain run.
JULY 2018 CAMPBELL ET AL . 2217
Unauthenticated | Downloaded 02/12/22 04:42 PM UTC

the formation of the JPCZ along the Eurasian coast of
the Sea of Japan. It is probable that similar thermal
gradients form in other sea- and lake-effect regions with
complex shoreline geometries and contribute to many
of the observed precipitation features and distribution
patterns found during these events.
These findings highlight the importance of relatively
subtle influences of shoreline topography on the distri-
bution of precipitation produced by sea-effect events
and will help improve the forecasting of these events in
the future by providing a basic framework with which to
consider the potential impacts of orography and shore-
line configuration around the downstream shoreline.
Future work should include a detailed sensitivity study
examining the specific role of thermal and roughness
gradients in this event, along with a climatological as-
sessment of orographic and coastline impacts. The im-
pact of orography and shoreline geometry, both in
Japan and in other sea- and lake-effect regions, should
be examined using idealized modeling frameworks in
order to test these hypotheses more thoroughly. Future
observational studies could be improved by the de-
ployment of additional high-quality precipitation
gauges and meteorological stations in more remote
regions of Hokkaido.
Acknowledgments. Comments from Justin Minder,
Bart Geerts, John Horel, Ed Zipser, Sarah Bang, Peter
Veals, Tyler West, and three anonymous reviewers im-
proved the manuscript. Tom Gowan provided valuable
assistance with calculating hydrometeor trajectories.
We thank the University of Utah Center for High Per-
formance Computing, the University of Hokkaido, the
JMA, and NCEP for the provision of datasets, software,
and/or computer time and services. This material is
based upon work supported by the Japan Society for the
Promotion of Science and the following National Sci-
ence Foundation grants: AGS-1635654, AGS-1262090,
and IIA-1414430. Any opinions, findings, conclusions,
or recommendations expressed are those of the authors
and do not necessarily reflect the views of the National
Science Foundation.
REFERENCES
Alcott, T. I., and W. J. Steenburgh, 2013: Orographic influences
on a Great Salt Lake–effect snowstorm.Mon. Wea. Rev., 141,
2432–2450, https://doi.org/10.1175/MWR-D-12-00328.1.
Alestalo, M., and H. Savijärvi, 1985: Mesoscale circulations in
a hydrostatic model: Coastal convergence and orographic
lifting. Tellus, 37A, 156–162, https://doi.org/10.1111/j.1600-
0870.1985.tb00277.x.
Asai, T., 1970: Stability of a plane parallel flow with variable ver-
tical shear and unstable stratification. J. Meteor. Soc. Japan,
48, 129–139, https://doi.org/10.2151/jmsj1965.48.2_129.
——, 1972: Thermal instability of a shear flow turning the direction
with height. J. Meteor. Soc. Japan, 50, 525–532, https://doi.org/
10.2151/jmsj1965.50.6_525.
Barnes, S. L., F. Caracena, and A. Marroquin, 1996: Extracting
synoptic-scale diagnostic information from mesoscale models:
The etamodel, gravitywaves, and quasigeostrophic diagnostics.
Bull. Amer. Meteor. Soc., 77, 519–528, https://doi.org/10.1175/
1520-0477(1996)077,0519:ESSDIF.2.0.CO;2.
Byrd, G. P., R. A. Anstett, J. E. Heim, and D. M. Usinski, 1991:
Mobile sounding observations of lake-effect snowbands in
western and central New York. Mon. Wea. Rev., 119, 2323–2332,
https://doi.org/10.1175/1520-0493(1991)119,2323:MSOOLE.2.0.
CO;2.
Campbell, L. S., and W. J. Steenburgh, 2017: The OWLeS IOP2b
lake-effect snowstorm: Mechanisms contributing to the Tug
Hill precipitation maximum.Mon. Wea. Rev., 145, 2461–2478,
https://doi.org/10.1175/MWR-D-16-0461.1.
Chang, S. S., and R. R. Braham, 1991: Observational study of a con-
vective internal boundary layer overLakeMichigan. J.Atmos. Sci.,
48, 2265–2279, https://doi.org/10.1175/1520-0469(1991)048,2265:
OSOACI.2.0.CO;2.
Chen, F., and J. Dudhia, 2001: Coupling an advanced land surface–
hydrology model with the Penn State–NCAR MM5 modeling
system. Part II: Preliminary model validation. Mon. Wea. Rev.,
129, 587–604, https://doi.org/10.1175/1520-0493(2001)129,0587:
CAALSH.2.0.CO;2.
Coniglio, M. C., J. Correia, P. T. Marsh, and F. Kong, 2013: Veri-
fication of convection-allowing WRF Model forecasts of the
planetary boundary layer using sounding observations. Wea.
Forecasting, 28, 842–862, https://doi.org/10.1175/WAF-D-12-
00103.1.
Conrick, R., H. D. Reeves, and S. Zhong, 2015: The dependence
of QPF on the choice of boundary- and surface-layer parame-
terization for a lake-effect snowstorm. J. Appl. Meteor. Climatol.,
54, 1177–1190, https://doi.org/10.1175/JAMC-D-14-0291.1.
Dudhia, J., 1989: Numerical study of convection observed during the
WinterMonsoonExperiment using amesoscale two-dimensional
model. J. Atmos. Sci., 46, 3077–3107, https://doi.org/10.1175/
1520-0469(1989)046,3077:NSOCOD.2.0.CO;2.
Eito, H., T. Kato, M. Yoshizaki, and A. Adachi, 2005: Numerical
simulation of the quasi- stationary snowband observed over
the southern coastal area of the Sea of Japan on 16 January
2001. J. Meteor. Soc. Japan, 83, 551–576, https://doi.org/
10.2151/jmsj.83.551.
——, M. Murakami, C. Muroi, T. Kato, S. Hayashi, H. Kuroiwa,
and M. Yoshizaki, 2010: The structure and formation mecha-
nism of transversal cloud bands associated with the Japan-Sea
polar-airmass convergence zone. J. Meteor. Soc. Japan, 88,
625–648, https://doi.org/10.2151/jmsj.2010-402.
Ellis, A. W., and J. J. Johnson, 2004: Hydroclimatic analysis of
snowfall trends associated with the North American Great
Lakes. J. Hydrometeor., 5, 471–486, https://doi.org/10.1175/
1525-7541(2004)005,0471:HAOSTA.2.0.CO;2.
Fujiyoshi, Y., K. Tsuboki, S. Satoh, and G. Wakahama, 1992:
Three-dimensional radar echo structure of a snow band
formed on the lee side of amountain. J.Meteor. Soc. Japan, 70,
11–24, https://doi.org/10.2151/jmsj1965.70.1_11.
Harimaya, T., and M. Satol, 1992: The riming proportion in snow
particles falling on coastal areas. J. Meteor. Soc. Japan, 70,
57–65, https://doi.org/10.2151/jmsj1965.70.1_57.
——, and N. Kanemura, 1995: Comparison of the riming growth of
snow particles between coastal and inland areas. J. Meteor. Soc.
Japan, 73, 25–36, https://doi.org/10.2151/jmsj1965.73.1_25.
2218 MONTHLY WEATHER REV IEW VOLUME 146
Unauthenticated | Downloaded 02/12/22 04:42 PM UTC

Hong, S.-Y., Y. Noh, and J. Dudhia, 2006: A new vertical diffusion
package with an explicit treatment of entrainment processes.Mon.
Wea. Rev., 134, 2318–2341, https://doi.org/10.1175/MWR3199.1.
Hozumi,K., andC.Magono,1984:Thecloudstructureof convergent cloud
bands over the Japan Sea in winter monsoon period. J. Meteor. Soc.
Japan, 62, 522–533, https://doi.org/10.2151/jmsj1965.62.3_522.
Iacono, M. J., J. S. Delamere, E. J. Mlawer, M. W. Shephard, S. A.
Clough, and W. D. Collins, 2008: Radiative forcing by long-
lived greenhouse gases: Calculations with the AER radiative
transfermodels. J. Geophys. Res., 113, D13103, https://doi.org/
10.1029/2008JD009944.
Jiménez, P. A., J. Dudhia, J. F. González-Rouco, J. Navarro, J. P.
Montávez, and E. García- Bustamante, 2012: A revised scheme
for the WRF surface layer formulation. Mon. Wea. Rev., 140,
898–918, https://doi.org/10.1175/MWR-D-11-00056.1.
Kain, J. S., 2004: The Kain–Fritsch convective parameterization:
An update. J. Appl. Meteor., 43, 170–181, https://doi.org/
10.1175/1520-0450(2004)043,0170:TKCPAU.2.0.CO;2.
Katsumata, M., H. Uyeda, and K. Kikuchi, 1998: Characteristics
of a cloud band off the west coast of Hokkaido Island as de-
termined from AVHRR/NOAA, SSM/I and radar data.
J. Meteor. Soc. Japan, 76, 169–189, https://doi.org/10.2151/
jmsj1965.76.2_169.
Kawase, H., M. Hara, T. Yoshikane, N. N. Ishizaki, F. Uno,
H. Hatsushika, and F. Kimura, 2013: Altitude dependency of
future snow cover changes over central Japan evaluated by a
regional climate model. J. Geophys. Res. Atmos., 118, 12 444–
12 457, https://doi.org/10.1002/2013JD020429.
Kelly, R. D., 1982: A single Doppler radar study of horizontal-roll
convection in a lake-effect snow storm. J. Atmos. Sci., 39,
1521–1531, https://doi.org/10.1175/1520-0469(1982)039,1521:
ASDRSO.2.0.CO;2.
——, 1984: Horizontal roll and boundary-layer interrelationships
observed over Lake Michigan. J. Atmos. Sci., 41, 1816–
1826, https://doi.org/10.1175/1520-0469(1984)041,1816:
HRABLI.2.0.CO;2.
Kikuchi, K., S. Azumane, M. Murakami, and T. Taniguchi, 1987:
Precipitating snow clouds during winter monsoon seasons
influenced by topography of the Shakotan Peninsula, Hokkaido
Island, Japan (SHAROP).Environ. Sci. Hokkaido, 10, 109–128.
Kristovich, D. A. R., 1993: Mean circulations of boundary-layer
rolls in lake-effect snow storms. Bound.-Layer Meteor., 63,
293–315, https://doi.org/10.1007/BF00710463.
——, and Coauthors, 2017: The Ontario Winter Lake-effect Sys-
tems (OWLeS) field campaign: Scientific and educational
adventures to further our knowledge and prediction of lake-
effect storms. Bull. Amer. Meteor. Soc., 98, 315–332, https://
doi.org/10.1175/BAMS-D-15-00034.1.
Laird, N. F., J. Desrochers, and M. Payer, 2009: Climatology
of lake-effect precipitation events over Lake Champlain.
J. Appl. Meteor. Climatol., 48, 232–250, https://doi.org/
10.1175/2008JAMC1923.1.
Locatelli, J. D., and P. V. Hobbs, 1974: Fall speeds and masses of
solid precipitation particles. J. Geophys. Res., 79, 2185–2197,
https://doi.org/10.1029/JC079i015p02185.
Magono, C., K. Kikuchi, T. Kimura, S. Tazawa, and T. Kasai, 1966:
A study on the snowfall in the winter monsoon season in
Hokkaido with special reference to low land snowfall. J. Fac.
Sci. Hokkaido Univ. Ser. 7, 2, 287–308.
Markowski, P., and Y. Richardson, 2010: Mesoscale Meteorology
in Midlatitudes. Wiley-Blackwell, 407 pp.
McMillen, J. D., and W. J. Steenburgh, 2015a: Impact of micro-
physics parameterizations on simulations of the 27 October
2010 Great Salt Lake–effect snowstorm.Wea. Forecasting, 30,
136–152, https://doi.org/10.1175/WAF-D-14-00060.1.
——, and ——, 2015b: Capabilities and limitations of convection-
permitting WRF simulations of lake-effect systems over the
Great Salt Lake.Wea. Forecasting, 30, 1711–1731, https://doi.org/
10.1175/WAF-D-15-0017.1.
Minder, J. R., T. W. Letcher, L. S. Campbell, P. V. Veals, andW. J.
Steenburgh, 2015: The evolution of lake-effect convection
during landfall and orographic uplift as observed by profiling
radars. Mon. Wea. Rev., 143, 4422–4442, https://doi.org/
10.1175/MWR-D-15-0117.1.
Miura, Y., 1986: Aspect ratios of longitudinal rolls and convection
cells observed during cold air outbreaks. J. Atmos. Sci., 43,
26–39, https://doi.org/10.1175/1520-0469(1986)043,0026:
AROLRA.2.0.CO;2.
Murakami, M., T. L. Clark, and W. D. Hall, 1994: Numerical
simulations of convective snow clouds over the Sea of Japan;
Two-dimensional simulations ofmixed layer development and
convective snow cloud formation. J. Meteor. Soc. Japan, 72,
43–62, https://doi.org/10.2151/jmsj1965.72.1_43.
——, Y. Yamada, T. Matsuo, K. Iwanami, J. D. Marwitz, and
G. Gordon, 2003: The precipitation process in convective cells
embedded in deep snow bands over the Sea of Japan. J. Meteor.
Soc. Japan, 81, 515–531, https://doi.org/10.2151/jmsj.81.515.
Nagata, M., 1991: Further numerical study on the formation of
the convergent cloud band over the Japan Sea in winter.
J. Meteor. Soc. Japan, 69, 419–428, https://doi.org/10.2151/
jmsj1965.69.3_419.
Nakai, S., and T. Endoh, 1995: Observation of snowfall and airflow
over a low mountain barrier. J. Meteor. Soc. Japan, 73, 183–
199, https://doi.org/10.2151/jmsj1965.73.2_183.
——, M. Maki, and T. Yagi, 1990: Doppler radar observation of
orographic modification of snow clouds- A case of enhanced
snowfall. Report of the National Research Institute for Earth
Science and Disaster Prevention, 45, 1–16.
——, K. Iwanami, R. Misumi, S. Park, M. Shimizu, and
T. Kobayashi, 2003: Relation between snow-cloud mode and
snowfall distribution observed in central Niigata prefecture.
Report of the National Research Institute for Earth Science and
Disaster Prevention, 64, 9–17.
——, ——, ——, ——, and T. Kobayashi, 2005: A classifica-
tion of snow clouds by Doppler radar observations at
Nagaoka, Japan. SOLA, 1, 161–164, https://doi.org/10.2151/
sola.2005-042.
NCEP/NWS/NOAA/U.S. Department of Commerce, 2000: NCEP
FNL Operational Model Global Tropospheric Analyses,
continuing from July 1999. NCAR–UCAR Research Data
Archive at Computational and Information Systems Lab-
oratory, accessed 25 March 2017, https://doi.org/10.5065/
D6M043C6.
Niziol, T. A., 1987: Operational forecasting of lake effect snowfall
in western and central New York. Wea. Forecasting, 2,
310–321, https://doi.org/10.1175/1520-0434(1987)002,0310:
OFOLES.2.0.CO;2.
——, W. R. Snyder, and J. S. Waldstreicher, 1995: Winter weather
forecasting throughout the eastern United States. Part IV:
Lake effect snow.Wea. Forecasting, 10, 61–77, https://doi.org/
10.1175/1520-0434(1995)010,0061:WWFTTE.2.0.CO;2.
Notaro, M., V. Bennington, and S. Vavrus, 2015: Dynamically down-
scaled projections of lake-effect snow in the Great Lakes basin.
J. Climate, 28, 1661–1684, https://doi.org/10.1175/JCLI-D-14-00467.1.
Ohigashi, T., and K. Tsuboki, 2007: Shift and intensification processes
of the Japan-Sea polar-airmass convergence zone associated with
JULY 2018 CAMPBELL ET AL . 2219
Unauthenticated | Downloaded 02/12/22 04:42 PM UTC

the passage of amid-tropospheric cold core. J.Meteor. Soc. Japan,
85, 633–662, https://doi.org/10.2151/jmsj.85.633.
Ohtake, H., M. Kawashima, and Y. Fujiyoshi, 2009: The formation
mechanism of a thick cloud band over the northern part of the
Sea of Japan during cold air outbreaks. J. Meteor. Soc. Japan,
87, 289–306, https://doi.org/10.2151/jmsj.87.289.
Reeves, H. D., and D. T. Dawson, 2013: The dependence of QPF
on the choice of microphysical parameterization for lake-
effect snowstorms. J. Appl. Meteor. Climatol., 52, 363–377,
https://doi.org/10.1175/JAMC-D-12-019.1.
Reinecke, P. A., and D. R. Durran, 2008: Estimating topographic
blocking using a Froude number when the static stability is
nonuniform. J. Atmos. Sci., 65, 1035–1048, https://doi.org/
10.1175/2007JAS2100.1.
Rinehart, R. E., 1997: Radar for Meteorologists. 3rd ed. Rinehart
Publications, 428 pp.
Saito, K., M. Murakami, T. Matsuo, and H. Mizuno, 1996: Sensi-
tivity experiments on the orographic snowfall over the
mountainous region of northern Japan. J. Meteor. Soc. Japan,
74, 797–813, https://doi.org/10.2151/jmsj1965.74.6_797.
Skamarock, W. C., and J. B. Klemp, 2008: A time-split non-
hydrostatic atmospheric model for Weather Research and
Forecasting applications. J. Comput. Phys., 227, 3465–3485,https://doi.org/10.1016/j.jcp.2007.01.037.
Steenburgh, J., 2014: Secrets of the Greatest Snow on Earth. Utah
State University Press, 186 pp.
Steenburgh, W. J., and L. S. Campbell, 2017: The OWLeS IOP2b
lake-effect snowstorm: Shoreline geometry and the mesoscale
forcing of precipitation. Mon. Wea. Rev., 145, 2421–2436,
https://doi.org/10.1175/MWR-D-16-0460.1.
Stoelinga, M. T., 2009: A users’ guide to RIP version 4: A program
for visualizing mesoscale model output. UCAR, accessed
22 September 2017, http://www2.mmm.ucar.edu/wrf/users/
docs/ripug.htm.
Tachibana, Y., 1995: A statistical study of the snowfall distribution
on the Japan Sea side of Hokkaido and its relation to synoptic-
scale and meso-scale environments. J. Meteor. Soc. Japan, 73,
697–715, https://doi.org/10.2151/jmsj1965.73.3_697.
Thompson, G., P. R. Field, R.M. Rasmussen, andW.D.Hall, 2008:
Explicit forecasts of winter precipitation using an improved
bulk microphysics scheme. Part II: Implementation of a new
snow parameterization. Mon. Wea. Rev., 136, 5095–5115,
https://doi.org/10.1175/2008MWR2387.1.
Tsuboki, K., Y. Fujiyoshi, and G. Wakahama, 1989: Doppler
radar observation of convergence band cloud formed on the
west coast of Hokkaido Island. II: Cold frontal type.
J. Meteor. Soc. Japan, 67, 985–999, https://doi.org/10.2151/
jmsj1965.67.6_985.
Tsuchiya, K., and T. Fujita, 1967: A satellite meteorological
study of evaporation and cloud formation over the western
Pacific under the influence of the winter monsoon.
J. Meteor. Soc. Japan, 45, 232–250, https://doi.org/10.2151/
jmsj1965.45.3_232.
Yamada, Y., M. Murakami, H. Mizuno, M. Maki, S. Nakai, and
K. Iwanami, 2010: Kinematic and thermodynamical structures
of longitudinal-mode snow bands over the Sea of Japan during
cold-air outbreaks. Part I: Snow bands in large vertical shear
environment in the band-transverse direction. J. Meteor. Soc.
Japan, 88, 673–718, https://doi.org/10.2151/jmsj.2010-404.
Yamaguchi, S., O. Abe, S. Nakai, and A. Sato, 2011: Recent fluc-
tuations of meteorological and snow conditions in Japanese
mountains.Ann. Glaciol., 52, 209–215, https://doi.org/10.3189/
172756411797252266.
Yoshihara, H., M. Kawashima, K. I. Arai, J. Inoue, and
Y. Fujiyoshi, 2004: Doppler radar study on the successive
development of snowbands at a convergence line near the
coastal region of Hokuriku district. J. Meteor. Soc. Japan, 82,
1057–1079, https://doi.org/10.2151/jmsj.2004.1057.
2220 MONTHLY WEATHER REV IEW VOLUME 146
Unauthenticated | Downloaded 02/12/22 04:42 PM UTC