influences of extrinsic factors on gene expression and
TRANSCRIPT

Influences of extrinsic factors on gene expression and selection of
B-1 cells
Vom
Fachbereich für Biowissenschaften und Psychologie
der
Technischen Universität Carolo-Wilhelmina zu Braunschweig
zur Erlangung des Grades einer Doktorin der Naturwissenschaften (Dr.rer.nat.) genehmigte
D i s s e r t a t i o n
von Britta Störmann
aus Flensburg

1. Referent: ................................. Professor Dr. Jürgen Wehland
2. Referent: .......................................Professor Dr. Stefan Dübel
eingereicht am: ..........................................................26.05.2005
mündliche Prüfung (Disputation) am: ........................06.09.2005 Druckjahr:.............................................................................2005

Vorveröffentlichungen der Dissertation Teilergebnisse aus dieser Arbeit wurden mit Genehmigung des Fachbereiches für
Biowissenschaften und Psychologie, vertreten durch den Mentor der Arbeit, in
folgenden Beiträgen vorab veröffentlicht:
Publikationen Kretschmer K, Jungebloud A, Stopkowicz J, Stoermann B, Hoffmann R, Weiss S. Antibody repertoire and gene expression profile: implications for different developmental and
functional traits of splenic and peritoneal B-1 lymphocytes. J Immunol. 2003 Aug 1; 171(3):1192-201

Table of contents 1 Introduction.......................................................................................................... 1
1.1 The innate and adaptive immune system..................................................... 1
1.2 B and T lymphocytes - players of the adaptive immune system................... 2
1.3 B cell subsets ............................................................................................... 4
1.4 Antibodies and their generation.................................................................... 5
1.4.1 Antibody structure ................................................................................. 6
1.4.2 The immunoglobulin loci ....................................................................... 8
1.4.3 The rearrangement process................................................................ 12
1.4.4 Diversification by somatic hypermutation ............................................ 17
1.4.5 Class switch recombination................................................................. 18
1.5 B cell development ..................................................................................... 20
1.5.1 Early events - B cell lineage commitment ........................................... 20
1.5.2 B cell receptor formation ..................................................................... 21
1.5.3 Peripheral maturation finalizes B cell development............................. 27
1.5.4 Fetal liver as a different site of B cell development ............................. 28
1.6 B-1 cells ..................................................................................................... 30
1.6.1 Origin of B-1 cells................................................................................ 30
1.6.2 Features.............................................................................................. 32
1.6.3 Function .............................................................................................. 33
1.6.4 B-1 cell contribution to immune responses ......................................... 35
1.6.5 Natural memory................................................................................... 36
1.6.6 Autoreactivity....................................................................................... 36
1.6.7 Positive selection of B-1 cells by autoantigen ..................................... 37
1.7 The L2 mouse model.................................................................................. 38
1.8 Aims of this work ........................................................................................ 39
2 Material and methods........................................................................................ 41
2.1 Mice............................................................................................................ 41
2.2 Flow cytometry and cell sorting .................................................................. 41
2.3 Transfers .................................................................................................... 43
2.4 Preparation of RNA .................................................................................... 44
2.5 cDNA synthesis .......................................................................................... 44
2.6 PCR............................................................................................................ 44
2.7 Gel electrophoresis .................................................................................... 46

Table of contents
2.8 Southern blotting ........................................................................................ 47
2.9 Generation of hybridomas .......................................................................... 48
2.10 Amplification and sequencing of IgM chain transcripts from hybridomas ... 49
2.11 Purification of IgM antibodies from cell culture supernatants ..................... 50
2.12 Generation of the 8H10 anti-idiotype antibody ........................................... 51
2.13 Analysis of IgM sequences of sorted IgM+ 8H10+ cells ............................. 51
2.14 Determination of IgM clearence ................................................................. 52
3 Results .............................................................................................................. 54
3.1 Group 1 genes ........................................................................................... 54
3.1.1 Flow cytometrical analysis of VCAM-1 expression.............................. 58
3.1.2 Intravenous transfer of peritoneal derived B-1 cells ............................ 60
3.1.3 Peritoneal transfer of B-1 cells - kinetics ............................................. 64
3.1.4 Transfer of VCAM-1 negative peritoneal B-1 cells .............................. 70
3.1.5 Analysis of VCAM-1 deficient mice ..................................................... 73
3.2 Group 2 genes ........................................................................................... 80
3.3 Generation of an anti-idiotype antibody...................................................... 85
3.3.1 Hybridoma generation......................................................................... 85
3.3.2 Analysis of 8H10 specificity and flow cytometrical analysis ................ 92
3.4 Analysis of L2P3 binding ............................................................................ 97
3.4.1 Half-lives of B-1 cell derived antibodies ............................................ 100
4 Discussion ....................................................................................................... 102
5 Summary ......................................................................................................... 113
6 References ...................................................................................................... 115
7 Abbreviations................................................................................................... 129
II

1 Introduction
1.1 The innate and adaptive immune system
In order to protect the body against the diverse challenges provoked by a huge array
of potentially harmful organisms and substances in our environment, vertebrates
during evolution have developed an elaborate network of cells and tightly regulated
molecular mechanisms, that are commonly known as the immune system. Principally
there are two major requirements this specialized system has to fulfill: First there has
to be a fast reaction against each invader, that keeps the potential infections in
check. Secondly, a specific and at the same time flexible reaction against the highly
diverse nature of invaders has to take place in order to rid the body of harmful
consequences.
To accomplish this, two different branches of the immune system have evolved which
act in concert in a highly efficient way. They are referred as the innate and the
adaptive immune system, respectively. The former represents an early activated,
rapidly reacting “first line of defense”. It comprises effector cells and molecules that
respond rather against common molecular patterns than specific structures, for
instance invariant pattern recognition receptors can recognize bacterial cell wall
components or double-stranded RNA during infection cycles of viruses (Mogensen
and Paludan, 2005). The innate immune system is capable to repel most of the
attacks in daily life so efficiently that we often do not even notice them. However,
some organisms - therefore called pathogens - have acquired the ability to overcome
this first barrier and to spread into the tissues or blood system of their hosts.
Nevertheless, these pathogens are still kept in check by effector mechanisms of the
innate immune system as mentioned above. At the same time the adaptive immune
system comes into play. The corresponding cells recognize pathogens by means of
highly specific receptors. Additionally, this branch of the immune system mediates a
sometimes lifelong protection against re-infection based on an immunological
memory.

1. Introduction
1.2 B and T lymphocytes - players of the adaptive immune system
The defense mechanisms of the adaptive immune system are based on the
functionality of two cell types: Thymus derived T lymphocytes, and B lymphocytes,
originally named after the organ their development was discovered first: the Bursa of
Fabricius in birds. In most vertebrates like mice and man the main site of B-cell
development is the bone marrow.
T as well as B lymphocytes, both have the inherent capability to develop highly
specific surface receptors against antigens (antigens are defined as molecules or
structures, that induce an immune response). Importantly, individual lymphocytes
express exclusively one receptor type against one specific antigenic determinant
(called epitope). Upon antigen encounter of the specific antigen the respective clones
react by clonal expansion and differentiation.
Generally T and B lymphocytes differ in their way to mediate protection. T
lymphocytes which derive from hematopoietic stem cells and develop from
precursors after their migration to the thymus, mediate so called cellular immunity -
reflecting the fact, that their effector function is mediated via cell contacts. The major
group of T cells cannot recognize their respective antigens directly. Instead, they
have to contact antigen-presenting cells that provide the respective antigens in a
processed form. For this purpose the latter bear molecules on their surface encoded
in the major histocompatibility complex (MHC) that accommodate small peptid
fragments of the antigen processed within these cells. There are two types of MHC
molecules: class I and class II. MHC class I molecules are found on the surface of
almost every nucleus containing cell. They present antigens that are derived from the
cytosol of the cells e.g. during a viral infection (Hofmann et al., 2001). MHC class II
molecules represent the second class of MHC molecules, solely found on the surface
of so called professional antigen-presenting cells, i.e. macrophages, dendritic cells
and B cells (Bryant and Ploegh, 2004). They present fragments from antigens that
have been taken up from the surrounding environment by pinocytosis or that has
gained access to intracellular vesicles by phagocytosis. B cells accumulate antigen
via their specific B cell receptor and thus provide the basis for specific T cell help by
presenting it via MHC class II (Parker, 1993).
2

1. Introduction
For antigen recognition, the T cell receptor (TCR) binds to the antigen:MHC complex.
However, in order to fully activate the lymphocyte function further co-stimulatory
signals are needed. This is provided by either the CD4 or the CD8 co-receptor.
Mature T cells of healthy individuals bear exclusively one of these co-receptors and T
cells expressing either of them exhibit different effector functions. Thus, their surface
expression was used to further classify the T cell compartment into two major
subsets: the CD8+ cytotoxic T cells and the CD4+ T helper cells (Woodland and
Dutton, 2003). While the former can identify and kill intracellularly infected host cells
(Wong and Pamer, 2003), the latter are specialized for the activation of other cells of
the immune system, e.g. macrophages or B cells, leading to stimulation or inhibition
of immune reactions (summarized in Woodland and Dutton, 2003).
B lymphocytes (or B cells), as the second column of the adaptive immune system are
responsible for the humoral immunity with antibodies as effector molecules (see also
1.4.1). These immunoglobulins (Ig) can occur in two physical forms, a soluble
(secreted) and a membrane bound. The membrane bound form acts as the antigen-
specific B cell receptor (BCR) on the surface of B cells.
The BCR is composed of an antibody molecule that is equipped with an membrane
integral C-terminal peptide. It is associated with the Igα/Igβ heterodimer, which
functions as a signal transduction unit. This heterodimer connects the BCR to an
organized complex of cytoplasmic signaling molecules. On mature B cells the BCR
provides either a maintenance signal, required for the long-term survival of these
cells (Lam et al., 1997), or an activation signal upon exposure to antigen (Gauld et
al., 2002).
If a B cell becomes activated by antigen - either by crosslinking of the BCR or by the
disturbance of an ordered oligomeric structure of BCR-complexes as recently
proposed by Reth (Reth, 2001) - it starts to differentiate and might develop into a
plasma cell. The sole function of plasma cells is the secretion of antibodies thereby
abolishing the surface expression of the BCR (Calame et al., 2003). In the secreted
form the membrane integral and cytoplasmic domains of the BCR are replaced by a
secretory tail due to alternative splicing (Ross et al., 1998). B cells can in addition
modulate the binding features and effector functions of their immunoglobulins by
class switch (see 1.4.5) and/or somatic hypermutation (see 1.4.4) before plasma cell
differentiation (summarized in McHeyzer-Williams, 2003).
3

1. Introduction
As mentioned already antibodies are the main effector molecules of the humoral
immune response. In contrast to the T cell receptor antibodies recognize native
antigens present in body fluids and cavities. For instance, they can bind bacterial
toxins or viral particles thus blocking their access to cells (neutralization).
Additionally, antibody-antigen complexes influence the inflammatory response and
cell-mediated immunity indirectly by either complement activation or cross-linking of
Fc-receptors thus promoting phagocytosis (e.g. by macrophages or neutrophils). This
may lead to further stimulation of the immune system by production of cytokines,
chemokines and other inflammatory mediators. Finally, there are many examples of
antibodies which promote direct anti-microbial activities, e.g. by blocking the function
of physiological relevant molecules of pathogens (Casadevall and Pirofski, 2004).
Taken together B cells and antibodies produced by them provide a huge impact on
the protective immunity against viral, bacterial and parasitic infections. Their
presence after a first encounter with antigen by infection or vaccination might
completely abolish reinfection by the particular pathogen.
1.3 B cell subsets
So far B cells have been described as a homogenous group of immune cells.
However, these lymphocytes are much more heterogeneous to accomplish
protection at different stages and time points of an infection. On the basis of
phenotypic, topographic and functional characteristics, two major subsets of mature
B cells have been described, which have different requirements for their generation
and maintenance (Herzenberg, 2000).
The first subset, termed B-1 cells, are enriched in the peritoneal and pleural cavities
where they persist by self-renewal as their development takes place mainly during
early ontogeny: B-1 cell progenitors are found within the embryonic splanchnopleura
as well as later in the fetal omentum and liver. Their development terminates shortly
after birth (Herzenberg, 2000).
B-1 cells are believed to be the primary source of natural serum IgM antibodies.
These antibodies arise in the absence of exogenous antigenic stimulation (Bos et al.,
1988; Haury et al., 1997) and often display polyreactive, weakly autoreactive binding
capacity as well as reactivity against many common pathogen-associated
4

1. Introduction
carbohydrate antigens (Baumgarth et al., 2005). According to the expression
characteristics concerning the surface expression of CD5, the B-1 cell pool is further
divided into two subgroups: CD5+ B-1a cells and CD5- B-1b cells. Except for the
spleen where B-1a cells comprise a 1-5% population of B cells (their absolute
number is similar to the number of B-1 a cells found in the peritoneum (Kantor et al.,
1992)), B-1 cells are commonly not found in the other peripheral lymphoid organs.
In contrast, the second group of mature B cells termed B-2 or conventional B cells
represent the predominating B-cell population in the peripheral lymphoid organs
including spleen and are the source for monospecific antibodies. B-2 cells are the
essential players of the adaptive B cell immune response. Although precursors of B-2
cells can be already detected in the fetal liver their main site of generation is the bone
marrow (Herzenberg, 2000; Berland and Wortis, 2002). From this source, newly
formed B-2 cells continuously enter the mature B-cell pool throughout life. Like the
B-1 population, also the B-2 population shows some degree of heterogeneity and
therefore can be further divided into subpopulations. Besides the above mentioned
recirculating follicular B cells (FO B cells) which locate in the B-lymphoid follicles
within spleen or lymph nodes, marginal zone B cells (MZ B cells) exist as a splenic
subset of B-2 cells (Lopes-Carvalho and Kearney, 2004). They are named after the
marginal zone where they locate as resident cells. This specialized microenvironment
is positioned at the periphery of the periarterial lymphatic sheath (PALS) and the
follicular area, at the border between the white and the red pulp. Here, arterial blood
empties into open sinuses. Predestined by their exposed location to the blood
stream, MZ B cells are adapted to react quickly to blood-borne pathogens (Martin
and Kearney, 2001; Lopes-Carvalho and Kearney, 2004; Allman et al., 2004). By
providing fast antibody responses as well as interaction with T cells this B cell subset
thus helps to bridge the temporal gap between the innate and adaptive immune
response.
1.4 Antibodies and their generation
Antibodies as the effector molecules of B cells contribute in different ways to an
immune response. Thus, they cannot not only bind specific antigens but also
stimulate other parts of the immune system to participate in the immune response.
5

1. Introduction
These important functions are mediated by different parts of the antibody molecule
which are the focus of the next chapters.
1.4.1 Antibody structure
The antibody molecule is formed by two identical heavy (H) as well as two identical
light (L) chain polypeptides which are shaped into the antibodies’ particular structure
by covalent (disulfide-bonds) and non-covalent interactions (Figure 1.1). Both chains
can be divided into domains on the basis of sequence similarities. The amino-
terminal domain of each chain is variable in sequence when several antibodies are
compared. The remaining domains are constant.
C3H
C2H
C1H
VH
Antigen binding
Mediation of biological activity
Interchain disulfide bonds
Intrachain disulfide bonds
Heavy chain
Light chain
Hinge
Light chain hypervariable
regions
Heavy chain hypervariable
regions
CL
Fc
Complement activation
Macrophage binding
VL
Figure 1.1. Schematic design of the IgG molecule domain structure. According to their constant (Fc) region of their heavy chains antibodies can belong to one of five isotype classes named IgM, IgD, IgG, IgA and IgE. The light chains can be either of the κ or λ isotype. The hinge region provides steric flexibility. It is only found in IgG, IgD and IgA whereas IgM and IgE contain an additional CH domain instead.
The variable region of either chain is based on a structural backbone formed by four
relatively invariant framework sequences. These are interspersed by three regions 6

1. Introduction
termed hypervariable or complementarity determining regions (CDRs). On the three
dimensional structure the CDRs of the heavy and light chain form the actual antigen
binding site of an antibody. Accordingly, the CDRs display an extraordinary high
variability, the highest diversity always found in the CDR3 regions. The V regions of
the heavy and light chains are C-terminally followed by C-regions. The C-region of
the heavy chain determines the class or isotype of an antibody. There are five main
immunoglobulin classes known: IgM, IgD, IgG, IgE and IgA. Moreover, in mice the
IgG class is further divided into four subclasses termed IgG1, IgG2a, IgG2b and
IgG3. Corresponding to their class affiliation the heavy chains are designated by the
according Greek letters: µ,δ,γ,α and ε (γ1, γ2a, γ2b, γ3, respectively). A major difference
among heavy chains is the number of C domains. While µ and ε consist of four
domains γ, δ and α chains display only three domains. However, in the latter the C
domain 1 is linked with C domain 2 by a so called hinge region that provides flexibility
to the antibody molecule. The more V-distal part of the CH-region, also called Fc-
region, decides about the functional characteristics of an antibody, such as its half-
life in serum, activation of complement and the ability to interact with Fc-receptors
(summarized in Frazer and Capra, 1999).
Of all existing classes and subclasses two are secreted as multimers. IgM can be
found as penta- or hexamers whereas IgA usually forms dimers (Johansen et al.,
2000). The multimers are assembled from monomers involving an additional
polypeptide J (joining) chain. Because of the multimeric binding sites the overall
binding strength (avidity) of the antibodies belonging to the multimer forming classes
is dramatically increased. Therefore, even low affinity antibodies as often found
among IgM antibodies become effective.
The two light chain types are termed κ or λ. In contrast to the constant parts of the
heavy chains no effector properties have been linked to their CL domains. Among
different species the ratio between antibodies that bear light chains of κ or λ type
varies considerably, e.g. in mice a ratio of 10:1, while in horse or cattle the opposite
ratio is found. In humans the κ:λ ratio is 6:4 (Frazer and Capra, 1999).
Although the particular constant regions of heavy and light chains display very little
sequence variability, polymorphisms can be found. These allelic variants are called
allotypes. Antibodies against the allotypes of the heavy chain C-regions of mice from
different inbred strains are valuable tools. For instance they can be taken to measure
7
1. Introduction
antibodies derived of mixtures of B cells from different inbred strains. Thus they
represent essential reagents for transfer experiments of cells or antibodies.
Mice of the BALB/c background, mainly used in this work are of the heavy chain
allotype IgHa, whereas C57BL/6 mice of another widely used lab strain produce IgHb
allotypic antibodies (Ovary, 1982). The CB20 strain used in this work is a BALB/c
strain that carries the IgMb allotype.
Antibodies can also be distinguished by their idiotypes (Id) (summarized in
Greenspan and Bona, 1993). The idiotype consists of distinct antigenic determinants
(idiotopes) found on the V regions of an individual antibody. The idiotope is always
defined by a monoclonal antibody. There are private idiotopes that are associated
with unique antibodies and public idiotopes (also termed cross-reactive idiotopes)
that are shared by different antibody molecules.
Antibodies directed against such idiotopic determinants are termed anti-idiotypic
antibodies (anti-Id). Some of them recognize conformational determinants dependent
on combined VH and VL interactions, others are specific for either VH or VL chain
determinants.
1.4.2 The immunoglobulin loci
The genes that encode these immunoglobulin molecules are located on different
chromosomes. The heavy chain locus of mice resides on chromosome 12, while the
κ and λ light chain loci are found on chromosomes 6 and 16, respectively. Unique to
the immunoglobulin loci is that the gene segments that encode the variable regions
of the BCR or later of the antibodies do not exist in a form that allows their direct
transcription from DNA in germline configuration. Instead they have to be assembled
from small gene segments during the ontogeny of a B cell. This is accomplished in a
process involving the somatic rearrangement of DNA.
1.4.2.1 The heavy chain locus
The V-region of immunoglobulin heavy chain (IgH) genes is assembled from three
different types of gene segments termed VH, DH and JH. They are distributed over an
estimated length of 1.5 megabases (Mb) (Figure 1.2). The exons encoding the
constant parts of the heavy chains follow further downstream extending the whole
locus to approximately 3 Mb (Chowdhury and Sen, 2004).
8

1. Introduction
Figure 1.2. Immunoglobulin heavy chain (IgH) locus organization. A schematic representation of the murine IgH with approximate distances between the gene segments is shown. Several VH genes (black rectangles), the 5’-most (DFL 16.1) and the 3’-most DH gene segments (pink rectangles) are indicated along with the different constant region isotypes. Numbers of members belonging to each gene family are written in parentheses below the line. Three known cis-regulatory elements, the intronic enhancer Eµ, the Dq52 promoter, and the 3’ locus control region are depicted as red ovals (Chowdhury and Sen, 2004).
More than 100 V region segments (V, D, J) have been classified in the mouse so far
(Chevillard et al., 2002; Chowdhury and Sen, 2004). The VH segments are assigned
to 15 partially interspersed gene families. Close to half of the murine VH genes
belong to the J558 family, the majority being located at the 5’ end of the VH cluster.
The extreme 3’ end of the VH locus comprises the 7183 family. An overview about the
VH gene family is given in Figure 1.3.
Besides the functional VH gene segments a number of pseudogenes can be found,
that are either not able to rearrange or lead to non-functional polypeptide chains due
to mutations.
Downstream of the VH gene segments a cluster of 13 D gene segments follows. The
first 12 D gene segments are relatively evenly distributed over a 60 kb region,
whereas the thirteenth most 3’ D segment, Dq52, lies in much closer proximity to the
JH gene segments, separated from the other D members by a 18 kb gap. Its distance
to the nearest JH gene segment (JH1) of the following J cluster adds up to 1 kb. The J
cluster consists of 4 functional gene segments.
The first exons encoding the constant part of the heavy chain follow further
downstream. Cµ and Cδ are located within the next 12 kb. After a gap of 50 kb the
exons for the different subclasses of γ chains are found followed by Cε and finally Cα
(Figure 1.2) (Chowdhury and Sen, 2004).
9

1. Introduction
Figure 1.3. Schematic representation of the murine VH locus. The map is shown in chromosomal orientation, left is toward the centromer, this is opposite to the transcriptional orientation. The relative chromosomal location of respective family members is given as well their total number. Pseudogenes have not been included (Graph modified after Chevillard et al., 2002).
1.4.2.2 The light chain loci
Both types of light chains, κ and λ, appear to be functionally identical. Only their order
of expression during ontogeny appears to differ (Engel et al., 1999; Duber et al.,
2003).
The κ locus
The murine Vκ-locus (Figure 1.4) consists of 140 localized and sequenced Vκ gene
segments. They can be classified into 75 functional, 21 potentially functional and 44
pseudogenes and spread over 3 Mb (Roschenthaler et al., 2000). Like in the case of
the VH genes, different Vκ gene segments can be assorted due to sequence
homologies into 18 different families. Particular for this cluster is that Vκ segments
can be found in different transcriptional orientation. Upon rearrangement this leads
either to the deletion of intervening Vκ segments or to their inversion (summarized in
Schlissel, 2004).
10

1. Introduction
Further downstream the Vκ cluster is followed by a set of five Jκ segments, one of
which (Jκ3) is a pseudogene. A single exon for the constant region finally locates
2.5 kb 3’ of the Jκ cluster.
L1 Ln
RS
Figure 1.4. The murine κ light chain locus. Gene segments are shown in germline configuration (not to scale). One peculiarity about the Vκ locus is indicated: Its gene segments are located in both transcriptional orientations respective to the C region. Arrows indicate promoters and transcription direction. The black ovals represent the intron enhancer iEκ and the 3’ enhancer 3’Eκ, both promoting transcription of the rearranged light chains. Pseudogenes are designated by Ψ and RS indicates the recombining sequence that can mediate Cκ deletion. (Figure adapted from Düber, 2004).
The λ locus
In contrast to the κ locus with its multiple V-region families, the Vλ region (Figure 1.5)
includes only three V-segments, termed Vλ1, Vλ2 and VλX. Also different from the
organization of the heavy or κ chain locus, the λ-locus harbors, instead of the
spatially separated unique J or C regions described earlier, four gene clusters, each
containing one J and one C segment, respectively (Figure 1.5). From these four
clusters, however, one (Jλ4-Cλ4) is nonfunctional due to a frame shift in the
C region, defective recombination signal sequences as well as a defective RNA
donor splice site (Weiss and Wu, 1987).
The J-Cλ3 and J-Cλ1 genes are arranged in one cluster about 3 kb apart with the
Vλ1 gene lying about 16 kb upstream of J-Cλ3. The second Cλ sequence cluster is
positioned about 130 kb upstream of the Cλ3 locus and contains J-Cλ2 and the
unexpressed J-Cλ4-combination followed by the two Vλ genes Vλ2 and VλX further
upstream. VλX however is only rarely used as it has an in-frame termination codon at
its 3’ end (Gerdes and Wabl, 2002).
11

1. Introduction
The gene order (V2-Vx-CJ2-JC4-V1-JC3-JC1) explains why Vλ2 (or sometimes VλX)
is commonly found in association with Cλ2 whereas Vλ1 combines with Cλ1 or Cλ3.
In rare cases Vλ2 has also been found in association with the 190 kb distant Cλ1 and
Cλ3, however backward recombination of Vλ1 with Cλ2 has not been observed so
far (Weiss et al., 1985).
The λ1 gene was the first mammalian single copy gene ever to be isolated and
sequenced (Tonegawa et al., 1978a; Tonegawa et al., 1978b), subsequentially
followed by the others (Arp et al., 1982; Blomberg and Tonegawa, 1982; Miller et al.,
1982; Selsing et al., 1982; Weiss et al., 1985; Weiss and Wu, 1987; Sanchez et al.,
1990).
L1 Vλ1LXVλXL2 Vλ2 Jλ2
Cλ2
Jλ4
Cλ4
Jλ3
Cλ3
Jλ1
Cλ1
18.5 40.4 1.22.01.3 93.9 14.4 1.3 2.1 1.1
ψL1 Vλ1LXVλXL2 Vλ2 Jλ2
Cλ2
Jλ4
Cλ4
Jλ3
Cλ3
Jλ1
Cλ1
18.5 40.4 1.22.01.3 93.9 14.4 1.3 2.1 1.1
ψ
Figure 1.5. Physical map of the mouse λ light chain locus. Picture of the genomic organization of the various λ gene segments. The distances are given in kilobases (kb). Transcriptional orientation is from left to right (promoters illustrated by arrows). ψ indicates the pseudogene. (Modified after Gerdes and Wabl, 2002).
1.4.3 The rearrangement process
The rearrangement process that underlies the assembly of the B cell receptor gene
segments explains the capability of B cells to recognize a tremendous number of
different antigenic determinants. Because it involves the genomic relocalization of the
different types of variable gene segments it is called VDJ rearrangement in the case
of the heavy chain and VJ rearrangement in the case of the light chains, respectively.
However, receptor rearrangement is not restricted to B cells. T cells, that have to
fulfill equal requirements regarding antigen recognition, use the same mechanism
and - as described later in this chapter - even the same machinery for it (for review
12

1. Introduction
see Livak, 2004). The genes encoding the T cell receptor are however different from
the BCR genes.
In both B and T cells the assembly of the V regions to functional transcription units is
a highly ordered process. Nevertheless, it includes some volitional imprecisions that
contribute to further diversity in addition to the combinatorial diversity that is achieved
by the combination of different gene segments.
The assembly of the heavy chain V-region in the mouse starts with the combination
of one of the D-segments with one of the four J-segments (Figure 1.6). This first step
is then followed by the connection of one of the V genes to the newly formed D-J
sequence, leading to a final VDJ-sequence encoding the entire V-domain
(Chowdhury and Sen, 2004). The connection with the constant part of the
immunoglobulin is then later on achieved by RNA splicing of the primary transcripts.
The recombination process is mechanistically very similar for heavy and light chain
genes (Jung and Alt, 2004). Differences occur mainly due to the lack of D segment
recombination step in the light chains.
VH VH D CµJH
VH VH VH CµD JH
VH CµVHD JH
VHVH VH D CµJH
VH VH VH CµD JH
VH CµVHD JH
VH
Figure 1.6. Schematic illustration of heavy chain rearrangement. A D segment is first combined with a J segment followed by addition to a V segment. After the final VDJ recombination step transcription can occur. Remaining J segments of the recombination process are removed by splicing of the primary transcript thereafter (promoters illustrated by arrows).
13

1. Introduction
The correct order of V(D)J assemblies (first V, then (optionally) D followed by J) is
dependent on short, conserved, non coding DNA sequences flanking each of the
single gene segments (Jung and Alt, 2004). They are known as recombination signal
(RS) sequences and serve as recognition sites for the recombinase machinery. RSs
consist of relatively conserved heptamers and nonamers, with respective consensus
sequences of CACAGTG and ACAAAAACC. They are separated by a non-
conserved spacer of either 12 or 23 basepairs (Figure 1.7).
VH and JH segments are both flanked with RSs with 23-bp spacers (here termed as
23RS), while DH segments are flanked on either side with RSs containing spacers of
12 bp (12RSs).
At the light chain loci Vκ segments are followed by 12RSs whereas Jκ segments are
flanked with 23RSs while for the Igλ locus the reverse is found. Recombination
occurs only between one RS with a 12-bp spacer and one with a 23-bp spacer thus
directing recombination between appropriate gene segments. The underlying
principle is referred to as the “12/23” rule (Early et al., 1980).
1212
12
12κ
λ
IgH
CACAGTG-Heptamer
ACAAAAACC-Nonamer
23
23
23 23
V
V
V D
J
J
J
CACTGTG-Heptamer
GGTTTTTGT-Nonamer
Figure 1.7. RSs at the different loci. Depending on the locus, V segments may be flanked by 12- or 23-bp RSs, and similar for J segments. But one of each type of element must be present for recombination to occur, a requirement that prevents futile recombination events (e.g. J to J).
The recombination events are mediated by the recombinase machinery, the process
being started by the gene products of the recombination activating genes Rag1 and
Rag2. Both are indispensable for V(D)J recombination as Rag1 or Rag2 deficient
animals exhibit a complete lack of mature B and T cells (Mombaerts et al., 1992;
14

1. Introduction
Shinkai et al., 1992). The RAG-proteins form a complex (RAG) providing the
endonuclease activity for the formation of double strand breaks (DSB) that are
necessary for the DNA rearrangement. To initiate the cleavage reaction, RAG binds
first to one (12 or 23) and then to a second (23 or 12) RS introducing a precise nick
at the very border of each RS and the particular gene segment.
DH JH
JH
DH
Synapsis
Nicking
JH
strand breaks
Hairpin formation
DH JH
JH
Synapsis
Nicking
JH
DH
Hairpin formation
Postcleavage synaptic complex
codingends
signalends
RAG-2
RAG-1
Recombination signal sequence with 23 bp spacer
Recombination signal sequence with 12 bp spacer
JH
DH
Figure 1.8. Summary of the RAG cleavage reaction (Jung and Alt, 2004).
15

1. Introduction
After this initiation step the resulting free 3’-OH end on the coding strand generates a
blunt, 5’-phosphorylated RS end and a closed hairpined coding end through direct
nucleophilic attack on the opposite phosphodiester bond (Figure 1.8). The four free
DNA ends remain associated with RAG in a post-cleavage synaptic complex, two
belonging to the coding strand and two belonging to the ends of the RSs,
respectively. The postcleavage synaptic complex has basically two functions: to
protect the DNA ends from inappropriate insertion elsewhere in the genome and to
recruit DNA repair enzymes that are supposed to catalyze the following DNA
religation steps (Jung and Alt, 2004; De et al., 2004).
There are currently six identified repair proteins known to be involved in this step.
They can be subdivided into two classes. One consists of the proteins Ku70 and
Ku80, which form a DNA binding heterodimer, and XRCC4 and DNA ligase 4, which
form an end-ligation complex (Bassing et al., 2002). All members of this group were
found to be evolutionary conserved with homologues found already in yeast. The
second class contains the remaining two proteins, DNA-dependent protein kinase
catalytic subunit (DNA-PKcs) and Artemis, which have evolved more recently
(Jackson, 2002). All enzymes are ubiquitously expressed in all cell types and ligate
double strand DNA breaks irrespective of sequence homology. They have also been
found to generally repair double strand breaks thus representing repair function
beyond gene rearrangement (Bassing et al., 2002).
During the DNA religation the coding and signal ends within the postcleavage
synaptic complex are processed differently. The signal ends are joined precisely with
each other in a head-to-head fashion thus forming a circular DNA fragment that is
finally lost when the cell proliferates (Jung and Alt, 2004). However, the religation of
the residual coding strands can proceed in a much more imprecise way which is
contributing to further diversity to the joined region and is started by the opening of
the hairpin loops. This cleavage often occurs asymmetrically resulting in a single-
stranded tail containing a few nucleotides of the coding sequence followed by a
stretch of nucleotides derived from the respective complementary DNA strand. DNA
repair enzymes replenish the missing DNA strand by complementary nucleotide
addition thus generating palindromic DNA regions. The newly introduced nucleotides
are therefore termed P (palindromic) nucleotides (Lafaille et al., 1989; McCormack et
al., 1989).
16

1. Introduction
A second group of newly introduced nucleotides found in the joined regions are N
nucleotides (non-templated). These N sequences are the result of the action of
terminal deoxynucleotidyl transferase (TdT), an enzyme, which catalyzes an addition
of nucleotides to the 3’ ends of symmetrically cleaved hairpin loops of coding ends
(Landau et al., 1987; for review see Benedict et al., 2000). N-nucleotide sequences
at VD and DJ junctions can gain a length of up to 15-20 bp and are often G-rich due
to preferential usage of dGTP by the enzyme (Max, 1999). They are mainly restricted
to the heavy chain VDJ-junctions, because TdT expression ceases before the
rearrangement of the immunoglobulin light chain genes. However, exceptions have
been reported (Hiramatsu et al., 1995; Bentolila et al., 1999). The third mechanism
generating diversity is rather the opposite of the two described so far. It concerns the
loss of nucleotides of the J regions. This process known as ‘nibbling’ may be the
result of exonucleases (Kenter and Tredup, 1991). The specific enzyme responsible
for this process, has not been identified yet.
All of the three mechanisms presented here occur either alone or in combination, e.g.
nibbling preceding N-nucleotide insertion during VDJ arrangement. Their more or
less random nature gives rise to an enormous number of variant immunoglobulin
chains, all displaying different antigen binding potential, distinct from the germline
encoded sequences. However, these diversification mechanisms can also result in
non-functional rearrangements as frame-shift mutations might be introduced. They
lead to abortion of translation by encounter of stop-codons in the newly acquired
reading-frames in the C-region and are therefore termed non-productive (non-
functional) rearrangements.
1.4.4 Diversification by somatic hypermutation
The mechanisms contributing to diversification regarded so far take place during the
formation of the B cell receptors in development and are essentially independent of
antigen. However, even after the formation of BCR in mature cells its specificity can
be altered. The underlying process is termed somatic hypermutation (summarized in
Diaz and Casali, 2002). Its activation leads to the acquisition of point mutations within
the variable regions of the heavy and light chain genes, thus, achieving further
diversification. Although, these are distributed over the whole variable region of an
antibody, distinct regions can be defined that display a high density of mutations,
therefore known as hotspots. These are mostly found in the CDR regions.
17

1. Introduction
The enzyme regarded to be the causative factor of this process is activation-induced
cytidine deaminase (AID). The underlying mechanism is not completely understood
yet, e.g. the question whether the target is RNA or DNA. This is due to the sequence
homology of AID with the RNA-editing enzyme APOBEC-1 that is known to convert
cytidine into uracil. However, several studies from the groups of Neuberger and Alt
demonstrate direct interaction of AID with single stranded DNA (Lee et al., 2004;
Besmer et al., 2004; Neuberger et al., 2005).
Somatic hypermutation is activated after a B cell recognizes an antigen via its
receptor and requires T cell help. In some of these B cells the mutations will result in
specificities that confer a stronger binding to the encountered antigen. This will allow
the expansion of successful specificities, i.e. antibodies of higher affinities, a
phenomenon also known as affinity maturation. It takes place in the germinal centers
of the peripheral lymphoid organs (Franklin and Blanden, 2004).
Summarizing the diversification mechanisms described in this chapter: there are four
main mechanisms for generation of diversity, that shape the BCR/antibody V-region.
Starting with the existence of different V-, D- and J-region gene segments,
combinatorial diversity is generated by the different combinations of these segments
during assembly. This is further amplified by integration of additional P or N
nucleotides or removal of coding sequences by ‘nibbling’. Additionally, the assembly
of the antibody molecule itself provides further means for diversity - as the antigen
binding sites are products of heavy and light chain V-region combinations. And
finally, the diversification process is enhanced by the introduction of point mutations
within V regions during the response to antigen.
1.4.5 Class switch recombination
BCRs and antibodies, respectively, can not only differ within their variable regions but
also by their constant parts. B cells that after the completion of their development
have not yet encountered antigen, are termed naïve B cells. These B cells express
BCRs of two different classes, IgM and IgD, bearing the same variable region. The
gene segment encoding the δ-chain lies directly 3’ of the µ-chain gene segment. The
primary Ig transcript contains both C-regions in addition to the variable segments.
Differential splicing gives rise to both BCRs (Max, 1999; Frazer and Capra, 1999).
18

1. Introduction
During an immune response the IgM/IgD H-chain classes initially used can be
substituted by the classes located further downstream in the locus. The underlying
mechanism is called class switch recombination (CSR, see Chaudhuri and Alt, 2004).
Class switch is started upon antigen-encounter and appropriate T cell help. It is
mediated by special DNA sequences, so called switch regions, positioned in the
intron between the rearranged VDJ region and the µ-gene as well as in the 5’ regions
preceding the respective downstream C-region gene segments except Cδ. CSR
involves a recombination event between two S regions, with to a different
downstream CH gene (Figure 1.9). Interestingly the above mentioned enzyme AID is
essential for CSR. Most likely it acts on the single stranded DNA that is generated
during the activation of a particular C region for switching (Chaudhuri and Alt, 2004).
As different antibody classes mediate different effector functions in concert with other
cells or molecules of the immune system, the class switch mechanism provides the
means for efficient clearance of a particular antigen i.e. a pathogen from the body.
VDJ Cµ Cδ Cγ3
Cα
Sµ Sγ3 S α
Cα
S α
VDJ
VDJ
Cγ3
switch circle
IgG3
RNA
Cγ3
VDJ Cµ Cδ Cγ3
Cα
Sµ Sγ3 S α
Cα
S α
VDJ
VDJ
Cγ3
switch circle
IgG3
RNA
Cγ3
Figure 1.9. Schematic representation of the class switch mechanism. The episomal switch circle contains the intervening sequences removed during CSR. The new genomic order in this example may give rise to further switch events.
19
1. Introduction
1.5 B cell development
All the processes described above can be assigned to particular stages in B cell
development. These stages that are characteristic for particular steps during BCR
assembly are paralleled by the differential expression of a collection of intracellular
and surface marker proteins (Rolink et al., 1999).
1.5.1 Early events - B cell lineage commitment
B cell development is first observed in the fetal liver with early precursors found in the
omentum and splanchnopleura. After birth B cell development takes place in the
bone marrow (Herzenberg, 2000; Berland and Wortis, 2002). Starting point for the
generation of B cells is the commitment of pluripotent, self-renewing hematopoietic
stem cells (HSCs). HSCs are defined by their ability to give rise to all of the
hematopoietic lineages in vivo and sustain the production of these cells for the life
span of the individual. HSCs are discernable by their Thy-1lo, Sca-1hi (Ly6A/E), c-kit+
surface expression pattern. Moreover adult HSCs lack all the lineage markers (Lin-)
of mature cells from the hematopoietic system, i.e. CD3 (T cells), CD45R/B220
(B cells), Ly6G/Gr-1 (granulocytes), Ter119 (erythrocytes), Mac-1/CD11b
(macrophages) (Wognum et al., 2003).
The first differentiation step results in the appearance of multipotent progenitor (MPP)
types. This differentiation step is accompanied by the loss of long-term self-renewal
characteristic for HSCs and the expression of the tyrosine kinase receptor Flt3, also
known as Flk2 (Adolfsson et al., 2001; Christensen and Weissman, 2001). These
early progenitor cells can on one hand give rise to an IL7 receptor negative (IL7R-)
common myeloid progenitor (CMP, Akashi et al., 2000) that has the potential to
differentiate into all myeloid cell types (erythrocytes, megakaryocytes, granulocytes
and macrophages). On the other hand, MPPs can differentiate into the earliest
lymphoid progenitors (ELPs) which already initiate Rag1 and Rag2 expression and
can undergo DHJH rearrangement at the IgH chain locus (Igarashi et al., 2002). ELPs
still can give rise to the IL7R+ common lymphoid progenitor (CLP) in bone marrow
and CLPs have residual potential to generate T, B, dendritic and natural killer (NK)
cells (Kondo et al., 1997;Busslinger, 2004).
20

1. Introduction
The entrance into the subsequent CLP-2 stage is marked by the onset CD45R/B220
expression. Cells at this stage also start to express the complement component C1q
like receptor C1qRp, a widely used marker in analysis of B cell development
(Norsworthy et al., 1999; Petrenko et al., 1999, see also Rolink et al., 2002). This
transmembrane protein can be found on all succeeding stages of immature B cells
but is lost on mature B cells.
Correlated with the induction of CD19, the cells finally enter the pro-B cell stage
during which they complete the first part of the BCR receptor assembly: the
rearrangement of the DH and JH genes (Hardy et al., 1991; Li et al., 1993; Li et al.,
1996). The absence of mature B cells in Rag-/- mice has been traced to a block of B
cell development at this stage (Mombaerts et al., 1992; Shinkai et al., 1992). Besides
this main B220+CD19+ fraction a second B220-CD19+ fraction of cells was identified
(Montecino-Rodriguez and Dorshkind, 2002). Interestingly, although expressing the
CD19 molecule, which is usually associated with B cell lineage, these cells show
nevertheless the potential for the generation of macrophages. However, these cells
do not display the potential to generate T cells or NK cells.
1.5.2 B cell receptor formation
The pro-B cell stage mentioned above is the first in a series of seven defined stages
that reflect different events during the assembly of the B cell receptor. Like the
preceding ones these stages have been characterized and defined by means of
differential surface marker expression. Additionally, the sequential expression of
components of the BCR as well as a panel of intracellular molecules engaged in BCR
formation characterize the single steps during the developmental progress.
Two nomenclatures are commonly used to define these stages in the bone marrow
(Hardy et al., 1991; Rolink and Melchers, 1991). The nomenclature by Rolink and
Melchers not only takes surface marker expression and the respective
rearrangement states into account but also considers different cell sizes as indicators
for proliferation (large cells) or rest (small cells). Based on this nomenclature the
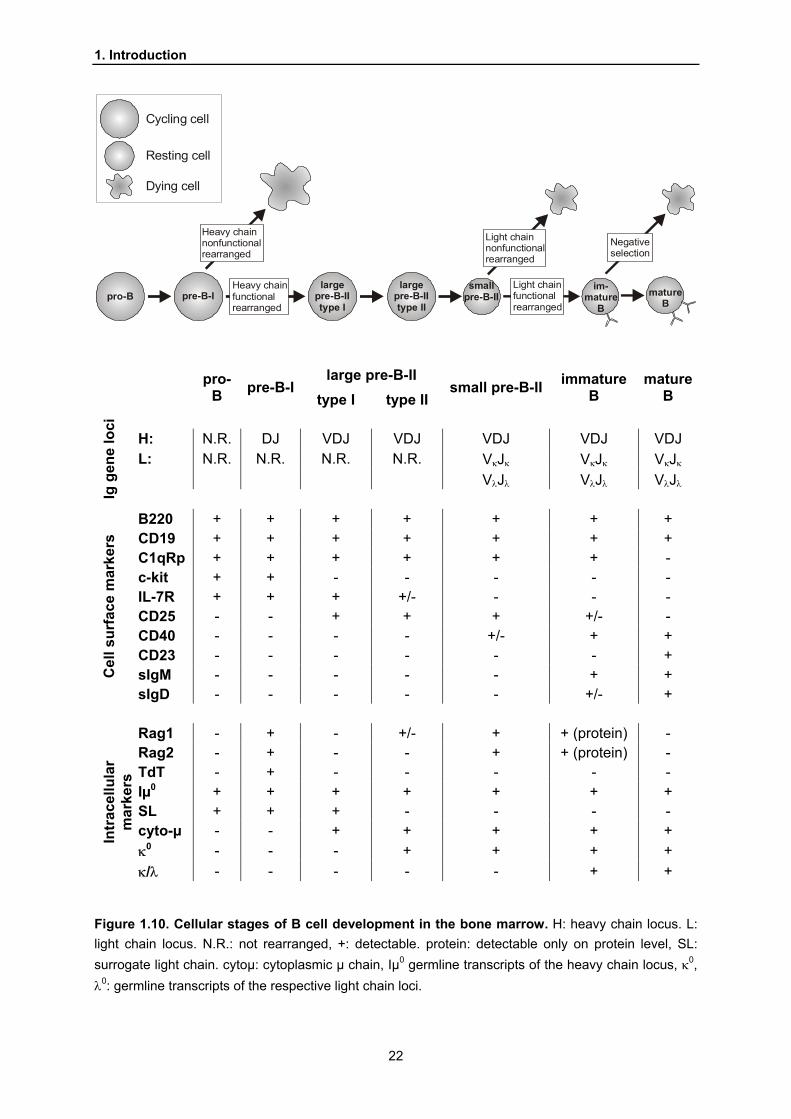
events during BCR formation will be described (Figure 1.10).
21
1. Introduction
matureB
im-mature
B
smallpre-B-II
largepre-B-IItype II
largepre-B-IItype I
pro-B pre-B-I
Heavy chainnonfunctionalrearranged
Light chainnonfunctionalrearranged
Heavy chainfunctionalrearranged
Light chainfunctionalrearranged
Negativeselection
Cycling cell
Resting cell
Dying cell
large pre-B-II
pro-B pre-B-I
type I type II small pre-B-II immature
B mature
B H: N.R. DJ VDJ VDJ VDJ VDJ VDJ L: N.R. N.R. N.R. N.R. VκJκ VκJκ VκJκ VλJλ VλJλ VλJλ
Ig g
ene
loci
B220 + + + + + + + CD19 + + + + + + + C1qRp + + + + + + - c-kit + + - - - - - IL-7R + + + +/- - - - CD25 - - + + + +/- - CD40 - - - - +/- + + CD23 - - - - - - + sIgM - - - - - + + C
ell s
urfa
ce m
arke
rs
sIgD - - - - - +/- +
Rag1 - + - +/- + + (protein) - Rag2 - + - - + + (protein) - TdT - + - - - - - Iµ0 + + + + + + + SL + + + - - - - cyto-µ - - + + + + + κ0 - - - + + + +
Intr
acel
lula
r m
arke
rs
κ/λ - - - - - + +
Figure 1.10. Cellular stages of B cell development in the bone marrow. H: heavy chain locus. L: light chain locus. N.R.: not rearranged, +: detectable. protein: detectable only on protein level, SL: surrogate light chain. cytoµ: cytoplasmic µ chain, Iµ0 germline transcripts of the heavy chain locus, κ0, λ0: germline transcripts of the respective light chain loci.
22

1. Introduction
Initially, DJ rearrangement on both chromosomes takes place in the pro-B cell stage.
The transition into the following pre-B-I cell stage is marked by the loss of Flt3 but the
cells remain ckit+IL7R+. The recombinase machinery as well as TdT are expressed at
the pre-B-I stage (Grawunder et al., 1995a).
Pre-B-I cells are often used in differentiation models as they can be cultivated and
maintained in this stage in vitro in the presence of IL7 or IL3 and start to differentiate
upon removal of the cytokines (Rolink et al., 1991; Winkler et al., 1995). Moreover,
transferred into lymphocyte deficient mice they can give rise to fully mature B cells
indicating their exclusive commitment to the B cell lineage.
The next step in heavy chain formation, the joining of VH to DJH segments occurs at
the transition from pre-B-I to the pre-B-II stage (Rolink et al., 1999). Whenever the
VHDJH rearrangement on one allele is productive and leads to a µ-heavy chain that
potentially can pair with a light chain, a pre-B cell receptor (pre-BCR) is formed and
exported to the cell membrane.
The pre-BCR
The pre-BCR has a structure that is reminiscent of the BCR (Figure 1.11). It consists
of two newly formed µ-heavy chains associated with two so called surrogate light
chain (SL) heterodimers that mimic a functional light chain (Hendriks and
Middendorp, 2004). Surrogate light chains consist of two subunits, the VpreB and the
λ5 protein, which are non-covalently associated. λ5 is encoded by a single gene and
two isotypes exist for VpreB-proteins, the VpreB1 protein found to be expressed in all
cells expressing the λ5 gene, the VpreB2 protein only found to be co-expressed in
approximately 30% of such cells. However, both can contribute to a functional pre-
BCR (Kudo and Melchers, 1987; Karasuyama et al., 1994; Dul et al., 1996). The
VpreB and λ5 genes are located on chromosome 16 in mice closely linked to the λ
locus (Gerdes and Wabl, 2002).
The pre-BCR is fully capable to initiate signaling mediated via its two accessory
molecules Igα and Igβ. This step is crucial for further B cell development providing a
first positive selection step as cells that fail to rearrange a functional heavy chain and
thus cannot provide a functional pre-BCR complex undergo apoptosis. However, the
trigger of the signaling events is still unclear. Two different scenarios are discussed.
The first supports the idea that an extrinsic ligand stimulates the pre-BCR signaling.
This is based on the finding that galectin-1, a stromal cell derived lectin, is required to
23

1. Introduction
induce Igα-Igβ phosphorylation in a human pre-B cell line (Gauthier et al., 2002).
Furthermore soluble murine or human pre-BCR molecules show specific binding to
stromal-cell associated heparan sulphate, controlled by the non-Ig-like unique tail of
λ5 (Bradl and Jack, 2001; Gauthier et al., 2002).
On the other hand, Ohnishi and Melchers showed that the non-Ig-like unique tail of
λ5 mediates cell-autonomous pre-BCR signaling (Ohnishi and Melchers, 2003). They
proposed that either the pre-BCR interacting with neighboring pre-BCRs serves
intrinsically as its own ligand or that alternatively pre-B cells express a molecule on
their cell surface that has binding sites for the non-Ig-like unique region of λ5.
However, in all signaling scenarios λ5 mediates a crucial impact on signaling
(Hendriks and Middendorp, 2004).
Figure 1.11. The pre-BCR. Two rearranged µ-chains form a complex with two surrogate light chains consisting of the two noncovalently associated chains VpreB and λ5. The two known VpreB proteins show homology to Vλ segments, the λ5 gene has homology to the Jλ and Cλ gene segments.
Signaling initiated through the pre-BCR induces clonal expansion of the Igµ+ pre-B
cells with IL7 playing a crucial role as pre-B-cell specific proliferation factor (Milne et
al., 2004). As a result, pro-B cells differentiate to the next developmental stage of
large, cycling pre-B cells. Recently, GL7 has been described as a novel marker 24
1. Introduction
characterizing this stage (Murasawa et al., 2002). In cycling pre-B cells, TdT
expression is shut down and the Rag1 and Rag2 genes are transiently
downregulated upon signaling from the pre-BCR. Thus, the recombination machinery
is turned off (Grawunder et al., 1995a). This happens as soon as one of the two
heavy chain alleles is functionally rearranged which explains why every single B cell
expresses only one type of heavy chain, a phenomenon termed allelic exclusion.
This principle is also valid for rearranged light chain loci. The mechanism appears to
be very stringent since only occasionally B cells are found that seem to have
circumvented it (with a frequency of 1 in 104; Barreto and Cumano, 2000). The
respective molecular events that finally lead to allelic exclusion, have still to be
unraveled (Mostoslavsky et al., 2004).
After a limited number of cell divisions, during which surrogate light chain expression
ceases, the large pre-B-II cells stop cycling and differentiate into small, resting
pre-B-II cells. The transition is associated with reactivation of the rearrangement
machinery as now the second step of receptor assembly occurs: the light chain
rearrangements (Rolink et al., 1999). Germline transcripts, i.e. transcripts of
unarranged Ig gene segments, that indicate an accessibility of the particular Ig loci
for the recombination machinery are in the case of κ already present in the large pre-
B-II cell stage (Grawunder et al., 1995b, Engel et al., 1999). In contrast germline
transcripts for the λ-locus become detectable not until the small pre-B-II stage (Engel
et al., 1999).
In large pre-B-II cells the rearrangement of κ gene segments is initiated and
precedes in small pre-B-II cells (Grawunder et al., 1995b; Engel et al., 1999). If this
results in a functional κ light chain it can bind to the µ chain and is expressed as IgM
molecule on the cell surface together with Igα and Igβ. If the rearrangement of κ
genes is non-productive, rearrangement at the λ L-chain loci takes place (Rolink et
al., 1999). As soon as a successful light chain rearrangement is achieved the
expression of the BCR on the cell surface results in the inhibition of additional
rearrangements at all light chain loci. This leads to the expression of either a κ or a λ
chain. As only one light chain isotype is thus expressed per B cell, the phenomenon
is called isotype exclusion. In combination with allelic exclusion also found for the
light chain genes only one species of light chain and thereby only a single type of
25

1. Introduction
antibody per cell is produced. Collectively, these limitations are referred to as
‘haplotype exclusion’ (Nemazee et al., 2002).
Small pre-B-II cells that produce a functionally rearranged light chain differentiate into
immature B cells (Rolink et al., 1999). These cells express a functional IgM BCR
receptor on their surface that is associated with Igα and Igβ and are characterized as
IgMhiIgDloC1qR+ bone marrow cells. Within the immature stage potential harmful
anti-self specificities are cleared from the newly generated B cell pool. In contrast to
previous selection steps that probed the functionality of the receptor complex,
selection at the immature stage is designed to probe the receptor-ligand interaction,
since now the BCR is for the first time able to interact with antigens. It has been
estimated, that 40-60% of all surface IgM positive B cells in the bone marrow may
have autoreactive specificities (Spanopoulou et al., 1994; Xu et al., 1998), making an
effective selection in terms of self-protection indispensable. Three main mechanisms
act at this stage in order to evade autoimmunity: receptor editing, apoptosis and
anergy.
Editing
Although IgM expression induces light chain allelic exclusion, surface IgM expression
does not necessarily terminate rearrangement. Instead, secondary rearrangements
can occur, replacing the original specificity with a new, non-autoreactive one (Edry
and Melamed, 2004). This process is called receptor editing and takes place mainly
at light chain loci since the required RS configuration may still exist. However,
receptor editing has also been observed at the H chain loci where a V in the VDJ unit
is replaced by an upstream germline VH segment (Reth et al., 1986; Kleinfield and
Weigert, 1989).
Apoptosis
If receptor editing fails, escape from autoimmunity is usually assured by apoptosis of
the cells with anti-self BCR specificities (Nemazee and Burki, 1989; Hartley et al.,
1993; Sandel and Monroe, 1999). Therefore immature B cells from the bone marrow
undergo apoptosis when stimulated with high levels of anti-Ig mimicking self-antigen
encounter (Norvell et al., 1995). The process to eliminate self-reactive B cells by
apoptosis is also known as clonal deletion and is mainly observed when a
multivalent, often membrane-bound self-antigen is recognized.
26
1. Introduction
Anergy
Cells that encounter soluble self-antigens during the immature stage might enter a
state of anergy. Anergic B cells show downmodulation of IgM surface expression and
impaired BCR signaling in response to antigen. They also fail to provide appropriate
signaling for the activation of T helper cells. Due to these defects they are not
activated to secret antibodies. In normal mice anergic B cells show furthermore a
shorter half-life compared with mature B cells ensuring the rapid elimination of
autoreactive specificities (summarized in Cornall et al., 1995).
1.5.3 Peripheral maturation finalizes B cell development
B cell development in the bone marrow is closely associated with stromal cells.
During the transition to the immature state, however, the immature B cells become
independent of stromal factors, migrate inside the central sinus and leave the bone
marrow via the blood stream (Carsetti et al., 2004). They are then passively
transported to the spleen, where they locate within the outer periarteriolar lymphoid
sheat (PALS) (Figure 1.12). They still can be assigned to the immature B cell
compartment due to their IgMhiIgDloCD21loCD23- CD24hi surface markers and the
expression of C1qRp. Such B cells are also referred to as transitional B cells
because they are in transit from the bone marrow and represent a distinct short-lived
developmental transitional stage from immature to mature B cells. At least two major
subsets of transitional B cells exist, transitional type 1 (T1), which specifies the
freshly entered cells from bone marrow and transitional type 2 (T2), that are at a
IgMhiIgDhiCD21hiCD23hiCD24hi C1qRp+ stage and are already located within the
follicles (Su et al., 2004).
After 1-2 days T2 cells develop into IgM+IgDhiCD21+CD23+CD24lo follicular or
IgMhiIgDloCD21hiCD23lo marginal zone B cells. This final maturation step involves the
loss of the marker protein C1qRp that marks nascent and immature B cells (Rolink et
al., 1999; Loder et al., 1999). Now the B cells have finished their maturation and are
fully capable to exert their respective effector functions in response to antigen.
27

1. Introduction
Figure 1.12. Peripheral B cell development. Immature B cells leave the bone marrow as short-lived, transitional B cells. T1 cells travel through the bloodstream and enter the spleen where they reside within the periarteriolar lymphoid sheath (PALS). T1 cells differentiate into T2 cells that reside within the splenic follicle until they differentiate into mature B cells (Su et al., 2004).
1.5.4 Fetal liver as a different site of B cell development
The developmental steps shown in the chapters before describe mechanisms mainly
based on observations made on B cells generated in the adult bone marrow.
However, B cell development is already initiated during embryonic stages, with the
fetal liver (FL) as the main site of hematopoiesis. The overall concept of B
lymphocyte development found in bone marrow holds true also for fetal liver with
regard to expression of cell surface and intracellular molecules as well as the
correlated sequential rearrangement of Ig loci. However, also differences can be
found.
Concerning the B lymphocyte development in FL many progenitors have been
identified that show a common myeloid/lymphoid potential. Thus a tripotent
progenitor, which gives rise to T cells, B cells and macrophages has been described
(Lacaud et al., 1998). Furthermore bi-potential precursors giving rise to B/myeloid
progeny (Ohmura et al., 1999; Kawamoto et al., 2000) and a rare population of
B/macrophage progenitors that have no potential to differentiate into other myeloid
cells (Cumano et al., 1992) were found. Moreover a CLP population equivalent to the
28

1. Introduction
CLP in BM with regard to cell marker expression was identified in FL. In contrast to
BM CLP these cells are capable to generate also DCs and macrophages in addition
to T, NK and B cells (Mebius et al., 2001). Interestingly bi-potential T/B progenitors
which have been found in adult bone marrow (Kondo et al., 1997) have not been
found in the fetal liver up to now. In summary, these observations indicate that FL
lymphoid precursors retain the capacity to generate macrophages. In contrast
lymphoid BM progenitors - with exception of the B/macrophage progenitor population
mentioned earlier (1.5.1) - do not display this potential (Douagi et al., 2002).
Other differences between fetal liver and murine bone marrow B cell precursors
concern the differential expression of particular molecules. Recently performed
studies in our lab that compared CD19+ckit+ cells from FL and bone marrow of
BALB/c mice in microarray based experiments revealed a total number of 88 genes
(70 known and 18 expressed sequence tags (EST)) differentially expressed between
both sites (Düber, 2004). They also confirmed the previous made observation that
pre-B cells generated in the fetal liver e.g. lack MHC class II expression whereas in
the BM this molecule is already expressed on pre-B cell stage (Hayakawa et al.,
1994; Lam and Stall, 1994). Another example is the gene for a regulatory myosin
light chain (precursor lymphocyte-specific regulatory light chain or PLRLC) (Oltz et
al., 1992) that is expressed in BM pre-B cells but cannot be found in fetal liver pre-B
cells. However, the most prominent example of a differentially expressed molecule is
that of TdT. In contrast to B cell precursors from BM FL precursors express little or no
TdT during VDJ rearrangement of the heavy chain loci (Li et al., 1993). Accordingly B
cells from fetal liver contain no or only few N nucleotides in the VDJ junctions of their
heavy chains in contrast to B cells generated in adult BM (Feeney, 1990; Li et al.,
1993; Gilfillan et al., 1993). Thus the lack of N nucleotide diversification at the heavy
chain junctions is usually taken as an indicator for fetal origin of a B cell.
Another difference between fetal and adult B cell development was revealed by the
analysis of the effect of pre-BCR assembly/signaling on the proliferation of pre-B
cells in stromal culture. Although the expression of a heavy chain transgene (capable
of associating well with the SL chains of the pre-BCR) resulted in proliferation of adult
bone marrow pre-B cells, the same chain inhibited proliferation of pre-B cells derived
from fetal liver (Wasserman et al., 1998, see also Hardy et al., 2000). In contrast, a
heavy chain transgene that failed to assemble efficiently with the SL chain had less
suppressive effect on fetal proliferation. Therefore Wasserman et al. proposed that
29

1. Introduction
pre-BCR signaling is important to promote B cell development in bone marrow but
induces exit from cell cycle in fetal liver derived pre-B cells which are the main source
for B-1 cells.
1.6 B-1 cells
The identification of B-1 cells as additional population besides B-2 cells some 30
years ago was followed by many observations that addressed the different nature of
both populations. Upon growing data, the question after the origin of both mature
subsets became a controversial issue resulting in two hypotheses to explain their
occurrence. The linchpin concerning both consist in the question if B-1 and B-2 cells
originate from one or two different lineages.
1.6.1 Origin of B-1 cells
The initial hypothesis concerning B-1 cell development came from Herzenberg and
coworkers (reviewed in Herzenberg, 2000). It was based on cell transfer studies in
which fetal liver cells transferred into irradiated mice could reconstitute both, B-1 and
B-2 cell populations, whereas transferred adult bone marrow only led to the
generation of B-2 cells. Therefore, they proposed a model that suggested
development from different, committed precursors, hence, B-1 and B-2 cells being
descendants of two different lineages. Later, the fetal omentum and paraaortic
splanchnopleura were shown to give rise exclusively to B-1 cells (Solvason et al.,
1991; Godin et al., 1993). In addition, when all B cells were depleted in mice after
birth the newly formed B cells showed a fast recovery of B-2 cells in contrast to an
impaired generation of B-1 cells (Lalor et al., 1989a; Lalor et al., 1989b; Hamilton and
Kearney, 1994). This was taken as further indication that B-1 and B-2 cells derive
from different lineages with their progenitors present at particular sites and time
periods during ontogeny.
In contrast, the second hypothesis suggests an ‘induced differentiation’ for B-1 cell
generation (Cong et al., 1991; Haughton et al., 1993; Clarke and Arnold, 1998). It
proposes that the B cell fate is determined by the nature and quality of the signaling
mediated via its BCR. Based on their specificity, cells are thus selected either into the
B-1 or B-2 compartment. Since the BCR is randomly assembled this hypothesis
predicts one common progenitor for both B cell populations. The signaling events
30

1. Introduction
upon (self) antigen encounter by slightly autoreactive or polyreactive specificities,
possibly in addition of inappropriate T cell help, would select the cells into the B-1
compartment (Berland and Wortis, 2002).
Several observations have led to this proposal: in vitro experiments on splenic B-2
cells manipulating BCR signaling by anti-Ig treatment resulted in the conversion from
splenic B-2 cells into cells with B-1 characteristic in terms of marker expression and
responses to mitogenic stimuli (Rothstein et al., 1991; Cong et al., 1991; Wortis et al.,
1995; Murasawa et al., 2002). Furthermore the fetal/neonatal repertoire is skewed
towards the expression of immunoglobulins that bind TI-2 antigens (as for example
found in the microbial flora of the gut). The adult repertoire generates these
specificities rarely (e.g. due to N nucleotide insertion upon TdT expression). Thus,
only few B-1 cells originate from adult bone marrow.
Table 1.1. Extract of genetic alterations that affect B-1 cell numbers (Berland and Wortis, 2002).
Alterations that decrease B-1 cell numbers References
Mutations of positive regulators of BCR signaling
Btk-/- or point mutation of btk Khan et al., 1995; Hendriks et al., 1996
PKCβ-/- Leitges et al., 1996
PLCγ-/- Hashimoto et al., 2000; Wang et al., 2000
Deletion of P85α of PI-3 kinase Fruman et al., 1999; Suzuki et al., 1999
CD19-/- Engel et al., 1995; Rickert et al., 1995
SLP65-/- Jumaa et al., 1999; Pappu et al., 1999
CD21/35-/- Ahearn et al., 1996; but see Molina et al., 1996
Vav-/- Tarakhovsky et al., 1995; Doody et al., 2001; Tedford et al., 2001
Mutation of B cell transcription factors
Oct2-/- Humbert and Corcoran, 1997
Aiolos-/- Wang et al., 1998
NFATc-/- Berland and Wortis, 2002
Alterations that increase B-1 cell numbers
Mutations of negative regulators of BCR signaling
SHP-1-/- Schmidt et al., 1998
CD22-/- O'Keefe et al., 1996; Sato et al., 1996a ; but see Otipoby et al., 1996; Nitschke et al., 1997
Lyn-/- Chan et al., 1997
CD72-/- Pan et al., 1999
Overexpression of positive regulators of BCR signaling
CD19 transgenic Sato et al., 1996b
31

1. Introduction
In addition, many transgenic and gene targeted mouse models seem to provide
evidence for the signaling based model. Mutations that weaken BCR signaling by
alteration or deletion of positive regulators in the signaling pathways lead to
decreased B-1 cell numbers. In contrast diminished or absent function of negative
regulators leads to increased B-1 cell numbers (Table 1.1).
Moreover transgenic mouse models expressing a B-1 specificity develop mainly B
cells belonging to the B-1 compartment, most of them expressing CD5. Conversely,
in mice carrying B-2 derived transgenes, transgene expressing B cells belong almost
exclusively to the B-2 compartment (Table 1.2).
However, supporters of the two-lineage model nevertheless argue, that the
phenotypes observed in these transgenic mice could as well be attributed to different
selection processes that B1 and B2 progenitors have to undergo (Herzenberg, 2000).
Table 1.2. Effect of Ig-transgene expression on B cell development (Berland and Wortis, 2002)
Transgene Specificity Source Phenotypea References
3-83 H-2KkDk adult spleen B-2 Nemazee and Burki, 1989
HyHEL-10 Hen Egg Lysozyme adult spleen B-2 Goodnow et al., 1988
VH12/ Vκ4 Phosphatidyl choline (PtC)
CD5+ Lymphoma B-1a Arnold et al., 1994
VH11/ Vκ9 Phosphatidyl choline (PtC) B-1 cell B-1a Chumley et al., 2000
SM6C10 Thy-1 B-1 cell B-1a Hayakawa et al., 1999; Hayakawa et al., 2003
4C8 Mouse red blood cells NZB spleen B-1 Okamoto et al., 1992
2-12H sM snRNP MRL/lpr mouse B-1a Qian et al., 2001 a Predominant phenotype of B cells expressing the transgene
1.6.2 Features
B-1 cells are not defined by a single specific marker. In flow cytometry they can be
distinguished from other B cells by differential expression using several cell surface
markers. B-1 cells are IgMhiIgDloCD23-CD43+B220lo and constitutively express the
IL5 receptor (Wetzel, 1989; Berland and Wortis, 2002). This is in contrast to B-2 cells
that are IgMloIgDhiCD23+CD43-B220+. In addition, peritoneal B-1 cells are classified
into CD5+ B-1a and CD5- B-1b sister populations.
In contrast to the generally small resting follicular B-2 cells, B-1 cells are large
granular cells and exhibit more side scatter in flow cytometry (Berland and Wortis,
32

1. Introduction
2002). Furthermore, B-1 and B-2 cells differ also physiologically. Peritoneal B-1 cells
have been shown to respond readily to phorbol esters without additional stimuli
whereas cell cycle entry of B-2 cells requires ionomycin in addition to phorbol esters
(Rothstein and Kolber, 1988b). Moreover, B-1 cells fail to enter cell cycle in response
to anti-Ig stimulation and undergo apoptosis whereas the same stimulus leads to
proliferation of B-2 cells (Rothstein and Kolber, 1988a; Morris and Rothstein, 1993;
Bikah et al., 1996). According to their constitutive expression of IL5R, peritoneal B-1
cells elicit stronger proliferation upon IL5 stimulation then splenic B-2 cells (Wetzel,
1989; Baumgarth et al., 2005).
Several studies showed differences between B-1 cell populations of the peritoneum
and the spleen. The longest known example is the differential expression of Mac-1
(CD11b/CD18) between peritoneal and splenic B-1 cells, the former expressing the
molecule whereas the latter lacking it (Kantor et al., 1992). Moreover, CCR2 and
CCR3 transcripts have been found in splenic but not in peritoneal B-1a cells
(Rothstein et al., 2000). Splenic B-1 cells furthermore express much less IL-10
mRNA than peritoneal B-1 cells and peritoneal B-1 cells express constitutively
phosphotyrosinylated STAT3 which localizes in their nuclei whereas splenic B-1 cells
do not (Fischer et al., 2001). Furthermore splenic B-1 cells have recently been
reported to express the Notch family members Notch-1 and Notch-2 and other Notch-
related genes at significantly higher levels then peritoneal B-1 cells (Tumang et al.,
2004). Another difference between peritoneal and splenic B-1 cells concerns a more
functional aspect. In contrast to peritoneal B-1 cells splenic B-1 cells fail to respond
upon phorbol ester stimulation (Fischer et al., 2001).
1.6.3 Function
B-1 cells have been shown to be the major source of natural serum IgM (Herzenberg
et al., 1986; Lalor et al., 1989a; Baumgarth et al., 1999; Baumgarth et al., 2005).
These antibodies are produced in the absence of exogenous antigenic stimulation
and provide a first line of defense against the infection by pathogens (Ochsenbein et
al., 1999; Baumgarth et al., 2000). Accordingly, many antibody specificities against
discrete microbial or viral components can be found in the natural antibody repertoire
(Baumgarth et al., 2005). Furthermore many of these antibodies are poly- and weakly
autoreactive and bind specific antigen with low-affinity (Baumgarth et al., 2005).
Several studies characterized these particular features of B-1 cell derived antibodies
33

1. Introduction
and provided evidence for the importance of B-1 specificities in the defense against
pathogens.
Antibodies of the B-1 cell derived T15 idiotype that consist of VH1/Vκ22 family
member associations, have been shown to play an important role in protection from
infection by Streptococcus pneumoniae (Briles et al., 1981; Yother et al., 1982).
Furthermore antibodies with this idiotype can bind to oxidized low-density lipoprotein
(LDL), which may contribute to its clearance from blood thus suggesting a role in
prevention of atherosclerosis (Shaw et al., 2000). Similarly, such antibodies could
have an impact during the course of this vascular disease as they may bind to
atherosclerotic plaques and initiate an inflammatory response.
Other prominent specificities found in 5-15% of peritoneal B-1 cells are those for
phosphatidyl choline (PtC) (Mercolino et al., 1988; Wang and Clarke, 2004a). PtC is
a glycolipid component of common plasma membranes and is exposed on senescent
erythrocytes and on many other cell types that have been treated proteolytically
(Kawaguchi, 1988). Thus anti-PtC specificities are examples for the many
autoreactive specificities found in the B-1 cell pool (see 1.6.6). Anti-PtC antibodies in
normal mice are encoded by either VH11/Vκ9 or VH12/Vκ4/5H heavy light chain
combinations and show restrictions in the heavy and light chain CDR3 regions (Wang
and Clarke, 2004a). The PtC specificity of VH11/Vκ9 and VH12/Vκ4/5H antibodies was
revealed in studies that investigated their binding to mouse red blood cells (MRBCs)
after treatment with the proteolytic enzyme bromelain (Br) (Kawaguchi, 1988).
Therefore, they are also termed anti-BrMRBC antibodies. Besides their potential to
bind senescent cells, anti-BrMRBC have been also shown to recognize thrombin-
treated mouse platelets (Kawaguchi, 1989). Therefore, it has been proposed that
these antibodies may overtake a kind of physiological “housekeeping” function by
removal of senescent cells (Hardy et al., 2004).
Another prominent B-1 cell derived specificity is directed against LPS (Su et al.,
1991). Almost all natural antibodies that react against this bacterial cell wall
component can be traced back to B-1 origin. These antibodies are important for the
clearing of LPS. This was indicated by studies that used antibody deficient mice.
They showed increased susceptibility to death after LPS injection but the phenotype
could be rescued by administration of normal mouse serum containing natural
antibodies prior to LPS injection (Reid et al., 1997).
34

1. Introduction
Natural antibodies have also been shown to control early stages of the immune
reaction against influenza viruses (Baumgarth et al., 2000). In the absence of natural
IgM mice infected with influenza virus showed markedly decreased survival and an
increased viral replication in the lung (Baumgarth et al., 2000). B-1 cells were
identified as the source for the virus binding antibody whereas B-2 cells contributed
only minimally to the anti-viral IgM antibodies. However, seven days after the
infection with virus increased titers of B-2 derived IgM were observed whereas the
titer of natural anti-virus IgM stayed constant. Thus B-1 cells do not respond to the
infection with increased IgM production (Baumgarth et al., 2000). However, they
provided a stable titer of IgM keeping the infection in check until the adaptive immune
response mediated by B-2 cells could take place.
1.6.4 B-1 cell contribution to immune responses
It is possible to distinguish antigens upon the requirements of the elicited immune
response. Responses to some antigens require the presence of mature T cells,
therefore classified as T cell dependent (TD) antigens whereas others do not and are
therefore called T cell independent (TI) antigens. The T cell independent antigens
moreover can be further subdivided into TI-1 and TI-2 antigens. TI-1 antigens, often
also referred as innate antigens, are polyclonal activators of B cells leading to their
differentiation into antibody-secreting cells irrespective of their specificity. Antigens
that belong to this class are LPS, peptidoglycans, lipoproteins. However, bacterial
cell walls also contain TI-2 antigens which are typically repetitive polymers such as
capsular polysaccharides from bacteria. They lack an intrinsic polyclonal B cell-
activating property. Prominent members of this second class are pneumococcal cell
walls and dextrans but also synthetic haptenized derivatives such as TNP-Ficoll or
NP-Ficoll (summarized in DeFranco, 1999).
B-1 cells have been shown to participate in TI-2 responses (Claflin et al., 1974;
Forster and Rajewsky, 1987; Martin et al., 2001). Transfers of B-1 cells into allotype-
congenic mice revealed their in vivo responsiveness towards the TI-2 antigen α-1-3
dextran (Forster and Rajewsky, 1987). Furthermore, the above mentioned T15
idiotype has been shown not only to contribute to natural serum IgM but also to the
response during S. pneumoniae infection (Claflin et al., 1974; Masmoudi et al., 1990;
Martin et al., 2001). The T15 antibodies were produced in addition to the already
35

1. Introduction
existing idiotypes in the sera. Infection of mice devoid of T cells demonstrated the T
cell independency of this process (Martin et al., 2001).
However, some TI-2 antigens like TNP-Ficoll or NP-Ficoll do not lead to a B-1 cell
driven TI-2 immune response which is instead provided by the second group of TI-2
responsive cells - the marginal zone B cells (MZ) of the spleen (Hayakawa et al.,
1984; Berland and Wortis, 2002). Because B-1 and MZ B cells are positively
selected, indicated by their skewed repertoire, and can respond rapidly to pathogens
they are believed to provide a “natural memory” to the immune system.
1.6.5 Natural memory
The term ‘natural memory’ has been developed in analogy to the term immunological
memory which reflects the fact that e.g. B cells that have once responded to a certain
antigen can in case of a second encounter with the antigen respond faster and more
efficiently. Thus memory B cells provide already appropriate antibody classes and an
affinity matured repertoire (Mc Heyzer-Williams L.J., 2005). The immunological
memory therefore reflects adapted skills for every individual gained during the course
of its life.
In contrast the ‘natural memory’ is suggested as a phenomenon adapted during
evolution. The repertoire and reactivity pattern of natural antibodies and B-1 and MZ
BCRs, respectively, is remarkably stable within each species and moreover even
between species. This is in part explained by the frequent usage of germline V-genes
that lack N nucleotide insertions. However, it is argued as well that the stability also
reflects the innate usage of a series of V genes that by evolutionary pressures have
been selected in the genome to provide an inherent legacy of specificities suitable for
protection against pathogens (Martin and Kearney, 2001; Baumgarth et al., 2005).
1.6.6 Autoreactivity
In contrast to B-2 cells a large fraction of B-1 cells express self-reactive antibodies
(Baumgarth et al., 2005). The anti-BrMRBC/PtC antibodies mentioned above are one
example for such a B-1 cell derived autoreactive specificity (see 1.6.3). Other
autoreactivities are directed against the cell membrane component
phosphorylcholine (PC) (Masmoudi et al., 1990), immunoglobulins (rheumatoid
factor) (Casali et al., 1987), carbohydrate epitopes, single stranded DNA (Casali et
36

1. Introduction
al., 1987) and cell surface molecules such as Thy-1 (CD90), an antigen expressed
on most thymocytes and peripheral T cells (Schlesinger, 1965; Martin and Martin,
1975; Hayakawa et al., 1999).
In general, low affinity antibodies are not pathogenic in normal animals. Only when
these self- and polyreactive antibodies undergo affinity maturation and isotype
switching and thus become high-affinity IgG antibodies, they might become
pathogenic. Although somatic mutations are usually not seen in peritoneal B-1a cells
(Forster et al., 1988; Berland and Wortis, 2002), it could be demonstrated that B-1
cells have the potential to undergo somatic hypermutation as well as class switch
(Taki et al., 1992). Thus B-1 cells might have the potential to contribute to
pathological situations (Rothstein, 2002; Viau and Zouali, 2005). Accordingly, there
are a number of autoimmune diseases in mouse and human where an association
between disease and B-1 cells is discussed. Among these are the autoimmune
hemolytic anemia (AHA) observed in NZB mice as a result of anti-red blood cell
antibody production (Howie and Helyer, 1968) and murine lupus erythematosus
(SLE) observed in F1 hybrids of NZB and NZW mice (Hayakawa et al., 1983). In
addition, a B-1 cell contribution has been suggested in rheumatoid arthritis (Youinou
et al., 1990) and Sjogren's syndrome (Dauphinee et al., 1988). All of these diseases
are associated with elevated numbers of CD5+ B cells
To provide a pool of autoreactive specificities, seems on the first glance more risky
than beneficial. However, the observation that monoclonal antibodies reactive with
self antigens also react with pathogens sheds a new light on this situation (Mercolino
et al., 1986; Kearney et al., 1987; Claflin and Berry, 1988; Pecquet et al., 1992). The
assumption is that the natural antibody repertoire may indeed be composed entirely
of autoantibodies that also react with pathogens (Baumgarth et al., 2005). The pool
of such reactivities thus would provide immediate immune protection that controls an
infection until the adaptive immune system can fill in. This explanation is moreover
perfectly in line with the observation that B-1 cells are positively selected by
autoantigen (Hayakawa et al., 1999).
1.6.7 Positive selection of B-1 cells by autoantigen
The important impact of autoantigen upon B-1 cell selection has been shown by work
from Hayakawa and colleagues using an anti-thymocyte autoantibody (ATA), a self-
37

1. Introduction
specificity found amongst CD5+ B cells. This antibody is encoded by VH3609 and
Vκ21C germline genes and binds to a carbohydrate epitope on the Thy-1/CD90
glycoprotein. The expression of the VH3609µ chain as a transgene in mice resulted in
the generation of both B-1 and B-2 cells. However, the frequency of CD5+ B cells
was increased. Moreover, the B-1 cells produced high titers of serum ATA -
generated through pairing of the transgene with endogenous Vκ21C light chains. In
contrast, B-2 cells in the spleen expressing the same heavy chain were found to be
associated with a diverse repertoire of light chains and did not contribute to the high
serum ATA levels. In the absence of the autoantigen (i.e. in Thy-1 deficient mice) no
ATA-expressing B-1 cells were detected and in accordance no high ATA serum titer
was observed. Thus both the accumulation of ATA CD5+ B cells and elevated level of
serum ATA were dependent on the presence of the autoantigen (Hayakawa et al.,
1999; Hardy and Hayakawa, 2004).
1.7 The L2 mouse model
Although an extensive amount of knowledge about B-1 cells has been accumulated
since their discovery, many important aspects are still poorly understood. This is in
part due to the low numbers of such cells found in normal mice. To avoid such
problems in the present work, a transgenic mouse strain (L2) was used that has been
extensively characterized before (Engel et al., 1998; Kretschmer et al., 2002;
Kretschmer et al., 2003a; Kretschmer et al., 2003b; Kretschmer et al., 2004). These
mice express a transgenic λ light chain obtained from the plasmacytoma MOPC315
(λ2315). Their major lymphoid organs contain almost exclusively B-1 cells while the
development of conventional B-2 cells is inhibited in the bone marrow (Engel et al.,
1998). In the spleen of L2 mice 5-10% CD5+ B-1 cells are found which makes these
mice extremely useful for the investigation of such cells. The only additional splenic B
cell population are MZ B cells (Kretschmer et al., 2003a).
Studies carried out on the antibody repertoire of B-1 cells in L2 mice revealed a
striking phenotype (Kretschmer et al., 2002; Kretschmer et al., 2003b). Since the
heavy chain loci in L2 mice could theoretically rearrange randomly during B cell
development they could give rise to a very heterogeneous pool of different µ-chain
specificities. However, the sequencing of transcribed heavy chains from the B-1 cell
pool of L2 mice showed pronounced oligoclonality. In addition some sequences could
38

1. Introduction
be found repeatedly by single cell RT-PCR and dominated the repertoire. These
particular specificities could be shown to be derived from independent cells that had
undergone also independent rearrangements of their receptor genes (Kretschmer et
al., 2002; Kretschmer et al., 2003b).
These dominant sequences could repeatedly be even found at the same frequency in
the peritoneum of different individual mice. Thus, a substantial fraction of the B-1a
cells expresses the same BCR on their surface providing an excellent molecular
marker for these B-1 cells. The most dominant sequence was found in 15% of the
peritoneal B-1a cells, a second in 13% and a third in 7,4 %. These data suggest a
strong positive selection of such specificities probably by autoantigen (Kretschmer et
al., 2002; Kretschmer et al., 2003b).
Only some of these specificities could be found at a reasonable frequency in the
spleen. This suggested that there is little exchange between these two anatomical
compartments. This was confirmed by migration studies in L2 mice. When peritoneal
cells were transferred into the peritoneum of L2 mice very few transferred B-1 cells
could be recovered from the spleen (Kretschmer et al., 2003b). In accordance, gene
chip analysis revealed significant differences between these two cell populations
(Kretschmer et al., 2003b).
Subsequent work furthermore demonstrated an impact of the spleen on the
maintenance of the dominant clones. The dominant specificities found in the
peritoneal cavity were lost after splenectomy. This, suggests a dependency of
peritoneal B-1 subpopulations on a splenic survival factor, which in accordance with
the previous observations was speculated to be a splenic autoantigen (Kretschmer et
al., 2004).
1.8 Aims of this work
The results of the gene chip analysis on B-1a cells from spleen and peritoneal cavity
of L2 mice could be explained in two ways. Splenic and peritoneal B-1 cells are
descendants of two different cell lineages or the microenvironment imprints a
particular gene expression pattern onto B-1 cells that arise from the same
precursors. To decide this question diagnostic genes should be defined for the two
populations from the gene chip analysis. Their expression should then be analyzed in
cells that were recovered after transfer of peritoneal cells from spleen and
39

1. Introduction
peritoneum of lymphopenic mice in which transferred peritoneal B-1 cell are known to
home to the spleen and the peritoneum. Along these experiments novel, so far
unknown, markers should be defined for B-1 cell by using the gene chip results.
The dominant specificities could be regarded as unique B-1 cell specific markers.
Therefore, antibodies with these specificities should be further analyzed. To this end
hybridomas had to be established to obtain monoclonal antibodies representing
these specificities. Using such antibodies, first anti-idiotypic antibodies should be
generated that would greatly simplify the analysis of the dominating specificities.
Furthermore, these B-1 cell derived antibodies should be used to search for the
antigen that is recognized by them and it should be investigated how they behaved in
vivo since they were supposed to be directed against an autoantigen.
40

2 Material and methods
2.1 Mice
The L2 mouse line (IgHa) has been described previously. (Engel et al., 1998).
Transgenic and non-transgenic mice were used at the age of 6-15 week old mice.
Transgenic mice were crossed to BALB/c background for more than 20 generations
and kept as heterozygotes. L2 mice of the IgHb allotype were obtained crossing L2
mice to CB20 mice that are congenic with BALB/c mice but carry the IgHb haplotype.
To obtain mice with the B cell specific deletion of the VCAM-1 gene mice
homozygous for the loxP flanked (floxed) VCAM-1 gene (Terry et al., 1997) were
crossed with CD19cre mice (Rickert et al., 1995). Rag1-/- mice on BALB/c
background were obtained from The Jackson Laboratory (Bar Harbor, USA). Igα-/-
mice on BALB/c background were obtained from Michael Reth (Freiburg) (Pelanda et
al., 2002).
2.2 Flow cytometry and cell sorting
Single cell suspensions were obtained by flushing lymphoid organs or the peritoneum
of mice with ice-cold IMDM (Iscove’s modified Dulbecco’s medium,
GibcoBRL/Invitrogen). Erythrocytes in splenic, thymic or bone marrow preparations
were lysed by incubation with ACK buffer (0.15 M NH4Cl, 10 mM KHCO3, 0.1 mM
Na2EDTA, pH 7.2) for 2-5 min on ice.
Blocking: 5x10⁵-106 cells per 100 µl were incubated in FACS-buffer (2% FCS and
2mM EDTA in PBS (8 g NaCl; 0.2 g KCl, 1.44 g Na2HPO4 x 2H2O, 0.2 g KH2PO4 in
1 l H2O; pH 7.0)) containing Fc-block (clone 2.4G2, protein G purified from
concentrated hybridoma supernatants or obtained from Pharmingen), mouse serum
and/or Endobulin (human IgG, Baxter). The blocking was carried out on ice for 15-20
min.
Staining: Cells were stained for 10-15 minutes on ice using antibodies coupled to
FITC, PE, APC or Biotin from the list below. Samples were washed twice with
FACS-buffer afterwards. Biotinylated antibodies were counterstained in a second

2. Material and methods
step with streptavidin-APC (Pharmingen) or streptavidin-R-PE conjugates (Southern
Biotechnology Associates) for 10 min on ice followed by a washing step with FACS-
buffer. Flow cytometry was carried out using a FACSCalibur® (Becton Dickinson).
Cell sorting was carried out on a MOFLO (Cytomation), or a FACSVantage® (Becton
Dickinson). Data were analyzed using Summit® v3.1 software (Cytomation) or
CellQuest software (Becton Dickinson).
Antibodies
Monoclonal antibodies IgMa (DS-1) Pharmingen IgMb (AF6-78) Pharmingen IgDa (AMS9.1) Pharmingen IgDb (217-170) Pharmingen CD5 (53-7.3) Pharmingen VCAM-1 (429(MVCAM.A)) Pharmingen
CD19 (1D3) Pharmingen or protein G purified from concentrated hybridoma supernatants*
CD3 (500A2) Pharmingen or protein G purified from concentrated hybridoma supernatants*
CD23 (B3B4) Pharmingen CD21(7G6) Pharmingen Polyclonal antibodies goat anti-mouse JAM-1 (Lot #: GJO01) R&D Systems
*Antibodies obtained from hybridoma supernatants were conjugated to FITC
(FLUOS, Roche Diagnostics) or Biotin (Biotinamidohexanoic acid N-
hydroxysuccinimide ester, Sigma) according to standard protocols .
8H10 stainings were performed using supernatants from 8H10 hybridoma (rat-anti
mouse L2P3, isotype IgG2b) culture and revealed by an mouse anti-rat IgG (H+L)
Cy5-conjugated F(ab’)2 fragment (Jackson ImmunoResearch). L2P3, L2M15 and
MOPC104E stainings were detected using the IgMa-FITC coupled antibody
(Pharmingen) as secondary reagent.
42

2. Material and methods
2.3 Transfers
Cells obtained from peritoneal lavages of L2 mice were washed twice with PBS prior
to transfer.
Intravenous transfer: 1.6x10⁷ cells per mouse were transferred into the tail vein of
Rag1-/- mice. After 2.5 weeks mice were sacrificed and cells from spleen and
peritoneum were prepared. Cells from both compartments of individual mice were
analyzed in flow cytometry using antibodies specific for IgMa, CD5 and VCAM-1.
Residual cells from both organs were pooled, stained with anti-CD5 and anti-IgMa
antibodies and sorted to obtain samples for RT-PCR.
Intraperitoneal transfer kinetics: 7.8x10⁶ cells per mouse were transferred i.p. into
Rag1-/- mice. Splenic and peritoneal cell preparations of transferred mice were
analyzed after 7, 15, 23, 29 and 32 days by flow cytometry using antibodies specific
for IgMa and CD5 according to standard protocols. Spleen cells were additionally
stained with anti-VCAM-1 antibody.
Intraperitoneal transfer: 2,6x10⁷ cells were transferred into the peritoneum of Rag1-/-
mice. After 3 weeks cells from peritoneum and spleen of these mice were prepared
and cells from both compartments of individual mice were analyzed in flow cytometry.
To this end, cells were stained with anti-IgMa, anti-CD5 and anti-VCAM-1 antibodies.
Residual cells from both compartments were pooled, stained with anti-CD5 and anti-
IgMa antibodies and sorted.
Transfer of VCAM-1-CD19+ peritoneal cells: Cells from peritoneal lavages of L2 mice
were stained with anti-VCAM-1 and anti-CD19 antibodies and sorted. VCAM-1-
CD19+ cells were mixed with cells obtained from peritoneal lavages of Igα-/- mice at a
ratio of 2:1. From this mixture, 7.2x10⁶ cells per mouse were transferred into the
peritoneal cavity of Rag1-/- mice. After two weeks mice were sacrificed and spleen
and peritoneal cavity cells were analyzed by flow cytometry using antibodies against
IgMa, CD5 and VCAM-1.
43

2. Material and methods
2.4 Preparation of RNA
Total RNA from sorted cells or hybridomas was prepared with TRIzol® Reagent
(GIBCO BRL®) according to the manufacturer’s protocol. After preparation, RNA was
solved in 10 µl DEPC treated water (Ambion) and transcribed into cDNA.
Alternatively, possible DNA contamination in total RNA was eliminated prior to cDNA
generation, by DNase1 treatment (DNA-freeTM, Ambion) according to the supplied
protocol. Briefly, extracted RNA was incubated with DNase1 (2 units) at 37°C and
after 30 min treated with DNase1 Inactivator. Samples were spun down at 10.000x g
for 1 min and supernatants collected.
In case of sorted cells, photometrical determination of RNA prior to cDNA synthesis
was not possible because of low cell numbers available. For these samples the
amount of cDNA was estimated by PCR with primers for Hprt.
2.5 cDNA synthesis
To transcribe cDNA, 3-5 µl RNA in DEPC treated water, 1 µl oligo-d(T)12-18
(500 µg/ml, Amersham Biosciences), 0.5 µl RNAsin (40 U/µl, Promega) were
adjusted with RNAse free water to a total volume of 12 µl per sample (Mix1) and
incubated for 10 min at 70 °C. Samples were cooled on ice for two minutes and
reaction mix containing 4 µl 5x RT buffer (Invitrogen), 2 µl 0.1 M DTT, 1µl 10 mM
dNTP and 1µl Superscript II RNaseH- (200 U/µl, Invitrogen) was added. To control for
genomic DNA contaminations additional samples were included in which the enzyme
was substituted with water. Samples were incubated for 60 min at 42°C and 2 min at
95°C thereafter. cDNA was stored at -20°C.
2.6 PCR
Oligonucleotides: Primer for PCR (except VCAM A-D primers) were selected by
DNASTAR, Primer Select software (Lasergene) based on sequences obtained from
the Ensembl Genome Browser (www.ensembl.org). All primer pairs, except Ccr3 and
Fpr1, were designed as intron spanning primer pairs to control for genomic DNA
contamination. Ccr3 and Fpr1 PCRs were conducted including control samples in
which Superscript II enzyme was omitted during cDNA preparation. Primers for
44

2. Material and methods
VCAM A-D were selected according to Araki et al., 1993. All primers were purchased
from Invitrogen.
Primer 5’ 3’ Adamdec1 for CATACAGCTGGAAGGGACAAGAC Adamdec1 rev ACTGAGAAGCTGGGCGTGGTTAT Adml for AGAACACAACTGGCCCCCTACAA Adml rev CACCCGCACCTATATCCTAAAGAG Api6 for GACTGCAACGGAACGGAAGACACG Api6 rev CCAAACGACTCAAAAGGCAAGACC Ccr3 for CTCGCTATCCAGAAGGTGAAGAAG Ccr3 rev GTGGAAAAAGAGCCGAAGGTGTT Cd5 for AGAAAAAGCAGCGTCAGTGGATTG Cd5 rev TCAGGATGGAGGGGATGC F11r for ACCCGGAAGGACAATGGAGAGTAT F11r rev TGGGCCTGGCAGTAGTATTCAC Fpr1 for GAACTTGGCCATTGCTGACTTTTG Fpr1 rev GACGGCCACCTTCCTCTTCTCTAC Hpgd for GCAGGCGTGAACAATGAGAAAAAC Hpgd rev CACAAAGCCTGGGCAAATGACA Lpl for CGAGAGGATCCGAGTGAAAG Lpl rev CTAATGCTGGAAGACCTGCTATG Mrc2 for TTTTACGAGAAGTTGGGGTCAGG Mrc2 rev TTTGGTCAGCTTTGGTTGTAATGG Spic for CAGAGGCAACGCTAACTACTATGG Spic rev CAGCTTTCTCCGGATTTTTATGAT Vcam1 (=Vcam7/8) for TCCCTAATGTGTATCCCTTTGACC Vcam1 (=Vcam7/8) rev AGGCTGCAGTTCCCCATTATTTAG VCAM A for CAACGATCTCTGTACATCCC VCAM B rev AGAGGCTGTACACTCTGCCT VCAM C for AAGGATCCGGTACCAAGCAGAGACTTGAAATGCC VCAM D rev CCCTTGAACAGATCAATCTCC Wee1 for TTTGCTCTTGCTCTCACAGTCGTA Wee1 rev CCATTTGGGCTTTCTTGAGTTCT
45

2. Material and methods
PCR: PCR reactions were conducted in a reaction volume of 20 µl per sample using
the HotStarTaq® DNA polymerase kit from Quiagen.
Reaction mix:
1.2 µl primer mix (containing 10 pmol/µl forward and 10 pmol/µl reverse
primer)
2.0 µl 10x PCR buffer containing 15 mM MgCl2 (Quiagen)
1.6 µl 2.5 mM nucleotide mix (Bioline)
0.2 µl HotStarTaq DNA polymerase (5U/µl; Quiagen)
13.6 µl Ampuwa® water (Fresenius Kabi)
19 µl in each tube
1µl cDNA was used as template in each PCR reaction. For PCR reactions
polymerase was activated at 95°C for 15 min. Optimized conditions for each primer
pair were used (20 s 94°C, 40 s 50-60°C, and 20 s 72°C, final extension 72°C
10 min). Depending on the redundancy of each cDNA, 30-40 cycles were performed.
Fifteen microliters were analyzed in gel electrophoresis.
Threefold serial dilutions of the cDNA were used for semiquantitative RT-PCR and
normalized according to expression of the housekeeping gene Hprt.
Reaction tubes: 0.2 ml Micro-Strips & Caps (Abgene® House)
2.7 Gel electrophoresis
PCR products or restricted DNA were analyzed in agarose gel electrophoresis on
0.8 % or 2% gels, respectively (SeaKeM® LE Agarose, Cambrex) in TBE-buffer
(90 mM Tris-Borate, 2 mM EDTA, 0.11% (v/v) acetic acid). Ethidium bromide was
added to the gels to reveal DNA bands under UV light. The size of DNA fragments
was determined by comparison with DNA fragments of known size.
DNA-markers: SmartLadder SF, 100 bp- 1kb (Eurogenetec); peQ gold 1 kb DNA-
Leiter (PeqLab) (used for gel electrophoresis during Southern experiments).
46

2. Material and methods
Documentation was performed using the E.A.S.Y Win32 gel documentation system
and software (Herolab).
2.8 Southern blotting
CD19+ or CD3+ cells from flox/flox; cre/+ mice were sorted according to standard
protocols. Yield for CD3+ and CD19+ splenic cells were between 4-5x10⁶ cells. The
pooled peritoneal fraction yielded 6.4x10⁵ CD19+ cells.
Preparation of genomic DNA: For the preparation of genomic DNA, 720 µl tail buffer
(100 mM Tris HCl (pH 8.5), 5 mM EDTA (pH 8.0), 200 mM NaCl, 0.2% SDS) and
30 µl proteinase K (Sigma) of a 10 mg/ml stock solution in H2O was added to the cell
samples and shaken over night at 54°C. The next day, samples were spun down at
room temperature (10 min, 20000 x g) and supernatants were transferred into a new
tube containing 600µl 2-propanol. Tubes were gently inverted to promote DNA
precipitation. Then samples were spun down for 5 min at 10000 x g. Supernatants
were removed, the pellets washed with 500 µl 70% ethanol and subsequently dried
at room temperature. Pellets were resuspended in 50 µl TE 10/1 (10 mM Tris (pH
7.6), 1mM EDTA) and incubated overnight in a thermomixer at 54°C to properly
dissolve the DNA.
DNA digestion and blotting procedure: For Southern blot analysis, DNA was digested
overnight at 37°C with BamHI (New England BioLabs) in a 60 µl reaction volume
containing BamHI restriction buffer (New England BioLabs), 1 mM spermidine
(Sigma), 1 mM DTT (Sigma), 100 µg/ml BSA (New England BioLabs), 50 µg/ml
Rnase A (Serva), and 15U BamHI per reaction. Subsequently, the total volume of
each sample was loaded to an agarose gel (0.8%) and separated by electrophoresis.
DNA was then transferred to a nylon membrane (Gene Screen plus, NENTMLife
Science Products) by capillary force under alkaline conditions. After the transfer, the
membrane was washed with excess 2x SSC for 1-2 minutes (20x SSC: 3 M NaCl,
0.3 M Tri-sodiumcitrate, pH 7.2). Finally, the DNA was fixed to the membrane by
drying it for 2 h at 80°C.
47

2. Material and methods
Labelling of the probes: BgllI/SpeI restriction fragments used as probes for Vcam1
were as described by Terry et al., 1997 and kindly provided by Dr. Angela Schippers,
EI, GBF. The probe was labeled by incorporation of [α-32P] dCTP (Amersham
Biosciences) using the “LaddermanTMLabelling Kit” (TaKaRa) according to the
manufacturer’s protocol. Non-incorporated nucleotides were removed using
ProbeQuantTM G-50 Micro Columns (Amersham Biosciences). After addition of 35 µl
sonicated salmon sperm DNA (10 mg/ml) the probe was heated at 95°C for 5 min
and was used for the hybridization of the blot.
Hybridization and detection: To wet the membrane and to remove excess salt, the
blot membrane was briefly dipped into deionized water before prehybridization. Then
it was prehybridized in a rotating hybridization oven for 45 min at 65 °C using
QuickHyb® Hybridization Solution (Stratagene). Subsequently the labeled and
denatured probe was added to the solution and hybridized for one hour.
After hybridization the following washing steps were carried out:
1) two times shortly with 2x SSC/0.1% (w/v) SDS at room temperature
2) two times for 15 min with 0.1x SSC/0.1% (w/v) SDS at 58°C
Afterwards the membrane was wrapped in plastic wrap. Autoradiography was carried
out using a BIOMAX MS film (Kodak) and an intensifying screen at -80 °C. Exposure
was performed over night and developed using the Curix 60 automatic developer
machine (Agfa).
2.9 Generation of hybridomas
Pooled cells from either spleen or peritoneum of two L2 mice were sorted for
expression of CD5 and IgM (purities: spleen 91%, peritoneum 93%) and stimulated in
vitro for 48h with 20 µg/ml LPS (Bacto Difco) in OptiMEM medium (GibcoBRL)
containing 5% heat inactivated FCS (Integro), 100 µg/ml penicillin/streptomycin
(Biochrom AG), 100 µg/ml gentamycin (Biochrom AG) and 250 µM
ß-mercaptoethanol (Serva). Cells were then fused to non secreting P3X63Ag8.653
mouse myeloma cells (Kearney et al., 1979).
Cell fusion: For fusion, myeloma cells and activated lymphocytes were washed with
serum-free IMDM (GibcoBRL) and mixed at ratio of myeloma:lymphocyte of 20:1.
The mixture was spun down (5 min, 180 x g) and the supernatants discarded. After
48

2. Material and methods
loosening the pellet, the cells were incubated for 5 min at 37°C using a water bath.
While gently shaking the tubes in the water bath, 500 µl polyethyleneglycole solution
(PEG 1500; 50% (w/v) in 75 mM HEPES buffer (Boehringer)) were slowly added to
the pellet over 60 seconds and tubes were agitated for an additional minute. 9 ml
serum-free IMDM (GibcoBRL) were then added dropwise (3 ml/30 sec) followed by
an additional incubation at 37°C (water bath) for 5 min. Cells were spun down (5 min,
180 x g) and the pellet was resuspended in HAz medium followed by an 30 min
incubation at 37°C in the incubator. Hybridomas were then plated under limiting
dilutions in HAz medium and only wells bearing single colonies were expanded for
further analysis.
HAz-Medium: 0,5 mg Azaserine/6,8 mg Hypoxanthin (Hybri-Max, Sigma) were
dissolved in OptiMEM medium (GibcoBRL) containing 5% heat inactivated FCS
(Integro), 100 µg/ml penicillin/streptamycin (Biochrom AG), 100 µg/ml gentamycin
(Biochrom AG) and 250 µM ß-mercaptoethanol (Serva).
Culture conditions: Hybridomas were cultivated at 37°C and 5.0% CO2 in a
humidified atmosphere.
2.10 Amplification and sequencing of IgM chain transcripts from hybridomas
Total RNA was prepared from 1-3 x 10⁶ cells of the hybridomas. Reverse
transcription and PCR were carried out sequentially in the same tube with primers for
the amplification of the IgM V region (VHcons: 5’-
GAGGTGCAGCTGCAGGAGTCTGG-3’; Cµ1: 5’-ATGGCCACCAGATTCTTATCAGA-
3’) using the QIAGEN® One Step RT-PCR Kit according to the manufacturer’s
protocols. Reverse transcription was performed at 50°C for 30 min in 25 µl reaction
mix. PCR conditions were 95°C 30s, 50°C 30s, 72°C 30s using 30 cycles. The PCR
was completed by a final extension step for 10 min at 72°C.
PCR products were run on 2% agarose gels and extracted using QIAquick gel
extraction kit (Qiagen). Purified products were directly sequenced. For sequencing
the Cµ1 primer described above was employed. The sequencing reaction was carried
out in a 11 µl reaction volume using the ABI PRISMTM BigDye Terminator Cycle
Sequencing Kit (PE Biosystems) applying the following programme: 96°C for 60 s, 49

2. Material and methods
25 cycles at 96°C for 60s, 55°C for 15s and 60°C for 4 min. After the reaction the
DNA was precipitated. Briefly, 100 µl 2-propanol were added to the samples and
mixed. After 15 min incubation at room temperature, the precipitate was spun down
(45 min, 1420 x g, room temperature). The supernatant was removed by a
subsequent centrifugation with inverted open tubes (1 min, 180 x g). Residual
2-propanol was evaporated on a thermocycler by incubation of the open tubes at
65°C for 2-5 min. Samples were stored at -20 °C until loading on the sequence gel
and analyzed with an automatic DNA sequencer (ABI PRISM 377, PE Applied
Biosystems) in the Department of Genome Analysis at the GBF.
Sequences were evaluated with the SequencerTM 3.1.1 program (Gene Codes
Corporation). To this end they were aligned with the sequences of the four functional
JH gene segments to determine the J-usage. The VH gene segment family was
determined submitting the sequences to database search (Advanced BLAST Search
and IgBLAST, National Center for Biotechnology Information,
http://www.ncbi.nlm.nih.gov/BLAST/). The longest D element matches were used to
assign the D element. At least five nucleotides had to match to assign a D segment.
Nucleotides neighboring nucleotides at the ends of J, D or V gene segments and
forming palindromic sequences with the neighboring nucleotides were assigned as P
nucleotides, the remaining nucleotides were considered as N nucleotides.
2.11 Purification of IgM antibodies from cell culture supernatants
L2P3, L2M15, 2D4 (Young, Jr. et al., 1979) hybridoma cells and MOPC104E
plasmacytoma cells were cultivated in IMDM (GibcoBRL/Invitrogen), 3% protein G
adsorbed heat inactivated FCS (Integro), 100 µg/ml penicillin/streptamycin
(Biochrom AG), and 250 µM ß-mercaptoethanol (Serva). Supernatants were
collected from roller cultures and concentrated using an Amicon device (Series 8000,
Millipore) with a 50K ultrafiltration membrane (Pall). After centrifugation of
concentrated supernatants at 1620 x g (30 min) a pre-precipitation step was carried
out. To this end a saturated ammonium sulfate solution (4.1M in H2O) was added
slowly and dropwise to the gently stirring supernatant at 4°C until 20% saturation was
reached. Samples were then left stirring over night. As mouse antibodies start to
precipitate at a 45-50% saturation this step was used as a pre-clearence step 50

2. Material and methods
removing debris that precipitates at lower ammonium sulfate concentrations. The
solution was spun down at 1620 x g for 30 min and supernatants containing IgM
molecules were submitted to a second over night precipitation adding saturated
ammonium sulfate solution until a 45% saturation was reached. The solution was
spun down thereafter at 1620 x g for 30 min and the pellet was suspended in PBS.
After dialysis (Dialysis tubing Visking, exclusion limit MWCO 14 000, Roth) against
PBS at 4°C an additional dialysis step against binding buffer from ImmunoPure® kit
(Pierce) for the purification of IgM was carried out. IgM was purified using an
immobilized Mannan-binding protein column according to the kit instructions
thereafter. After purification IgM was dialyzed against PBS and stored at -80°C.
2.12 Generation of the 8H10 anti-idiotype antibody
Generation of the anti-idiotype antibody in rats and subsequent ELISA screenings for
the identification of L2P3 binding hybridoma supernatants were kindly carried out in
the lab of Dr. Elisabeth Kremmer at the GSF in Munich. Purified L2P3 IgM and
L2M15 as well as MOPC104E used for ELISA screenings were provided from IgM
preparations described above.
2.13 Analysis of IgM sequences of sorted IgM+ 8H10+ cells
Peritoneal cells of six L2 mice were pooled and sorted for IgM and 8H10 expression.
Total RNA was isolated from these cells using TRIzol® Reagent
(GibcoBRL/Invitrogen). Reverse transcription and amplification of the resultant cDNA
was done in one step according to the QIAGEN® One Step RT-PCR Kit instructions
(Qiagen). For the amplication of IgM V region specific cDNA, the VHcons
(5’-GAGGTGCAGCTGCAGGAGTCTGG-3’) and Cµ1
(5’-ATGGCCACCAGATTCTTATCAGA-3’) primers were used (program: 50°C for
30 min followed by 30 cycles of 95°C 30s, 50°C 30s, 72°C 30s and a final extension
step of 10 min at 72°C). The sample obtained from PCR was run on a 2% agarose
gel and the PCR products were cut out and purified using the QIAquick gel extraction
kit (Qiagen). PCR products were then cloned using the “TOPO TA Cloning kit”
(Invitrogen). Plasmid clones were isolated using the GFXTM Micro Plasmid Prep Kit
(Amersham Pharmacia Biotech) and the insertion of the cDNA fragments was tested
by EcoRI restriction digestion of plasmid DNA aliquots prior to sequencing. Plasmid 51

2. Material and methods
DNA was sequenced using the VHcons primer and sequences were evaluated as
described in 2.10.
2.14 Determination of IgM clearence
10 µg of L2P3, L2M15, MOPC104E or 2D4 antibodies, respectively in PBS were
injected intravenously into the tail vain of CB20/L2 mice. Groups of 3 mice were used
except for the injection of L2M15, where only two mice formed one group. Mice were
bled after 4 h, 1 day, 3 days, 5 days and 7 days and sera were prepared. Sera
obtained before injection of the antibodies were used as controls for the ELISA (pre-
bleed).
Sera: To obtain sera from mice, blood derived from the tail vein of mice was placed
on ice for 2 hours to allow clotting of the blood. The clot was removed with a wooden
toothpick and samples were spun down at 4 °C with 2700 x g for 10 min.
Supernatants were transferred into new tubes and stored at -20 °C until usage.
ELISA: The kinetic of the clearence of injected IgM into CB20/L2 mice was
determined with an allotype specific ELISA using an antibody against IgMa that
detects the injected IgM molecules and does not bind to IgMb molecules of the
CB20/L2 mice.
Coating buffer: 0.1M Na2CO3, 0.1M NaHCO3; pH 9.6 in H2O
Washing buffer: 0.1% Tween 20 in PBS with 5% FCS
Blocking buffer: 3% BSA in washing buffer
Dilution buffer: 1% BSA in washing buffer
OPD substrate: 1 mg/ml o-Phenylendiamin in Substrate Buffer; 0.3% H2O2
Substrate buffer: 0.2 M NaH2PO4 , 0.1 M Na3-citrate; pH 5.0
Plates (MaxiSorbTM Immunoplates, Nunc) were coated over night at 4 °C with 2 µg/ml
rat anti-mouse IgM antibody (clone II/41, Pharmingen) diluted in coating buffer. After
washing, wells were blocked with 200 µl blocking buffer for two hours at RT and
plates flicked to discard the fluid. The sera from different time points were diluted
1:100 in blocking buffer and added to the plate for a 2 h incubation at RT. After
washing, 0.5 µ/ml biotinylated anti-mouse IgMa antibody (DS-1, Pharmingen) in
52

2. Material and methods
dilution buffer was added and incubated for 1 h at room temperature. Plates were
washed and horseradish peroxidase (HRP) conjugated streptavidin (Pharmingen) in
dilution buffer was dispensed into the wells. Plates were incubated for 45 min at room
temperature and washed. Then the ELISA was developed at RT for 25 min in the
dark adding o-Phenylendiamin (OPD) as substrate for the peroxidase. Reaction was
stopped adding 1 M H2SO4. Results were read using an ELISA-reader (BioRad 3550-
UV microplate reader) at a wavelength of 490 nm.
Determination of IgM half-life: For each time point the mean value at OD490 was
calculated from the data of individual mice of one group representing the IgMa
fraction in sera. The mean value at 4 h was arbitrarily set to 100% and the remaining
mean values were correlated to it. Using Microsoft® Excel 2000, these data points
were plotted in a semi-logarithmic diagram depicting the percentage of the IgMa
fraction versus time t, where t = 0 corresponds to the first data point at 4 h. To obtain
the curve of the monophasic 2D4 clearance a trendline was determined by using a
least-squares fit of the functional form A exp(-bt). A is the IgMa percentage at t = 0
constrained to equal 100% and b is the elimination rate constant. Thus the half-life
T1/2 of IgMa equated ln(2)/b.
Each curve of the biphasic L2P3, L2M15 and MOPC104E kinetics is represented by
the two-phase functional form C exp(-dt) + D exp(-et). C and D are the extrapolated
IgMa percentages of the first (fast) and the second (slow) phase at t = 0, and d and e
are the corresponding elimination rate constants (d > e). Using the built-in
interpolation of Microsoft® Excel 2000 the approximated runs of these curves were
obtained and plotted in a semi-logarithmic diagram. In order to determine the half-
lives of the two phases, first, an extrapolated trendline was generated for the second
phase of each curve applying the least-squares fit of the functional form D exp(-et).
Subtracting data values of this trendline from values of the interpolated biphasic
curve yielded data points that were used to determine the trendline representing the
first phase. This trendline was generated using the least-squares fit of the functional
form C exp(-dt), where C + D was constrained to equal 100%. The half-lives T1/2 for
both the first and the second phase thus equated ln(2)/d and ln(2)/e, respectively.
53

3 Results B-1 cells have been extensively characterized. Nevertheless, it is often difficult to
detect such cells in particular tissues or follow their migration. Thus the panel of
available reagents and markers needs to be increased - an issue that was followed
up in this work.
The background of the first part of this work was provided by microarrays that had
been carried out before. Gene expression profiles from B cell populations located at
different anatomical sites like peritoneal B-1a and B-1b cells as well as splenic B-1a
cells from L2 mice had been obtained. Similarly, follicular B-2 cells as well as
peritoneal and splenic B-1a cells from non-transgenic littermates had been analyzed
(Kretschmer et al., 2003b). Based on those array data, genes had been classified
into groups and two of them were further investigated during this work:
1) Genes that were expressed in splenic B-1a cells but revealed only background
expression levels in peritoneal B-1a cells (Group 1),
2) Genes that were expressed in peritoneal and splenic B-1 cells but were
absent in follicular cells (Group 2).
3.1 Group 1 genes
First genes expressed in splenic B-1a cells but not in peritoneal B-1a cells of L2 mice
were analyzed. Differences between B-1 cells from spleen and peritoneum had been
described before which include phenotypic, biochemical as well as functional aspects
(Rothstein, 2002). These differences have led to the suggestion that B-1 cells from
the two different anatomical sites may in fact represent two populations with different
origin. On the other hand, they might simply reflect differences in B-1 cell function at
the respective anatomical sites. Therefore, this question was tackled on the basis of
the following assumptions: If peritoneal B-1 cells and splenic B-1 cells differ in their
origin, a different developmental program should determine their phenotype. Hence,
peritoneal B-1 cells brought into the splenic environment should fail to express
specific genes found in B-1 cells of splenic origin. However, genes that are
expressed due to functional requirements or environmental influences should also
become expressed by peritoneal derived B-1 cells when residing in the spleen.

3. Results
In order to investigate this the following experimental system was used: Peritoneal
lavage cells obtained from L2 mice were transferred into lymphocyte deficient Rag1-/-
mice. In these mice migration of intraperitoneally transferred B-1a cells from
peritoneal lavages into the spleen had been shown before (Kretschmer et al., 2003b).
Thus such transferred B-1 cells should be reisolated from spleen and peritoneum and
the changes in expression of marker genes should be analyzed by RT-PCR and flow
cytometry.
Microarray data were screened for genes expressed in splenic but absent in
peritoneal B-1a cells (Figure 3.1). Then B-1a cells from spleen and peritoneum of
female L2 mice were sorted to high purity (>98.5%) based on the markers IgMhiCD5+
and submitted to RT-PCR to confirm the data obtained by expression arrays.
All of the chosen genes displayed in Figure 3.1A showed the expected expression
pattern by RT-PCR, i.e. being expressed in the splenic B-1a cells and showing low or
no expression in the peritoneal B-1a cells.
To extend this analysis and to base the experiments on more quantitative data
splenic and peritoneal B-1a cells were sorted again to high purity. Cells from male
and female L2 mice were pooled to increase the number of cells analyzed.
Semiquantitative analyses performed on the sorted L2 B-1a cells of two independent
sorts confirmed the expression pattern found for Vcam1 and Spic (Figure 3.2).
Furthermore, mRNA for an additional gene, Adamdec1, was also found in splenic
B-1a cells but not detected in peritoneal B-1a cells. The data for Hpgd varied
between the two independent cell sorting experiments performed. In the first
experiment there was also some expression detected in peritoneal B-1a cells (data
not shown). However, no expression was detected in peritoneal B-1a cells in the
second sorting experiment (Figure 3.2). Expression patterns for Lpl and Mrc2 differed
from the results displayed in Figure 3.1. Message from these genes was now also
detected in peritoneal cavity B-1a cells and expression of Lpl in splenic B-1a cells
was low in contrast to the preceding RT-PCR experiments. Similarly, expression of
Fpr1, an additional gene analyzed, differed from the expectations based on array
data, since it was found in B-1a cells of the peritoneal cavity.
55

3. Results
AL2 B-1a B-1b
Gene Affy_id SP SD PEC SD PEC SD
Ccr3 (CCR3) 99412_at 569 90 61 0 61 0
Vcam1 (VCAM-1) 92559_at 380 67 61 0 61 0
Vcam1 (VCAM-1) 92558_at 16760 1398 61 0 61 0
Adamdec1 (Decysin) 98976_at 314 84 61 0 61 0
Spic (Spi-C) 103454_at 752 86 61 0 61 0
Lpl (lipoprotein lipase
(LPL)) 95611_at 2104 400 69 12 482 210
Hpgd (NAD+-dependent 15-hydroxyprostaglandin
dehydrogenase)
93351_at 1117 93 61 0 61 0
Mrc2 (mannose receptor,
C type (CD206)) 103226_at 2326 191 67 8 463 55
Fpr1 (N-formyl peptide
receptor) 99387_at 869 125 63 4 61 0
Figure 3.1. Differentially expressed genes among splenic and peritoneal B-1a cells and peritoneal B-1b cells from L2 mice. A) Array data of differentially expressed genes from spleen (SP) and peritoneum (PEC) as well as B-1b from peritoneum of L2 mice. The unique Affymetrix probe set identifier (Affy_id), mean average difference values are presented in bold letters and standard deviation (SD) of three replicate experiments are shown. Background values are represented by a mean average value of 61. B) Splenic B-1a (Sp B-1a) and peritoneal B-1a (Pec B-1a) were sorted according to expression of IgMhiCD5+ and analyzed by RT-PCR. Intron spanning primers were used to exclude genomic DNA. Control is water control.
B
Pec B
-1a
Sp B-1a
Contro
l
Vcam1
Mrc2
Lpl
Hpgd
Spic
Ccr3
Cd5
Hprt
56

3. Results
A
IgM
Spleen Peritoneum
IgD
IgM
CD5
IgM
99,5% 98,1%
Gate: IgMhiIgDlo
98,8%
CD5
IgMIgM
Spleen Peritoneum
IgD
IgMIgM
CD5
IgMIgM
99,5% 98,1%
Gate: IgMhiIgDlo
98,8%
CD5
Hprt
Cd5
Adamdec1
Hpgd
Lpl
Mrc2
spleen peritoneum control
1:3 1:3
Vcam1
Spic
Fpr1
B
Figure 3.2. Semiquantitative RT-PCR analysis of sorted B-1a cells from peritoneum and spleen of L2 mice. A) Reanalysis of cells sorted from respective sites of L2 mice demonstrated a purity of 98,1% for peritoneal IgMhiIgDloCD5+ cells and 98,8% for splenic IgM+CD5+ cells. B) Semiquantitative RT-PCR analysis on sorted cells from A. cDNA was diluted threefold for each step. Data are representative for one of two experiments.
The expression of the respective genes was also tested in the B-1a cell population of
non-transgenic mice. To this end, B-1a cells from spleen and peritoneum of female
BALB/c mice were sorted and the same semiquantitative RT-PCR was conducted on
the sorted samples as described in Figure 3.3. These data confirmed the expression
data observed for L2 mice. Vcam1, Adamdec1, Spic and Hpgd were expressed in
splenic but not in peritoneal B-1a cells. Message of Lpl, Mrc2 and Fpr1 was found in
both peritoneal and splenic B-1a cells.
57

3. Results
CD5
IgM
98,4%
Spleen Peritoneum
IgD
IgM
CD5
IgM
Gate: IgMhiIgDlo
97,3%
0,02%
98,6%
CD5
IgMIgM
98,4%
Spleen Peritoneum
IgD
IgMIgM
CD5
IgMIgM
Gate: IgMhiIgDlo
97,3%
0,02%
98,6%
A
Fpr1
B spleen peritoneum control
Hprt
Spic
Vcam1
Hpgd
Lpl
Adamdec1
Cd5
Mrc2
Ccr3
1:3 1:3
Figure 3.3. RT-PCR analysis of sorted B-1a cells from BALB/c mice. Spleen cells were sorted by IgM+CD5+ expression (purity: 98,4%), peritoneal B-1a cells were sorted by IgMhiIgDloCD5+ expression (purity: 98,6%). R4 represents gate for B-2 cells and reanalysis in R4 indicates that no B-2 cells were present in peritoneal B-1a samples.
3.1.1 Flow cytometrical analysis of VCAM-1 expression
Since for VCAM-1 antibodies are available, its expression was investigated at the
protein level. Flow cytometrical analyses were performed on spleen and peritoneal
cells of L2 mice and non-transgenic littermates. VCAM-1 expression was readily
detected on gated splenic B-1a cells (Figure 3.4).
58

3. Results
PeritoneumR3
IgMIgM
VCA
M-1
control VCAM-1
L2
Gate: R3
0,1% 3,9%
CD
5
IgM
CD
5C
D5
IgMIgM
VCAM-1VCAM-1
Cou
nts
ntg
Gate: R3
0,2% 1,2%
VCA
M-1
control VCAM-1
R3
IgMIgM
VCAM-1VCAM-1
Cou
nts
CD
5C
D5
IgMIgM
Spleen
ntg
Gate: R3
VCA
M-1
control VCAM-1
IgMIgM
0,2% 24,8%
VCAM-1
Cou
nts
L2
VCA
M-1
control VCAM-1
Gate: R3
0,1% 24,0%
IgMIgM
VCAM-1VCAM-1
Cou
nts
Cou
nts
CD
5IgM
CD
5C
D5
IgMIgM
CD
5
IgM
CD
5C
D5
IgMIgM
R3R3 R3
Figure 3.4. Flow cytometrical analysis of VCAM-1 expression on spleen and peritoneal cells from L2 mice and non-transgenic littermates. The staining was performed on pooled cells with 3 mice per group. Dot plots and histograms show cells gated by region 3 (R3). Black lines in histograms represent control staining and green lines staining with VCAM-1 antibody.
59

3. Results
Interestingly, although no VCAM-1 expression was detected by RT-PCR, VCAM-1
positive cells could be found by flow cytometrical analysis of peritoneal IgM+CD5+
cells (Figure 3.4 and Table 3.1). The staining was apparently specific since it could
be only marginally lowered by blockage of Fc-receptors.
Table 3.1. Analysis of VCAM-1 expression on peritoneal and splenic B-1a cells of L2 mice.
41,84,74
spleenperitoneumMouse
31,24,43
42,1 ± 7,85,3 ± 0,8Mean
48,65,92
46,66,01
VCAM-1 expression on gated IgM+CD5+ cells [% of gated]1L2
41,84,74
spleenperitoneumMouse
31,24,43
42,1 ± 7,85,3 ± 0,8Mean
48,65,92
46,66,01
VCAM-1 expression on gated IgM+CD5+ cells [% of gated]1L2
1 Table shows four independent stainings of individual L2 mice. All samples were treated with mouse serum and Fc-block before staining.
3.1.2 Intravenous transfer of peritoneal derived B-1 cells
First, the question was addressed of whether peritoneal B-1 cells could be influenced
to express the respective marker genes after migration to the spleen. To this end
cells obtained from peritoneal lavage of L2 mice were intravenously (i.v.)
administered into Rag1-/- mice. This administration route ensures that the cells enter
the spleen as well as the peritoneum. After 2,5 weeks cells from spleen and
peritoneum of the transferred Rag1-/- mice (L2→Rag1-/-) were sorted and analyzed by
RT-PCR (Figure 3.5) and flow cytometry (Figure 3.6 and Figure 3.7).
60

3. Results
L2 → RAG-1-/-
non-transferredRAG-1-/-
control mouse
Sort reanalysis
Adamdec
peritoneum control
1:31:3 1:31:3
Hprt
Hpgd
spleen
Vcam-1
Spic
Cd5
A
B
spleen peritoneum
CD5
IgM
Figure 3.5. Cell sorting and semiquantitative RT-PCR analysis of cells from Rag1-/- mice transferred i.v. with cells from peritoneal lavages of L2 mice. A) Results of cells sorted for IgM+CD5+ from peritoneum and spleen of transferred mice. Non-transferred Rag1-/- mice were included as staining controls. B) Semiquantitative RT-PCR analysis of sorted IgM+CD5+ cells from A.
61

3. Results
78,05
77,76
79,57 ± 4,0mean
76,64
86,03
77,42
77,51
% of IgM+VCAM-1+
in IgM+CD5+
gate
L2 → Rag1-/-
78,05
77,76
79,57 ± 4,0mean
76,64
86,03
77,42
77,51
% of IgM+VCAM-1+
in IgM+CD5+
gate
L2 → Rag1-/-
59,53L2 control 59,53L2 control
L2 → Rag1-/- L2 Rag1-/-
L2 → Rag1-/- L2
Analysis of L2 → Rag1-/- transfer i.v.: spleen
A
B
C
Figure 3.6. Flow cytometrical analysis of VCAM-1 expression on spleen cells from Rag1-/- mice transferred i.v. with peritoneal cells from L2 mice. A) shows gated regions of splenic cells isolated from Rag1-/- recipient mice, an L2 control mouse and a non-transferred Rag1-/- control mouse. B) displays VCAM-1 stainings of cells from gate R7 and comparison with controls representing secondary reagent staining without addition of primary antibodies. Data shown in A and B represent the results from single mice. C) summarizes the results for VCAM-1 staining in IgM+CD5+ cells of six transferred individuals as well as an L2 control mouse after subtraction of background staining.
62

3. Results
8,65
10,6 ± 1,3mean
10,64
11,13
10,82
12,11
% of IgM+VCAM-1+
in IgM+CD5+
gate
L2 → RAG-1-/-
8,65
10,6 ± 1,3mean
10,64
11,13
10,82
12,11
% of IgM+VCAM-1+
in IgM+CD5+
gate
L2 → RAG-1-/-
6,95L2 control 6,95L2 control
Analysis of L2 → Rag1-/- transfer i.v.: peritoneum
L2 → Rag1-/- L2 Rag1-/-A
B
L2 → Rag1-/- L2
C
Figure 3.7. Flow cytometrical analysis of VCAM-1 expression on peritoneal cells from Rag1-/- mice transferred i.v. with peritoneal cells from L2 mice. A) shows gated regions of peritoneal cells isolated from Rag1-/- recipient mice, an L2 control mouse and a non-transferred Rag1-/- control mouse. B) displays VCAM-1 stainings of cells from gate R7 and comparison with controls representing stainings by secondary reagent without addition of primary antibodies. Data shown in A and B represent results from single mice. C) summarizes the results for VCAM-1 staining in IgM+CD5+ cells of five transferred individuals as well as an L2 control mouse after subtraction of background staining.
63

3. Results
The spleen of transferred mice (Figure 3.6) contained IgM+CD5+ and low numbers of
IgM+CD5- cells. CD5+IgM- cells representing T cells were also seen. In RT-PCR
(Figure 3.5) the marker genes Vcam-1, Spic and Adamdec1 were expressed in the
splenic CD5+IgM+ cells of the L2→Rag1-/- mice while expression in the peritoneal
cavity was low or absent. However, Hpgd message could be seen in these cells.
RT-PCR data for Vcam1 were confirmed when expression of the VCAM-1 protein
was analyzed in flow cytometry. Protein expression was readily detectable in the
splenic IgM+CD5+ cells of the transferred Rag1-/- mice (Figure 3.6 B and C). In
comparison to the L2 control mice the expression level in spleen seemed even
slightly elevated. In peritoneal cavity (Figure 3.7) similar levels of VCAM-1 protein
expression were observed between transferred mice and control mice. Thus,
peritoneal B-1 cells change to a splenic B-1 cell phenotype when residing in the
spleen of the i.v. transferred Rag1-/- mice.
3.1.3 Peritoneal transfer of B-1 cells - kinetics
Next the question was addressed of whether peritoneal B cells also switch on the
expression of the respective genes if administered via the peritoneal cavity, the site
of their original location, and then enter the spleen. This should resemble more
closely the situation found in the body when peritoneal B-1 cells migrate via the blood
stream.
First, the kinetic of reconstitution was studied in order to find the optimal time point
for the analysis of IgM+CD5+ cells of the spleen. Cells from peritoneal lavages of L2
mice were administered i.p. into Rag1-/- mice and single mice were analyzed at
intervals for IgM+CD5+ cells in the spleen and peritoneum.
As it can be seen in Figure 3.8, the percentage of IgM+CD5+ cells in the spleen
increased until 3 weeks after transfer and then remained constant. Similarly, the
percentage of IgM+CD5+ cells in the peritoneal cavity peaked 3 weeks after transfer.
After that time point cell numbers remained constant. Since the highest number of
IgM+CD5+ cells was found in spleen and peritoneum 3 weeks after transfer, this time
period was chosen for subsequent transfers.
64

3. Results
R7: 30,1% R7: 0,8%
R7: 30,5% R7: 1,1%
R7: 51,1% R7: 2,0%
R7: 44,0% R7: 1,6%
R7: 45,6% R7: 1,4%
day 7
day 15
day 23
day 29
day 32
0,963,3
95,1 0,6
32,52,8
56,3 8,3
32,55,4
56,6 5,4
1,24,2
92,6 2,0
53,65,8
29,5 11,1
2,78,7
84,2 4,4
47,56,5
34,7 11,3
1,98,2
84,7 5,2
48,07,3
28,8 15,8
2,318,8
85,7 3,11
Figure 3.8. Kinetics of reconstitution of Rag1-/- mice intraperitoneally transferred with cells from peritoneal lavages of L2 mice. Dot plots are gated on lymphoid cells. Region 7 (R7) represents B-1a cells, percentage of IgM+CD5+ cells in R7 is given. Additional numbers represent percentage of lymphoid cells in the respective quadrants of the dot plot.
65

3. Results
During the establishment of the kinetics VCAM-1 expression was also followed up at
the protein level in IgM+CD5+ cells. The splenic cells were positive for VCAM-1
surface staining at all time points investigated (Figure 3.9). This demonstrated the
potential of these cells to upregulate VCAM-1 expression in B-1 cells that entered the
spleen independent of the way of B-1 cell administration.
Gate: IgM+CD5+
VCAM-1
day 7 day 15 day 23 day 29 day 32
Figure 3.9. VCAM-1 expression on splenic IgM+CD5+ cells from Rag1-/- mice transferred with peritoneal cells of L2 mice. Time points of analysis are given in each histogram. Black lines represent controls, blue lines represent staining with VCAM-1 antibody.
To follow up whether also the other marker genes are expressed in the transferred
B-1 cells, transfers were repeated. Peritoneal lavages from L2 mice were transferred
i.p. into Rag1-/- mice and 3 weeks after transfer cells from spleen and peritoneum of
these mice were isolated and pooled. Samples were then split. One fraction from
both organs was sorted for IgM+CD5+ expression and used in RT-PCR. The other
fraction was used for flow cytometrical analyses concerning VCAM-1 expression.
As already indicated by the VCAM-1 staining performed during the transfer kinetic
Vcam1 message was detected in the IgM+CD5+ spleen cells from the transferred
mice. Also Adamdec1, Spic and Hpgd were expressed (Figure 3.10). In contrast only
slight expression of Hpgd and Spic could be observed in the peritoneal cavity while
message of Vcam1 and Adamdec1 was absent.
Similarly, flow cytometrical analysis of spleen cells from mice transferred with
peritoneal cells revealed VCAM-1 protein expression on gated splenic IgM+CD5+
cells (Figure 3.11).
66

3. Results
spleen peritoneum control
1:31:3 1:31:3
spleen peritoneum
non-transferredRag1-/-
control mouse
Sort reanalysis
CD5
IgM
A
B
L2 → Rag1-/-
Adamdec1
Hprt
Hpgd
Vcam1
Spic
Cd5
Figure 3.10. Cell sorting and analysis of IgM+CD5+ cells from peritoneum and spleen of Rag1-/- deficient mice transferred i.p. with peritoneal cells of L2 mice. A) Sort and reanalysis of sorted cells. B) Semiquantitative RT-PCR with samples from A.
67

3. Results
73,65
72,0 ± 2,6mean
67,94
72,53
74,72
71,21
% of IgM+VCAM-1+
in IgM+CD5+
gate
L2 → Rag1-/-
73,65
72,0 ± 2,6mean
67,94
72,53
74,72
71,21
% of IgM+VCAM-1+
in IgM+CD5+
gate
L2 → Rag1-/-
51,9L2 control 51,9L2 control
Analysis of L2 → Rag1-/- transfer i.p.: spleen
L2 → Rag1-/- L2
L2 → Rag1-/- L2 Rag1-/-A
B
C
Figure 3.11. Flow cytometrical analysis of spleen cells of Rag1-/- mice intraperitoneally transferred with peritoneal lavages from L2 mice. A) shows gated regions of splenic cells isolated from a Rag1-/- recipient, an L2 control mouse and a non-transferred Rag1-/- control mouse. B) displays VCAM-1 stainings of cells from gate R7 and comparison with controls representing stainings with secondary reagent without addition of primary antibodies. Data shown in A) and B) represent results from single mice. C) summarizes the results for VCAM-1 staining in IgM+CD5+ cells of five transferred individuals as well as an L2 control mouse after subtraction of background staining.
68

3. Results
6,84
7,1 ± 0,3mean
7,13
6,92
7,61
% of IgM+VCAM-1+
in IgM+CD5+
gate
L2 → Rag1-/-
6,84
7,1 ± 0,3mean
7,13
6,92
7,61
% of IgM+VCAM-1+
in IgM+CD5+
gate
L2 → Rag1-/-
5,2L2 control 5,2L2 control
Analysis of L2 → Rag1-/- transfer i.p.: peritoneum
L2 → Rag1-/- L2
C
L2 → Rag1-/- L2 Rag1-/-A
B
Figure 3.12. Flow cytometrical analysis of peritoneal cells of individual Rag1-/- transfer mice transferred i.p. with peritoneal lavages from L2 mice. A) shows gated regions of peritoneal cells isolated from a Rag1-/- recipient, an L2 control mouse and a non-transferred Rag1-/- control mouse. B) displays VCAM-1 stainings of cells from gate R7 and comparison with controls representing secondary reagent without addition of primary antibodies. Data shown in A) and B) represent results from single mice. C) summarizes the results for VCAM-1 staining in IgM+CD5+ cells of four transferred individuals as well as an L2 control mouse after subtraction of background staining.
69

3. Results
Flow cytometrical analysis of cells isolated from the peritoneal cavity of the Rag1-/-
mice transferred with peritoneal cells from L2 mice displayed a low frequency of cells
expressing VCAM-1 amongst the IgM+CD5+ gated cells while in RT-PCR analysis no
expression could be observed (e.g. Figure 3.10 and Figure 3.12). This discrepancy of
protein and mRNA expression of VCAM-1 was observed reproducibly in all transfer
experiments. Similarly, as shown above, in L2 mice no RT-PCR product could be
obtained from peritoneal B-1a cells while VCAM-1 expressing cells were detected in
flow cytometry (Figure 3.4). This discrepancy was now further investigated. Since
only low numbers of VCAM-1 protein positive cells were present in the IgM+CD5+ B
cell population it was possible, that the RT-PCR performed was not sensitive enough
to detect VCAM-1 message within this cell population.
Therefore, CD19+ peritoneal B-1 cells from L2 mice were sorted for VCAM-1 protein
expression (Figure 3.13). The reanalysis showed that the sorted sample contained
more than 90% of cells positive for VCAM-1 surface expression. These cells were
then subjected to RT-PCR to test for the presence of Vcam1 message. Interestingly,
no Vcam1 specific cDNA could be observed even at high PCR cycle numbers (Figure
3.13). This was true for two independent primer pairs used. Thus, in peritoneal B-1
cells VCAM-1 protein expression without expression of mRNA is observed. One
explanation could be that these cells represent a population of migratory cells which
have down-regulated Vcam1 expression after entry of the peritoneal cavity but still
display the protein on the surface.
3.1.4 Transfer of VCAM-1 negative peritoneal B-1 cells
The sorted CD19+ cells that were negative for surface VCAM-1 protein were used in
an additional transfer experiment (for reanalysis see Figure 3.13). To exclude an
effect due to the absence of T cells in the sorted population the transfers also
included peritoneal lavage cells of Igα-/- mice. These mice are devoid of B cells due
to a block of B cell development (Pelanda et al., 2002). Thus, all peritoneal cell
populations including T cells are found in these mice except B cells. Due to the low
numbers of sorted cells only two Rag1-/- mice could be transferred. Therefore, sorting
cells from transferred mice to obtain samples for RT-PCR was not possible since two
mice would not supply sufficient amounts of cells. Hence, the mice were analyzed by
flow cytometry.
70

3. Results
VCAM-1
CD19
Analysis ReanalysisA
Normalization of templates by semiquantitative RT-PCR
HPRT
VCAM 7/8
VCAM A/B
CD19+ VCAM-1+
undi
l.
1:3
1:9
undi
l.
1:3
1:9
CD19+ VCAM-1- L2 spleenB-1a
1:3
1:9
1:271:3
1:9
1:27
L2 PeCB-1a
1:3
1:9
1:271:3
1:9
1:27
undi
l.
1:3
1:9
undi
l.
1:3
1:9
B
C 1 2 3 4 5 6 7 8
Figure 3.13. Analysis of Vcam1 expression in peritoneal CD19+ cells of L2 mice. A) The left dot plot shows peritoneal cells stained for VCAM-1 and CD19 before sorting. The two dot plots on the right show reanalyses of VCAM-1+CD19+ cells or VCAM-1-CD19+ cells, respectively. B) cDNA from sorted cell samples shown in A was prepared and normalized by semiquantitative RT-PCR according to expression of the housekeeping gene HPRT. C) Samples with the respective normalized highest amounts of cDNA were tested for Vcam1 expression by PCR using different intron-spanning primer pairs (VCAM 7/8 and VCAM A/B) and 38 cycles during PCR. cDNA-Templates: lane 1: CD19+VCAM-1+ undiluted sample; lane 2: CD19+VCAM-1+ undiluted control (without reverse transcriptase (RT)); lane 3: CD19+VCAM-1- undiluted sample; lane 4: CD19+VCAM-1- undiluted control (without RT); lane 5: B-1a cells from spleen of L2 mice (1:3 dilution); lane 6: B-1a cells from peritoneal cavity of L2 mice (1:3 dilution); lane 7 positive control (total spleen cells); lane 8: water control.
71

3. Results
Gate: IgM+CD5+
L2→Rag1-/- L2 control
Peritoneum
Spleen
L2→ Rag1-/-
L2 control
CD5
IgM
IgM
#1 #2
VCAM-1
IgM
CD5
VCAM-1
IgM
Gate: IgM+CD5+
L2→Rag1-/-
#1L2→Rag1-/-
#2
Figure 3.14. Flow cytometrical analysis of cells from peritoneum and spleen of Rag1-/- mice transferred with peritoneal CD19+VCAM-1- cells from L2 mice. Transfers included a cotransfer of cells from peritoneal lavages of Igα-/- mice to provide T cell help if necessary. Two individual mice were analyzed two weeks after transfer. Peritoneal and splenic cells from an L2 mouse were stained as control. Rag1-/- control mice showed no IgM positive cells (data not shown). Spleen sample with VCAM-1 staining of the second L2 →Rag1-/- mouse was not determined for technical reasons.
72

3. Results
VCAM-1 expression comparable to that found in L2 control mice could be detected in
splenic IgM+CD5+ cells of the recipient mice (Figure 3.14). This result confirmed the
intrinsic potential of peritoneal IgM+CD5+ cells to upregulate the expression of
VCAM-1. VCAM-1 expression was also found on the IgM+CD5+ cells in the peritoneal
cavity of the recipient mice. This might further support the idea that these cells
belong to a population that has gained VCAM-1 protein expression while migrating
into different sites of the body and after reentry of the peritoneal cavity downregulate
Vcam1 gene expression.
3.1.5 Analysis of VCAM-1 deficient mice
VCAM-1 is an immunoglobulin-like transmembrane adhesion molecule that effects
lymphocyte function in many ways. Thus it plays a role in lymphocyte migration
(Cook-Mills, 2002), in rescue of germinal center B cells or thymocytes from apoptosis
(Lindhout et al., 1993; Koopman et al., 1994; Koopman et al., 1997; Zaitseva et al.,
1998) and might function in maturation and costimulation of T cells (Burkly et al.,
1991; Damle et al., 1992; Schlegel et al., 1995). However, VCAM-1 in these
examples is expressed by endothelial, epithelial or follicular dendritic cells. The
impact on lymphocytes is mediated via interaction with integrin VLA-4 (α4β1), the
major ligand of VCAM-1, which is expressed by the lymphocytes.
In contrast only few examples for VCAM-1 expression by lymphocytes themselves
exist. Thus thymocytes and apoptotic T cells were shown to express VCAM-1
(Ishiyama et al., 1998). In B cells, VCAM-1 protein expression was demonstrated on
blood derived human peripheral B lymphocytes and in a human plasmacytoma at the
RNA and protein level (Xia et al., 2001). However, nothing is known so far about the
function of VCAM-1 expressed by the B cells. In the context with the finding that B-1
cells in spleen express VCAM-1 the impact of its expression on B cells was further
investigated in this work.
For this purpose a mouse model that was supposed to delete VCAM-1 specifically in
B cells was studied. Mice with loxP-flanked (floxed) conditional Vcam1 null alleles
were crossed with mice expressing the Cre protein under the control of the B cell
specific CD19 promoter. Homozygous mice for the floxed Vcam1 alleles and
heterozygous for CD19cre were termed flox/flox; cre/+. Non-transgenic littermates
with respect to Cre-expression were termed flox/flox; +/+.
73

3. Results
First, the deletion of Vcam1 alleles in B cells of flox/flox; cre/+ mice was tested. To
this end CD19+ B cells were sorted from spleen and peritoneum of these mice and
analyzed by Southern blot. Additionally, CD3+ T cells were isolated from the same
samples by cell sorting and included as negative controls (Figure 3.15). Most of the
CD19+ B cells showed a deletion of the functional alleles whereas CD3+ T cells kept
the floxed alleles in an undeleted state. However, faint bands for the non-deleted
alleles were detected in the CD19+ fraction of the Southern blot.
Next, flow cytometrical analyses of B cell compartments from flox/flox; +/+ control
mice and flox/flox; cre/+ mice was carried out on pooled cell populations (Figure
3.16). A twofold reduction of IgMhiIgDlo B-1 cell numbers (Figure 3.16 A, R2) and a
fourfold reduction of B-1a cell numbers could be observed (Figure 3.16 A, R3) in the
peritoneal cavity of flox/flox; cre/+ compared to flox/flox; +/+ mice. The proportion of
the IgD+IgMlo B-2 cells in the peritoneum, however, was nearly the same (Figure 3.16
A, R1). In the spleen, the follicular B cell compartment was similar in flox/flox; +/+ and
flox/flox; cre/+ mice and similar proportions of marginal zone B cells were detected
(Figure 3.16 B; R4 and R5). Furthermore, no differences between IgM+CD5+ cells in
the spleens of both strains could be observed (Figure 3.16 B, R3).
To assess the significance of these data the stainings were repeated with individual
mice (see Figure 3.17 and Figure 3.18). Control mice bearing wildtype alleles for
Vcam1 and the CD19 Cre transgene (+/+; cre/+) were included since Sato and
colleagues had demonstrated that the development of B-1 cells in CD19 deficient
mice is severely decreased (Sato et al., 1996b). Thus, the observed reduction of B-1
cells could be due to the CD19 deficiency in one allele of the flox/flox; cre/+ mice.
However, since only a few of these mice were obtained from the breedings, analysis
of only three +/+;cre/+ mice could be performed within the given time frame (see
Figure 3.17 and Figure 3.18). The reduction of peritoneal B-1 and B-1a cells could be
observed in all flox/flox; cre/+ mice (Figure 3.17 tables B, C). However, this reduction
was also observed in the +/+;cre/+ control mice. Thus, the reduction is most likely
due to the lower level of CD19 expression and not due to the lack of VCAM-1
expression.
74

3. Results
peritoneum
98,4CD3+#3
Purity [%]PopulationMouse
97,9CD3+
98,3CD19+#2
97,0CD19+
CD19+
CD3+
CD19+
spleen
97,5
Pool#1-#3
97,9
97,4#1
peritoneum
98,4CD3+#3
Purity [%]PopulationMouse
97,9CD3+
98,3CD19+#2
97,0CD19+
CD19+
CD3+
CD19+
spleen
97,5
Pool#1-#3
97,9
97,4#1
CD
19
CD3
A
C
B
CD
19+
Spleen PeC
Pool
CD
19+
CD
3+
#1 #2 #3
CD
19+
CD
3+
CD
19+
CD
3+
6 kb
4.5 kb
3 kb
D
neo
BamHIBamHIBamHIBamHI
BamHIBamHI
IIII III
3 kb 6 kb
BamHIBamHI BamHIBamHI
4,5 kb
III
(1)
(2)
Figure 3.15. Isolation of CD3+ T cells and CD19+ B cells from flox/flox; cre/+ mice and Southern blot on sorted samples. Three mice were analyzed individually. A) Reanalyses of sorted splenic B and T cells from mouse #2 and from CD19+ sorted pooled peritoneal cells from mice #1-3 (dot plot on the right). B) Summary for all sorted samples. C) Southern blot of sorted samples. DNA isolated from the respective samples was digested with BamHI and hybridized with a radiolabeled Vcam1 specific probe. It consists of a mixture of two BglII/ SpeI restriction fragments. Floxed alleles yield two restriction fragments at 6 kb and 3 kb, deleted alleles yield a 4,5 kb restriction fragment. D) Schematic map of the 5’ part of the targeted Vcam1 locus (according to Terry et al., 1997) . LoxP sites are displayed as blue ovals, promoter is shown as orange box, exons are indicated by gray boxes and roman numbers. Green boxes indicate hybridization sites for the Vcam1 specific probe.
75

3. Results
Spleen
IgD
Peritoneal cavity
flox/flox; +/+ flox/flox; cre/+ CD5
IgM
A
CD5
IgM
CD23
CD21
Gate: CD19+
B
R1: 23,6
R2: 17,4
R1: 17,8
R2: 7,2
R3: 1,4 R3: 1,2
R4: 65,7 R4: 75,1
Gate: CD19+
R5: 3,4 R5: 2,8
flox/flox; +/+ flox/flox; cre/+
R3: 11,9
38 178 37
38 178 37
R3: 3,1
57 69 28
40 315 42
43 320 34
flox/flox; +/+ flox/flox; cre/+ flox/flox; +/+ flox/flox; cre/+
Figure 3.16. Flow cytometrical analysis of B cell subsets in flox/flox; +/+ and flox/flox; cre/+ mice. A) Peritoneal staining. R1: IgD+IgM+ B-2 cells; R2: IgDlo/negIgMhi B-1 cells; R3: B-1a cells. B) Splenic staining. R3: B-1a; R4: follicular B-2; R5: marginal zone B cells. Stainings represent pooled populations from 3 mice.
B-2 cell numbers in the peritoneal cavity were comparable between flox/flox; +/+ and
flox/flox; cre/+ mice (Figure 3.17). Similarly, in the spleen of these mice no significant
differences could be detected in the B cell compartments between the different
mouse types (Figure 3.18). To extend these studies, also VCAM-1 expression on B
cells was tested in these mice. Surprisingly, no difference in VCAM-1 expression on
cells from flox/flox; +/+ and flox/flox; cre/+ mice gated for IgM+ could be observed
(Figure 3.19) in independent experiments.
76

3. Results
24,516,615,41
38,116,721,72
29,733,132,13
n.d.19,115,06
n.d.14,319,35
n.d.17,216,04
[%] of IgD+IgM+A
30,8 ± 6,919,5 ± 6,819,9 ± 6,5Mean
+/+;cre/+
flox/flox;cre/+
flox/flox;+/+
24,516,615,41
38,116,721,72
29,733,132,13
n.d.19,115,06
n.d.14,319,35
n.d.17,216,04
[%] of IgD+IgM+A
30,8 ± 6,919,5 ± 6,819,9 ± 6,5Mean
+/+;cre/+
flox/flox;cre/+
flox/flox;+/+
13,218,538,51
11,811,021,82
23,912,222,23
n.d.10,737,56
n.d.11,725,85
n.d.13,022,44
16,3 ± 6,612,9 ± 2,928,0 ± 7,9Mean
+/+;cre/+
flox/flox;cre/+
flox/flox;+/+
[%] of IgDloIgMhiB
13,218,538,51
11,811,021,82
23,912,222,23
n.d.10,737,56
n.d.11,725,85
n.d.13,022,44
16,3 ± 6,612,9 ± 2,928,0 ± 7,9Mean
+/+;cre/+
flox/flox;cre/+
flox/flox;+/+
[%] of IgDloIgMhiB
8,17,726,91
5,85,610,32
14,78,614,73
n.d.6,329,36
n.d.8,221,85
n.d.8,321,64
9,5 ± 4,67,5 ± 1,220,8 ± 7,2Mean
+/+;cre/+
flox/flox;cre/+
flox/flox;+/+
[%] of IgM+CD5+C
8,17,726,91
5,85,610,32
14,78,614,73
n.d.6,329,36
n.d.8,221,85
n.d.8,321,64
9,5 ± 4,67,5 ± 1,220,8 ± 7,2Mean
+/+;cre/+
flox/flox;cre/+
flox/flox;+/+
[%] of IgM+CD5+CPeritoneal cavity
B-2 B-1
B-1a
Figure 3.17. Flow cytometrical analysis of peritoneal cells isolated from individual flox/flox; cre/+ mice and littermate control mice. Mean values and standard deviations of the mean from each set are given at the bottom of each table. Results are derived from two independent experiments. Mice 1-3 experiment 1; mice 4-6 experiment 2.
To confirm these results, splenic cells from individual flox/flox; +/+ and flox/flox; cre/+
mice were sorted and analyzed by RT-PCR for Vcam1 mRNA (Figure 3.20). For this
purpose, a forward primer binding in exon 1 and a reverse primer binding in exon 3 of
the Vcam1 gene were used. Thus, the forward primer lies within the deletable region
of the floxed Vcam1 alleles (for overview see schematic map Figure 3.15).
77

3. Results
77,582,274,31
81,782,176,52
85,882,276,93
n.d.76,370,66
n.d.74,273,35
n.d.75,168,84
81,7 ± 4,278,7 ± 3,973,4 ± 3,2Mean
--/++++/+-++/--
[%] of CD19+CD23+CD21+F
77,582,274,31
81,782,176,52
85,882,276,93
n.d.76,370,66
n.d.74,273,35
n.d.75,168,84
81,7 ± 4,278,7 ± 3,973,4 ± 3,2Mean
--/++++/+-++/--
[%] of CD19+CD23+CD21+F
53,342,357,31
45,049,951,72
43,956,147,43
n.d.60,551,36
n.d.58,457,35
n.d.60,960,74
47,4 ± 5,154,7 ± 7,354,3 ± 4,9Mean
--/++++/+-++/--
[%] of IgM+CD5-E
53,342,357,31
45,049,951,72
43,956,147,43
n.d.60,551,36
n.d.58,457,35
n.d.60,960,74
47,4 ± 5,154,7 ± 7,354,3 ± 4,9Mean
--/++++/+-++/--
[%] of IgM+CD5-E
2,24,13,31
2,23,83,72
1,14,25,23
n.d.2,84,96
n.d.5,33,05
n.d.3,07,64
1,8± 0,63,9 ± 0,94,6 ± 1,7Mean
--/++++/+-++/--
[%] of CD19+CD23loCD21+G
2,24,13,31
2,23,83,72
1,14,25,23
n.d.2,84,96
n.d.5,33,05
n.d.3,07,64
1,8± 0,63,9 ± 0,94,6 ± 1,7Mean
--/++++/+-++/--
[%] of CD19+CD23loCD21+G
Spleen
FO MZ
1,583,61,721
1,662,61,892
2,52,32,433
n.d.1,211,686
n.d.0,551,895
n.d.1,241,054
1,9 ± 0,51,9 ± 1,11,8 ± 0,4Mean
--/++++/+-++/--
[%] of IgM+CD5+D
1,583,61,721
1,662,61,892
2,52,32,433
n.d.1,211,686
n.d.0,551,895
n.d.1,241,054
1,9 ± 0,51,9 ± 1,11,8 ± 0,4Mean
--/++++/+-++/--
[%] of IgM+CD5+D
B-1a
Figure 3.18. Flow cytometrical analysis of spleen cells isolated from individual flox/flox; cre/+ mice and littermate control mice. Mean values and standard deviations of the mean from each set are given below the results for individual mice. Results were derived from two independent experiments. Mice 1-3 experiment 1; mice 4-6 experiment 2.
Vcam1 expression was detectable in both samples. Thus, both mouse types contain
cells in which the floxed part of the Vcam1 gene was not deleted by CD19 controlled
Cre. This might explain the lack of a phenotype in the flox/flox; cre/+ mice.
78

3. Results
IgM
VCAM-1flox/flox; +/+ flox/flox; cre/+
gate: IgM
13,3 14,6
Figure 3.19. Dot plots showing VCAM-1 expression on IgM+ gated spleen cells of flox/flox; +/+ and flox/flox; cre/+ mice. Dot plots are representative for a VCAM-1 staining of two individual mice (total mice analyzed: n=3 per group). Numbers indicate percentage of VCAM-1+ B cells in comparison to non-stained controls. On average VCAM-1 was expressed in 14,2% ± 0,8 of splenic IgM+ cells in the tested flox/flox; +/+ mice and 15,1% ± 2,5 in flox/flox; cre/+ mice.
Hprt
Vcam1 (C/D)
flox/flox; +/+
93% 91%
IgM
CD
19
A
B control
flox/flox; cre/+
flox/flox; +/+ flox/flox; cre/+
Figure 3.20. Sort and analysis of spleen cells from flox/flox; +/+ and flox/flox; cre/+ mice. A) Reanalysis of CD19+IgM+ sorted samples from spleen of indicated mice from VCAM-1flox/flox/CD19cre breedings. B) Semiquantitative RT-PCR on sorted samples from A. The used forward primer (C) for Vcam1 PCR binds in exon 1, the reverse primer (D) in exon 3. Samples were normalized upon expression of the housekeeping gene Hprt.
79

3. Results
3.2 Group 2 genes
The data obtained from the expression arrays were also used in order to find
molecules specifically expressed in B-1 cells. Candidate genes that were expressed
in B-1 cell populations in spleen as well as peritoneum but absent in B-2 cells were
determined and classified into group 2 by these criteria. The expression array data
were screened strictly for this purpose: First, only genes expressed in B-1 cells of
both L2 and BALB/c mice were accepted and second, the mean average difference
values for gene expression in B-2 cells had to be at background level, i.e. at 61,
indicating the absence of respective gene expression in these cells.
Four candidate genes were obtained by this stringent selection (Table 3.2) and first
investigated by RT-PCR in order to confirm the array data.
Table 3.2. Group 2 genes representing candidate genes for B-1 cell specific markers.
L2 BALB/c
Peritoneum Spleen Peritoneum Spleen
Gene (Protein) Affy id B-1a SD2 B-1b SD B-1a SD B-1a SD B-1a SD B-2 SD
F11r (Junction cell
adhesion molecule 1,
JAM1)
103816_at 8081 38 1089 107 584 153 1283 291 439 216 61 1
Adml (ADM,
Adrenomedullin)
102798_at 683 49 491 80 1327 470 986 229 1267 332 61 0
Api6 (Apoptosis inhibitory 6)
93445_at 133 31 274 175 733 89 393 109 1024 829 61 1
Wee1 (Wee-1 like
protein kinase) 101458_at 505 55 266 60 361 79 184 87 503 155 61 1
1 Number indicates the mean average difference value. 2 SD = standard deviation of mean average difference value of three replicate experiments.
By this analysis only two genes still fulfilled the above criteria (F11r and Adml) while
Wee1 and Api6 no longer could be classified into group 2 (Figure 3.21 and Figure
3.22). Wee1, the Affymetrix gene designation for a wee-1 like kinase, showed weak
expression in peritoneal and splenic B-1a cells of L2 mice (Figure 3.21). However,
80

3. Results
when B cells from normal BALB/c mice were tested expression was found in
peritoneal and splenic B-1a cells but at an equal level also in B-2 cells (Figure 3.21).
Api6, expressing a protein termed CD5 antigen-like precursor, SP-alpha or CT-2,
was strongly expressed in splenic B-1a cells and weakly in peritoneal B-1a cells from
L2 mice. In BALB/c mice Api6 was expressed at similar levels in peritoneal and
splenic B-1a cells as well as in B-2 cells (Figure 3.21).
Adml and F11r fulfilled the criteria for group 2 in RT-PCR analysis. Both genes were
strongly expressed in peritoneal and splenic B-1a cells from L2 and normal mice
(Figure 3.22). A weak signal could be detected in the normalized cDNA from splenic
B-2 cells. However, this was attributed to the extreme sensitivity of the RT-PCR.
These data were tried to verify by flow cytometry. Unfortunately, in preliminary
experiments using the commercially available antibody against Adrenomedullin no
signal could be obtained in intracellular stainings of B-1 cells.
Wee1
1 2 3 4
Hprt
B-1a B-2B-1a
Spleen Peritoneum Spleen control
BALB/cWee1
Api6
HPRT
1:31:3 1:31:3 1:31:3
L2
Api6
1 total spleen cells2 splenic B-1a cells3 peritoneal B-1a cells4 negative control
Figure 3.21. RT-PCR for Wee1 and Api6 on B-1a cells from L2 and BALB/c mice. B-1a cells from peritoneum and spleen have been sorted IgM+CD5+ and B-2 cells from spleen have been sorted IgMloCD5neg.
81

3. Results
On the other hand, JAM-1, encoded by the F11r gene, could be clearly detected on
peritoneal B-1a cells from L2 as well as BALB/c mice (Figure 3.23, R1). In addition,
peritoneal B-1b cells could be stained for JAM-1 in L2 mice (Figure 3.23). All other
peritoneal populations were negative for JAM-1 expression.
The splenic IgM+CD5+ B-1a population of L2 mice was also positive for JAM-1
staining (Figure 3.24) as well as IgM+CD5+ B-1a cells in the spleen of BALB/c mice.
However, the JAM-1 staining in the splenic B-1a cells of BALB/c mice was apparently
weak. Although a slight shift between control cells and cells stained for JAM-1 could
be seen it is not as pronounced as in splenic B-1a cells of L2 mice.
Taken together these results show, that JAM-1 protein expression in the peritoneal
cavity is detected on B-1 cells of L2 and normal mice. Thus, at this site it can be used
as a B-1 cell specific marker for such cells. In the spleen of L2 mice JAM-1 can also
be used as a marker for the IgM+CD5+ B-1a cells.
peritoneumspleen control
B-1a B-2
spleen
Hprt
Adml
F11r
1:3
peritoneumspleen control
B-1a B-2
spleen
BALB/cHprt
Adml
F11r
1:3 1:3
L2
1:31:3 1:3
Figure 3.22. Semiquantitative RT-PCR for F11r and Adml on sorted cell populations from L2 and BALB/c mice. B-1a cells from peritoneum and spleen have been sorted as IgM+CD5+ and B-2 cells from spleen as IgMloCD5neg.
82

3. Results
Peritoneum
L2R1
R2
R4
R3
IgM
JAM-1JAM-1
R1 R2 R3 R4
IgM
CD
5C
D5
CD
5C
D5
R1
R2R3R4
R5
R1 R2 R3 R5R4
BALB/c
JAM-1
Figure 3.23. Flow cytometrical analysis of peritoneal cells for expression of JAM-1. Histogram overlays show JAM-1 expression in the following regions: L2 mice: R1: B-1a cells; R2: B-1b cells; R3: double negative cells; R4: T cells. BALB/c: R1: B-1a cells; R2: IgMhiCD5neg containing B-1b cells; R3: IgMloCD5- containing B-2 cells; R4 double negative cells, R5: T cells. Black lines indicate control staining, colored lines represent JAM-1 staining.
83

3. Results
R1
R2
R4
R3
IgMIgM
CD
5C
D5
L2
JAM-1JAM-1
R1 R2 R3 R4
Spleen
CD
5C
D5
IgMIgM
R1 R2 R3 R4
R1
R2
R4
BALB/c
JAM-1JAM-1
R3
Figure 3.24. Flow cytometrical analysis for JAM-1 expression on spleen cells from L2 and BALB/c mice. Histogram overlays show JAM-1 expression in the following regions: L2 mice: R1: B-1a cells; R2: CD5-IgM+ cells containing also marginal zone B cells; R3: double negative cells; R4: T cells. BALB/c: R1: B-1a cells; R2: CD5-IgM+ cells containing also marginal zone B cells, R3: IgMloCD5- containing B-2 cells in BALB/c mice; R4 double negative cells; R5: T cells. Black lines indicate control staining, colored lines represent JAM-1 staining.
84

3. Results
3.3 Generation of an anti-idiotype antibody
One of the particular features of L2 mice is that within the population of peritoneal
B-1 cells three dominating specificities are found. This was observed by the repetitive
finding of heavy chains with identical amino acid sequences even in different
individual mice. Such sequences can also be taken as molecular markers for B-1
cells since so far they were not encountered in B-2 cells. Antibodies that would
discern such sequences so called anti-idiotypes would represent extremely valuable
tools to identify and further characterize such cells in the B-1 cell pool and their
physiology.
3.3.1 Hybridoma generation
To be able to generate an anti-idiotype antibody against one of the dominant BCR-
specificities, first idiotype bearing antibodies had to be established. Thus, peritoneal
and splenic B-1a cells were sorted, stimulated in vitro with LPS and hybridomas were
generated by fusion of these cells with the myeloma P3X63Ag8.653.
From the peritoneum 54 hybridomas (designated L2P) and from spleen 21
hybridomas (designated L2M) were obtained and subcloned. cDNA of the heavy
chain V regions from these hybridomas was isolated and sequenced to screen for the
dominant sequences. Sequences from 27 peritoneum derived and 7 spleen derived
hybridomas were obtained (Figure 3.25 and Figure 3.26). The remaining hybridomas
either showed no message for IgM in the RT-PCR or ambiguous sequence data were
encountered that indicated that more than one hybridoma was present within the
sample.
The hybridomas L2P3 and L2M6 displayed VH sequences that belonged to the most
dominating specificity identified before (Figure 3.27). This IgM heavy chain was found
in high abundance among the B-1 cells of L2 mice, i.e. 15% of peritoneal, 10% of
splenic and 5% of blood B-1a cells as determined by single cell analysis (Kretschmer
et al., 2003b). Similar to these studies, different CDR3 region sequences on the
nucleotide level were detected in L2P3 and L2M6 (Table 3.3). However, both
sequences encoded the same protein. The V region of these antibodies is assembled
by gene segments belonging to the VH Q52, DFL16.2 and JH4 families and is shown
in Figure 3.27.
85

3. Results
CDR3 V D J -J V-D
gca aga tat gat tcc tgg gct tac 7183 SP2 L2P1 ala arg tyr asp ser trp ala tyr
gcc aaa tac tac tac tac gct atg tac Q52 FL16.2 L2P3 ala lys tyr tyr tyr tyr ala met tyr
aca aga gag ggg ggt aac cgg ttt tac J558 SP2 -1 N L2P4 thr arg glu gly gly asn arg phe tyr
gcc aga ggt agt tac tct tac tat atg gac Q52 FL16.1 N L2P7
D-J
tgt cac ggt ttt 3 N cys his gly phe
tgt aat ggc tat gac 4 cys asn gly tyr asp
tgt aga tat cct gct 3 N,P cys arg tyr pro ala
tgt agg agc tat gct tac 4 N cys ala arg arg gly ser ser tyr ser tyr tyr tyr ala met asp tyr
tgt acc agg cat tac tac ggc ttt gac tac J606 FL16.2 2 -2 P L2P13 cys thr arg his tyr tyr gly phe asp tyr
tgt gcc aga aat tcc ggg att cat tac tac ggc tac gac tac ttt gac tac Q52 FL16.2 2 N,P N,P L2P16 cys ala arg asn ser gly ile his tyr tyr gly tyr asp tyr phe asp tyr
tgt gcc aga ggg ggg tgg cca acc ccg cgg gag gct atg gac tac Q52 n.d. 4 -6 n.d. n.d.L2P17 cys ala arg gly gly trp pro thr pro arg glu ala met asp tyr
tgt gca aga tcg gta gta gtt gac tac J558 FL16.1 2 -4 L2P18 cys ala arg ser val val val asp tyr
tgt gcc aaa aat tgg ggg gat tac gac tgt gct atg gac tac Q52 SP2.2 4 -5 P,N N L2P19 cys ala lys asn trp gly asp tyr asp cys ala met asp tyr
tgt gcc aga ctc tac tat agg tac gac ggg tac tat gct atg gac tac Q52 SP2.10 4 N P,N L2P20 cys ala arg leu tyr tyr arg tyr asp gly tyr tyr ala met asp tyr
tgt gcc aga gtc tac tat agg tac gac gga tac tat gct atg gac tac Q52 SP2.10 4 N,P L2P22 cys ala arg val tyr tyr arg tyr asp gly tyr tyr ala met asp tyr
tgt gca aga tcg ggt att act acg gta gta gct caa tat tac tat gct atg gac tac 7183 FL16.1 4 N,P N L2P23 cys ala arg ser gly ile thr thr val val ala gln tyr tyr tyr ala met asp tyr
tgt gca aga cac gat gga aac tgg gac tac ttt gac tac J558 DQ52 2 N,P L2P25 cys ala arg his asp gly asn trp asp tyr phe asp tyr
tgt gca aga gac tac ggt agt agc tac tat gct atg gac tac J558 FL16.1 4 L2P28 cys ala arg asp tyr gly ser ser tyr tyr ala met asp tyr
tgt gca aga cac gaa gct aac tgg gac tac ttt gac tac VNP Q52 2 L2P29 cys ala arg his glu ala asn trp asp tyr phe asp tyr
tgt gca aga ttt act acg gta gta gct gac tac J558 FL16.1 2 -5 L2P30 cys ala arg phe thr thr val val ala asp tyr
tgt gcg aga gac ttc gat gtc GAM3-8 n.d. 1 -7 n.d. n.d.L2P31 cys ala arg asp phe asp val
tgt aca aga ttc tac tac ggt agt agc tac tac ttt gac tac J558 FL16.1 2 N L2P33 cys thr arg phe tyr tyr gly ser ser tyr tyr phe asp tyr
tgt gcc aga aag cat ggt aac tac gtt gac Q52 SP2 2 -4 P P L2P34 cys ala arg lys his gly asn tyr val asp
tgt gca aga act ggg acg ttt gac tac J558 Q52 2 -3 P L2P36 cys ala arg thr gly thr phe asp tyr
tgt gca aga gct gac gtt tat gct atg gac tac GAM3-8 n.d. 4 -3 n.d. n.d.L2P37 cys ala arg ala asp val tyr ala met asp tyr
tgt gcc aaa aac ccc ctc att act acg gca cgg ggg tac tat gct atg gac tac Q52 FL16.2 4 N N L2P38 cys ala lys asn pro leu ile thr thr ala arg gly tyr tyr ala met asp tyr
tgt gcc aga ctc tac tat agg tac gac ggg tac tat gct atg gac tac Q52 SP2.10 4 N N,P L2P40 cys ala arg leu tyr tyr arg tyr asp gly tyr tyr ala met asp tyr
tgt gcc aga gat aga ggt tac tac ggt agt agc tat tac gct atg gac tac Q52 FL16.1 4 N P L2P41 cys ala arg asp arg gly tyr tyr gly ser ser tyr tyr ala met asp tyr
tgt gca agc ttc tat ggt tac tat gct atg gac tac J558 SP2 4 P,N N L2P42 cys ala ser phe tyr gly tyr tyr ala met asp tyr
tgt gcc aga gat acc tac tat agg tcc ttt gac tac Q52 SP2 2 -2 N N L2P43 cys ala arg asp thr tyr tyr arg ser phe asp tyr
tgt gca agc cgg gac ggc ttt gct tac J558 FL16.2 3 -3 P,N L2P46 cys ala ser arg asp gly phe ala tyr
Figure 3.25. CDR3 sequences from hybridomas generated from peritoneal B-1a cells of L2 mice. The CDR3 nucleotide and amino acid sequence is displayed starting with Cys in position 92 of the VH 3’ region and including the D gene segment and the JH 5’ region up to position 102. The VH gene family, the D segment and the JH segment are indicated (VDJ). In some cases no D segment could be determined (n.d.). Numbers in the (-J) column indicate the number of nucleotides that have been removed from J sequence due to nibbling. P and N indicate the presence of P-nucleotides and N-nucleotides in the V-D and D-J junctions of the respective sequences.

3. Results
CDR3 V D J -J V-D D-J
tgt gcc aaa aat tac tac ggc tat tac tat gct atg gac tac Q52 FL16.2 4 P L2M6 cys ala lys asn tyr tyr gly tyr tyr tyr ala met asp tyr
tgt gcc aga aat ggg agg act acg gcg tac tat gct atg gac tac Q52 FL16.2 4 N P L2M8 cys ala arg asn gly arg thr thr ala tyr tyr ala met asp tyr
tgt gca aga cac gaa gta ggc cgg ctc ctc att act acg gcc ccg ttt gct tac J558 FL16.2 3 -3 N N L2M12 cys ala arg his glu val gly arg leu leu ile thr thr ala pro phe ala tyr
tgt gca aga tac tac ggc gac tac ttt gac tac J558 FL16.2 2 P P,NL2M14 cys ala arg tyr tyr gly asp tyr phe asp tyr
tgt gcc aga ctc tac tat agg tac gac ggg tac tat gct atg gac tac Q52 SP2.10 4 N P,NL2M15 cys ala arg leu tyr tyr arg tyr asp gly tyr tyr ala met asp tyr
tgt gtg agc tac tat gat tac gcc tgg ttt gct tta DNA4 SP2.2 3 P L2M16 cys val ser tyr tyr asp tyr ala trp phe ala tyr
tgt gca aga gag gat ttt act acg gct acg gac tac J558 FL16.2 2 -6 N P L2M17 cys ala arg glu asp phe thr thr ala thr asp tyr
Figure 3.26. CDR3 sequences of hybridomas from splenic B-1a cells of L2 mice. For further explanations see Figure 3.25.
A second sequence was obtained twice, once from a peritoneal hybridoma (L2P40)
and second from a splenic hybridoma (L2M15) (Figure 3.28). Both sequences were
identical on nucleotide and protein level. This sequence had also been found before
and made up 5% of the sequences found in the blood of L2 mice (Kretschmer et al.,
2003b). It was not found in spleen or peritoneum before. The V region of this
antibody consists of rearranged family members of VH Q52, DSP and JH4 gene
segments.
Table 3.3. Comparison of CDR3 regions of L2P3 and L2M6. Differences in nucleotide sequence are highlighted in green.
CDR3
L2P3 tgt gcc aaa aat tac tac ggc tac tac tat gct atg gac tac
L2M6 tgt gcc aaa aat tac tac ggc tat tac tat gct atg gac tac
Protein cys ala lys asn tyr tyr gly tyr tyr tyr ala met asp tyr
87

3. Results
L2P3 #1 NNNGTGCAGCTGCAGGAGTCTGGACCTGGCCTAGTGCAGCCCTCACAGAGCCTGTCCATA
X ValGlnLeuGlnGluSerGlyProGlyLeuValGlnProSerGlnSerLeuSerIle
1 FR-1 20
#61 ACCTGCACAGTCTCTGGTTTCTCATTAACTAGCTATGGTGTACACTGGGTTCGCCAGTCT
ThrCysThrValSerGlyPheSerLeuThrSerTyrGlyValHisTrpValArgGlnSer
21 31 CDR1 36 FR-2 40
#121 CCAGGAAAGGGTCTGGAGTGGCTGGGAGTGATATGGAGAGGTGGAAGCACAGACTACAAT
ProGlyLysGlyLeuGluTrpLeuGlyValIleTrpArgGlyGlySerThrAspTyrAsn
41 50 CDR2 60
#181 GCAGCTTTCATGTCCAGACTGAGCATCACCAAGGACAACTCCAAGAGCCAAGTTTTCTTT
AlaAlaPheMETSerArgLeuSerIleThrLysAspAsnSerLysSerGlnValPhePhe
61 66 FR-3 80
#241 AAAATGAACAGTCTGCAAGCTGATGACACTGCCATATACTACTGTGCCAAAAATTACTAC
LysMETAsnSerLeuGlnAlaAspAspThrAlaIleTyrTyrCysAlaLysAsnTyrTyr
81 82A 83 92 CDR3
#301 GGCTACTACTATGCTATGGACTACTGGGGTCAAGGAACCTCAGTCACCGTCTCCTCA
GlyTyrTyrTyrAlaMetAspTyrTrpGlyGlnGlyThrSerValThrValSerSer
98 103 FR-4 113
D-segment JH-segment
Complementarity determining regions (CDR)
Framework regions(FR)
Figure 3.27. V-region sequence of L2P3. The nucleotide and amino acid (aa) sequences are shown. N indicates nucleotides that could not be determined due to ambiguities in sequence data. The resulting gaps on aa level are indicated by an X. CDR1 and CDR2 as well as the frame work regions were determined according to Kabat et al. (Kabat et al., 1987) and are highlighted as explained in the legend. The CDR3 region is displayed as the region including the conserved cysteine residue in position 92 of the VH and the tyrosine in position 102 of the JH. Thus, in contrast to the commonly used CDR3 definition three additional aa of the VH are included according to the definition used in preceding work (Kretschmer et al., 2002; Kretschmer et al., 2003b).
88

3. Results
L2M15 #1 NNNNNNCAGCTGCAGGAGTCTGGACCTGGCCTAGTGCAGCCCTCACAGAGCCTGTCCATC
X X GlnLeuGlnGluSerGlyProGlyLeuValGlnProSerGlnSerLeuSerIle
1 FR-1 20
#61 ACCTGCACAGTCTCTGGTTTCTCATTAACTAGCTATGGTGTACACTGGGTTCGCCAGTCT
ThrCysThrValSerGlyPheSerLeuThrSerTyrGlyValHisTrpValArgGlnSer
21 31 CDR1 36 FR-2 40
#121 CCAGGAAAGGGTCTGGAGTGGCTGGGAGTGATATGGAGTGGTGGAAGCACAGACTATAAT
ProGlyLysGlyLeuGluTrpLeuGlyValIleTrpSerGlyGlySerThrAspTyrAsn
41 50 CDR2 60
#181 GCAGCTTTCATATCCAGACTGAGCATCAGCAAGGACAATTCCAAGAGCCAAGTTTTCTTT
AlaAlaPheIleSerArgLeuSerIleSerLysAspAsnSerLysSerGlnValPhePhe
61 66 FR-3 80
#241 AAAATGAACAGTCTGCAAGCTAATGACACAGCCATATATTACTGTGCCAGACTCTACTAT
LysMETAsnSerLeuGlnAlaAsnAspThrAlaIleTyrTyrCysAlaArgLeuTyrTyr
81 82A 83 92 CDR3 97
#301 AGGTACGACGGGTACTATGCTATGGACTACTGGGGTCAAGGAACCTCAGTCACCGTCTCCTCA
ArgTyrAspGlyTyrTyrAlaMETAspTyrTrpGlyGlnGlyThrSerValThrValSerSer
98 100 100E 103 FR-4 113
D-segment JH-segment
Complementarity determining regions (CDR)
Framework regions(FR)
N-Nucleotide P-Nucleotide
Figure 3.28. V-region sequence of L2M15. The sequence is identical with the sequence obtained from L2P40. For further explanations see Figure 3.27.
The antibodies of L2P3 and L2M15 as well as antibodies secreted by the
plasmacytoma MOPC104E (IgM/λ1) were purified from cell culture supernatants by
ammonium sulfate precipitation and affinity chromatography using immobilized
mannan binding protein (ImmunoPure). L2P3 was then used as an antigen to
89

3. Results
immunize rats and to generate hybridomas by fusion of spleen cells with
P3X63Ag8.653 cells. This work was done in cooperation with the lab of Dr. Elisabeth
Kremmer at the GSF in Munich. Supernatants of the rat hybridomas were screened
in ELISA for binding to purified antibodies of L2P3, MOPC104E (IgM/λ) as well as an
IgM/κ antibody. Thus, one could exclude clones producing antibodies against the IgM
heavy chain, κ or λ light chains. As the antibody from the hybridoma L2M15 (IgM/λ)
is very similar to L2P3 (Figure 3.29) including usage of VHQ52 and JH4 gene
segments it was included in the ELISA screenings as control for the anti-idiotypic
reactivity.
One clone was identified that produced antibodies that bound only the L2P3 antibody
when tested in ELISA. This idiotype specific antibody was named 8H10 according to
the clone number. Supernatants of this clone were used for further analyses.
1 20 L2P3 XXXValGlnLeuGlnGluSerGlyProGlyLeuValGlnProSerGlnSerLeuSerIle L2M15 XXXXXX - - - - - - - - - - - - - - - - - - 21 40 L2P3 ThrCysThrValSerGlyPheSerLeuThrSerTyrGlyValHisTrpValArgGlnSer L2M15 - - - - - - - - - - - - - - - - - - - - 41 60 L2P3 ProGlyLysGlyLeuGluTrpLeuGlyValIleTrpArgGlyGlySerThrAspTyrAsn L2M15 - - - - - - - - - - - Ser - - - - - - - - 61 80 L2P3 AlaAlaPheMETSerArgLeuSerIleThrLysAspAsnSerLysSerGlnValPhePhe L2M15 - - - Ile - - - - - Ser - - - - - - - - - - 81 82A 82C 97 L2P3 LysMETAsnSerLeuGlnAlaAspAspThrAlaIleTyrTyrCysAlaLysAsnTyrTyr L2M15 - - - - - - - Asn - - - - - - - - ArgLeu - - 98 L2P3 GlyTyr · · TyrTyrAlaMETAspTyrTrpGlyGlnGlyThrSerValThrValSer L2M15 Arg - AspGly - - - - - - - - - - - - - - - - 113 L2P3 Ser L2M15 -
Figure 3.29. Comparison of L2P3 and L2M15 protein sequence. Dashes indicate matching amino acids, dots indicate gaps necessary for alignment. Triple X indicates amino acids that could not be determined due to ambiguities in the nucleotide sequence.
90

3. Results
Flow cytometrical analyses were performed using the supernatants from the rat
hybridoma 8H10. First, peritoneal B-1 cells from L2 mice were tested for binding to
the anti-idiotype antibody (data not shown). As secondary reagent a fluorochrome
coupled F(ab’)2 fragment of a mouse anti-rat IgG (H+L) was used which produces
some staining background. Staining of peritoneal cells of L2 mice could indeed be
observed. Peritoneal cells from L2 mice were then used to optimize the 8H10
staining for flow cytometry (data not shown).
control 8H10
IgM
7,51,0
A
IgM
8H10
L2 controlBALB/cB
L2
Figure 3.30. 8H10 staining on peritoneal cavity cells. A) Staining of pooled peritoneal cavity cells from L2 mice. Background by secondary staining reagent is indicated in the left dot plot. Subtraction of background staining of 8H10 stained cells reveals a 6,5% population of 8H10+ cells. Pooled cells were obtained from 2 male and 1 female L2 mice. B) Staining of peritoneal cells from female BALB/c mice. Dotplot from one BALB/c mouse is representative for three individual mice tested. Peritoneal cavity cells of one L2 mouse were included as positive control.
91

3. Results
Initial stainings using the detection system described above showed a 6,5%
population (background subtracted) of 8H10+IgM+ double positive cells on pooled
peritoneal cavity cells from L2 mice (Figure 3.30A). This is consistent with an anti-
idiotype that recognizes a major specificity in transgenic L2 mice. However,
peritoneal cells from BALB/c mice were not positive for 8H10 stainings (Figure
3.30B). Therefore, further analyses were focused on L2 mice.
3.3.2 Analysis of 8H10 specificity and flow cytometrical analysis
Next, the specificity of the 8H10 antibody was analyzed. Therefore, 8H10+IgM+
double positive peritoneal cells of L2 mice were sorted. cDNA of IgM heavy chains
was prepared and amplified by PCR with primers specific for the V region. Then the
PCR products were subcloned and individual V-region sequences determined. It was
not possible to reveal the complete V-region with the obtained sequence data.
However, CDR3 sequences of all clones could be analyzed. 23 of 34 sequences
showed the same CDR3 region as L2P3 (Figure 3.31). 19 of these were completely
identical with L2P3 as far as the sequences could be compared. The remaining four
sequences showed single nucleotide exchanges, that lead to an exchange of amino
acids. These single changes could be indicative for somatic hypermutation but could
also be due to errors of the Taq-polymerase used for RT-PCR. However, their CDR3
region matched with the L2P3 CDR3. Four sequences of the 34 analyzed sequences
differed in their CDR3 regions from that of L2P3 (Figure 3.31 B and C, #37, 40, 44,
45). Of the seven remaining sequences analyzed none encoded a functional heavy
chain. Most likely these sequences are derived from rearrangements that did not
yield a correct reading frame. Therefore, these sequences are not translated into
protein. Thus, of 34 sequences analyzed only 27 encode a functional BCR. Of these,
23 were identical with L2P3 representing 85% of the functional sequences.
The analysis of idiotype bearing cells from L2 mice was extended to single L2 mice.
On average 6% of IgM+ cells were detected by the 8H10+ antibody in the peritoneal
cavities in male L2 mice (Figure 3.32) which confirmed the data obtained by analysis
of pooled cells before. However, this result differed from the original expectations
since 15% the L2P3 idiotype were predicted for the peritoneal cavity using single cell
RT-PCR and results obtained from analyses of hybridoma sequences (Kretschmer et
al., 2002; Kretschmer et al., 2003b).
92

3. Results
A B
8H10
IgM
98,4 %
C
CDR3 V J D
tgt gcc aaa aat tac tac ggc tac tac tat gct atg gac tac Q52 FL16.2 4L2P3 cys ala lys asn tyr tyr gly tyr tyr tyr ala met asp tyr
tgt gcc aga aat ttc cca ccg cat tac tat gct atg gac tac Q52 FL16.2 437 - - arg - phe pro pro his - - - - - -
tgt gcc aga aat cgt ccc tta tat tac tat gct atg gac tac Q52 FL16.1 440 - - arg - arg pro leu tyr - - - - - -
tgt gca aga cat gaa ctt gac tac 7183 n.d. 244 - - arg his glu leu asp tyr
tgt gcc aga gat tat agg tac tat gct atg gac tac Q52 SP2.10 445 - - arg asp - arg - - - - - -
Designation
Sequence readable from
amino acid position
Comparison with L2P3 protein
sequence 13 27 nf 14 25 - 15 30 nf 16 32 - 17 44 nf 18 25 - 19 33 - 20 43 - 21 25 - 22 28 - 23 26 - 24 23 - 25 19 Ser 19→ Cys 26 49 nf 27 12 Ser 19 → Cys 28 43 - 29 30 - 31 44 nf 32 49 - 34 25 Gly 44 → Phe 35 49 - 36 49 - 37 26 CDR3 differs from P3 38 26 - 39 14 nf 40 26 CDR3 differs from P3 41 15 - 42 28 nf 43 26 Val 34→ Phe 44 18 CDR3 differs from P3 45 15 CDR3 differs from P3 46 14 - 47 15 - 48 30 -
Figure 3.31. Sequences of sorted peritoneal 8H10+IgM+ cells from L2 mice. A) Reanalysis of 8H10+IgM+ sorted cells. B) Summary of sequence data. The designation of the individual sequences is given and the amino acid (aa) position from which sequence data could be analyzed and compared with L2P3 sequence. Dash indicates identical aa sequence with L2P3; nf: no functional reading frame assignable. Ser 19 → Cys indicates that serine found at position 19 in L2P3 is exchanged by cysteine in the compared sequence. C) CDR3 sequences from clones that differed from L2P3 CDR3 sequence. Amino acids matching with L2P3 CDR3 aa are indicated by dashes; n.d. indicates that no D segment was assignable.
93

3. Results
1,37,45
0,93,93
1,44,44
1,5 ± 0,56,1 ± 2,2Mean expression
1,85,92
2,09,21
SpleenPeritoneumL2 individuals
% of 8H10 positive cells on gated IgM+ cells[background substracted]
1,37,45
0,93,93
1,44,44
1,5 ± 0,56,1 ± 2,2Mean expression
1,85,92
2,09,21
SpleenPeritoneumL2 individuals
% of 8H10 positive cells on gated IgM+ cells[background substracted]
Figure 3.32. Analysis of 8H10 stainings performed on cells from spleen and peritoneal cavity of male L2 mice. Dotplots represent stainings of one mouse. The table summarizes staining results of individual mice. Background by detection antibody is subtracted in the table.
Similarly, in the spleens of these mice also lower amounts of 8H10+ IgM+ cells were
detected than expected from single cell analysis. Results obtained by this method
predicted 10% of 8H10+ IgM+ cells in the spleen whereas only 1,3% on average
could be detected in the flow cytometrical stainings from individual mice.
94

3. Results
conventionalSPF
3,7% 15.7%
IgM
8H10
Figure 3.33. Flow cytometrical analysis of peritoneal cells from female mice raised under SPF and conventional conditions. The staining was performed on pooled peritoneal cells from four female mice from SPF conditions and one female mouse obtained from our normal mouse colony.
Interestingly, when pooled peritoneal cells from female L2 mice bred under SPF
conditions were analyzed, such mice showed a low percentage of 8H10+ cells
(Figure 3.33). A female mouse that was housed under conventional conditions and
was included as a control showed 15% 8H10+ cells, the number expected from single
cell RT-PCR. As mainly male mice were used in the preceding stainings a difference
in idiotype expression due to the gender of the mouse was possible. This idea was
supported by the notion that the single cell studies were also performed with cells
from female mice. Therefore, the stainings using the 8H10 antibody were repeated in
male and female L2 mice (Figure 3.34).
The percentage of 8H10+ cells detected in the peritoneal cavity was lower in male
mice compared to the stainings in Figure 3.32. Similarly, in spleens lower
percentages of these cells were found. Female mice in contrast showed a higher
percentage of 8H10+ cells in the peritoneal cavity than male mice. In the spleen a
similar finding was observed. There was an average 1,3% population of 8H10+ cells
detectable in female mice whereas in male mice 0,4% of 8H10+ cells where found.
These results indicate, that there could be an impact of gender on the expression of
the L2P3 specificity. However, also the hygienic conditions might play an important
role as indicated by the differences observed between mice housed under
conventional and SPF (specific pathogen free) conditions.
95

3. Results
spleenfemale
male
male
female
8H10
control
IgM
8H10
control
peritoneum
4,84,43
12,53,12
8,3 ± 3,93,42 ± 1,2mean
7,62,41
femalemale#
[%] of 8H10 on IgM+ gated cells
4,84,43
12,53,12
8,3 ± 3,93,42 ± 1,2mean
7,62,41
femalemale#
[%] of 8H10 on IgM+ gated cells
1,30,73
1,70,12
1,3 ± 0,30,4 ± 0,3mean
1,10,41
femalemale#
[%] of 8H10 on IgM+ gated cells
1,30,73
1,70,12
1,3 ± 0,30,4 ± 0,3mean
1,10,41
femalemale#
[%] of 8H10 on IgM+ gated cells
IgM
0,50, 8
3,2 8,1
0,33 0,75
0,7 2,07
Figure 3.34. Comparison of anti-idiotype stainings on L2 mice. Dotplots show representative stainings of a female and a male L2 mouse. A) Staining of peritoneal cells. Background by secondary antibody is subtracted in the table. B) Staining of splenic cells. Table summarizes results from three individual mice. Significance of gender difference was determined using the one sided Wilcoxon’s two sample test. Peritoneum: p< 0,05, Spleen: p<0,01.
96

3. Results
3.4 Analysis of L2P3 binding
The B-1 cell derived antibody pool is highly enriched for autoreactive specificities that
bind to intra- and extracellular autoantigens like single-stranded DNA or carbohydrate
epitopes of glycolipids and –proteins (Baumgarth et al., 2005). For instance the work
of Hayakawa and colleagues demonstrated the important role of autoantigen for the
selection and maintenance of B-1 cells (Hayakawa et al., 1999). They used a
transgenic mouse expressing a B-1 cell derived anti-Thy-1 IgM antibody (ATA;
VH3609-DHQ52-JH2, Vκ21C-Jκ2). The presence of the Thy-1 autoantigen yielded an
increased frequency of CD5+ transgenic B-1 cells. They also observed an age-
dependent accumulation of CD5+ transgenic B cells suggesting cellular selection
even after the generation of these cells.
Similarly, the clones dominating in the B-1 cell pool of L2 mice might be the result of
autoantigen-dependent selection mechanisms (Kretschmer et al., 2002). Thus, L2P3,
representing one of the dominating specificities and L2M15, that was also repeatedly
found in blood of L2 mice were tested for their potential to detect autoantigens in L2
mice. As a first and simple approach L2P3 and L2M15 were tested in flow
cytometrical analysis using cells from various organs of CB20/L2 mice. These mice
are congenic BALB/c mice that carry the immunoglobulin locus of C57BL/6 and
therefore express the IgMb allotype. Since L2P3 and L2M15 antibodies are derived
from BALB/c L2 mice the IgMa allotype could be distinguished from endogenous IgMb
by a fluorochrome coupled anti-IgMa detection antibody. Therefore, cells from
peritoneum, spleen, bone marrow and thymus were isolated and stained with L2P3
and L2M15, respectively. MOPC104E was included as a possible negative control.
97

3. Results
PEC Spleen BM
L2P3
L2M15
MOPC104E
Thymus
Figure 3.35. Flow cytometrical studies of L2P3 and L2M15 binding. Cells derived from the peritoneum (PEC), spleen, bone marrow (BM) and thymus of CB20/L2 mice were gated on lymphoid cells in flow cytometry and stained with L2P3, L2M15 and the control IgM/λ antibody MOPC104E. Samples consisted of pooled cells obtained from the indicated anatomical sites of two female and one male CB20/L2 mouse. Black line represents controls stained with the IgMa detection antibody omitting the primary antibody. Colored lines represent staining with the antibodies L2P3, L2M15 and MOPC104E as indicated.
As seen in the histograms of Figure 3.35, L2P3 generated a shift in staining intensity
in the lymphoid cell population derived from the peritoneal cavity but not on cells
obtained from spleen, bone marrow or thymus. The second B-1a cell derived
antibody, L2M15, as well as the control antibody MOPC104E, however, showed no
reactivity with any of the tested populations. Thus, the staining obtained with L2P3
indicates a specific staining. Therefore, L2P3 might detect an autoantigenic
determinant exposed on lymphoid cells in the peritoneal cavity.
The staining was repeated with a second pool of cells obtained from the peritoneal
cavity or the spleen of CB20/L2 mice and cells in the lymphoid gate were analyzed in
flow cytometry. A similar shift inflicted by L2P3 (Figure 3.36) was observed in this
experiment. No shift was seen with splenic cells stained using this antibody. The
98

3. Results
stainings with L2M15 and MOPC104E were negative. Thus the binding of L2P3
observed on cells found within in the peritoneal lymphoid gate was confirmed.
PEC Spleen
L2P3
L2M15
MOPC104E
Figure 3.36. Flow cytometrical studies of L2P3 and L2M15 binding. Cells derived from the peritoneum (PEC) and spleen of CB20/L2 mice were gated on lymphoid cells in flow cytometry and stained with L2P3, L2M15 and the control IgM/λ antibody MOPC104E. Samples consisted of pooled cells obtained from the indicated anatomical sites of three male CB20/L2 mice.
Surprisingly, when non-transgenic mice were tested no staining with L2P3 was
observed (data not shown). This seems to indicate that for unknown reasons this
autoantigen is found only in the transgenic situation on lymphoid cells of the
peritoneal cavity.
99

3. Results
3.4.1 Half-lives of B-1 cell derived antibodies
The fact that B-1 cell derived antibodies might recognize autoantigens should be
reflected in their in vivo persistence, i.e. such antibodies should exhibit a short half
life compared to B-2 cell derived antibodies. Therefore L2P3 and L2M15 were
injected intravenously into CB20/L2 mice and sera from these mice were collected at
different time points to determine the rate of clearance of such antibodies from the
sera. As controls two additional antibodies, MOPC104E (IgM, λ1) and 2D4 (IgM, κ),
were included in these studies. MOPC104E is derived from a plasmacytoma that was
induced in BALB/c mice by intraperitoneal injection of mineral oil. This myeloma
might have arisen from B-1 cells. 2D4 is a hybridoma the antibody of which is
directed against ganglio-N-triosylceramide (asialo GM2) (Young, Jr. et al., 1979) and
was obtained after immunization, thus, should be of B-2 origin although autoreactivity
can not be excluded for the moment. Serum samples of individual mice were
obtained at variant time points after injection and submitted to a IgMa specific ELISA.
The optical density value at the first experimental time point was arbitrarily set as
100% and the following values correlated to it.
Interestingly, L2P3, L2M15 and MOPC104E showed two rates of clearance (Figure
3.37A). The first phase showed a rapid decrease of the antibodies in sera, the
second phase displayed a slower clearance. In contrast, the clearance rate of 2D4
from sera did not seem to underlie a biphasic mechanism. It could be described by a
trendline based on an exponential function (Figure 3.37B) which is represented by a
straight line in a semi-logarithmic diagram. Therefore the kinetic of 2D4 showed only
one phase. The results showed that all B-1 derived antibodies behaved similar, i.e. in
the first phase the half life (t1/2) was around 10 hours and in the second phase around
35-40 hours while t1/2 of the B-2 derived antibody was 22 hours. This might be due to
the different nature of the antigens recognized by the B-1 versus B-2 cell derived
antibodies, i.e. reaction with an autoantigen or not.
Together the studies using antibodies of B-1 cells from L2 mice added several
important aspects to the study of B-1 cells and their antibodies. The generation of the
8H10 anti-idiotype antibody extends the results obtained by sequencing so far and
will in future allow simplified experiments on the repertoire and selection of these
cells.
100

3. Results
A
0,1
1
10
100
0 1 2 3 4 5 6 7
time [d]
rem
aini
ng a
ntib
ody
[%]
0,1
1
10
100
0 1 2 3 4 5 6 7
time [d]
rem
aini
ng a
ntib
ody
[%]
0,1
1
10
100
0 1 2 3 4 5 6 7
time [d]
rem
aini
ng a
ntib
ody
[%]
B
0,1
1
10
100
0 1 2 3 4 5 6 7
time [d]
rem
aini
ng a
ntib
ody
[%]
0,1
1
10
100
0 1 2 3 4 5 6 7
tim e [d]
rem
aini
ng a
ntib
ody
[%]
L2P3 L2M15
MOPC104 E 2D4
C
D E
T1/21: 8,8 h T1/22: 40,1 h T1/21: 10,4 h T1/22: 34,7 h
T1/21: 12,8 h T1/22: 43,3 h T1/2: 22,4 h
Figure 3.37 Clearance of L2P3, L2M15, MOPC104E and 2D4 of sera from CB20/L2 mice. A) Clearance curves for L2P3 (orange), L2M15 (green) and MOPC104E (pink) and 2D4 (grey) are displayed. B-E) Graphical evaluation the kinetics of the indicated antibodies. Trendlines for the first and second phases are indicated by black dashed or black solid lines, respectively. Red dashed and solid lines indicate the determination of antibody half-life from the diagrams. Half-life of the antibodies in the two phases are shown in the diagrams (T1/2). Data points for all curves represent mean values from three individual mice except the curve for L2M15 which is based on data of two mice.
101

4 Discussion In the present work novel features of murine B-1 cells were studied in order to better
characterize physiological peculiarities of this B cell population. To this end, first,
marker genes were identified that were differentially expressed between splenic and
peritoneal B-1a cells. By transfer experiments the question of whether this differential
expression is due to the microenvironment or intrinsic to the particular cell population
should be solved. Along this line novel markers for B-1 cells were intended to be
defined. Secondly, a dominant antibody specificity that was repeatedly found
amongst B-1 cells in a transgenic mouse was taken as specific marker for B-1 cells in
order to better understand selective forces that act on such B-1 cells.
Analysis of gene expression in B-1 cells
Differentially expressed markers of B-1 cells: Several differences have been reported
between peritoneal and splenic B-1 cells already (Rothstein, 2002). These results
indicate that splenic and peritoneal B-1 cells differ phenotypically, biochemically and
functionally. Two explanations can account for these differences: Either B-1 cells that
reside in the spleen display an altered phenotype and function that is imprinted by
the microenvironment of the spleen or splenic B-1 cells are of different
developmental origin compared to peritoneal B-1 cells thus representing two
alternative cell lineages. Genes expressed in peritoneal and splenic B-1 cells would
therefore represent diagnostic patterns of independent developmental programs. In
the first case, the gene expression pattern would depend on the location of the cells
independent of their origin while in the second expression patterns would not be
influenced by the microenvironment. Clearly, the first situation is true for genes
analyzed in this work.
To achieve this conclusion, genes were identified on the microarrays that are strongly
expressed in splenic B-1a cells but showed no or extremely low expression in
peritoneal B-1a cells. Confirmation of the expression data obtained by arrays
however yielded conflicting results in RT-PCR analysis. While Vcam1, Adamdec1
and Spic could be shown to fulfill the original criteria, data for Hpgd in peritoneal cells
were contradictory. In three experiments using L2 or non-transgenic mice no Hpgd
expression was observed while in another independent experiment with L2 mice
expression was observed. Similarly, expression could be observed in peritoneal B-1

4. Discussion
cells after cell transfer independent of the route of transfer. Hpgd encodes the NAD+-
dependent 15-hydroxyprostaglandin dehydrogenase an enzyme that is catalyzing the
inactivation of prostaglandins and known to be downregulated during inflammation
(Hahn et al., 1998; Ivanov et al., 2003). Therefore, expression of this gene might
represent the inflammation status of the mouse rather than the influence of the
microenvironment. The expression pattern of this gene was therefore excluded from
the conclusions.
The expression pattern of two other genes (Mrc2, Lpl) also showed discrepancies
between earlier and later RT-PCR experiments. Mrc2 encodes the mannose receptor
(MR, CD206) which is involved in the clearance of endogenous glycoproteins as well
as pathogen recognition (Taylor et al., 2005). Lpl encodes lipoprotein lipase (LPL)
which promotes the hydrolysis of triacylglycerol and is involved in monocyte
adhesion, induction of the gene for the inflammatory cytokine TNF-α and the
promotion of cell proliferation (Mead et al., 2002).
Consistently, in splenic B-1a cells Mrc2 and Lpl expression was detectable in all
experiments. In contrast, the initial RT-PCR of Mrc2 and Lpl indicated no or low
expression in the peritoneal B-1a cells while in later experiments Mrc2 and Lpl were
reproducibly detectable in such cells. The reason for this discrepancy is unclear.
Possibly, the B-1a cells from peritoneum were contaminated by B-1b cells in which
expression of these two genes could be detected on microarrays. On the other hand,
a similar explanation as discussed for Hgpd might hold true also for Mrc2 and Lpl,
expression simply reflecting the inflammatory status of the mice. Independent of the
reason these two genes were excluded from the analysis.
Analysis of transferred B-1 cells: Cells from the peritoneal cavity of L2 mice were
transferred into lymphocyte deficient Rag 1-/- mice either by the i.v. or i.p. route.
Unsorted cells were used since on one hand only B-1 cells are found in the
peritoneum of such mice and on the other hand they contained T cells which might
be essential for the migration of such B cells. Rag1-/- mice were used because no
migration of B-1 cells to the spleen could be observed when normal or L2 mice were
used as recipients for i.p. transfers (Kretschmer et al., 2003b). The lack of
lymphocytes in the spleen of Rag1-/- mice obviously allows i.p. transferred B-1 cells to
home to the spleen.
103

4. Discussion
Independent of the route of transfer peritoneum derived B-1 cells could be found in
the peritoneum as well as the spleen of recipient mice. In the case of i.p. transfer the
course of colonization was followed. In both locations the number of B cells
increased until three weeks after transfer and then remained roughly constant. A
similar increase is found for T cells. This indicates that the transferred lymphocytes
expand due to homeostatic proliferation (Woodland and Schmidt, 2005) until the
compartments are filled at three weeks after transfer. The intrinsic feedback
regulation then stops expansion and leaves the cells at a steady state number in both
compartments.
Transferred cells were isolated and semiquantitative RT-PCR analysis performed for
the expression of the selected diagnostic genes. Although only three appropriate
genes could be included in this analysis (Vcam1, Adamdec1, Spic) unambiguous
results were obtained. Low to no expression was observed in transferred B-1 cells in
the peritoneum in accordance with expression before transfer. Such genes were
found to be upregulated when the B-1 cells resided in the spleen after transfer. This
suggests that the differential gene expression pattern observed for B-1 cells from
spleen and peritoneum is largely influenced by the microenvironment. This finding
however does not yet exclude the possibility that splenic and peritoneal B-1 are
derived from two independent lineages but only indicates that peritoneal B-1 cells
have the plasticity to express particular genes when migrating to the spleen of
lymphopenic mice.
Clearly, this analysis needs to be extended to additional diagnostic genes for
validation. In the present study only genes with known products were included while
ESTs (expressed sequence tags) were ignored. Therefore, a follow up study should
be extended to such gene products. In addition it would be important to analyze gene
expression patterns of B-1 cells from spleen and peritoneum after transfer of splenic
B-1 cells. This should give further hints on the plasticity of B-1 cells.
VCAM-1 expression on peritoneal B-1 cells: Particularly interesting results were
obtained when the expression pattern of VCAM-1 was analyzed during the above
experiments. Surprisingly, although no RNA expression of VCAM-1 was detectable in
peritoneal B-1a cells on average 5% could be stained with an anti-VCAM-1 antibody.
This staining has to be considered real since blockage of Fc-receptors by various
means did not abolish or significantly lower the staining. Different hypotheses could
104

4. Discussion
explain this finding: First, these cells could be migratory cells that have acquired
VCAM-1 expression outside the peritoneal cavity and downregulated the gene
expression upon entry into the peritoneum. Surface expression of the protein
however would remain detectable for some time. Alternatively, shed VCAM-1 might
have been absorbed passively by a fraction of B-1 cells. Shed VCAM-1 from stromal
and stimulated endothelial cells has been observed (Kinashi et al., 1995) and is also
found in serum under a broad range of disease conditions like atherosclerosis,
rheumatoid arthritis or systemic lupus erythematosus (Gearing and Newman, 1993;
Wellicome et al., 1993; Blankenberg et al., 2003). Nevertheless, even then one would
expect that the VCAM-1 carrying peritoneal B-1 cells are migratory and recent
immigrants into the peritoneum since otherwise all peritoneal B-1 cells should bear
VCAM-1 on their surface.
To further investigate this phenomenon additional transfer experiments are indicated.
So far only VCAM-1 negative B-1 cells from the peritoneum were transferred i.p and
tested two weeks after. In further experiments earlier time point should be tested
since at two weeks already steady state with regard to colonization and VCAM-1
expression might be reached. In addition, VCAM-1 positive cells should be
transferred and followed in a similar way. If VCAM-1 is involved in the migration and
homing of B-1 cells one would expect to find effects already early after transfer.
Under these condition one would also expect that independent of the route of transfer
and the phenotype of the transferred cells the ratio originally observed for
VCAM-1+/VCAM-1- should be obtained when steady state is reached. These
experiments should further support the idea that the microenvironment is defining the
gene expression pattern of B-1 cells.
Effect of conditional Vcam1 deficiency on the B cell compartment: VCAM-1 is known
to be constitutively expressed on bone marrow stromal/endothelial cells and classes
of hematopoietic cells, like dendritic cells and macrophages (Freedman et al., 1990;
Miyake et al., 1991; Koopman et al., 1991; Jacobsen et al., 1996; Schweitzer et al.,
1996). Xia et al. furthermore showed constitutive VCAM-1 expression on human B
lymphocytes from peripheral blood and plasmacytomas (Xia et al., 2001). The
existence of VCAM-1 on B-1a cells described here is novel and its functional role on
B cells is not known. VCAM-1 is thought to be involved in lymphocyte homing
105
4. Discussion
(Papayannopoulou and Craddock, 1997) and is supposed to be a costimulatory
molecule for T cells (Burkly et al., 1991).
To address which function VCAM-1 might have on B-1 cells, mice with a supposedly
B cell specific Vcam1 deletion were investigated. Therefore, mice with floxed Vcam1
alleles were mated with CD19cre recombinant mice that express the Cre protein
under the control of the CD19 promoter B cell specifically. No differences within the B
cell compartment of such mice could be observed in comparison to control mice.
However, flow cytometrical analysis of such mice revealed that VCAM-1 was still
expressed on B cells. This is obviously due to a low efficiency of the CD19 driven Cre
that has been observed also by other investigators (Rickert et al., 1997). In
agreement, Southern blots of B cells from VCAM-1flox/flox/CD19cre mice revealed
bands of undeleted VCAM-1 genes. This suggests an incomplete deletion.
Interestingly, in both VCAM-1flox/flox/CD19cre and control mice on average 15% of the
IgM+ cells in the spleen were positive for VCAM-1 expression. This suggests for
unknown reasons a strong selection of B cells with undeleted VCAM-1 into the
VCAM-1 positive B cell fraction. In future, such incomplete deletions might be
possible to be circumvented by employing a mouse line in which Cre is driven by the
mb-1 promoter (the mb1 gene encodes the Igα protein). In such mice Cre efficiency
is apparently 100% (Elias Hobeika, personal communication).
B-1 cell specific molecules: In flow cytometry B-1 cells are identified by a combination
of surface markers that allows the distinction from other B cell subsets. For instance
B-1 cells can be distinguished from follicular B-2 cells by their expression levels of
IgM and IgD. B-1 cells display a IgMhiIgDlo expression pattern whereas B-2 cells are
IgM+IgDhi. The expression of the CD5 molecule in combination with IgM defines B-1a
cells and distinguishes them from CD5- B-2 cells but also from B-1b cells. Other
markers that characterize B-1 cells, in contrast to B-2 cells, are CD43 or Mac-1.
However, the example of Mac-1 also shows the restrictions of such B-1 cell markers
since Mac-1 defines well peritoneal B-1 cells but is not detected on splenic B-1 cells.
Similarly, expression level of IgM and IgD can be used for the characterization of
peritoneal cavity B-1 cells but is insufficient in the spleen because of the presence of
other cell populations with an IgMhiIgDlo phenotype like marginal zone B cells or
fractions of immature B cells. Thus, in the spleen only CD5 represents a reliable
106

4. Discussion
marker for B-1a cells. A unique pan B-1 cell marker would therefore be a valuable
tool for studies of B-1 cells.
In this work it could be shown by RT-PCR that the F11r gene, encoding JAM-1, is
expressed in B-1a cells in spleen and peritoneum of L2 mice. The expression of
JAM-1 was confirmed by flow cytometrical analyses that were restricted to the
lymphoid gate. Peritoneal B-1a cells of L2 mice were positive for JAM-1 staining.
Similarly IgMhiCD5- cells showed JAM-1 expression indicating that also B-1b cells
express this marker. No expression could be detected on T cells or cells that were
negative for IgM and CD5 staining. Thus, in the peritoneal cavity of L2 mice JAM-1
expression is only found on B-1 cells. Similarly, in non-transgenic mice, peritoneal
cavity IgM+CD5+ B-1a cells were positive for JAM-1 and T cells and IgM-CD5- cells
were negative. B-1b and B-2 cells could be distinguished by the IgM+CD5lo (B-2) and
IgMhiCD5- (B-1b) expression pattern and it could be shown, that JAM-1 was only
expressed in the B-1b population.
In the spleen, T cells and IgM-CD5- cells were negative for JAM-1 staining in both
transgenic and control mice. Similarly, splenic B-2 cells in non-transgenic mice
showed no JAM-1 expression. In contrast, B-1a cells in the spleen of L2 mice were
clearly JAM-1+. However, the staining was weaker compared to peritoneal cavity
B-1a cells. The same was true for splenic B-1a cells of BALB/c mice.
Taken together, JAM-1 expression is detectable on all B-1 cells in transgenic and
non-transgenic mice and not found on any other of the cell populations present in the
lymphoid gate of spleen and peritoneal cavity. Thus, at these sites it can be
considered a marker for B-1 cells in flow cytometry. It will be interesting to extend this
analysis to other compartments like blood or gut associated tissue.
JAM-1 was originally characterized on platelets and was later found to be
predominantly expressed in endothelial and epithelial intercellular junctions. The
human orthologue of JAM-1 is expressed on a variety of circulating leukocytes in
peripheral blood, including monocytes, neutrophils, B and T lymphocytes (Ebnet et
al., 2004). On endothelia the interaction of JAM-1 with LFA-1 on leukocytes supports
the adhesion and transendothelial migration (Ostermann et al., 2002). However, the
role of JAM-1 expressed on leukocytes is not known and its function in B-1 cells has
to be investigated.
A second gene, Adml, also qualified by RT-PCR as a potential B-1 cell marker. It was
expressed in splenic and peritoneal B-1a cells of transgenic and non-transgenic L2
107

4. Discussion
mice and showed only traces in B-2 cells. Adml encodes Adrenomedullin, which in
the mouse is a small regulatory peptide 50 aa in length. It is expressed in a variety of
cells and tissues e.g. heart, brain, kidney as well as in leukocytes in the blood like
monocytes, mast cells but also in B and T cells. Initially it was characterized as a
vasodilator but in the meantime many other functions have been reported, e.g. an
impact on cell proliferation, hormone regulation and antimicrobial activity. A role as
anti-apoptotic survival factor was also described (Ostermann et al., 2002).
Preliminary experiments using a commercial anti-Adrenomedullin antibody did not
reveal any intracellular staining of B-1 cells (data not shown). Therefore, it is not clear
at the moment whether this molecule can be of use for B-1 cell studies. Clearly more
systematic investigations need to be carried out in order to validate Adrenomedullin
as a marker for B-1 cells especially in the light of a potential expression in non-B
cells.
In summary, several novel markers have been identified so far which should in future
either facilitate studies on B-1 cells or shed further light on the function of different
subpopulations of B-1 cells.
The L2P3 antibody
The most important marker of a B cell and of a B-1 cell for that matter is its B cell
receptor. According to the current hypothesis the BCR might imprint the B-1
phenotype onto a B cell (Lam and Rajewsky, 1999; Wang and Clarke, 2004b).
Therefore, the study of the behavior of particular B-1 cell clones under various
conditions should shed some light on the selective forces that act on this B cell. So
far analysis of the BCRs of B-1 cells from L2 mice was restricted to sequence
analysis. This has led to extremely interesting results already. A pronounced
oligoclonality was observed among their BCR specificities with a few specificities
dominating. Amongst those one was found in 15% of all peritoneal cavity B-1 cells
and represented 10% of splenic B-1 cell specificities (Kretschmer et al., 2002;
Kretschmer et al., 2003b). Two others represent 13% and 7,4% of the specificities in
the peritoneal cavity. These specificities were B-1 cell specific as they could not be
detected in B-2 cells so far. Thus they represent the appropriate invariant marker to
further study such B-1 cells.
108

4. Discussion
The 8H10 anti-idiotype antibody: By cell fusion using cells from spleen and peritoneal
cavity of L2 mice a hybridoma could be established which secreted a monoclonal IgM
- L2P3 - representing the specificity that was found at a 15% frequency in the
peritoneum. This IgM was first used to establish a reagent - the anti-idiotypic
antibody 8H10 – that to a large extend recognizes only antibodies with the
dominating sequence. This was established by isolating B-1 cells that were
recognized by the 8H10 antibody and analyzing their heavy chain sequence. 19 of
such sequences were identical to L2P3. Four additional sequences displayed an
identical CDR3 region but contained single aa exchanges. Such exchanges are
characteristic for somatic hypermutation although B-1 cell derived antibodies usually
lack somatic mutations (Berland and Wortis, 2002). Thus, such aa exchanges might
be due to Taq-polymerase errors. Besides these sequences, four sequences were
found that were deviating from the sequence of L2P3. Possibly the secondary
antibody employed for sorting might be responsible for a contamination with B-1 cells
not directly recognized by the anti-idiotypic antibody. Alternatively, although the sort
was highly pure (98,4%) some residual non-L2P3 type of B-1 cells were present in
the sample which might have contributed the non-L2P3 sequences. However, one
also cannot exclude that the anti-idiotypic antibody recognizes these BCRs
specifically via an idiotope that is shared but is not apparent from sequence
comparison. A second sort and analysis should clarify this question. Independent of
this, the 8H10+ antibody can be considered a highly specific anti-idiotypic antibody for
the detection of the L2P3 specificity and should represent an extremely useful
reagent.
The use of the 8H10 antibody in flow cytometrical analysis of the L2 mice revealed
very interesting results. An obvious difference was observed when splenic and
peritoneal B-1 cells from male and female mice were compared. Female mice
contained significantly more B-1 cell of this specificity when directly compared with
male mice. A discrepancy between the frequencies described originally for female L2
mice concerning this dominating specificity (Kretschmer et al., 2003b) and the
present data was observed. This could be due to alterations in the hygienic
conditions. However, since the size of the samples in the present work is still very
small and pools of mice were used in the original work no importance was given to
this discrepancy for the moment.
109

4. Discussion
Differences in immune reactions between males and females are well established.
Women are more prone to develop autoimmune diseases than men (Verthelyi, 2001;
Bouman et al., 2005). Strong differences are also observed in the resistance of
males and females mice towards Listeria monocytogenes infection (Lengeling
personal communication). Therefore, the selective forces acting on B-1 cells from
males and females might be different due to differences in resistance against the
natural microbial environment. In addition, estrogen receptors are expressed in B
cells (Grimaldi et al., 2005). Therefore, even a direct influence of the hormonal milieu
on the selection of B-1 specificities can be envisioned.
Additional influences on the selection of the L2P3 specificity were observed when
female mice from different housing conditions – SPF versus conventional - were
compared. Lower numbers of B-1 cells stained with 8H10 were found in SPF mice
that contain a defined commensal microbial flora in their intestine and are free of
known bacterial, viral, and parasitic pathogens. The most obvious explanation for this
observation is that microbes of the gut contribute significantly to the selection of B-1
specificities in the lymphoid compartments even when they are not associated with
this organ.
Further experiments should now carefully extend the data on the impact of gender
and housing. Defined pathogens with an intestinal port of entry should be tested in
this context for their impact on the repertoire of B-1 derived antibodies in the various
deep lymphoid compartments.
An influence of the age of the mice on the selection of the L2P3 specificity should
also be tested since it is most likely not only driven by microbial antigens but also by
autoantigen. For instance, Carmack et al. have reported a time-dependent
accumulation of B-1 cells specific for a determinant on senescent erythrocytes (anti-
BrMRBC, anti-PtC) (Carmack et al., 1990). Similarly, Hayakawa et al. observed a
time-dependent increase of B-1 cells specific for the Thy-1 self-antigen (Hayakawa et
al., 1999). The finding that L2P3 apparently binds to lymphoid cells in the peritoneum
of L2 mice is in accordance with this. Although only a weak signal was observed the
staining appeared to be specific as neither the second B-1 cell derived antibody
L2M15 nor MOPC104E reacted with these cells and no binding of L2P3 was
observed in other organs. This might indicate the existence of an self-antigenic
determinant recognized by L2P3. So far the cells bound by L2P3 have not been
110

4. Discussion
characterized. As most (~80%) of the cells in the lymphoid gate of the peritoneal
cavity are B cells, they mainly contribute to the observed staining.
Unexplained is still why this antigen is only detected in L2 mice but different
possibilities exist concerning its nature. Either it is expressed endogenously i.e. by
the cells themselves like in the case of the autoantigen Thy-1 (Hayakawa et al.,
1999) which is expressed on T cells. Alternatively, it could be a soluble antigen
attached to receptors on the surface of these cells. An example that even a BCR can
be involved was provided by Carmack et al. (Carmack et al., 1990). When a B-1 cell
derived antibody (anti-BrMRBC) was used to stain peritoneal cavity cells, a fraction of
B-1 cells bound the antibody. More then half of the BCRs of these B-1 cells were
specific for BrMRBC. This suggests that the self-antigen was bound by the BCR of
these particular B-1 cells and was then detected by the antibody used in the analysis
in a sandwich kind of staining. Thus, one could envision that L2P3 detects a
determinant on an antibody that is bound to an self antigen on peritoneal cells of L2
mice. However, more likely is that L2P3 is specific for an intracellular antigen as it is
known for other natural antibodies (Baumgarth et al., 2005). The physiology of the L2
mice, for instance apoptosis or necrosis of particular cells, might solubilize this
antigen and render it detectable on the peritoneal lymphocytes of such mice. This
needs to be further worked out in a systematic way. Intracellular staining will have to
be carried out using the L2P3 antibody. As samples, cytological and histological
preparations of cells and tissues from L2 and control mice should be used. Apoptotic
cells should be included in this analysis.
Consistent with the detection of a self antigen was the in vivo behavior of the IgM
antibody L2P3 when injected into L2 mice and compared with two other B-1 cell
derived IgM – L2M15 and MOPC104E as well as one B-2 cell derived antibody 2D4.
The 2D4 antibody showed a half-live of 22 h similar to the half-life of IgM described
by others (Vieira and Rajewsky, 1988). In contrast L2P3, L2M15 and MOPC104E
showed a pronounced bi-phasic behavior in their clearance rates. During the first
phase of clearance the half-live of these antibodies was around 10 h which is short
compared to 2D4. In the second phase the half-life was increased to 35-43 h. The
monophasic kinetic of 2D4 is compatible with the expected short half-live of an IgM
antibody which is rather short compared to IgG antibodies (Vieira and Rajewsky,
1988) and probably reflects the natural degradation rate of this class of antibodies. In
contrast the B-1 cell derived antibodies are most likely submitted to two processes.
111

4. Discussion
The first process indicated by a short-half life might reflect the binding of these
antibodies to self antigen leading to their rapid clearance from sera. This binding
might result in the clearance or sequestration of the antigen thus denying further
access to the anybodies. With the loss of the antigen the antibody will be cleared at
its natural rate which is reflected by a extended half-live in serum.
It is interesting that all B-1 cell derived antibodies in this experiments behaved
similarly indicating that they all might bind to self-antigenic determinants although
only for L2P3 a weak self-reactivity could be demonstrated in flow cytometrical
analysis. Analyses of these antibodies so far only tested a fraction of the putative
autoantigen presenting cells, as only cells from spleen, thymus, bone marrow and
peritoneum were analyzed. Therefore, self-reactivity as an explanation for the
biphasic clearance rates of the B-1 derived antibodies is consistent with the data.
However, there is one technical draw back at the moment. Only few time points were
taken for analysis thus a similar curve for 2D4 might have been missed due to the
limited data available for calculation. Thus, clearly these experiments need to be
repeated with a more detailed analysis at the early phase of the clearance. In
addition, non transgenic mice should be included in this analysis. Furthermore,
histological analysis of various tissues shortly after administration of the antibody
should be carried out since it should be possible to find cells with bound antibody if a
self-reactivity exists. This might also help to identify the self-antigen itself.
Taken together, several novel aspects of the physiology of B-1 cells were addressed
during this work. It became clear during the course of the experiments that this B cell
population is dynamically reacting to environmental changes. This was most clearly
demonstrated by the difference in the frequency of L2P3 idiotype bearing B-1 cells in
mice from different housing conditions. Therefore, some of the analyses were
aggravated by such changes that could not be controlled but on the other hand might
reflect the natural situation that should be further analyzed. Nevertheless, interesting
information on the difference between splenic and peritoneal B-1 cell as well as on
the selective forces acting on them could be obtained which shed further light on this
still enigmatic B cell population.
112

5 Summary In the present work the transgenic mouse L2 was used in which almost exclusively
B-1 cells are found in the spleen and peritoneum. Several features of B-1 cells were
investigated in such mice. First, the question was addressed if differential gene
expression observed between splenic and peritoneal derived B-1a cells is due to the
distinct localization or due to different developmental origin of these cells. Based on
microarray data genes were established by RT-PCR analyses, that were expressed
in splenic B-1a cells and low or absent in peritoneal B-1a cells. These genes were
used as diagnostic markers in transfer experiments. In these experiments peritoneal
derived B-1a cells were injected into lymphopenic mice and reisolated from the
spleen as well as the peritoneal cavity. Then the gene expression pattern of such
cells was analyzed. All of the diagnostic marker genes were upregulated in peritoneal
derived B-1 cells that resided in the spleen. Thus it could be demonstrated that the
microenvironment is imprinting the gene expression pattern in such B-1 cells.
In line with the gene expression analysis of B-1 cells JAM-1 was identified as a novel
marker for B-1 cells located in spleen and peritoneum of mice. This protein was not
expressed in B-2 cells, T cells or any other population at these sites and therefore
specifically defines B-1 cells in flow cytometrical analysis in spleen and peritoneum.
In the last part of this work an anti-idiotypic antibody directed against a dominant B-1
cell specificity that had been identified on B-1 cells of L2 mice before, was generated.
To achieve this, hybridomas of splenic and peritoneal B-1a cells from L2 mice were
established that produced monoclonal IgM antibodies. Sequence analysis of cDNA of
VH regions from the individual clones was carried out. One antibody, L2P3, was of
particular interest because it represented one of the dominant specificities in the B-1
cell pool of L2 mice. A second antibody, L2M15, represented a specificity only
occasionally found in blood derived B-1 cells of L2 mice before and was used as
control antibody for the experiments. L2P3 was used to generate an anti-idiotypic
antibody in rats which was termed 8H10. Stainings performed with this anti-idiotype
indicate that the generation and maintenance of L2P3 positive cells might be
subjected to different selectional forces. Higher numbers of L2P3+ cells were
detected in female mice compared to male mice. Furthermore, the microbial
environment might have an impact on the selection as fewer L2P3+ cells were

5. Summary
observed in SPF mice than in mice housed under conventional conditions. The anti-
idiotype generated during this work is therefore a valuable tool for the investigation of
selectional forces B-1 cells are submitted to. Further work with this antibody will help
to unravel the impact of individual selectional influences shaping the B-1 cell pool in
L2 mice.
Finally, the purified antibodies L2P3 and L2M15 were further characterized. The
binding of L2P3 on cells in the lymphoid gate of the peritoneal cavity revealed binding
to an autoantigenic determinant whereas such binding was not observed for L2M15.
An analysis of antibody clearance rates from sera of L2 mice extended the
characterization of these antibodies. Biphasic clearance rates were found for the B-1
cell derived antibodies which is consistent with the idea that they bind to an
autoantigen in L2 mice.
114

6 References
Adolfsson, J., Borge, O.J., Bryder, D., Theilgaard-Monch, K., Astrand-Grundstrom, I., Sitnicka, E., Sasaki, Y., and Jacobsen, S.E. (2001). Upregulation of Flt3 expression within the bone marrow Lin(-)Sca1(+)c-kit(+) stem cell compartment is accompanied by loss of self-renewal capacity. Immunity 15, 659-669.
Ahearn, J.M., Fischer, M.B., Croix, D., Goerg, S., Ma, M., Xia, J., Zhou, X., Howard, R.G., Rothstein, T.L., and Carroll, M.C. (1996). Disruption of the Cr2 locus results in a reduction in B-1a cells and in an impaired B cell response to T-dependent antigen. Immunity. 4, 251-262.
Akashi, K., Traver, D., Miyamoto, T., and Weissman, I.L. (2000). A clonogenic common myeloid progenitor that gives rise to all myeloid lineages. Nature 404, 193-197.
Allman, D., Srivastava, B., and Lindsley, R.C. (2004). Alternative routes to maturity: branch points and pathways for generating follicular and marginal zone B cells. Immunol. Rev. 197, 147-160.
Araki, M., Araki, K., and Vassalli, P. (1993). Cloning and sequencing of mouse VCAM-1 cDNA 5. Gene 126, 261-264.
Arnold, L.W., Pennell, C.A., McCray, S.K., and Clarke, S.H. (1994). Development of B-1 cells: segregation of phosphatidyl choline-specific B cells to the B-1 population occurs after immunoglobulin gene expression. J. Exp. Med. 179, 1585-1595.
Arp, B., McMullen, M.D., and Storb, U. (1982). Sequences of immunoglobulin lambda 1 genes in a lambda 1 defective mouse strain. Nature 298, 184-187.
Barreto, V. and Cumano, A. (2000). Frequency and characterization of phenotypic Ig heavy chain allelically included IgM-expressing B cells in mice. J. Immunol. 164, 893-899.
Bassing, C.H., Swat, W., and Alt, F.W. (2002). The mechanism and regulation of chromosomal V(D)J recombination. Cell 109 Suppl, S45-S55.
Baumgarth, N., Chen, J., Herman, O.C., Jager, G.C., and Herzenberg, L.A. (2000). The role of B-1 and B-2 cells in immune protection from influenza virus infection. Curr. Top. Microbiol. Immunol 252, 163-169.
Baumgarth, N., Herman, O.C., Jager, G.C., Brown, L., Herzenberg, L.A., and Herzenberg, L.A. (1999). Innate and acquired humoral immunities to influenza virus are mediated by distinct arms of the immune system. Proc. Natl. Acad. Sci. U. S A 96, 2250-2255.
Baumgarth, N., Tung, J.W., and Herzenberg, L.A. (2005). Inherent specificities in natural antibodies: a key to immune defense against pathogen invasion. Springer Semin. Immunopathol.
Benedict, C.L., Gilfillan, S., Thai, T.H., and Kearney, J.F. (2000). Terminal deoxynucleotidyl transferase and repertoire development. Immunol Rev 175, 150-157.
Bentolila, L.A., Olson, S., Marshall, A., Rougeon, F., Paige, C.J., Doyen, N., and Wu, G.E. (1999). Extensive junctional diversity in Ig light chain genes from early B cell progenitors of mu MT mice 1. J. Immunol 162, 2123-2128.
Berland, R. and Wortis, H.H. (2002). Origins and functions of B-1 cells with notes on the role of CD5. Annu. Rev. Immunol. 20, 253-300.
Besmer, E., Gourzi, P., and Papavasiliou, F.N. (2004). The regulation of somatic hypermutation. Curr. Opin. Immunol 16, 241-245.
Bikah, G., Carey, J., Ciallella, J.R., Tarakhovsky, A., and Bondada, S. (1996). CD5-mediated negative regulation of antigen receptor-induced growth signals in B-1 B cells. Science 274, 1906-1909.
Blankenberg, S., Barbaux, S., and Tiret, L. (2003). Adhesion molecules and atherosclerosis. Atherosclerosis 170, 191-203.

6. References
Blomberg, B. and Tonegawa, S. (1982). DNA sequences of the joining regions of mouse lambda light chain immunoglobulin genes. Proc. Natl. Acad. Sci. U. S A 79, 530-533.
Bos, N.A., Meeuwsen, C.G., Wostmann, B.S., Pleasants, J.R., and Benner, R. (1988). The influence of exogenous antigenic stimulation on the specificity repertoire of background immunoglobulin-secreting cells of different isotypes. Cell Immunol 112, 371-380.
Bouman, A., Heineman, M.J., and Faas, M.M. (2005). Sex hormones and the immune response in humans. Hum. Reprod. Update.
Bradl, H. and Jack, H.M. (2001). Surrogate light chain-mediated interaction of a soluble pre-B cell receptor with adherent cell lines. J. Immunol 167, 6403-6411.
Briles, D.E., Nahm, M., Schroer, K., Davie, J., Baker, P., Kearney, J., and Barletta, R. (1981). Antiphosphocholine antibodies found in normal mouse serum are protective against intravenous infection with type 3 streptococcus pneumoniae. J. Exp. Med. 153, 694-705.
Bryant, P. and Ploegh, H. (2004). Class II MHC peptide loading by the professionals. Curr. Opin. Immunol 16, 96-102.
Burkly, L.C., Jakubowski, A., Newman, B.M., Rosa, M.D., Chi-Rosso, G., and Lobb, R.R. (1991). Signaling by vascular cell adhesion molecule-1 (VCAM-1) through VLA-4 promotes CD3-dependent T cell proliferation. Eur. J. Immunol 21, 2871-2875.
Busslinger, M. (2004). Transcriptional control of early B cell development. Annu. Rev Immunol 22, 55-79.
Calame, K.L., Lin, K.I., and Tunyaplin, C. (2003). Regulatory mechanisms that determine the development and function of plasma cells. Annu. Rev. Immunol. 21, 205-230.
Carmack, C.E., Shinton, S.A., Hayakawa, K., and Hardy, R.R. (1990). Rearrangement and selection of VH11 in the Ly-1 B cell lineage 1. J. Exp. Med. 172, 371-374.
Carsetti, R., Rosado, M.M., and Wardmann, H. (2004). Peripheral development of B cells in mouse and man. Immunol. Rev. 197, 179-191.
Casadevall, A. and Pirofski, L.A. (2004). New concepts in antibody-mediated immunity. Infect. Immun. 72, 6191-6196.
Casali, P., Burastero, S.E., Nakamura, M., Inghirami, G., and Notkins, A.L. (1987). Human lymphocytes making rheumatoid factor and antibody to ssDNA belong to Leu-1+ B-cell subset. Science 236, 77-81.
Chan, V.W., Meng, F., Soriano, P., DeFranco, A.L., and Lowell, C.A. (1997). Characterization of the B lymphocyte populations in Lyn-deficient mice and the role of Lyn in signal initiation and down-regulation. Immunity. 7, 69-81.
Chaudhuri, J. and Alt, F.W. (2004). Class-switch recombination: interplay of transcription, DNA deamination and DNA repair. Nat. Rev Immunol 4, 541-552.
Chevillard, C., Ozaki, J., Herring, C.D., and Riblet, R. (2002). A three-megabase yeast artificial chromosome contig spanning the C57BL mouse Igh locus. J. Immunol. 168, 5659-5666.
Chowdhury, D. and Sen, R. (2004). Regulation of immunoglobulin heavy-chain gene rearrangements. Immunol. Rev. 200, 182-196.
Christensen, J.L. and Weissman, I.L. (2001). Flk-2 is a marker in hematopoietic stem cell differentiation: a simple method to isolate long-term stem cells. Proc. Natl. Acad. Sci. U. S A 98, 14541-14546.
Chumley, M.J., Dal Porto, J.M., Kawaguchi, S., Cambier, J.C., Nemazee, D., and Hardy, R.R. (2000). A VH11V kappa 9 B cell antigen receptor drives generation of CD5+ B cells both in vivo and in vitro. J. Immunol. 164, 4586-4593.
Claflin, J.L. and Berry, J. (1988). Genetics of the phosphocholine-specific antibody response to Streptococcus pneumoniae. Germ-line but not mutated T15 antibodies are dominantly selected. J. Immunol 141, 4012-4019.
116

6. References
Claflin, J.L., Lieberman, R., and Davie, J.M. (1974). Clonal nature of the immune response to phosphorylcholine. I. Specificity, class, and idiotype of phosphorylcholine-binding receptors on lymphoid cells. J. Exp. Med. 139, 58-73.
Clarke, S.H. and Arnold, L.W. (1998). B-1 cell development: evidence for an uncommitted immunoglobulin (Ig)M+ B cell precursor in B-1 cell differentiation. J. Exp. Med. 187, 1325-1334.
Cong, Y.Z., Rabin, E., and Wortis, H.H. (1991). Treatment of murine CD5- B cells with anti-Ig, but not LPS, induces surface CD5: two B-cell activation pathways. Int. Immunol. 3, 467-476.
Cook-Mills, J.M. (2002). VCAM-1 signals during lymphocyte migration: role of reactive oxygen species. Mol. Immunol 39, 499-508.
Cornall, R.J., Goodnow, C.C., and Cyster, J.G. (1995). The regulation of self-reactive B cells. Curr. Opin. Immunol. 7, 804-811.
Cumano, A., Paige, C.J., Iscove, N.N., and Brady, G. (1992). Bipotential precursors of B cells and macrophages in murine fetal liver. Nature 356, 612-615.
Damle, N.K., Klussman, K., Linsley, P.S., and Aruffo, A. (1992). Differential costimulatory effects of adhesion molecules B7, ICAM-1, LFA-3, and VCAM-1 on resting and antigen-primed CD4+ T lymphocytes. J. Immunol 148, 1985-1992.
Dauphinee, M., Tovar, Z., and Talal, N. (1988). B cells expressing CD5 are increased in Sjogren's syndrome 1. Arthritis Rheum. 31, 642-647.
De, P., Peak, M.M., and Rodgers, K.K. (2004). DNA cleavage activity of the V(D)J recombination protein RAG1 is autoregulated. Mol. Cell Biol. 24, 6850-6860.
DeFranco, A.L. (1999). Distinct types of antibody responses. In Fundamental immunology (Edited by Paul W.E.), p. 241, Lippincott-Raven Publishers, Philadelphia.
Diaz, M. and Casali, P. (2002). Somatic immunoglobulin hypermutation. Curr. Opin. Immunol 14, 235-240.
Doody, G.M., Bell, S.E., Vigorito, E., Clayton, E., McAdam, S., Tooze, R., Fernandez, C., Lee, I.J., and Turner, M. (2001). Signal transduction through Vav-2 participates in humoral immune responses and B cell maturation. Nat. Immunol. 2, 542-547.
Douagi, I., Vieira, P., and Cumano, A. (2002). Lymphocyte commitment during embryonic development, in the mouse. Semin. Immunol. 14, 361-369.
Düber, S. B cell development in fetal liver and adult bone marrow. 29-10-2004. Ref Type: Generic
Duber, S., Engel, H., Rolink, A., Kretschmer, K., and Weiss, S. (2003). Germline transcripts of immunoglobulin light chain variable regions are structurally diverse and differentially expressed. Mol. Immunol 40, 509-516.
Dul, J.L., Argon, Y., Winkler, T., ten Boekel, E., Melchers, F., and Martensson, I.L. (1996). The murine VpreB1 and VpreB2 genes both encode a protein of the surrogate light chain and are co-expressed during B cell development. Eur. J. Immunol 26, 906-913.
Early, P., Huang, H., Davis, M., Calame, K., and Hood, L. (1980). An immunoglobulin heavy chain variable region gene is generated from three segments of DNA: VH, D and JH. Cell 19, 981-992.
Ebnet, K., Suzuki, A., Ohno, S., and Vestweber, D. (2004). Junctional adhesion molecules (JAMs): more molecules with dual functions? 1. J. Cell Sci. 117, 19-29.
Edry, E. and Melamed, D. (2004). Receptor editing in positive and negative selection of B lymphopoiesis. J. Immunol 173, 4265-4271.
Engel, H., Bogen, B., Muller, U., Andersson, J., Rolink, A., and Weiss, S. (1998). Expression level of a transgenic lambda2 chain results in isotype exclusion and commitment to B1 cells. Eur. J. Immunol. 28, 2289-2299.
117

6. References
Engel, H., Rolink, A., and Weiss, S. (1999). B cells are programmed to activate kappa and lambda for rearrangement at consecutive developmental stages. Eur. J. Immunol. 29, 2167-2176.
Engel, P., Zhou, L.J., Ord, D.C., Sato, S., Koller, B., and Tedder, T.F. (1995). Abnormal B lymphocyte development, activation, and differentiation in mice that lack or overexpress the CD19 signal transduction molecule. Immunity. 3, 39-50.
Feeney, A.J. (1990). Lack of N regions in fetal and neonatal mouse immunoglobulin V-D-J junctional sequences. J. Exp. Med. 172, 1377-1390.
Fischer, G.M., Solt, L.A., Hastings, W.D., Yang, K., Gerstein, R.M., Nikolajczyk, B.S., Clarke, S.H., and Rothstein, T.L. (2001). Splenic and peritoneal B-1 cells differ in terms of transcriptional and proliferative features that separate peritoneal B-1 from splenic B-2 cells. Cell Immunol. 213, 62-71.
Forster, I., Gu, H., and Rajewsky, K. (1988). Germline antibody V regions as determinants of clonal persistence and malignant growth in the B cell compartment. EMBO J. 7, 3693-3703.
Forster, I. and Rajewsky, K. (1987). Expansion and functional activity of Ly-1+ B cells upon transfer of peritoneal cells into allotype-congenic, newborn mice. Eur. J. Immunol 17, 521-528.
Franklin, A. and Blanden, R.V. (2004). On the molecular mechanism of somatic hypermutation of rearranged immunoglobulin genes 1. Immunol Cell Biol. 82, 557-567.
Frazer, J.K. and Capra, J.D. (1999). Immunoglobulins: Structure and Function. In Fundamental immunology (Edited by Paul W.E.), pp. 37-74, Lippincott-Raven, Philadelphia.
Freedman, A.S., Munro, J.M., Rice, G.E., Bevilacqua, M.P., Morimoto, C., McIntyre, B.W., Rhynhart, K., Pober, J.S., and Nadler, L.M. (1990). Adhesion of human B cells to germinal centers in vitro involves VLA-4 and INCAM-110 2. Science 249, 1030-1033.
Fruman, D.A., Snapper, S.B., Yballe, C.M., Davidson, L., Yu, J.Y., Alt, F.W., and Cantley, L.C. (1999). Impaired B cell development and proliferation in absence of phosphoinositide 3-kinase p85alpha. Science 283, 393-397.
Gauld, S.B., Dal Porto, J.M., and Cambier, J.C. (2002). B cell antigen receptor signaling: roles in cell development and disease. Science 296, 1641-1642.
Gauthier, L., Rossi, B., Roux, F., Termine, E., and Schiff, C. (2002). Galectin-1 is a stromal cell ligand of the pre-B cell receptor (BCR) implicated in synapse formation between pre-B and stromal cells and in pre-BCR triggering. Proc. Natl. Acad. Sci. U. S A 99, 13014-13019.
Gearing, A.J. and Newman, W. (1993). Circulating adhesion molecules in disease. Immunol Today 14, 506-512.
Gerdes, T. and Wabl, M. (2002). Physical map of the mouse lambda light chain and related loci. Immunogenetics 54, 62-65.
Gilfillan, S., Dierich, A., Lemeur, M., Benoist, C., and Mathis, D. (1993). Mice lacking TdT: mature animals with an immature lymphocyte repertoire. Science 261, 1175-1178.
Godin, I.E., Garcia-Porrero, J.A., Coutinho, A., Dieterlen-Lievre, F., and Marcos, M.A. (1993). Para-aortic splanchnopleura from early mouse embryos contains B1a cell progenitors. Nature 364, 67-70.
Goodnow, C.C., Crosbie, J., Adelstein, S., Lavoie, T.B., Smith-Gill, S.J., Brink, R.A., Pritchard-Briscoe, H., Wotherspoon, J.S., Loblay, R.H., Raphael, K., and . (1988). Altered immunoglobulin expression and functional silencing of self-reactive B lymphocytes in transgenic mice. Nature 334, 676-682.
Grawunder, U., Leu, T.M., Schatz, D.G., Werner, A., Rolink, A.G., Melchers, F., and Winkler, T.H. (1995a). Down-regulation of RAG1 and RAG2 gene expression in preB cells after functional immunoglobulin heavy chain rearrangement. Immunity. 3, 601-608.
Grawunder, U., Rolink, A., and Melchers, F. (1995b). Induction of sterile transcription from the kappa L chain gene locus in V(D)J recombinase-deficient progenitor B cells. Int. Immunol 7, 1915-1925.
118

6. References
Greenspan, N.S. and Bona, C.A. (1993). Idiotypes: structure and immunogenicity. FASEB J. 7, 437-444.
Grimaldi, C.M., Hicks, R., and Diamond, B. (2005). B cell selection and susceptibility to autoimmunity 1. J. Immunol 174, 1775-1781.
Hahn, E.L., Clancy, K.D., Tai, H.H., Ricken, J.D., He, L.K., and Gamelli, R.L. (1998). Prostaglandin E2 alterations during sepsis are partially mediated by endotoxin-induced inhibition of prostaglandin 15-hydroxydehydrogenase. J. Trauma 44, 777-781.
Hamilton, A.M. and Kearney, J.F. (1994). Effects of IgM allotype suppression on serum IgM levels, B-1 and B-2 cells, and antibody responses in allotype heterozygous F1 mice. Dev. Immunol. 4, 27-41.
Hardy, R.R., Carmack, C.E., Shinton, S.A., Kemp, J.D., and Hayakawa, K. (1991). Resolution and characterization of pro-B and pre-pro-B cell stages in normal mouse bone marrow. J. Exp. Med. 173, 1213-1225.
Hardy, R.R. and Hayakawa, K. (2004). Development of B cells producing natural autoantibodies to thymocytes and senescent erythrocytes. Springer Semin. Immunopathol.
Hardy, R.R., Wasserman, R., Li, Y.S., Shinton, S.A., and Hayakawa, K. (2000). Response by B cell precursors to pre-B receptor assembly: differences between fetal liver and bone marrow. Curr. Top. Microbiol. Immunol 252, 25-30.
Hardy, R.R., Wei, C.J., and Hayakawa, K. (2004). Selection during development of VH11+ B cells: a model for natural autoantibody-producing CD5+ B cells. Immunol Rev 197, 60-74.
Hartley, S.B., Cooke, M.P., Fulcher, D.A., Harris, A.W., Cory, S., Basten, A., and Goodnow, C.C. (1993). Elimination of self-reactive B lymphocytes proceeds in two stages: arrested development and cell death. Cell 72, 325-335.
Hashimoto, A., Takeda, K., Inaba, M., Sekimata, M., Kaisho, T., Ikehara, S., Homma, Y., Akira, S., and Kurosaki, T. (2000). Cutting edge: essential role of phospholipase C-gamma 2 in B cell development and function. J. Immunol. 165, 1738-1742.
Haughton, G., Arnold, L.W., Whitmore, A.C., and Clarke, S.H. (1993). B-1 cells are made, not born. Immunol Today 14, 84-87.
Haury, M., Sundblad, A., Grandien, A., Barreau, C., Coutinho, A., and Nobrega, A. (1997). The repertoire of serum IgM in normal mice is largely independent of external antigenic contact. Eur. J. Immunol 27, 1557-1563.
Hayakawa, K., Asano, M., Shinton, S.A., Gui, M., Allman, D., Stewart, C.L., Silver, J., and Hardy, R.R. (1999). Positive selection of natural autoreactive B cells. Science 285, 113-116.
Hayakawa, K., Asano, M., Shinton, S.A., Gui, M., Wen, L.J., Dashoff, J., and Hardy, R.R. (2003). Positive selection of anti-thy-1 autoreactive B-1 cells and natural serum autoantibody production independent from bone marrow B cell development. J. Exp. Med. 197, 87-99.
Hayakawa, K., Hardy, R.R., Honda, M., Herzenberg, L.A., Steinberg, A.D., and Herzenberg, L.A. (1984). Ly-1 B cells: functionally distinct lymphocytes that secrete IgM autoantibodies. Proc. Natl. Acad. Sci. U. S A 81, 2494-2498.
Hayakawa, K., Hardy, R.R., Parks, D.R., and Herzenberg, L.A. (1983). The "Ly-1 B" cell subpopulation in normal immunodefective, and autoimmune mice 2. J. Exp. Med. 157, 202-218.
Hayakawa, K., Tarlinton, D., and Hardy, R.R. (1994). Absence of MHC class II expression distinguishes fetal from adult B lymphopoiesis in mice. J. Immunol. 152, 4801-4807.
Hendriks, R.W., de Bruijn, M.F., Maas, A., Dingjan, G.M., Karis, A., and Grosveld, F. (1996). Inactivation of Btk by insertion of lacZ reveals defects in B cell development only past the pre-B cell stage. EMBO J. 15, 4862-4872.
Hendriks, R.W. and Middendorp, S. (2004). The pre-BCR checkpoint as a cell-autonomous proliferation switch. Trends Immunol 25, 249-256.
Herzenberg, L.A. (2000). B-1 cells: the lineage question revisited. Immunol. Rev. 175, 9-22.
119

6. References
Herzenberg, L.A., Stall, A.M., Lalor, P.A., Sidman, C., Moore, W.A., Parks, D.R., and Herzenberg, L.A. (1986). The Ly-1 B cell lineage. Immunol Rev 93, 81-102.
Hiramatsu, R., Akagi, K., Matsuoka, M., Sakumi, K., Nakamura, H., Kingsbury, L., David, C., Hardy, R.R., Yamamura, K., and Sakano, H. (1995). The 3' enhancer region determines the B/T specificity and pro-B/pre-B specificity of immunoglobulin V kappa-J kappa joining 1. Cell 83, 1113-1123.
Hofmann, M., Nussbaum, A.K., Emmerich, N.P., Stoltze, L., and Schild, H. (2001). Mechanisms of MHC class I-restricted antigen presentation. Expert. Opin. Ther. Targets. 5, 379-393.
Howie, J.B. and Helyer, B.J. (1968). The immunology and pathology of NZB mice 1. Adv. Immunol 9, 215-266.
Humbert, P.O. and Corcoran, L.M. (1997). oct-2 gene disruption eliminates the peritoneal B-1 lymphocyte lineage and attenuates B-2 cell maturation and function. J. Immunol. 159, 5273-5284.
Igarashi, H., Gregory, S.C., Yokota, T., Sakaguchi, N., and Kincade, P.W. (2002). Transcription from the RAG1 locus marks the earliest lymphocyte progenitors in bone marrow. Immunity 17, 117-130.
Ishiyama, N., Kitagawa, M., Takahashi, H., Kina, T., and Hirokawa, K. (1998). Expression of VCAM-1 in lymphocytes during the process of apoptosis. Pathobiology 66, 274-283.
Ivanov, A.I., Scheck, A.C., and Romanovsky, A.A. (2003). Expression of genes controlling transport and catabolism of prostaglandin E2 in lipopolysaccharide fever. Am. J. Physiol Regul. Integr. Comp Physiol 284, R698-R706.
Jackson, S.P. (2002). Sensing and repairing DNA double-strand breaks. Carcinogenesis 23, 687-696.
Jacobsen, K., Kravitz, J., Kincade, P.W., and Osmond, D.G. (1996). Adhesion receptors on bone marrow stromal cells: in vivo expression of vascular cell adhesion molecule-1 by reticular cells and sinusoidal endothelium in normal and gamma-irradiated mice 3. Blood 87, 73-82.
Johansen, F.E., Braathen, R., and Brandtzaeg, P. (2000). Role of J chain in secretory immunoglobulin formation. Scand. J. Immunol 52, 240-248.
Jumaa, H., Wollscheid, B., Mitterer, M., Wienands, J., Reth, M., and Nielsen, P.J. (1999). Abnormal development and function of B lymphocytes in mice deficient for the signaling adaptor protein SLP-65. Immunity. 11, 547-554.
Jung, D. and Alt, F.W. (2004). Unraveling V(D)J recombination; insights into gene regulation. Cell 116, 299-311.
Kabat E.A., Wu T.T., Reid-Miller M., Perry H.M. and Gottesman K.M. (1987) Sequences of proteins of immunological interest.
Kantor, A.B., Stall, A.M., Adams, S., Herzenberg, L.A., and Herzenberg, L.A. (1992). Differential development of progenitor activity for three B-cell lineages. Proc. Natl. Acad. Sci. U. S A 89, 3320-3324.
Karasuyama, H., Rolink, A., Shinkai, Y., Young, F., Alt, F.W., and Melchers, F. (1994). The expression of Vpre-B/lambda 5 surrogate light chain in early bone marrow precursor B cells of normal and B cell-deficient mutant mice. Cell 77, 133-143.
Kawaguchi, S. (1988). Reactivity of mouse antibodies against bromelain-treated mouse erythrocytes with various mouse cells before and after protease treatment. Int. Arch. Allergy Appl. Immunol 86, 458-461.
Kawaguchi, S. (1989). Reactivity of mouse antibodies against bromelain-treated mouse erythrocytes with thrombin-treated mouse platelets. Immunology 66, 335-338.
Kawamoto, H., Ikawa, T., Ohmura, K., Fujimoto, S., and Katsura, Y. (2000). T cell progenitors emerge earlier than B cell progenitors in the murine fetal liver. Immunity. 12, 441-450.
Kearney, J.F., Radbruch, A., Liesegang, B., and Rajewsky, K. (1979). A new mouse myeloma cell line that has lost immunoglobulin expression but permits the construction of antibody-secreting hybrid cell lines 2. J. Immunol 123, 1548-1550.
120

6. References
Kearney, J.F., Vakil, M., and Dwyer, D.S. (1987). Idiotypes and autoimmunity. Ciba Found. Symp. 129, 109-122.
Kenter, A.L. and Tredup, J. (1991). High expression of a 3'----5' exonuclease activity is specific to B lymphocytes. Mol. Cell Biol. 11, 4398-4404.
Khan, W.N., Alt, F.W., Gerstein, R.M., Malynn, B.A., Larsson, I., Rathbun, G., Davidson, L., Muller, S., Kantor, A.B., Herzenberg, L.A., and . (1995). Defective B cell development and function in Btk-deficient mice. Immunity. 3, 283-299.
Kinashi, T., St Pierre, Y., and Springer, T.A. (1995). Expression of glycophosphatidylinositol-anchored and -non-anchored isoforms of vascular cell adhesion molecule 1 in murine stromal and endothelial cells. J. Leukoc. Biol. 57, 168-173.
Kleinfield, R.W. and Weigert, M.G. (1989). Analysis of VH gene replacement events in a B cell lymphoma. J. Immunol 142, 4475-4482.
Kondo, M., Weissman, I.L., and Akashi, K. (1997). Identification of clonogenic common lymphoid progenitors in mouse bone marrow. Cell 91, 661-672.
Koopman, G., Keehnen, R.M., Lindhout, E., Newman, W., Shimizu, Y., van Seventer, G.A., de Groot, C., and Pals, S.T. (1994). Adhesion through the LFA-1 (CD11a/CD18)-ICAM-1 (CD54) and the VLA-4 (CD49d)-VCAM-1 (CD106) pathways prevents apoptosis of germinal center B cells. J. Immunol 152, 3760-3767.
Koopman, G., Keehnen, R.M., Lindhout, E., Zhou, D.F., de Groot, C., and Pals, S.T. (1997). Germinal center B cells rescued from apoptosis by CD40 ligation or attachment to follicular dendritic cells, but not by engagement of surface immunoglobulin or adhesion receptors, become resistant to CD95-induced apoptosis. Eur. J. Immunol 27, 1-7.
Koopman, G., Parmentier, H.K., Schuurman, H.J., Newman, W., Meijer, C.J., and Pals, S.T. (1991). Adhesion of human B cells to follicular dendritic cells involves both the lymphocyte function-associated antigen 1/intercellular adhesion molecule 1 and very late antigen 4/vascular cell adhesion molecule 1 pathways 1. J. Exp. Med. 173, 1297-1304.
Kretschmer, K., Engel, H., and Weiss, S. (2002). Strong antigenic selection shaping the immunoglobulin heavy chain repertoire of B-1a lymphocytes in lambda 2(315) transgenic mice. Eur. J. Immunol 32, 2317-2327.
Kretschmer, K., Jungebloud, A., Stopkowicz, J., Kleinke, T., Hoffmann, R., and Weiss, S. (2003a). The selection of marginal zone B cells differs from that of B-1a cells. J. Immunol 171, 6495-6501.
Kretschmer, K., Jungebloud, A., Stopkowicz, J., Stoermann, B., Hoffmann, R., and Weiss, S. (2003b). Antibody repertoire and gene expression profile: implications for different developmental and functional traits of splenic and peritoneal B-1 lymphocytes. J. Immunol 171, 1192-1201.
Kretschmer, K., Stopkowicz, J., Scheffer, S., Greten, T.F., and Weiss, S. (2004). Maintenance of peritoneal B-1a lymphocytes in the absence of the spleen. J. Immunol 173, 197-204.
Kudo, A. and Melchers, F. (1987). A second gene, VpreB in the lambda 5 locus of the mouse, which appears to be selectively expressed in pre-B lymphocytes. EMBO J. 6, 2267-2272.
Lacaud, G., Carlsson, L., and Keller, G. (1998). Identification of a fetal hematopoietic precursor with B cell, T cell, and macrophage potential. Immunity. 9, 827-838.
Lafaille, J.J., DeCloux, A., Bonneville, M., Takagaki, Y., and Tonegawa, S. (1989). Junctional sequences of T cell receptor gamma delta genes: implications for gamma delta T cell lineages and for a novel intermediate of V-(D)-J joining 1. Cell 59, 859-870.
Lalor, P.A., Herzenberg, L.A., Adams, S., and Stall, A.M. (1989a). Feedback regulation of murine Ly-1 B cell development. Eur. J. Immunol. 19, 507-513.
Lalor, P.A., Stall, A.M., Adams, S., and Herzenberg, L.A. (1989b). Permanent alteration of the murine Ly-1 B repertoire due to selective depletion of Ly-1 B cells in neonatal animals. Eur. J. Immunol. 19, 501-506.
Lam, K.P., Kuhn, R., and Rajewsky, K. (1997). In vivo ablation of surface immunoglobulin on mature B cells by inducible gene targeting results in rapid cell death. Cell 90, 1073-1083.
121
6. References
Lam, K.P. and Rajewsky, K. (1999). B cell antigen receptor specificity and surface density together determine B-1 versus B-2 cell development 2. J. Exp. Med. 190, 471-477.
Lam, K.P. and Stall, A.M. (1994). Major histocompatibility complex class II expression distinguishes two distinct B cell developmental pathways during ontogeny. J. Exp. Med. 180, 507-516.
Landau, N.R., Schatz, D.G., Rosa, M., and Baltimore, D. (1987). Increased frequency of N-region insertion in a murine pre-B-cell line infected with a terminal deoxynucleotidyl transferase retroviral expression vector. Mol. Cell Biol. 7, 3237-3243.
Lee, G.S., Brandt, V.L., and Roth, D.B. (2004). B cell development leads off with a base hit: dU:dG mismatches in class switching and hypermutation. Mol. Cell 16, 505-508.
Leitges, M., Schmedt, C., Guinamard, R., Davoust, J., Schaal, S., Stabel, S., and Tarakhovsky, A. (1996). Immunodeficiency in protein kinase cbeta-deficient mice. Science 273, 788-791.
Li, Y.S., Hayakawa, K., and Hardy, R.R. (1993). The regulated expression of B lineage associated genes during B cell differentiation in bone marrow and fetal liver. J. Exp. Med. 178, 951-960.
Li, Y.S., Wasserman, R., Hayakawa, K., and Hardy, R.R. (1996). Identification of the earliest B lineage stage in mouse bone marrow. Immunity 5, 527-535.
Lindhout, E., Mevissen, M.L., Kwekkeboom, J., Tager, J.M., and de Groot, C. (1993). Direct evidence that human follicular dendritic cells (FDC) rescue germinal centre B cells from death by apoptosis. Clin. Exp. Immunol 91, 330-336.
Livak, F. (2004). In vitro and in vivo studies on the generation of the primary T-cell receptor repertoire. Immunol Rev 200, 23-35.
Loder, F., Mutschler, B., Ray, R.J., Paige, C.J., Sideras, P., Torres, R., Lamers, M.C., and Carsetti, R. (1999). B cell development in the spleen takes place in discrete steps and is determined by the quality of B cell receptor-derived signals. J. Exp. Med. 190, 75-89.
Lopes-Carvalho, T. and Kearney, J.F. (2004). Development and selection of marginal zone B cells. Immunol. Rev. 197, 192-205.
Martin, F. and Kearney, J.F. (2001). B1 cells: similarities and differences with other B cell subsets. Curr. Opin. Immunol. 13, 195-201.
Martin, F., Oliver, A.M., and Kearney, J.F. (2001). Marginal zone and B1 B cells unite in the early response against T-independent blood-borne particulate antigens. Immunity 14, 617-629.
Martin, W.J. and Martin, S.E. (1975). Thymus reactive IgM autoantibodies in normal mouse sera. Nature 254, 716-718.
Masmoudi, H., Mota-Santos, T., Huetz, F., Coutinho, A., and Cazenave, P.A. (1990). All T15 Id-positive antibodies (but not the majority of VHT15+ antibodies) are produced by peritoneal CD5+ B lymphocytes. Int. Immunol 2, 515-520.
Max, E. E. Immunoglobulins: Molecular Genetics. Paul W.E. Fundamental Immunology, 111-182. 1999. Lippincott-Raven. Ref Type: Generic
Mc Heyzer-Williams L.J. (2005). Antigen-specific memory B cell development. Annu. Rev. Immunol. 23, 487.
McCormack, W.T., Tjoelker, L.W., Carlson, L.M., Petryniak, B., Barth, C.F., Humphries, E.H., and Thompson, C.B. (1989). Chicken IgL gene rearrangement involves deletion of a circular episome and addition of single nonrandom nucleotides to both coding segments 1. Cell 56, 785-791.
McHeyzer-Williams, M.G. (2003). B cells as effectors. Curr. Opin. Immunol. 15, 354-361.
Mead, J.R., Irvine, S.A., and Ramji, D.P. (2002). Lipoprotein lipase: structure, function, regulation, and role in disease. J. Mol. Med. 80, 753-769.
122

6. References
Mebius, R.E., Miyamoto, T., Christensen, J., Domen, J., Cupedo, T., Weissman, I.L., and Akashi, K. (2001). The fetal liver counterpart of adult common lymphoid progenitors gives rise to all lymphoid lineages, CD45+CD4+CD3- cells, as well as macrophages. J. Immunol. 166, 6593-6601.
Mercolino, T.J., Arnold, L.W., and Haughton, G. (1986). Phosphatidyl choline is recognized by a series of Ly-1+ murine B cell lymphomas specific for erythrocyte membranes. J. Exp. Med. 163, 155-165.
Mercolino, T.J., Arnold, L.W., Hawkins, L.A., and Haughton, G. (1988). Normal mouse peritoneum contains a large population of Ly-1+ (CD5) B cells that recognize phosphatidyl choline. Relationship to cells that secrete hemolytic antibody specific for autologous erythrocytes. J. Exp. Med. 168, 687-698.
Miller, J., Selsing, E., and Storb, U. (1982). Structural alterations in J regions of mouse immunoglobulin lambda genes are associated with differential gene expression. Nature 295, 428-430.
Milne, C.D., Fleming, H.E., Zhang, Y., and Paige, C.J. (2004). Mechanisms of selection mediated by interleukin-7, the preBCR, and hemokinin-1 during B-cell development. Immunol Rev 197, 75-88.
Miyake, K., Medina, K., Ishihara, K., Kimoto, M., Auerbach, R., and Kincade, P.W. (1991). A VCAM-like adhesion molecule on murine bone marrow stromal cells mediates binding of lymphocyte precursors in culture 1. J. Cell Biol. 114, 557-565.
Mogensen, T.H. and Paludan, S.R. (2005). Reading the viral signature by Toll-like receptors and other pattern recognition receptors. J. Mol. Med. 83, 180-192.
Molina, H., Holers, V.M., Li, B., Fung, Y., Mariathasan, S., Goellner, J., Strauss-Schoenberger, J., Karr, R.W., and Chaplin, D.D. (1996). Markedly impaired humoral immune response in mice deficient in complement receptors 1 and 2. Proc. Natl. Acad. Sci. U. S. A 93, 3357-3361.
Mombaerts, P., Iacomini, J., Johnson, R.S., Herrup, K., Tonegawa, S., and Papaioannou, V.E. (1992). RAG-1-deficient mice have no mature B and T lymphocytes. Cell 68, 869-877.
Montecino-Rodriguez, E. and Dorshkind, K. (2002). Identification of B/macrophage progenitors in adult bone marrow. Semin. Immunol 14, 371-376.
Morris, D.L. and Rothstein, T.L. (1993). Abnormal transcription factor induction through the surface immunoglobulin M receptor of B-1 lymphocytes. J. Exp. Med. 177, 857-861.
Mostoslavsky, R., Alt, F.W., and Rajewsky, K. (2004). The lingering enigma of the allelic exclusion mechanism. Cell 118, 539-544.
Murasawa, M., Okada, S., Obata, S., Hatano, M., Moriya, H., and Tokuhisa, T. (2002). GL7 defines the cycling stage of pre-B cells in murine bone marrow. Eur. J. Immunol 32, 291-298.
Nemazee, D., Martensson, A., and Verkoczy, L. (2002). Haplotype exclusion and receptor editing: irreconcilable differences? Semin. Immunol 14, 191-198.
Nemazee, D.A. and Burki, K. (1989). Clonal deletion of B lymphocytes in a transgenic mouse bearing anti-MHC class I antibody genes. Nature 337, 562-566.
Neuberger, M.S., Di Noia, J.M., Beale, R.C., Williams, G.T., Yang, Z., and Rada, C. (2005). Somatic hypermutation at A.T pairs: polymerase error versus dUTP incorporation. Nat. Rev Immunol 5, 171-178.
Nitschke, L., Carsetti, R., Ocker, B., Kohler, G., and Lamers, M.C. (1997). CD22 is a negative regulator of B-cell receptor signalling. Curr. Biol. 7, 133-143.
Norsworthy, P.J., Taylor, P.R., Walport, M.J., and Botto, M. (1999). Cloning of the mouse homolog of the 126-kDa human C1q/MBL/SP-A receptor, C1qR(p). Mamm. Genome 10, 789-793.
Norvell, A., Mandik, L., and Monroe, J.G. (1995). Engagement of the antigen-receptor on immature murine B lymphocytes results in death by apoptosis. J. Immunol 154, 4404-4413.
O'Keefe, T.L., Williams, G.T., Davies, S.L., and Neuberger, M.S. (1996). Hyperresponsive B cells in CD22-deficient mice. Science 274, 798-801.
123

6. References
Ochsenbein, A.F., Fehr, T., Lutz, C., Suter, M., Brombacher, F., Hengartner, H., and Zinkernagel, R.M. (1999). Control of early viral and bacterial distribution and disease by natural antibodies. Science 286, 2156-2159.
Ohmura, K., Kawamoto, H., Fujimoto, S., Ozaki, S., Nakao, K., and Katsura, Y. (1999). Emergence of T, B, and myeloid lineage-committed as well as multipotent hemopoietic progenitors in the aorta-gonad-mesonephros region of day 10 fetuses of the mouse. J. Immunol. 163, 4788-4795.
Ohnishi, K. and Melchers, F. (2003). The nonimmunoglobulin portion of lambda5 mediates cell-autonomous pre-B cell receptor signaling. Nat. Immunol 4, 849-856.
Okamoto, M., Murakami, M., Shimizu, A., Ozaki, S., Tsubata, T., Kumagai, S., and Honjo, T. (1992). A transgenic model of autoimmune hemolytic anemia. J. Exp. Med. 175, 71-79.
Oltz, E.M., Yancopoulos, G.D., Morrow, M.A., Rolink, A., Lee, G., Wong, F., Kaplan, K., Gillis, S., Melchers, F., and Alt, F.W. (1992). A novel regulatory myosin light chain gene distinguishes pre-B cell subsets and is IL-7 inducible. EMBO J. 11, 2759-2767.
Ostermann, G., Weber, K.S., Zernecke, A., Schroder, A., and Weber, C. (2002). JAM-1 is a ligand of the beta(2) integrin LFA-1 involved in transendothelial migration of leukocytes 1. Nat. Immunol 3, 151-158.
Otipoby, K.L., Andersson, K.B., Draves, K.E., Klaus, S.J., Farr, A.G., Kerner, J.D., Perlmutter, R.M., Law, C.L., and Clark, E.A. (1996). CD22 regulates thymus-independent responses and the lifespan of B cells. Nature 384, 634-637.
Ovary, Z. (1982). Recent insight into class-specific properties of murine immunoglobulins obtained with the help of monoclonal antibodies. Int. Arch. Allergy Appl. Immunol 69, 385-392.
Pan, C., Baumgarth, N., and Parnes, J.R. (1999). CD72-deficient mice reveal nonredundant roles of CD72 in B cell development and activation. Immunity. 11, 495-506.
Papayannopoulou, T. and Craddock, C. (1997). Homing and trafficking of hemopoietic progenitor cells 1. Acta Haematol. 97, 97-104.
Pappu, R., Cheng, A.M., Li, B., Gong, Q., Chiu, C., Griffin, N., White, M., Sleckman, B.P., and Chan, A.C. (1999). Requirement for B cell linker protein (BLNK) in B cell development. Science 286, 1949-1954.
Parker, D.C. (1993). The functions of antigen recognition in T cell-dependent B cell activation. Semin. Immunol 5, 413-420.
Pecquet, S.S., Ehrat, C., and Ernst, P.B. (1992). Enhancement of mucosal antibody responses to Salmonella typhimurium and the microbial hapten phosphorylcholine in mice with X-linked immunodeficiency by B-cell precursors from the peritoneal cavity. Infect. Immun. 60, 503-509.
Pelanda, R., Braun, U., Hobeika, E., Nussenzweig, M.C., and Reth, M. (2002). B cell progenitors are arrested in maturation but have intact VDJ recombination in the absence of Ig-alpha and Ig-beta. J. Immunol 169, 865-872.
Petrenko, O., Beavis, A., Klaine, M., Kittappa, R., Godin, I., and Lemischka, I.R. (1999). The molecular characterization of the fetal stem cell marker AA4. Immunity. 10, 691-700.
Qian, Y., Santiago, C., Borrero, M., Tedder, T.F., and Clarke, S.H. (2001). Lupus-specific antiribonucleoprotein B cell tolerance in nonautoimmune mice is maintained by differentiation to B-1 and governed by B cell receptor signaling thresholds. J. Immunol. 166, 2412-2419.
Reid, R.R., Prodeus, A.P., Khan, W., Hsu, T., Rosen, F.S., and Carroll, M.C. (1997). Endotoxin shock in antibody-deficient mice: unraveling the role of natural antibody and complement in the clearance of lipopolysaccharide. J. Immunol 159, 970-975.
Reth, M. (2001). Oligomeric antigen receptors: a new view on signaling for the selection of lymphocytes. Trends Immunol. 22, 356-360.
Reth, M., Gehrmann, P., Petrac, E., and Wiese, P. (1986). A novel VH to VHDJH joining mechanism in heavy-chain-negative (null) pre-B cells results in heavy-chain production. Nature 322, 840-842.
124

6. References
Rickert, R.C., Rajewsky, K., and Roes, J. (1995). Impairment of T-cell-dependent B-cell responses and B-1 cell development in CD19-deficient mice. Nature 376, 352-355.
Rickert, R.C., Roes, J., and Rajewsky, K. (1997). B lymphocyte-specific, Cre-mediated mutagenesis in mice. Nucleic Acids Res. 25, 1317-1318.
Rolink, A., Kudo, A., Karasuyama, H., Kikuchi, Y., and Melchers, F. (1991). Long-term proliferating early pre B cell lines and clones with the potential to develop to surface Ig-positive, mitogen reactive B cells in vitro and in vivo. EMBO J. 10, 327-336.
Rolink, A. and Melchers, F. (1991). Molecular and cellular origins of B lymphocyte diversity. Cell 66, 1081-1094.
Rolink, A.G., ten Boekel, E., Yamagami, T., Ceredig, R., Andersson, J., and Melchers, F. (1999). B cell development in the mouse from early progenitors to mature B cells. Immunol. Lett. 68, 89-93.
Rolink, A.G., Tschopp, J., Schneider, P., and Melchers, F. (2002). BAFF is a survival and maturation factor for mouse B cells. Eur. J. Immunol. 32, 2004-2010.
Roschenthaler, F., Hameister, H., and Zachau, H.G. (2000). The 5' part of the mouse immunoglobulin kappa locus as a continuously cloned structure. Eur. J. Immunol. 30, 3349-3354.
Ross, D.A., Wilson, M.R., Miller, N.W., Clem, L.W., and Warr, G.W. (1998). Evolutionary variation of immunoglobulin mu heavy chain RNA processing pathways: origins, effects, and implications. Immunol Rev 166, 143-151.
Rothstein, T.L. (2002). Cutting edge commentary: two B-1 or not to be one. J. Immunol 168, 4257-4261.
Rothstein, T.L., Fischer, G.M., Tanguay, D.A., Pavlovic, S., Colarusso, T.P., Gerstein, R.M., Clarke, S.H., and Chiles, T.C. (2000). STAT3 activation, chemokine receptor expression, and cyclin-Cdk function in B-1 cells. Curr. Top. Microbiol. Immunol 252, 121-130.
Rothstein, T.L. and Kolber, D.L. (1988a). Anti-Ig antibody inhibits the phorbol ester-induced stimulation of peritoneal B cells. J. Immunol 141, 4089-4093.
Rothstein, T.L. and Kolber, D.L. (1988b). Peritoneal B cells respond to phorbol esters in the absence of co-mitogen. J. Immunol 140, 2880-2885.
Rothstein, T.L., Kolber, D.L., Murphy, T.P., and Cohen, D.P. (1991). Induction of phorbol ester responsiveness in conventional B cells after activation via surface Ig. J. Immunol 147, 3728-3735.
Sanchez, P., Marche, P.N., Rueff-Juy, D., and Cazenave, P.A. (1990). Mouse V lambda x gene sequence generates no junctional diversity and is conserved in mammalian species. J. Immunol. 144, 2816-2820.
Sandel, P.C. and Monroe, J.G. (1999). Negative selection of immature B cells by receptor editing or deletion is determined by site of antigen encounter 1. Immunity 10, 289-299.
Sato, S., Miller, A.S., Inaoki, M., Bock, C.B., Jansen, P.J., Tang, M.L., and Tedder, T.F. (1996a). CD22 is both a positive and negative regulator of B lymphocyte antigen receptor signal transduction: altered signaling in CD22-deficient mice. Immunity. 5, 551-562.
Sato, S., Ono, N., Steeber, D.A., Pisetsky, D.S., and Tedder, T.F. (1996b). CD19 regulates B lymphocyte signaling thresholds critical for the development of B-1 lineage cells and autoimmunity. J. Immunol 157, 4371-4378.
Schlegel, P.G., Vaysburd, M., Chen, Y., Butcher, E.C., and Chao, N.J. (1995). Inhibition of T cell costimulation by VCAM-1 prevents murine graft-versus-host disease across minor histocompatibility barriers. J. Immunol 155, 3856-3865.
Schlesinger, M. (1965). Spontaneous occurrence of autoantibodies cytotoxic to thymus cells in the sera of mice of the 129 strain. Nature 207, 429-430.
Schlissel, M.S. (2004). Regulation of activation and recombination of the murine Igkappa locus. Immunological Reviews 200, 215-223.
125

6. References
Schmidt, K.N., Hsu, C.W., Griffin, C.T., Goodnow, C.C., and Cyster, J.G. (1998). Spontaneous follicular exclusion of SHP1-deficient B cells is conditional on the presence of competitor wild-type B cells. J. Exp. Med. 187, 929-937.
Schweitzer, K.M., Drager, A.M., van, d., V, Thijsen, S.F., Zevenbergen, A., Theijsmeijer, A.P., van der Schoot, C.E., and Langenhuijsen, M.M. (1996). Constitutive expression of E-selectin and vascular cell adhesion molecule-1 on endothelial cells of hematopoietic tissues 1. Am. J. Pathol. 148, 165-175.
Selsing, E., Miller, J., Wilson, R., and Storb, U. (1982). Evolution of mouse immunoglobulin lambda genes. Proc. Natl. Acad. Sci. U. S A 79, 4681-4685.
Shaw, P.X., Horkko, S., Chang, M.K., Curtiss, L.K., Palinski, W., Silverman, G.J., and Witztum, J.L. (2000). Natural antibodies with the T15 idiotype may act in atherosclerosis, apoptotic clearance, and protective immunity. J. Clin. Invest 105, 1731-1740.
Shinkai, Y., Rathbun, G., Lam, K.P., Oltz, E.M., Stewart, V., Mendelsohn, M., Charron, J., Datta, M., Young, F., Stall, A.M., and . (1992). RAG-2-deficient mice lack mature lymphocytes owing to inability to initiate V(D)J rearrangement. Cell 68, 855-867.
Solvason, N., Lehuen, A., and Kearney, J.F. (1991). An embryonic source of Ly1 but not conventional B cells. Int. Immunol 3, 543-550.
Spanopoulou, E., Roman, C.A., Corcoran, L.M., Schlissel, M.S., Silver, D.P., Nemazee, D., Nussenzweig, M.C., Shinton, S.A., Hardy, R.R., and Baltimore, D. (1994). Functional immunoglobulin transgenes guide ordered B-cell differentiation in Rag-1-deficient mice. Genes Dev. 8, 1030-1042.
Su, S.D., Ward, M.M., Apicella, M.A., and Ward, R.E. (1991). The primary B cell response to the O/core region of bacterial lipopolysaccharide is restricted to the Ly-1 lineage. J. Immunol 146, 327-331.
Su, T.T., Guo, B., Wei, B., Braun, J., and Rawlings, D.J. (2004). Signaling in transitional type 2 B cells is critical for peripheral B-cell development. Immunol Rev 197, 161-178.
Suzuki, H., Terauchi, Y., Fujiwara, M., Aizawa, S., Yazaki, Y., Kadowaki, T., and Koyasu, S. (1999). Xid-like immunodeficiency in mice with disruption of the p85alpha subunit of phosphoinositide 3-kinase. Science 283, 390-392.
Taki, S., Schmitt, M., Tarlinton, D., Forster, I., and Rajewsky, K. (1992). T cell-dependent antibody production by Ly-1 B cells. Ann. N. Y. Acad. Sci. 651, 328-335.
Tarakhovsky, A., Turner, M., Schaal, S., Mee, P.J., Duddy, L.P., Rajewsky, K., and Tybulewicz, V.L. (1995). Defective antigen receptor-mediated proliferation of B and T cells in the absence of Vav. Nature 374, 467-470.
Taylor, P.R., Gordon, S., and Martinez-Pomares, L. (2005). The mannose receptor: linking homeostasis and immunity through sugar recognition. Trends Immunol 26, 104-110.
Tedford, K., Nitschke, L., Girkontaite, I., Charlesworth, A., Chan, G., Sakk, V., Barbacid, M., and Fischer, K.D. (2001). Compensation between Vav-1 and Vav-2 in B cell development and antigen receptor signaling. Nat. Immunol. 2, 548-555.
Terry, R.W., Kwee, L., Baldwin, H.S., and Labow, M.A. (1997). Cre-mediated generation of a VCAM-1 null allele in transgenic mice 1. Transgenic Res. 6, 349-356.
Tonegawa, S., Brack, C., Hozumi, N., and Pirrotta, V. (1978a). Organization of immunoglobulin genes. Cold Spring Harb. Symp. Quant. Biol. 42 Pt 2, 921-931.
Tonegawa, S., Maxam, A.M., Tizard, R., Bernard, O., and Gilbert, W. (1978b). Sequence of a mouse germ-line gene for a variable region of an immunoglobulin light chain. Proc. Natl. Acad. Sci. U. S A 75, 1485-1489.
Tumang, J.R., Hastings, W.D., Bai, C., and Rothstein, T.L. (2004). Peritoneal and splenic B-1 cells are separable by phenotypic, functional, and transcriptomic characteristics. Eur. J. Immunol 34, 2158-2167.
Verthelyi, D. (2001). Sex hormones as immunomodulators in health and disease. Int. Immunopharmacol. 1, 983-993.
126

6. References
Viau, M. and Zouali, M. (2005). B-lymphocytes, innate immunity, and autoimmunity. Clin. Immunol 114, 17-26.
Vieira, P. and Rajewsky, K. (1988). The half-lives of serum immunoglobulins in adult mice 2. Eur. J. Immunol 18, 313-316.
Wang, D., Feng, J., Wen, R., Marine, J.C., Sangster, M.Y., Parganas, E., Hoffmeyer, A., Jackson, C.W., Cleveland, J.L., Murray, P.J., and Ihle, J.N. (2000). Phospholipase Cgamma2 is essential in the functions of B cell and several Fc receptors. Immunity. 13, 25-35.
Wang, H. and Clarke, S.H. (2004a). Positive selection focuses the VH12 B-cell repertoire towards a single B1 specificity with survival function. Immunol Rev 197, 51-59.
Wang, H. and Clarke, S.H. (2004b). Regulation of B-cell development by antibody specificity. Curr. Opin. Immunol. 16, 246-250.
Wang, J.H., Avitahl, N., Cariappa, A., Friedrich, C., Ikeda, T., Renold, A., Andrikopoulos, K., Liang, L., Pillai, S., Morgan, B.A., and Georgopoulos, K. (1998). Aiolos regulates B cell activation and maturation to effector state. Immunity. 9, 543-553.
Wasserman, R., Li, Y.S., Shinton, S.A., Carmack, C.E., Manser, T., Wiest, D.L., Hayakawa, K., and Hardy, R.R. (1998). A novel mechanism for B cell repertoire maturation based on response by B cell precursors to pre-B receptor assembly. J. Exp. Med. 187, 259-264.
Weiss, S., Meyer, J., and Wabl, M.R. (1985). V lambda 2 rearranges with all functional J lambda segments in the mouse. Eur. J. Immunol 15, 765-768.
Weiss, S. and Wu, G.E. (1987). Somatic point mutations in unrearranged immunoglobulin gene segments encoding the variable region of lambda light chains. EMBO J. 6, 927-932.
Wellicome, S.M., Kapahi, P., Mason, J.C., Lebranchu, Y., Yarwood, H., and Haskard, D.O. (1993). Detection of a circulating form of vascular cell adhesion molecule-1: raised levels in rheumatoid arthritis and systemic lupus erythematosus 1. Clin. Exp. Immunol 92, 412-418.
Wetzel, G.D. (1989). Interleukin 5 regulation of peritoneal Ly-1 B lymphocyte proliferation, differentiation and autoantibody secretion. Eur. J. Immunol 19, 1701-1707.
Winkler, T.H., Rolink, A., Melchers, F., and Karasuyama, H. (1995). Precursor B cells of mouse bone marrow express two different complexes with the surrogate light chain on the surface. Eur. J. Immunol. 25, 446-450.
Wognum, A.W., Eaves, A.C., and Thomas, T.E. (2003). Identification and isolation of hematopoietic stem cells. Arch. Med. Res. 34, 461-475.
Wong, P. and Pamer, E.G. (2003). CD8 T cell responses to infectious pathogens. Annu. Rev Immunol 21, 29-70.
Woodland, D.L. and Dutton, R.W. (2003). Heterogeneity of CD4(+) and CD8(+) T cells. Curr. Opin. Immunol 15, 336-342.
Woodland, R.T. and Schmidt, M.R. (2005). Homeostatic proliferation of B cells. Semin. Immunol 17, 209-217.
Wortis, H.H., Teutsch, M., Higer, M., Zheng, J., and Parker, D.C. (1995). B-cell activation by crosslinking of surface IgM or ligation of CD40 involves alternative signal pathways and results in different B-cell phenotypes. Proc. Natl. Acad. Sci. U. S A 92, 3348-3352.
Xia, Y.F., Liu, L.P., Zhong, C.P., and Geng, J.G. (2001). NF-kappaB activation for constitutive expression of VCAM-1 and ICAM-1 on B lymphocytes and plasma cells. Biochem. Biophys. Res. Commun. 289, 851-856.
Xu, H., Li, H., Suri-Payer, E., Hardy, R.R., and Weigert, M. (1998). Regulation of anti-DNA B cells in recombination-activating gene-deficient mice. J. Exp. Med. 188, 1247-1254.
Yother, J., Forman, C., Gray, B.M., and Briles, D.E. (1982). Protection of mice from infection with Streptococcus pneumoniae by anti-phosphocholine antibody. Infect. Immun. 36, 184-188.
127

6. References
Youinou, P., Mackenzie, L., Katsikis, P., Merdrignac, G., Isenberg, D.A., Tuaillon, N., Lamour, A., Le Goff, P., Jouquan, J., Drogou, A., and . (1990). The relationship between CD5-expressing B lymphocytes and serologic abnormalities in rheumatoid arthritis patients and their relatives 1. Arthritis Rheum. 33, 339-348.
Young, W.W., Jr., MacDonald, E.M., Nowinski, R.C., and Hakomori, S.I. (1979). Production of monoclonal antibodies specific for two distinct steric portions of the glycolipid ganglio-N-triosylceramide (asialo GM2). J. Exp. Med. 150, 1008-1019.
Zaitseva, M.B., Mojcik, C.F., Salomon, D.R., Shevach, E.M., and Golding, H. (1998). Co-ligation of alpha4beta1 integrin and TCR rescues human thymocytes from steroid-induced apoptosis. Int. Immunol 10, 1551-1561.
128

7 Abbreviations AID activation-induced cytidine deaminase
Ab antibody
Ag antigen
AHA autoimmune hemolytic anemia
ATA anti-thymocyte antibody
BCR B cell receptor
BM bone marrow
bp base pairs
BrMRBC bromelain treated mouse red blood cells
C constant region
CD cluster of differentiation
cDNA complementary DNA
CDR complementarity determining region
CLP common lymphoid precursor
CMP common myeloid precursor
CSR class switch recombination
D diversity
DC dendritic cell
DNA deoxyribonucleic acid
DSB double strand break
DTT dithiothreitol
ELISA enzyme-linked immunosorbent assay
EST expressed sequence tag
FACS fluorescence-activated cell sorter
FCS fetal calf serum
FL fetal liver
FO follicular
FR framework
h hour(s)
H chain heavy chain

7. Abbreviations
HSC hematopoietic stem cell
Ig immunoglobulin
IgH immunoglobulin heavy chain
IL Interleukin
IL7R Interleukin 7 receptor
J joining
kb kilobases
L chain light chain
LDL low-density lipoprotein
LPS lipopolysaccharide
Mb megabases
MHC major histocompatibility complex
MPP mulitpotent progenitor
MRBC mouse red blood cell
MZ marginal zone
N nucleotide non-templated nucleotide
NK cell natural killer cell
NP Nitrophenol
P nucleotide palindromic nucleotide
PALS periarterial lymphatic sheet
PC phosphorylcholine
PCR polymerase chain reaction
Pec peritoneal cavity or peritoneum
PtC phosphatidyl choline
Rag recombination activating gene
RNA ribonucleic acid
RS sequence recombination signal sequence
RT reverse transcription
RT room temperature
SL surrogate light chain
SLE systemic lupus erythematousus
130

7. Abbreviations
Sp spleen or splenic
SPF specific pathogen free
TCR T cell receptor
TD T cell dependent
TdT terminal deoxynucleotidyl transferase
TI T cell independent
TNP Trinitrophenol
V variable
131

Danksagung Die vorliegende Arbeit wurde an der Gesellschaft für Biotechnologische Forschung (GBF), Braunschweig, in der Arbeitsgruppe Molekulare Immunologie im Rahmen des Graduiertenprogramms „Molekülkomplexe von biomedizinischer Relevanz“ angefertigt. Ein besonderer Dank gilt dem Land Niedersachsen für die finanzielle Förderung der Arbeit durch ein Georg-Christoph-Lichtenberg Stipendium. Ich danke dem Mentor dieser Arbeit, Herrn Professor Dr. Jürgen Wehland, für die Betreuung des Promotionsverfahrens. Ein weiterer Dank geht an Herrn Professor Dr. Stefan Dübel für die Übernahme des Korreferats. Herrn Professor Dr. Norbert Käufer danke ich für seine Bereitschaft, als Prüfer für die Disputation zur Verfügung zu stehen. Ein besonderer Dank gilt Herrn Dr. Siegfried Weiss, in dessen Arbeitsgruppe diese Arbeit entstand, für den Rückhalt, die Betreuung und seine stete Diskussionsbereitschaft. Allen ehemaligen und derzeitigen Mitarbeitern der Arbeitsgruppe Molekulare Immunologie möchte ich für ihre ständige Hilfsbereitschaft und das sonnige Arbeitsklima danken. Besonderer Dank gilt Susanne zur Lage und Regina Lesch für die zuverlässige und professionelle Unterstützung sowie Michael Probst-Kepper für effiziente pep talks und Denkanstöße. Ein weiterer Dank geht an alle alten und neuen Mitglieder der B-Zellgruppe - Tanja Kramer, Martina Krey und Bishnudeo Roy - für das tolle Arbeitsumfeld und die nicht endende Hilfsbereitschaft. Ein spezieller Dank auch an Karsten Kretschmer, der mein Interesse für die B-Zellen durch seine Begeisterung angefacht hat und mir eine exzellente Einarbeitung zuteil werden ließ. Einen ganz besonders herzlicher Dank möchte Sandra Düber widmen, auf die man sich immer verlassen kann und die ein Fels in der Brandung ist. Bei Frau Dr. Elisabeth Kremmer von der GSF in München möchte ich mich für die erfolgreiche und nette Zusammenarbeit bedanken. Weiterhin danke ich Lothar Gröbe und Maria Höxter für die Unterstützung bei den Sortierexperimenten. Petra Beyer danke ich stellvertretend für das gesamte Team des Tierhauses für gute Zusammenarbeit und die Betreuung bei den Tierexperimenten. Maren, Melanie und Steffi danke ich für den „Sequenzierservice“. Ein großer Dank geht an Andrea, Anika, Chris und Nelson, deren Freundschaft von großer Bedeutung für mich ist – nicht nur, weil ich viele nette Stunden mit ihnen verbringen durfte. Ein herzliches Dankeschön auch an Ingo und Gisela Reis für die stetige Motivation und die Unterstützung während meiner Zeit als Doktorandin. Einen besonderen und mir am Herzen liegenden Dank widme ich meinen Eltern und meiner Schwester Dorte - dafür, dass Ihr immer für mich da (gewesen) seid, mit mir gefeiert habt, wenn’s was zu feiern gab und mir den Rücken gestärkt habt, wenn’s nichts zu feiern gab. Thank you, family! Mein wärmster und tiefster Dank gilt Stefan. Danke für deine Geduld, deinen Glauben an mich und deine Entschlossenheit, das launische Meer Doktorarbeit gemeinsam mit mir zu überqueren – Seekrankheit und Untiefen inbegriffen. Wir sind angekommen.