influence of surface roughness on the initial formation of
TRANSCRIPT

This work is licensed under a
Creative Commons Attribution-NonCommercial-NoDerivatives 4.0 International licence
Newcastle University ePrints - eprint.ncl.ac.uk
Ammar Y, Swailes DC, Bridgens BN, Chen J. Influence of surface roughness on
the initial formation of biofilm. Surface and Coatings Technology 2015, 284,
410-416.
Copyright:
© 2016. This manuscript version is made available under the CC-BY-NC-ND 4.0 license
DOI link to article:
http://dx.doi.org/10.1016/j.surfcoat.2015.07.062
Date deposited:
12/02/2016
Embargo release date:
31 July 2016

Manuscript Influence of surface roughness on initial formation of biofilm
Yasmine Ammar a, David Swailes a, Ben Bridgens b , Jinju Chen a (*) a: School of Mechanical and Systems Engineering, Stephenson Building, Newcastle University, NE1 7RU, UK b: School of Civil Engineering and Geosciences, Cassie Building, Newcastle University, NE1 7RU, UK * Corresponding author: [email protected] Abstract: Surface roughness is an important factor affecting cellular attachment to surfaces prior to biofilm formation. The presence of nanoscale asperities reduces the physicochemical potential barrier encountered by a bacterial cell when it approaches the surface. This work studies the initial bacterial deposition prior to biofilm formation for wastewater treatment. The objective of this work is to model how surface roughness of the substrate and appendages of the bacterial would affect bacterial adhesion. In this study, bacteria are treated as inert particles that attach to surfaces according to the extended Derjaguin-Landau-Verwey-Overbeek (DLVO) theory. The surface roughness is modelled by reconstructing the surface topography using statistical parameters derived from Atomic Force Microscopy (AFM) roughness analyses. The model is validated by comparing deposition measured in a parallel flow chamber to the Computational Fluid Dynamics (CFD) results for different ionic strengths and compared with a simple roughness model. It was also validated against the experimental data. Based on CFD simulations, the relationship between the deposition rate and the nanoscale surface roughness has been established. This will be very useful to guide the surface design for the materials surface of the bed in wastewater treatment.
1. Introduction Bacteria-surface interactions have been studied thoroughly over the last ten years. Bacteria move towards a material surface through the effects of physical forces such as Brownian diffusion, gravitational settling and hydrodynamic forces or through their own motility [1]. But the short range effects of the electrostatic interaction (always repulsive), Acid-Base (AB) Lewis interaction (accounting for hydrophobic effect, either repulsive or attractive) and van der Waal interaction (always attractive) forces effectively determine whether bacterial adhesion takes place or bacteria are repulsed away from the surface [2]. These conditions are intrinsically linked to the properties of the material surface such as the Hamaker constant (for van der Waal interactions, depending on the chemical composition), the surface charge and the water contact angle (hydrophobicity) as described in the review by Katsikogianni and Missirlis [3]. This suggests that careful material selection is crucial so that the conditions are favourable for initial formation of bacterial biofilms for waste water treatment, and that choice of materials

and surface finishes can be used to control the location of biofilms. Matsumoto et al. [4] recommended the choice of carbon fibre as a support material for wastewater treatment biofilm for four pure strains (Cytophagahutchinsonii, Alcaligenes faecalis, Bacillus subtilis and Escherichia coli) and justified this choice based on lower negative charge and higher Hamaker constant than aromatic polyamide, preoxidized polyacrylonitrile, and polyethylene. Bunt et al. [5] showed that the total surface interaction barrier also depends on the water ionic strength and pH of waste water. The effect of surface roughness on the long-term development of biofilms has been investigated by Alnnasouri et al. [6]. They studied the biofilm response to rotation speed changes in lab-scale rotating biological contactors and concluded that surface irregularities introduced on the biofilm bed generally improved adhesion as well as increasing hydraulic losses. More recently, the work of Katsikogianni and Missirlis [3] suggested that bacteria preferentially adhere to surface irregularities whose typical sizes are of the order of their own diameters. Under repulsive conditions, the presence of microscopic superficial appendages, often referred to as pili, allows bacteria to overcome the energy barrier and reach the surface as shown experimentally by Sjollema et al. [7] who suggested that appendages (if present) were likely to be one of the most important factors in explaining adhesion. Here the effect of bacterial appendages is taken into account by modelling bacteria as rough spheres i.e. reconstructing the surface appendage topography. The interfacial interactions are modelled by the extended DLVO theory which takes into account the Lewis AB interactions and the roughness is modelled by reconstructing the surface topology using statistical parameters derived from Atomic Force Microscopy (AFM) roughness analyses taking into account both the peaks and the valleys created by the surface roughness. This technique, referred to as Surface Element Integration (SEI), was first proposed by Hoek et al [8] to compute the DLVO interactions between the particles and the simulated surface. They showed that the repulsive interaction energy barrier between a colloidal particle and a rough surface was lower than the corresponding barrier for a smooth surface which suggested that the valleys created by the membrane surface roughness produced wells of low interaction potential in which particles may preferentially deposit. The aim of the present study is to develop a better understanding of bacterial adhesion to solid surface and to propose a deposition model able to capture the different physico-chemical processes while retaining computational efficiency. The calculation of the net interaction potential between a suspended bacterial cell and the rough surface is described in the next section.
2. Bacteria-surface DVLO interaction energy 2.1 Surface reconstruction
The surface reconstruction is based on statistical analysis of the surface roughness features (such as asperity number, size, spacing distance, and height) which can be obtained experimentally by AFM analysis of the surface. The same approach as in [8] was used in the present study i.e. the average asperity radius 𝑟𝑟𝑎𝑎, the Root-Mean-Square (RMS) asperity radius and the surface coverage Ω (ratio of rough surface area over flat surface area) were used to reconstruct the surface roughness which was modelled by a distribution of hemispherical peaks and valleys of different radii. The peak and valley radii were initially represented by a normal distribution with a mean of zero and a standard deviation (square root of variance) of one for a given number of asperities. The standard deviation was then adjusted until the difference between the simulated and the measured surface coverage values was minimised. The asperities were then placed randomly on a flat plate according to a uniform distribution.
2

However, it is worth noting that the results cannot be exact due to the limited amount of parameters chosen to represent the surface morphology. In particular, AFM analysis performed in [8] showed that the measured roughness was heterogeneous in shape while they were modelled as identical shape. For more details about the surface reconstruction method, see [8].
2.1.1 Surface element integration
The SEI technique calculates the net interaction potential between a bacterial cell and the substrate within its projected area by integrating the interaction energy per unit area over the reconstructed surface. The bacterial cell travelling to the surface and located a vertical distance D from the mean plane is represented as a sphere of radius 𝑟𝑟𝑝𝑝 surrounding by appendages of maximum length 𝐿𝐿𝑎𝑎𝑝𝑝 (cf. Figure 1). The bacterial cell is assumed to have an apparent radius 𝑟𝑟𝑠𝑠 = 𝑟𝑟𝑝𝑝 + 𝐿𝐿𝑎𝑎𝑝𝑝. The integration was performed in a cylindrical coordinate system with origin located at the centre of the spherical bacterial cell. In this frame of reference, the expression for the net interaction potential is, according to the Derjaguin’s theory [9]: 𝑈𝑈(𝐷𝐷) = ∫ ∫ 𝑆𝑆𝑐𝑐(ℎ)𝜙𝜙(ℎ)𝑟𝑟𝑟𝑟𝑠𝑠
0 𝑑𝑑𝑟𝑟𝑑𝑑𝑑𝑑2𝜋𝜋0 (1)
with
𝑆𝑆𝑐𝑐(ℎ) = 1 𝑖𝑖𝑖𝑖 𝑡𝑡ℎ𝑒𝑒𝑟𝑟𝑒𝑒 𝑒𝑒𝑒𝑒𝑖𝑖𝑒𝑒𝑡𝑡𝑒𝑒 𝑎𝑎𝑎𝑎 𝑎𝑎𝑎𝑎𝑎𝑎𝑒𝑒𝑎𝑎𝑑𝑑𝑎𝑎𝑎𝑎𝑒𝑒0 𝑖𝑖𝑖𝑖 𝑡𝑡ℎ𝑒𝑒𝑟𝑟𝑒𝑒 𝑖𝑖𝑒𝑒 𝑎𝑎𝑛𝑛 𝑎𝑎𝑎𝑎𝑎𝑎𝑒𝑒𝑎𝑎𝑑𝑑𝑎𝑎𝑎𝑎𝑒𝑒
𝑆𝑆𝑐𝑐(ℎ) depends on the appendage number density at the bacterial cell surface. 𝜙𝜙(ℎ) is the interaction potential per unit area, separated by the vertical distance h. Here h represents the vertical distance between a bacterial cell surface element of area 𝑟𝑟𝑑𝑑𝑟𝑟𝑑𝑑𝑑𝑑 and a point on the rough surface directly below it. Note that Equation (1) assumes that appendage length is much greater than the electrostatic Debye length in which case the interaction between bacterial cell surface elements devoid of appendage and the rough surface can be neglected. The interaction potential per unit area 𝜙𝜙(ℎ) is given by the sum of the unretarded Lifshitz-van der Waals (LW), Lewis Acid-Base (AB) and the electrostatic (EL) potentials according to the extended DVLO theory [10].
The evaluation of the integral given by Equation (1) requires that the vertical distance h is expressed as a function of θ and 𝑟𝑟. The latter depends on whether the surface area directly below the bacterial cell presents valley, peak or no asperity as described in [8]. The interaction potential per unit area is calculated for each surface element of the rough surface which intersects with the projected area of the bacterial cell.
The integral given by Equation 1 is computed numerically which requires discretising the surface of the sphere encompassing the bacterial cell and the appendages. The surface element is discretised so that the difference between the differential surface area 𝑟𝑟𝑑𝑑𝑟𝑟𝑑𝑑𝑑𝑑 and the surface area of the appendage tip in interaction with the rough surface (assumed to be a hemisphere) is minimised.
3

The appendages are randomly spaced on the bacterial cell surface: more precisely, for each differential surface element, a random number χ is generated from a uniform distribution 𝑈𝑈(0,1). χ is compared with the surface coverage Ω which is defined as the surface area covered by the appendages divided by the total surface area of the bacterial cell.
If χ > (1 − Ω), the discrete function Sc is set equal to 1 which means that the appendage exists directly below the surface element considered and the interaction potential per unit area is calculated.
The net interaction potential between the suspended cell and the rough surface is obtained by integrating the interaction potential per unit area over all the surface elements.
2.2 Material properties The adhesion of two hydrophilic strains was studied with a FEP (Teflon) substrate whose surface free energy properties are summarised in Table 1. The substrate was chosen as highly hydrophobic which suggests stronger interaction forces between the travelling bacterial cell and the surface than for hydrophilic surfaces as studied by Boks and others [11] and experimentally observed by Sjollema et al. [19] due to the non DVLO additional attractive interactions. This material selection insures favourable conditions for deposition as in the case of waste water treatment. The effect of the appendages on deposition was examined with reference to bacterial cell surface properties previously investigated by Sjollema et al. [7] who compared the adhesion rate of Streptococcussalivarius HB, characterized by the presence of proteinaceous surface appendages with lengths between 72 and 178 nm with that of S. salivarius HB-C12, a spontaneous mutant of S. salivarius HB, devoid of all surface appendages. Surface properties for bacterial cells with appendages (HB) and bacterial cells devoid of appendage (HB-C12) used in the calculations are also summarised in Table 1. The zeta potential values of the bacterial cells and the surfaces used in the simulations are given in Table 2. The appendage surface coverage Ω was varied from 5% to 20% and the appendage radius 𝑟𝑟𝑎𝑎𝑝𝑝 from 10 to 50 nm while their lengths remained constant and equal to 𝑟𝑟𝑠𝑠/5 (approximately equal to the average length ratio measured experimentally by Sjollema et al.). It is worth noting that the height of 𝜙𝜙(ℎ) decreases with 𝑟𝑟𝑎𝑎𝑝𝑝.
2.3 Net potential analysis Three rough surfaces were simulated using Matlab R2014a for the parameters given in Table 3. They represent three levels of roughness with the average asperity size ranging from 10.1 nm up to 47.0 nm which are representative of real surface morphology features measured by AFM. Figure 2 shows the change in net potential between the suspended 550 nm radius bacterial cell and the three surfaces as a function of the vertical distance from the wall. As expected the presence of roughness decreases the potential barrier height compared to a smooth surface i.e. devoid of asperities as well as shifting the location of the maximum potential barrier height towards larger vertical distances from the wall which suggests an increase in Interaction Force Boundary Layer (IFBL) thickness. The potential height significantly changes with the average size of the asperities on the rough surface. Higher asperity sizes lead to lower potential barrier and therefore more favourable to bacterial adhesion. FEP surface roughness has been measured by numerous studies over the last decades. Busscher et al. [12] suggested that a correlation between the hydrophobicity of the substrate and the roughness average size was not excluded for highly hydrophobic material (contact
4

angle greater than 100⁰). FEP substrate will therefore be associated to the statistical parameters of Surface 3 in the following as the latter surface presents the larger asperities. The effect of bacterial cell surface appendages on deposition was examined in terms of the appendage radius. Smaller appendage leads to lower net interaction energy barrier and therefore more deposition as shown in Figure 3. For a radius of 500 nm, the length of the appendage was 100 nm which means that if there is no appendage directly below the interacting wall, we can assume that there exists no other source of interaction with the substrate since the appendage length is larger than the IFBL layer where the interaction between surface and the bacterial cell takes place. As depicted in Figure 4, the presence of appendages decreases the height of the potential barrier due to their extremely small radii in comparison with the entire bacterial cell devoid of appendage but to a certain extent, increasing the number of appendages per unit area of the bacterial cell (or surface coverage) slightly increase the height of the potential barrier under repulsive conditions.
3. Deposition
3.1 Model The deposition of bacterial cells which interacts with a rough surface through an attractive-repulsive potential is equivalent to a convective diffusive process with a first-order surface reaction at the rough surface. The flux of bacteria depositing at the wall depends on the surface reaction rate coefficient 𝐾𝐾𝑑𝑑 which can be expressed as a function of the net interaction potential calculated according to the procedure detailed in the previous section. A complete description of the problem should account for surface interactions as well as convection, diffusion and gravitational settling. The concentration distribution in a fluid flowing over a surface is determined by a convection diffusion equation in an external force field derived from the net potential 𝜙𝜙 [13]:
𝜕𝜕𝜕𝜕𝜕𝜕𝜕𝜕
+ 𝜵𝜵. 𝐣𝐣 = 0 (2) with 𝐣𝐣 = −𝐷𝐷𝛁𝛁𝐶𝐶 − 𝐷𝐷𝜕𝜕
𝑘𝑘𝑘𝑘𝛁𝛁𝑈𝑈 + 𝐔𝐔𝐩𝐩𝐶𝐶 the bacterial flux toward the wall and 𝐷𝐷 = 𝑘𝑘𝑘𝑘
6𝜋𝜋𝜋𝜋𝑟𝑟𝑠𝑠 the bacterial cell
diffusion coefficient with 𝑘𝑘 the Boltzmann constant, 𝑇𝑇 the absolute temperature and 𝜇𝜇 the carrier fluid dynamic viscosity. U is the potential defined by Equation (1).
𝐔𝐔𝐩𝐩 = 𝐔𝐔𝐟𝐟 + 𝐕𝐕𝐒𝐒 + 𝐕𝐕𝐦𝐦 the bacterial cell velocity vector, 𝐕𝐕𝐦𝐦 the cell motility velocity and 𝐕𝐕𝐒𝐒 =
mp−mf𝐠𝐠6π𝑟𝑟𝑠𝑠µ
the Stokes settling velocity with mp is bacterial cell mass and mf the mass of displaced fluid .
For the present analysis, the region of potential interactions with the substrate is of the order of the Debye length (approximately equal to 3 nm). This narrow zone is often referred as to the Interaction Force Boundary Layer (IFBL). It is likely to be thin compared with the
diffusion boundary layer 𝛿𝛿𝐷𝐷 which is of the order of 𝑆𝑆𝑆𝑆−13𝛿𝛿𝜈𝜈 [14], 𝑆𝑆𝑆𝑆 being the Schmidt
number and 𝛿𝛿𝜈𝜈 the thickness of the viscous boundary layer.
5
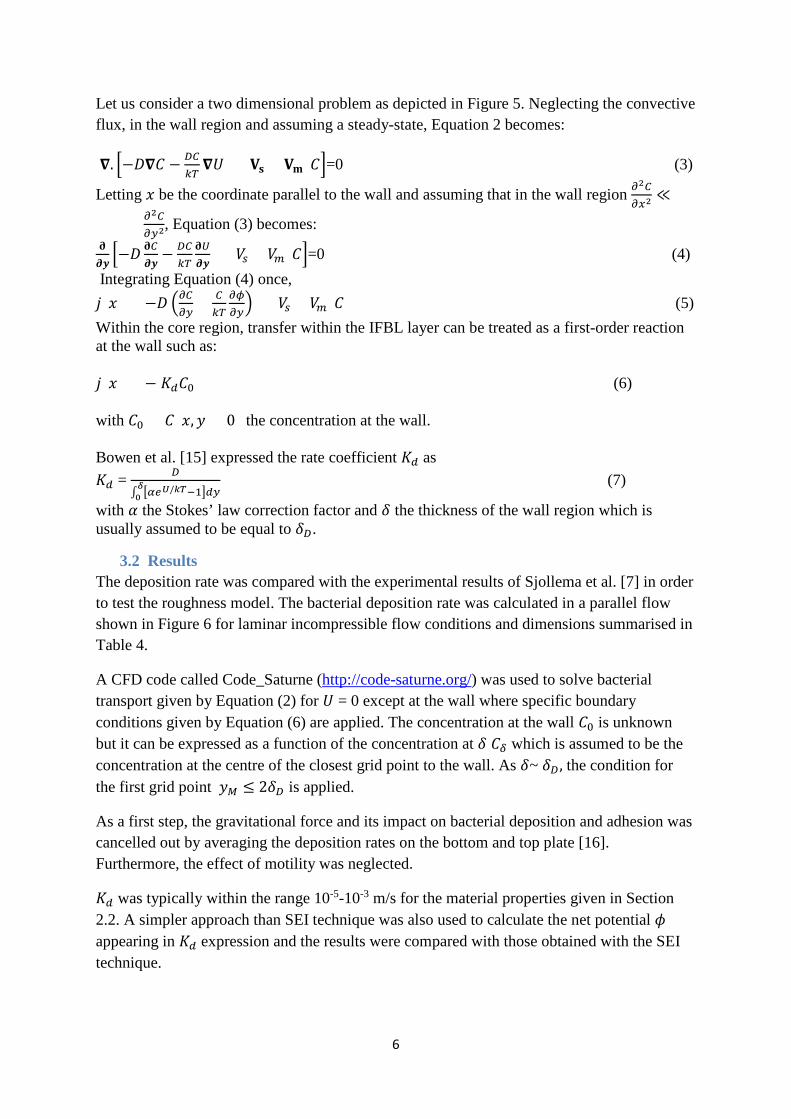
Let us consider a two dimensional problem as depicted in Figure 5. Neglecting the convective flux, in the wall region and assuming a steady-state, Equation 2 becomes:
𝛁𝛁. −𝐷𝐷𝛁𝛁𝐶𝐶 − 𝐷𝐷𝜕𝜕𝑘𝑘𝑘𝑘𝛁𝛁𝑈𝑈 + (𝐕𝐕𝐬𝐬 + 𝐕𝐕𝐦𝐦)𝐶𝐶=0 (3)
Letting 𝑒𝑒 be the coordinate parallel to the wall and assuming that in the wall region 𝜕𝜕2𝜕𝜕
𝜕𝜕𝑥𝑥2≪
𝜕𝜕2𝜕𝜕𝜕𝜕𝑦𝑦2
, Equation (3) becomes: 𝛛𝛛𝝏𝝏𝝏𝝏−𝐷𝐷 𝛛𝛛𝜕𝜕
𝝏𝝏𝝏𝝏− 𝐷𝐷𝜕𝜕
𝑘𝑘𝑘𝑘𝛛𝛛𝑈𝑈𝝏𝝏𝝏𝝏
+ (𝑉𝑉𝑠𝑠 + 𝑉𝑉𝑚𝑚)𝐶𝐶=0 (4) Integrating Equation (4) once, 𝑗𝑗(𝑒𝑒) = −𝐷𝐷 ∂𝜕𝜕
𝜕𝜕𝑦𝑦+ 𝜕𝜕
𝑘𝑘𝑘𝑘∂𝜙𝜙𝜕𝜕𝑦𝑦+ (𝑉𝑉𝑠𝑠 + 𝑉𝑉𝑚𝑚)𝐶𝐶 (5)
Within the core region, transfer within the IFBL layer can be treated as a first-order reaction at the wall such as: 𝑗𝑗(𝑒𝑒) = − 𝐾𝐾𝑑𝑑𝐶𝐶0 (6) with 𝐶𝐶0 = 𝐶𝐶(𝑒𝑒,𝑦𝑦 = 0) the concentration at the wall. Bowen et al. [15] expressed the rate coefficient 𝐾𝐾𝑑𝑑 as 𝐾𝐾𝑑𝑑 = 𝐷𝐷
∫ 𝛼𝛼𝑒𝑒𝑈𝑈/𝑘𝑘𝑘𝑘−1𝑑𝑑𝑦𝑦𝛿𝛿0
(7)
with 𝛼𝛼 the Stokes’ law correction factor and 𝛿𝛿 the thickness of the wall region which is usually assumed to be equal to 𝛿𝛿𝐷𝐷.
3.2 Results The deposition rate was compared with the experimental results of Sjollema et al. [7] in order to test the roughness model. The bacterial deposition rate was calculated in a parallel flow shown in Figure 6 for laminar incompressible flow conditions and dimensions summarised in Table 4.
A CFD code called Code_Saturne (http://code-saturne.org/) was used to solve bacterial transport given by Equation (2) for 𝑈𝑈 = 0 except at the wall where specific boundary conditions given by Equation (6) are applied. The concentration at the wall 𝐶𝐶0 is unknown but it can be expressed as a function of the concentration at 𝛿𝛿 𝐶𝐶𝛿𝛿 which is assumed to be the concentration at the centre of the closest grid point to the wall. As 𝛿𝛿~ 𝛿𝛿𝐷𝐷 , the condition for the first grid point 𝑦𝑦𝑀𝑀 ≤ 2𝛿𝛿𝐷𝐷 is applied.
As a first step, the gravitational force and its impact on bacterial deposition and adhesion was cancelled out by averaging the deposition rates on the bottom and top plate [16]. Furthermore, the effect of motility was neglected.
𝐾𝐾𝑑𝑑 was typically within the range 10-5-10-3 m/s for the material properties given in Section 2.2. A simpler approach than SEI technique was also used to calculate the net potential 𝜙𝜙 appearing in 𝐾𝐾𝑑𝑑 expression and the results were compared with those obtained with the SEI technique.
6

The simple model consists in assuming that the asperities are only composed of peaks, neglecting the presence of valleys. Their size is assumed to be given by a lognormal distribution whose mean µ and standard deviation θ (cf. Table 5) are estimated from the same statistical parameters as for SEI technique given in Table 3. The presence of appendages is taken into account by assuming extra attractive potential contribution due to Van Der Waals forces and non DVLO interaction forces between uniformly distributed appendages present at the bacterial cell surface and the substrate. For the simple model, the net interaction potential is given as:
𝑈𝑈 = (1 − Ω)𝑈𝑈+∑𝑈𝑈𝑎𝑎𝑠𝑠𝑝𝑝𝑒𝑒𝑟𝑟𝑎𝑎𝜕𝜕𝑎𝑎𝑒𝑒𝑠𝑠−𝑝𝑝𝑝𝑝𝑎𝑎𝜕𝜕𝑒𝑒 + ∑𝑈𝑈𝑎𝑎𝑝𝑝𝑝𝑝𝑒𝑒𝑎𝑎𝑑𝑑𝑎𝑎𝑎𝑎𝑒𝑒𝑠𝑠−𝑝𝑝𝑝𝑝𝑎𝑎𝜕𝜕𝑒𝑒 (8)
The first term on the Right Hand Side (RHS) is the net interaction potential with the substrate in absence of asperity. The second term on the RHS is the sum of the individual asperity contributions present on the rough substrate and the third term on the RHS is the sum of the appendage individual contributions.
SEI technique is more computationally expensive than the simple model as it reconstructs precisely all the roughness features (i.e. valleys, peaks) and computes the interaction potential between each discretised surface element and the suspended bacterial cell.
Figures 7 and 8 give the dimensionless deposition rate versus ionic strength for both modelling approaches. The dimensionless deposition rate was defined as:
J∗ = 𝑏𝑏 𝐽𝐽(𝑥𝑥)𝐷𝐷𝜕𝜕∞
(9)
With 𝑏𝑏 half the width of the chamber and 𝐶𝐶∞ the concentration at which the bacterial cells are injected in the flow chamber.
It is worth noting that the Debye length which affects the electrostatic component of the potential is inversely proportional to the ionic strength. In other words, the higher the ionic strength, the smaller the IFBL thickness and therefore the higher the deposition rate.
The introduction of microscopic superficial features in the net interaction potential calculations significantly improves the prediction of deposition rates in comparison with net potential calculation for smooth surfaces, even for a simple roughness model. Figures 7 and 8 show the dimensionless deposition rate versus the ionic strength. Simulation results were normalised by by the maximum deposition flux which is obtained for perfect sink conditions at the wall (𝐶𝐶0 = 0) for comparison with the experiments. For bacteria devoid of appendage, Figure 7 shows that the simple model gives as good results as SEI technique. Both approaches fail to predict deposition for low ionic strength (I=10mM) where deposition rate was underestimated and for high ionic strength (I=60mM) where deposition rate was overestimated in comparison with the experiments. For bacteria presenting appendages at their surfaces, the simple model gives a good prediction of the experimental data for high ionic strength but the use of the SEI technique appears to make a significant difference in conjunction with repulsive conditions as shown in Figure 8. More precisely, SEI results agree better with the measured deposition rate at an ionic strength of 10 mM while they are close to
7

those obtained with the simple model for other values of the ionic strength. In fact, electrostatic forces between the appendages and the substrate are neglected in the simple model while they play an important under repulsive conditions in the SEI technique. Electrostatic forces are the only repulsive contributor to the net interaction potential and therefore it is clear that in the simple model where electrostatic forces are neglected, the magnitude of the total net potential increases with the number of appendages in contact as well as their average size while it tends to decrease with the number of appendages (or surface coverage) in the SEI technique as observed in Figure 4.
4. Conclusion The aim of the present study was to investigate the origin of the discrepancies between experimental observations and numerical predictions on the basis of the extended DLVO theory and to propose an efficient model for deposition. For that purpose, the topography of the bacterial cell and substrate surfaces was reconstructed using SEI technique and SEI predictions were compared with those of a simple model for surface roughness. The simple model assumed a log-normal distribution of the asperity radii on the rough substrate and a uniform distribution of the bacterial cell appendages. Unlike the smooth surface model, the roughness model reproduces non-zero deposition rates under repulsive conditions in line with experimental observations. For the parallel flow chamber, it appears that the simple model for roughness is as good as SEI predictions for most cases except for low ionic strength in the presence of appendages, where SEI predictions are more accurate and provide a better description of the role of appendages under repulsive conditions.
Results have also shown that three parameters linked with surface roughness have an impact on the height of the energy barrier: the asperity mean size, the roughness RMS and the surface coverage. The results show that presence of valleys on the rough surface does not play a significant role for the estimation of the deposition rate prior to biofilm formation under conditions favourable for bacterial adhesion i.e. hydrophobic substrate and high ionic strength. However, present results remain preliminary and further detailed investigations have to be performed in conjunction with experimental analysis for roughness and bacterial adhesion experiments including the measurement of motility velocity. The results have shown that the energy barrier between the bacterial cell and the substrate decreases as the asperity size increases. Future work includes testing different material roughness and validating the investigation of Katsikogianni and Missirlis [3] who experimentally showed that bacteria preferentially adhere to surface topography features as large as their own diameters and that bacterial adhesion does not depend only on surface asperity sizes but also their shapes (chosen as identical in the present study). Acknowledgment: This work was funded by the Engineering and Physical Sciences Research Council (EPSRC). Acknowledgement is also due to NUFEB (http://research.ncl.ac.uk/nufeb/) team for providing general advice and support. References: 1. Morisaki, H., et al., The effect of motility and cell-surface polymers on bacterial
attachment. Microbiology, 1999. 145(10): p. 2797-2802.
8
2. Gottenbos, B., et al., Pathogenesis and prevention of biomaterial centered infections. Journal of Materials Science: Materials in Medicine, 2002. 13(8): p. 717-722.
3. Katsikogianni, M. and Y.F. Missirlis, Concise review of mechanisms of bacterial adhesion to biomaterials and of techniques used in estimating bacteria-material interactions. Eur Cell Mater, 2004. 8(3).
4. Matsumoto, S., A. Ohtaki, and K. Hori, Carbon fiber as an excellent support material for wastewater treatment biofilms. Environmental science & technology, 2012. 46(18): p. 10175-10181.
5. Bunt, C.R., D.S. Jones, and I.G. Tucker, The effects of pH, ionic strength and polyvalent ions on the cell surface hydrophobicity of Escherichia coli evaluated by the BATH and HIC methods. International journal of pharmaceutics, 1995. 113(2): p. 257-261.
6. Alnnasouri, M., et al., Influence of surface topography on biofilm development: Experiment and modeling. Biochemical Engineering Journal, 2011. 57: p. 38-45.
7. Sjollema, J., et al., The influence of collector and bacterial cell surface properties on the deposition of oral streptococci in a parallel plate flow cell. Journal of Adhesion Science and Technology, 1990. 4(1): p. 765-777.
8. Hoek, E.M.V., S. Bhattacharjee, and M. Elimelech, Effect of Membrane Surface Roughness on Colloid-Membrane DLVO Interactions. Langmuir, 2003. 19(11): p. 4836-4847.
9. Derjaguin, B.V., Analysis of friction and adhesion IV. The theory of the adhesion of small particles. Kolloid-Zeitschrift, 1934. 69(2): p. 155–164.
10. Van Oss, C., Energetics of cell-cell and cell-biopolymer interactions. Cell Biophysics, 1989. 14(1): p. 1-16.
11. Boks, N.P., et al., Forces involved in bacterial adhesion to hydrophilic and hydrophobic surfaces. Microbiology, 2008. 154(10): p. 3122-3133.
12. Busscher, H.J., et al., Preparation and characterization of superhydrophobic FEP-teflon surfaces. Journal of adhesion science and technology, 1992. 6(3): p. 347-356.
13. Spielman, L.A. and S.K. Friedlander, Role of the electrical double layer in particle deposition by convective diffusion. Journal of Colloid and Interface Science, 1974. 46(1): p. 22-31.
14. Wells, A.C. and A.C. Chamberlain, Transport of small particles to vertical surfaces. British Journal of Applied Physics, 1967. 18(12): p. 1793.
15. Bowen, B.D., S. Levine, and N. Epstein, Fine particle deposition in laminar flow through parallel-plate and cylindrical channels. Journal of Colloid and Interface Science, 1976. 54(3): p. 375-390.
16. Walt, D.R., et al., The effect of gravity on initial microbial adhesion. Journal of colloid and interface science, 1985. 107(2): p. 334-336.
9

Figure 1
h D

Figure 2
-1000
-500
0
500
1000
1500
2000
2500
0 10 20 30 40 50 60
Ne
t in
tera
ctio
n p
ote
nti
al U
(J/
m2 )
D (nm)
Surface 3 (Ra=47 nm)
Surface 2 (Ra=35 nm)
Surface 1 (Ra=10 nm)
Smooth surface
Surface 1 ( )
Surface 2 ( )
Surface 3 ( )
No asperity ( )
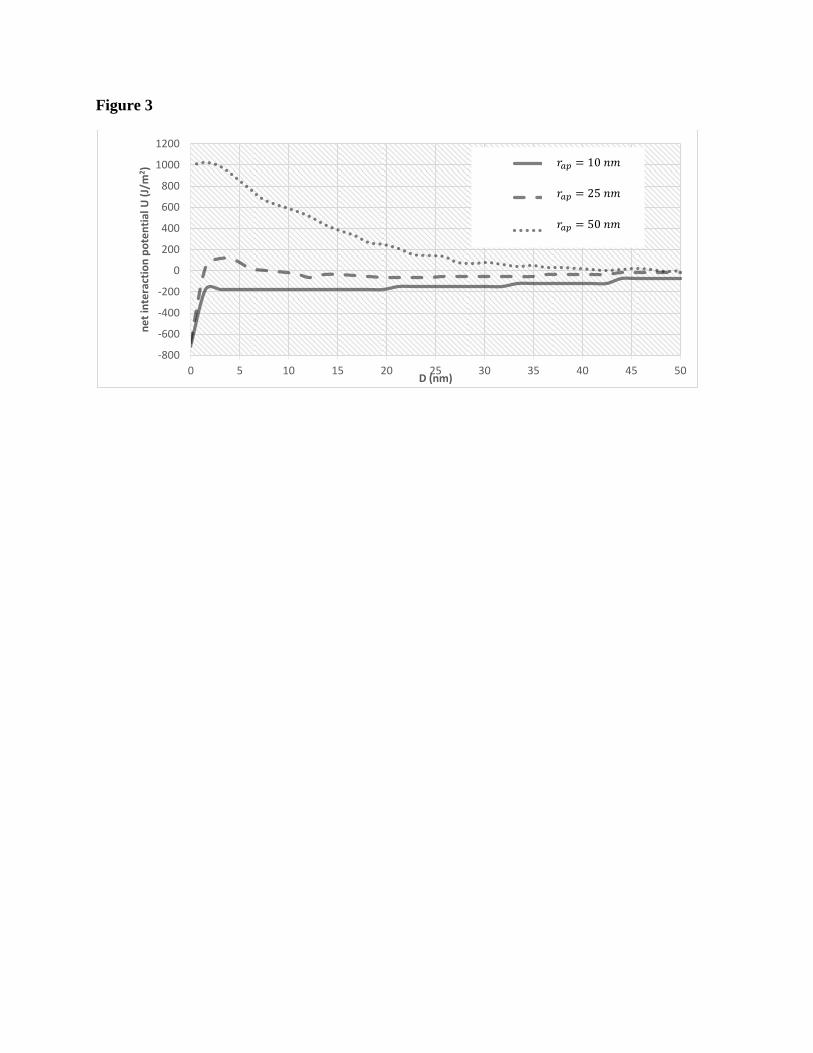
Figure 3
-800
-600
-400
-200
0
200
400
600
800
1000
1200
0 5 10 15 20 25 30 35 40 45 50
ne
t in
tera
ctio
n p
ote
nti
al U
(J/
m2 )
D (nm)
Rap=10 nm
Rap=25 nm
Rap=50 nm

Figure 4
-1000
-500
0
500
1000
1500
0 5 10 15 20 25 30 35 40 45 50
ne
t in
tera
ctio
n p
ote
nti
al U
(J/
m2 )
D (nm)
smooth bacterial surface
5%
10%
15%
20%
No appendage