influence of shallow-water habitats and shoreline ... · tats that harbor important infaunal...
TRANSCRIPT

MARINE ECOLOGY PROGRESS SERIESMar Ecol Prog Ser
Vol. 326: 11–27, 2006 Published November 17
INTRODUCTION
In Chesapeake Bay, coastal areas are characterizedby vast expanses of unvegetated sand and mud habi-tats that harbor important infaunal communities. Suchcommunities serve critical ecosystem functions (e.g.nutrient cycling) and provide food for epibenthicpredators including the blue crab Callinectes sapidusand various demersal fishes (Horwitz 1987, Diaz &Schaffner 1990, Hines et al. 1990, Seitz et al. 2001,2003b). For instance, infaunal clams in these communi-ties comprise the highest percentage, up to 55%, of the
blue crab diet (Laughlin 1982, Hines et al. 1990, Man-sour & Lipcius 1991, Mansour 1992).
Bivalves are dominant and representative membersof healthy Chesapeake Bay benthic communities andare typically a long-lived, key component of the ben-thos, sometimes comprising up to 90% of the benthicprey biomass (Hagy 2002); many species are consid-ered estuarine endemics or residents (Boesch 1977,Holland 1985). Whereas bivalves such as clams, oys-ters, and mussels often dominate ‘biomass’ of benthiccommunities, annelids may dominate ‘numbers’ oforganisms in these systems, depending on location,
© Inter-Research 2006 · www.int-res.com*Email: [email protected]
Influence of shallow-water habitats and shorelinedevelopment on abundance, biomass, and diversityof benthic prey and predators in Chesapeake Bay
R. D. Seitz*, R. N. Lipcius, N. H. Olmstead, M. S. Seebo, D. M. Lambert
Virginia Institute of Marine Science, The College of William and Mary, PO Box 1346, Gloucester Point, Virginia 23062, USA
ABSTRACT: Within the coastal zone, waterfront development has caused severe loss of shallow-water habitats, such as salt marshes and seagrass beds. Although the effects of habitat degradationon community structure within intertidal marshes have been well studied, little is known about theimpact of habitat degradation on, and the ecological value of, subtidal shallow-water habitats, de-spite the prevalence of these habitats in coastal ecosystems. In coastal habitats, bivalves are domi-nant benthic organisms that can comprise over 50% of benthic prey biomass and are indicative ofbenthic production. We quantified bivalve diversity, density, and biomass in deep and shallow(<1.5 m MLW) unstructured subtidal habitats in 2 tributaries of lower Chesapeake Bay (Elizabeth-Lafayette River system and York River). We also examined the effects of shoreline alteration in shal-low habitats by contrasting the benthos of the subtidal areas adjacent to natural marsh, bulkhead,and rip-rap shorelines. Bivalve diversity, density, and biomass were significantly higher in shallowthan in deep benthic habitats in both systems. Benthic abundance and diversity were higher in subti-dal habitats adjacent to natural marsh than those adjacent to bulkhead shorelines; abundance and di-versity were intermediate in rip-rap shorelines, and appeared to depend on landscape features.Predator density and diversity tended to be highest adjacent to natural marsh shorelines, and densityof crabs was significantly higher in natural marsh than in bulkhead habitats. There is thus a cruciallink between natural marshes, infaunal prey in subtidal habitats, and predator abundance. Conse-quently, the indirect effects of coastal habitat degradation upon secondary production in the shallow,subtidal habitats adjacent to salt marshes may be as great as or greater than direct habitat effects.
KEY WORDS: Shallow-water habitats · Shoreline development · Bivalves · Macoma balthica ·Callinectes sapidus · Chesapeake Bay · Food web · Benthos
Resale or republication not permitted without written consent of the publisher

Mar Ecol Prog Ser 326: 11–27, 2006
habitat, and season (Boesch 1977, Virnstein 1977,Hines et al. 1990, Dauer 2001, Hagy 2002). Chesa-peake Bay infaunal bivalve assemblages include majorspecies such as the Baltic macoma Macoma balthica,the hard clam Mercenaria mercenaria, and the stoutrazor clam Tagelus plebeius (Boesch 1977, Holland1985). Polychaetes sometimes comprise a substantialfraction of benthic prey biomass (Diaz & Schaffner1990, Dauer 2001, Schaffner et al. 2002), especially inpolyhaline (18 to 30 psu) reaches of the bay whereeuryhaline opportunists are common (Boesch 1977).
Benthic species diversity can vary in concert with theintensity of competition, predation, disturbance, andenvironmental gradients (Paine 1966, Virnstein 1977,Connell 1978, Sih et al. 1985). In Chesapeake Bay, forexample, diversity of infauna is positively correlatedwith salinity (Boesch 1977). Stable environmentalconditions often result in higher diversity, as in thetropics where fluctuations in temperature and otherenvironmental factors are minimal and diversity ishigh (Jackson 1972, Virnstein et al. 1984, Rex et al.1993). Moreover, benthic diversity and abundancecan be indicative of habitat quality and may signifywhich habitats are productive in the ecosystem (Daueret al. 2000).
In shallow tributaries of Chesapeake Bay, shallow-water benthic prey biomass is high and can lead to ele-vated densities of consumers (i.e. bottom-up control;Seitz et al. 2003b), suggesting that these habitats are atleast as productive as deep-water habitats, if not moreso. The notion that most benthic prey biomass is indeep soft-sediment habitats is a fundamental assump-tion of food web models for Chesapeake Bay (Baird& Ulanowicz 1989), and one that critically determinesthe output of such models. Thus, examination ofthis assumption is essential to the accurate portrayalof food web dynamics in estuarine systems such asChesapeake Bay. Consequently, we conducted anextensive comparative study to quantify the abun-dance, biomass, and diversity of dominant benthicbivalves in both deep and shallow soft sediments of 2tributary systems of lower Chesapeake Bay: (1) theElizabeth-Lafayette River system (hereafter E-L) and(2) the York River (hereafter YR) (see Fig. 1). We sam-pled during 1 time frame because we focused on den-sities of the larger, longer-lived adults that have longturnover times. In addition to bivalves, we examinedthe total benthic community for the shoreline study inthe YR to evaluate whether our bivalve associationswith shoreline development extended to the infaunalcommunity.
Both natural processes and anthropogenic activityhave caused habitat loss or degradation (Seneca &Broome 1992, Thayer 1992, Zedler 1992, Zimmerman2000), which diminishes secondary production in
affected coastal habitats. Human expansion requiresthat some areas of land or water be developed, causinghabitat alterations and severe degradation of marineresources (Dauer 2001, Peterson & Lipcius 2003).Despite the significance of this issue, there is a dearthof information on the impact of shoreline developmentand the resultant habitat degradation upon benthicand fishery production. This paucity of informationhas made it difficult to identify the optimal habitats forprotection or restoration efforts aimed at minimizingloss of ecosystem production (Peterson & Lipcius 2003).Moreover, although benthic prey biomass and second-ary production in deep-water, soft-bottom sedimentshave been documented (Dauer & Alden 1995, Weis-berg et al. 1997, Dauer et al. 2000, Hagy 2002,Schaffner et al. 2002), the comparative benthic bio-mass in shallow-water subtidal habitats influenced byshoreline development and habitat degradation hasnot been quantified.
While various studies have addressed invertebrateuse of intertidal marshes (Kneib et al. 1980, Kneib1997, Cicchetti 1998, Cicchetti & Diaz 2000, Whaley &Minello 2002, Jivoff & Able 2003, Minello et al. 2003,Clark et al. 2004), to our knowledge only 1 publishedstudy has explicitly addressed the effects of shorelinedevelopment on subtidal benthos (Weis et al. 1998),though some pollution studies may mention indirecteffects. Weis et al. (1998) demonstrated that chemicallytreated, wooden bulkhead structures reduced adjacentbenthic biomass and diversity compared to referencesites away from the bulkhead.
In estuarine systems, shoreline alteration and ben-thic community resources have been studied at largerspatial scales, though they have not been examinedfor the smaller-scale specific shoreline effects. Forexample, King et al. (2005) examined regional-scalewatershed land use, suggesting that shorelinemarshes are important for bivalves, and Tourtellotte& Dauer (1983) detected depauperate benthos in thevicinity of a system with extensive bulkheading (Link-horn Bay). A few studies also have reported negativeeffects of altered shorelines on predators in adjacentwaters (Hendon et al. 2000, Peterson et al. 2000, Car-roll 2003), but they have not concurrently examinedinfauna.
The abundance and diversity of epibenthic predatorscan vary by location, season, and environmental condi-tion. Predator density can be related to prey density, asshown in various studies demonstrating bottom-upcontrol (Menge et al. 1996, Seitz et al. 2003b, Posey etal. 2005) and based on the theory of ideal-free distrib-ution (Bernstein et al. 1999). We therefore examinedthe effects of shoreline development upon the benthiccommunity and epibenthic predators in shallow sub-tidal areas of the E-L River system and the YR.
12
Seitz et al.: Shoreline development effects on benthos
Our objectives were 2-fold. First, we aimed to assesswhether there was a significant difference in density,biomass, abundance, and diversity of bivalves in shal-low (<1.5 m mean low water [MLW]) versus deep(≥1.5 m MLW) habitats in the E-L River system and YR.From these data, we used the mean density and bio-mass within each tributary factored with bathymetryand areal coverage of shallow and deep depth strata toestimate overall abundance of organisms within eachstratum. Second, we determined whether there was a
significant difference in subtidal bivalve abundance,diversity, and biomass in the Lafayette River, andinfaunal community diversity and abundance in theYR among shallow subtidal habitats adjacent to 3 typesof shoreline developed to different degrees: (1) naturalmarsh, (2) rip-rap (rocks placed on a slope for erosioncontrol), and (3) bulkhead shoreline (2 and 3 are re-vetments). We also estimated concurrent epibenthicpredator density and diversity adjacent to the 3 shore-line types.
13
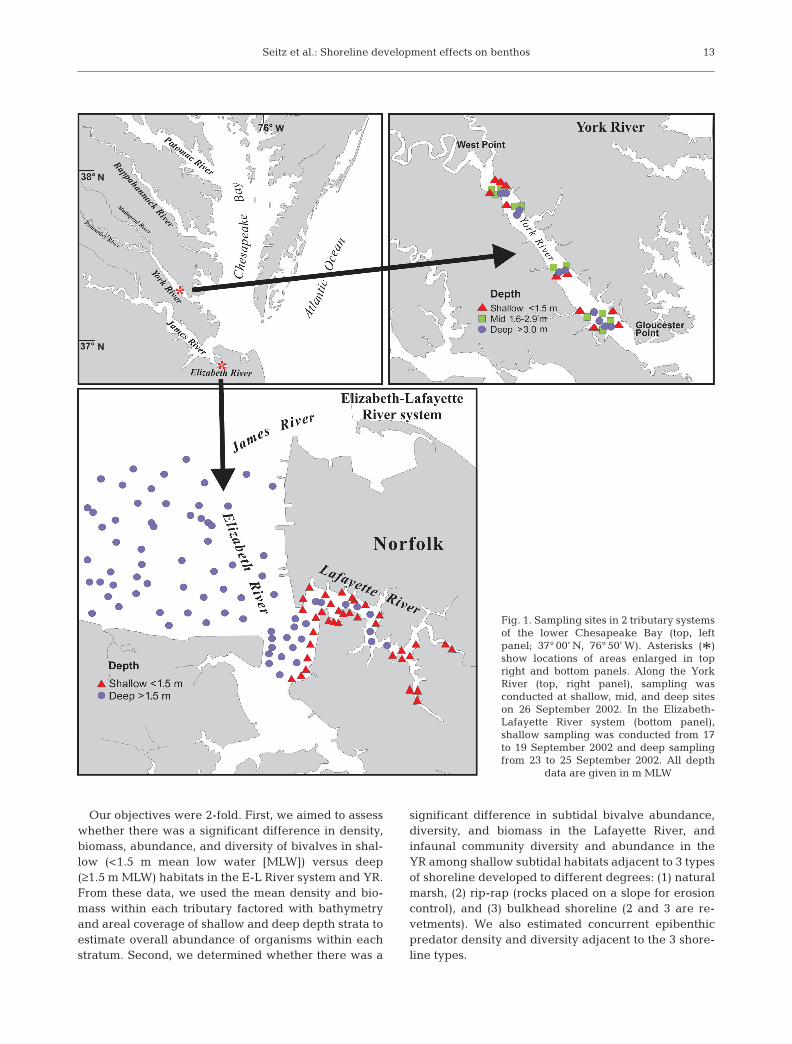
Fig. 1. Sampling sites in 2 tributary systemsof the lower Chesapeake Bay (top, left panel; 37° 00’ N, 76° 50’ W). Asterisks (*)show locations of areas enlarged in topright and bottom panels. Along the YorkRiver (top, right panel), sampling wasconducted at shallow, mid, and deep siteson 26 September 2002. In the Elizabeth-Lafayette River system (bottom panel),shallow sampling was conducted from 17to 19 September 2002 and deep samplingfrom 23 to 25 September 2002. All depth
data are given in m MLW
N
N
W

Mar Ecol Prog Ser 326: 11–27, 2006
MATERIALS AND METHODS
Site selection. GIS-based maps of coastal shorelineswere used to delineate the areas of the deep and shal-low waters of the E-L River system and the YR (Fig. 1).From the GIS-delineated strata, we used a random-number program to generate 121 possible random,independent sites in deep water (>1.5 m MLW) and60 random sites in shallow water (<1.5 m MLW) in theE-L. Of the potential sites in each stratum, we sampled81 deep sites (mean depth +SE, 5.02 + 0.38 m) and40 shallow subtidal sites (mean depth 0.73 + 0.01 m) inthe E-L system. The design was unbalanced because aconcurrent project required a detailed examination ofbivalves in the deep waters, thus, requiring more sam-ples there. In the YR (Fig. 1), we randomly chose 10sites within each of 3 depth strata: (1) shallow (<1.5 m),(2) mid (1.5 to 3.0 m), and (3) deep (>3 m) water. Theresulting mean (± SE) depths sampled were shallow =1.5 ± 0.1 m, mid = 2.6 ± 0.14 m, and deep = 8.5 ± 0.92 m.These sites were dispersed among the following 3 riverlocations: downriver (near the river mouth); center;and upriver (near the river head). This area has a semi-diurnal tide of about 2 m range.
Within the E-L River system, shallow sampling wasconducted from 17 to 19 September 2002 (along withshoreline sampling), and deep sampling was con-ducted from 23 to 25 September 2002. In the YR, shal-low, mid, and deep sampling was conducted on26 September 2002, a gear comparison study was con-ducted on 26 September 2002, and shoreline samplingwas conducted from June to August 2002.
Physical variables and benthic prey collections.Water temperature, salinity, and dissolved oxygen(DO) were assessed at most of the sites; when siteswere in close proximity, physical variables were onlymeasured at 1 site (Table 1). We also took 2.5 cm dia-meter surface sediment cores for grain-size analysis. Inthe E-L River system, 26 to 30 samples per stratumwere used for the grain-size comparisons, whereas 10to 20 samples per stratum from the York River wereused (Table 1). The percentages of gravel (>2 mm),
sand (>62.5 µm), silt (4 phi) and clay (8 phi) in sedi-ments were determined by standard wet sieve andpipette analysis (Folk 1980; phi = – [ln(particle dia-meter) × ln(2)–1]).
Bivalves were quantified using a box core or suctionsampling gear, both of which sample a large surfacearea and penetrate deep (40 to 60 cm) into the sedi-ment. This is essential for accurate estimation of densi-ties of large bivalves that dwell deep (30 to 40 cm) inthe sediment and are sparsely distributed (Hines &Comtois 1985). The box core sampled 0.0625 m2 of sed-iment area, whereas the suction apparatus sampled0.170 m2. We therefore standardized densities in allsamples to number of individuals m–2.
For the deep and mid-water sampling, we used a25 × 25 cm Gray O’Hara box core. Benthic cores weresubsampled for sediment grain size and the remainderof the sediment was sieved on a 1 mm mesh screen.All bivalves retained on the screen were identified tothe lowest possible taxonomic level (usually species),measured, and frozen for biomass estimates.
For the shallow-water sampling, we used a suctionapparatus (with attached 1 mm mesh bag; Eggleston etal. 1992) and sampled within a cylinder of 0.17 m2 sur-face area to ~40 cm depth. Bag contents were sievedon a 1 mm mesh screen. All bivalves retained on thescreen were identified to species, measured, andfrozen for biomass estimates. We compared averagebivalve size between the deep and shallow strata forspecies that had sufficient numbers of individuals inboth depth strata.
Gear comparison. Since 2 different gear types (boxcore and suction apparatus) were employed, a gearefficiency comparison was conducted. In the YR, ateach of 3 sites that had high clam densities (high den-sities are preferred for gear comparisons; J. Hoenigpers. comm.) and that were accessible to both a largeresearch vessel (using the box core) and a smallervessel (using the suction apparatus), bivalves weresampled by 5 box cores and by 5 suction samples. Wegenerated a mean density for core and suction samplesfor each site. These samples were compared with a2-way mixed-model ANOVA with gear type as a fixedfactor and site as a random factor.
Biomass estimates. To obtain ash free dry weight(AFDW in g), clams were dried to a constant weight(~48 h) at 60°C, and ashed at 550°C for 4 h to obtain ashweight. The largest and most abundant clams, Tagelusplebeius and Macoma balthica, were shucked prior toashing to remove additional weight of the periostracumassociated with large shells. The other clam specieswere too small for shucking (<10 mm length) or hadextremely thin shells and were ashed along with theirshells. The effect of the periostracum on the AFDW ofsmall clams was assumed to be negligible.
14
Table 1. Mean (±SE) values for temperature (Temp, °C), salin-ity (psu), % sand, and dissolved oxygen (DO mg l–1) at deepvs. shallow sites in the Elizabeth-Lafayette (E-L) River system(26 to 39 samples per stratum) and York River (YR) (10 to 20
samples per stratum)
Site type Temp Salinity % sand DO
E-L Deep 25.1 (0.1) 21.9 (0.9) 26.7 (3.4) 5.6 (0.2)Shallow 26.6 (0.1) 18.5 (0.4) 46.2 (7.4) 8.4 (0.5)
YR Deep 23.8 (0.3) 21.8 (0.6) 11.9 (7.5) 9.7 (1.0)Shallow 23.1 (0.1) 20.9 (0.3) 31.4 (6.4) 9.6 (1.1)

Seitz et al.: Shoreline development effects on benthos
Numerous Tagelus plebeius and Macoma balthicawere collected (>200 ind. ranging from 8.5 to 35.2 mmshell length (SL) for M. balthica and 8.7 to 80.0 mm SL forT. plebeius). A regression of SL to AFDW was derivedand used to estimate biomass from size for these 2 spe-cies. A sample of clams spanning the entire range ofsizes (~80 from each species) was chosen for the regres-sion. Because large numbers of other species were notcollected (<75 ind. per species), each clam was dried andashed. For M. balthica and T. plebeius, our best-fit equa-tions were the following power functions:
Macoma balthica: AFDW = 0.000005057 × SL3.0068; (r2 = 0.88, p < 0.001)
Tagelus plebeius: AFDW = 0.000011 × SL2.6189; (r2 = 0.94, p < 0.001)
Shoreline sampling. Using GIS-based mapping ofshorelines, in each river system we chose 6 to 8 repli-cate, independent subtidal sites in marsh creeks adja-cent to (< 5 m from shore) natural Spartina sp. marshes,6 to 8 sites adjacent to bulkhead structures, and 5 to 7sites adjacent to rip-rap shoreline structures. For eachsite, we tried to choose areas that had extensivelengths (>50 m) of the particular shoreline type. In theE-L River system, there were 6 replicate sites of eachshoreline type, whereas in the YR, there were 5 to 7sites of each type. At each site, we assessed water andhabitat quality by measuring physical variables includ-ing water temperature, salinity, DO, turbidity, waterdepth, and sediment grain size (Table 2). Concur-rently, we sampled benthos (bivalves only for the E-L,total infaunal community for the YR) and epibenthicpredators to assess abundance and diversity.
Bivalve and predator sampling in the E-L River sys-tem: We used a suction apparatus (1 mm mesh bag) ina cylinder of 0.17 m2 area to ~40 cm depth for the ben-
thic samples, and a 2 m wide otter trawl net to samplealong a 100 m transect bordering the marsh or alteredshoreline for the predator samples. All bivalves andpredators were identified to species; bivalves weremeasured to the nearest 0.1 mm, whereas predatorswere measured to the nearest mm. The abundanceand diversity of benthic bivalves and predators wascompared among the 3 shoreline types (natural marsh,rip-rap, and bulkhead) using fixed-factor ANOVAmodels with Tukey multiple comparison tests. For thepredator analysis, we wanted to compare densitiesamong unvegetated habitats, so we used sites withoutsignificant amounts of algae (which might have pro-vided additional structure for predators and maskedany differences among shoreline types).
Total infauna and predator sampling in the YorkRiver: We used a suction apparatus (1 mm mesh bag) ina cylinder of 0.17 m2 area to ~40 cm depth for the benthicsamples, and a 2 m wide otter trawl net to sample alonga 100 m transect bordering the marsh or altered shore-line for the predator samples. Total infauna and preda-tors were identified to the lowest possible taxonomiclevel (usually species). In addition, we analyzed arandom subset of samples (2 to 3 per shoreline type) forestimates of abundance and Shannon-Wiener diversity(H ’) of the entire infaunal benthic community (see Gray2000). More samples were taken but were lost when ourresearch building was demolished by Hurricane Isabelin 2003. An MDS (multi-dimensional scaling) analysisfrom a Bray-Curtis similarity matrix was performed ontotal infauna in the YR comparing communities by shore-line type using Primer v5.2.9 (Clark & Gorley 2001, Clark& Warwick 2001). Infaunal community abundance anddiversity and predator abundance and diversity werecompared between natural marsh, rip-rap, and bulkheadhabitats using fixed-factor ANOVA models, transform-ing data when necessary to homogenize variances.
RESULTS
Deep versus shallow habitats
Physical variables. In the deepstratum of the E-L River system,temperature was significantly lower(ANOVA unless otherwise indicated,df = 1 [source],64[error], F = 83.12, p <0.0005) and salinity was significantlyhigher (df = 1,61, F = 15.37, p < 0.0005)than in the shallow stratum (Table 1).Much of the shallow stratum waswithin the relatively shallow LafayetteRiver, which receives considerablefresh-water runoff. DO was normoxic
15
Table 2. Mean (±SE) values for temperature (Temp °C), salinity (psu),% sand,dissolved oxygen (DO in mg l–1), and Secchi depth (in cm) at natural marsh(NM), rip-rap (RR) and bulkhead (B) shorelines in the Elizabeth-Lafayette (E-L)River system and York River (YR). In last row for each system, ANOVA p-valuesare given for the comparison of the 3 shoreline types for each physical variable.
There were no significant differences at α < 0.05
Site type Temp Salinity % sand DO Secchi
E-L NM 22.8 (0.2) 17.6 (1.2) 42.4 (14.8) 6.0 (1.0) 75.5 (10.4)RR 23.5 (0.7) 19.1 (1.3) 44.3 (18.4) 7.8 (1.3) 80.3 (13.0)B 23.2 (0.8) 16.9 (0.9) 60.7 (14.9) 9.2 (1.2) 71.3 (14.3)
p 0.770 0.410 0.878 0.220 0.882
YR NM 28.3 (0.5) 19.1 (0.9) 77.0 (5.4) 45.1 (6.1)RR 28.0 (0.4) 19.3 (0.8) 82.9 (5.2) 43.0 (3.7)B 29.3 (0.5) 18.0 (2.0) 63.4 (16.3) 48.8 (11.6)
p 0.590 0.747 0.348 0.779

Mar Ecol Prog Ser 326: 11–27, 2006
(> 2 mg l–1) ranging from 4.0 to 12.0 mg l–1 across allsampling sites and was significantly lower in deep thanshallow waters (Table 1; df = 1,52, F = 18.34, p <0.0005). In the YR, temperature on the cold samplingday was significantly higher at deep than shallow sites(df = 1,32, F = 5.45, p = 0.026); salinity and DO did notdiffer significantly between depth strata (Table 1;salinity: df = 1,31, F = 2.61, p = 0.117; DO: df = 1,32, F= 0.27, p = 0.604).
In the E-L River system, the mean percentage ofsand was significantly lower (Table 1: df = 1,80, F =7.55, p = 0.007) and clay was significantly higher (df =1,80, F = 4.52, p = 0.037) in deep than in shallow sites.In the YR, the mean percentage of sand was lower andthe percentage of clay higher in deep than in shallowsites, though these differences were marginally non-significant (Table 1; sand: df = 1,28, F = 3.45, p = 0.074;clay: df = 1,28, F = 3.74, p = 0.063). Hence, the deepsites were muddier than shallow sites in both riversystems.
Bivalve collections. In the E-L Riversystem 550 clams were collected in120 samples. Common bivalve speciesincluded the thin-shelled Baltic ma-coma Macoma balthica, other thin-shelled tellinids, M. mitchelli andM. tenta, the stout razor clam, Tagelusplebeius, the hard clam, Mercenariamercenaria, as well as Mulinia lateralis,Aligena elevata, Anadara sp., Gemmagemma, and the angel wing clam Cyr-topleura costata (Table 3). The mostnumerous clams were M. balthica andT. plebeius, which comprised 40% and36% of all clams, respectively.
In the YR, 43 clams of 8 species werecollected in 32 samples, and includedMacoma balthica, M. mitchelli, M. ten-ta, Tagelus plebeius, Aligena elevata,Anadara sp., and Cyrtopleura costata(Table 4). T. plebeius comprised 41% ofall clams collected, while M. balthicacomprised 32%.
Gear comparison. There was no sig-nificant effect of gear type (i.e. box coreor suction sampler) upon clam density(Fig. 2; 2-way ANOVA with Gear p =0.511, df = 1 and Site p = 0.052, df = 2 asfactors, error df = 2). Hence, the 2 gearscould be considered equivalent in sam-pling efficiency.
Bivalve density and diversity. In theE-L River system, bivalve density wassignificantly higher in the shallow stra-tum than in the deep stratum (Fig. 3a)
(df = 1,119, F = 55.52, p < 0.0005). Bivalve density inthe shallow stratum (75.7 bivalves m–2) was nearly 8times higher than that of the deep stratum (9.5 bivalvesm–2). Densities of bivalves in the deep sites within theconfines of the Lafayette River (i.e. channel in thecenter of the Lafayette) were low and comparable todensities in the remainder of the deep sites. Speciesrichness (i.e. number of bivalve species m–2) was sig-nificantly higher in the shallow stratum than in thedeep stratum (Fig. 3b; df = 1,119, F = 112.3, p < 0.0005).Bivalve Shannon-Wiener diversity (H ’), which in-cludes both richness and evenness, was also signifi-cantly higher in shallow than in deep sites (df = 1,119,F = 56.71, p < 0.0005).
In the YR, both density (Fig. 4a) and diversity(Fig. 4b) of bivalves were significantly higher in theshallow and mid strata compared to the deep stratum(log-transformed density: df = 2,41, F = 4.77, p = 0.014,Tukey multiple comparison test; diversity df = 2,29, F =3.50, p = 0.043, Tukey test). The mid stratum did not
16
Table 3. Mean densities (ind. m–2, ±SE) of bivalves in 120 samples in the 2 sam-pling strata in the Elizabeth-Lafayette River system: deep (D, ≥1.5 m MLW) andshallow (S, <1.5 m MLW). The p-value from ANOVA is in bold when significant.The difference column shows which stratum had higher densities when they
differed significantly (Tukey test). ns = not significant (p > 0.05)
Species Deep Shallow p Difference
Macoma balthica 0.6 (0.4) 32.7 (7.4) 0.0005 S > DTagelus plebeius 4.2 (1.2) 27.0 (8.2) 0.0005 S > DMacoma mitchelli 0.2 (0.2) 2.3 (0.8) 0.002 S > DAligena elevata 2.6 (1.9) 9.2 (3. 9) 0.090 nsMercenaria mercenaria 0.4 (0.3) 2.1 (1.0) 0.028 S > DMulinia lateralis 0 1.0 (0.5) 0.011 S > DAnadara sp. 0 0.3 (0.3) 0.150 nsCyrtopleura costata 0.4 (0.4) 0 0.490 nsMacoma tenta 1.0 (0.4) 0 0.115 nsGemma gemma 0.2 (0.2) 1.1 (0.8) 0.172 nsMya arenaria 0 0.2 (0.2) 0.150 ns
Total bivalves 9.5 (2.6) 75.7 (11.7) 0.0005 S > D
Table 4. Mean densities (ind. m–2, ±SE) of bivalves in 32 samples in the 2 sam-pling strata in the York River: deep (D, ≥ 3.0 m MLW), and shallow (S, < 3.0 mMLW). The p-value from the ANOVA is listed (significant values in bold). Thedifference column shows which stratum had higher densities when they differedsignificantly (Tukey test). ns = not significant (p > 0.1). *= log-transformed data
used for ANOVA because of heterogeneity of variance
Species Deep Shallow p Difference
Macoma balthica 0 10.9 (4.5) 0.074* S > DTagelus plebeius 1.6 (1.6) 12.4 (6.7) 0.297 nsMacoma mitchelli 0 2.9 (1.7) 0.264 nsAligena elevata 0 1. 5 (1. 5) 0.509 nsAnadara sp. 1.6 (1.6) 0 0.141 nsCyrtopleura costata 0 2.9 (1.7) 0.264 nsMacoma tenta 0 0.7 (0.7) 0.509 ns
Total bivalves 3.2 (2.1) 30.7 (8.2) 0.023* S > D

Seitz et al.: Shoreline development effects on benthos
differ significantly from the shallow stratum; thus, forsubsequent analyses, we treated the mid and shallowstrata as a single shallow category.
Abundance and area. As an estimate of the overallabundance of bivalves in the 2 depth strata, we quan-tified the area available for sampling in each stratum
and multiplied by bivalve density. In the E-L River sys-tem, we estimated 468 ha in the shallow stratum and879 ha in the deep stratum (Fig. 5a). The percentage ofthe total area within the shallow stratum (35%) wasnearly half that in the deep stratum (65%). Multiplyingthe area available for sampling by the mean density ofbivalves, we estimated abundances of 354.4 million forthe shallow stratum (79% of total) and 91.3 million forthe deep stratum (21% of total) (Fig. 5b). In the YR(including creeks and coves), the shallow area of theriver (<2 m as defined by topographic contours) was8145 ha (33% of total area), whereas the deep areawas 16 872 ha (67% of total area; Fig. 5c). Multiplyingby density, abundance was estimated at 2750 millionbivalves in the shallow stratum (80% of total) and625 million bivalves in the deep stratum (20% of total;Fig. 5d).
Sediment and clam regressions. In the E-L River sys-tem, bivalve density in both depth strata was positivelyassociated with percent sand (Fig. 6a; non-linear re-gression p < 0.0005, r2 = 31.6%) and negatively associ-
17
Site 14 19 20
No.
biv
alve
s m
–2
0
20
40
60
80
100
120 Suction
Box Core
pgear = 0.511
Fig. 2. Mean (+SE) density of bivalves by site with 2 differentsampling gears. Samples were taken from 3 sites (14, 19and 20) in the upriver region of the York River with n = 5
at each site
a) Mean bivalve density
0
20
40
60
80
*
b) Mean bivalve species richness
StrataDeep Shallow
Mea
n n
o. (m
–2)
0.0
0.5
1.0
1.5
2.0
*
Fig. 3. Mean (+SE) bivalve (a) density and (b) species rich-ness for 2 depth strata in the Elizabeth-Lafayette River system:deep and shallow. Asterisk indicates significant differences
(ANOVA p < 0.05)
a) Mean bivalve density
0
10
20
30
40
50
A
b) Mean bivalve species richness
StrataDeep Mid Shallow
Mea
n (i
nd. m
–2)
0.0
0.2
0.4
0.6
0.8
1.0B
B
B
A
B
Fig. 4. Mean (+SE) bivalve (a) density and (b) species rich-ness for 3 depth strata: deep (≥3.0 m), mid (1.5 to 2.9 m) andshallow (<1.5 m) water in the York River. Different capitalletters above bars indicate significant differences in log-
transformed data (Tukey test)

Mar Ecol Prog Ser 326: 11–27, 2006
ated with percent silt (Fig. 6b; non-lin-ear regression p = 0.0003, r2 = 19.1%) ofsurface sediments. In the YR, with fewersamples and fewer clams collected,there were no significant relationshipsbetween bivalve density and sedimenttype (clams vs. % sand regression p =0.648, clams vs. % silt p = 0.653).
Bivalve size and biomass compar-isons. In the E-L River system, bivalveswere significantly larger in the shallowthan in the deep stratum (Fig. 7a; df =1,545, F = 8.17, p = 0.004). Specifically,Tagelus plebeius, one of the most abun-dant bivalves, was significantly largerin the shallow stratum compared to thedeep stratum (Fig. 7b; df = 1,197, F =6.54, p = 0.011). Similarly, in the YR,bivalves were much larger in shallowthan in deep habitats, though this dif-ference was not significant (Fig. 7c; df =1,41, F = 0.47, p = 0.498).
As with density, we standardized bio-mass in all samples to g AFDW m–2. The
pattern for bivalve biomass between the 2 strata in bothriver systems was equivalent to that for density. In theE-L River system, mean bivalve biomass m–2 was signif-icantly higher in the shallow stratum (about 13 timeshigher) than in the deep stratum (Fig. 8a; df = 1,118, F =27.7, p < 0.0005). The total biomass of all bivalve sampleswas 47.997 g AFDW. Of the total, Tagelus plebeius com-prised 73.1%, Macoma balthica comprised 25.2%, andtogether these 2 most common species accounted for98.3% of the bivalve biomass. T. plebeius biomass wassignificantly higher in the shallow stratum (4.95 + 1.69 gAFDW m–2) compared to the deep stratum (0.45 + 0.26 gAFDW m–2) (df = 1,118, F = 13.47, p = 0.002), due to themuch larger size of these clams in the shallow stratum(Fig. 7b). M. balthica was the most numerous bivalve andthe second most important in terms of biomass; M. balth-ica biomass was significantly higher in the shallow stra-tum (1.97 ± 0.505 g AFDW m–2) than in the deep stratum(0.039 ± 0.038 g AFDW m–2) (df = 1,118, F = 29.76, p <0.0005). Similarly, in the YR, mean bivalve biomass wassignificantly higher in shallow than in deep habitats(Fig. 8b: df = 1,30, F = 8.04, p = 0.008).
Biomass percentages. To generate an estimate oftotal bivalve biomass in each of the depth strata, wecalculated the product of the area and the mean bio-mass per unit area of each stratum. In the E-L Riversystem, there were 468 ha in the shallow stratum and879 ha in the deep stratum (Fig. 5a); total bivalve bio-mass was approximately 7 times higher in the shallowthan in the deep stratum (Fig. 8c). Total biomass inthe system was 36 334 kg AFDW, of which 87.6% was
18
b) Bivalve abundance E-L
StrataDeep Shallow Deep Shallow
No.
ind
. (m
illio
ns)
0
50
100
150
200
250
300
350
a) Area encompassed E-L
Hec
tare
s
0
200
400
600
800
1000
d) Bivalve abundance YR
0
500
1000
1500
2000
2500
3000
c) Area encompassed YR
0
4000
8000
12000
16000
20000
Fig. 5. (a) Area encompassed by sampling strata within the Elizabeth-Lafayette(E-L) River system. (b) Estimated abundance of bivalves in sampling stratawithin the E-L River system. (c) Area encompassed by sampling strata withinthe York River (YR). (d) Estimated abundance of bivalves in sampling strata
within YR
a) % Sand vs. Clam density
0
50
100
150
200
250
300
350
b) % Silt vs. Clam density
Sediment (% sand or silt)0 20 40 60 80 10
Cla
ms
m–2
0
50
100
150
200
250
300
350
0
p < 0.0005r2 = 31.6%
p = 0.0003r2 = 19.1%
Fig. 6. Non-linear regressions in the Elizabeth-Lafayette Riversystem of (a) clam density (ind. m–2) vs. percent sand in sur-face sediments from both sampling strata, and (b) clam den-sity vs. percent silt in surface sediments from both sampling
strata

Seitz et al.: Shoreline development effects on benthos
within the shallow stratum and 12.4% was within thedeep stratum. The low biomass in the deep stratumoccurred because this stratum had few bivalves, andthose that were present were small. Similarly, in theYR, there were 8145 ha in the shallow stratum and16 873 ha in the deep stratum (Fig. 5c), but biomass perunit area was much higher in the shallow stratum,resulting in 12 times higher total biomass for the shal-low than for the deep stratum (Fig. 8d).
Shoreline comparisons
Physical variables. There were no significant differ-ences in physical variables (temperature, salinity, Secchidepth, sediment type) by shoreline type, either in the E-LRiver system or the YR (Table 2); however in the E-LRiver system, biological parameters were associatedwith some of the physical ones. In the E-L River system,among the shallow habitats, total clam density was pos-itively associated with percent sand (p = 0.003, r2 = 0.32)and negatively associated with percent silt (p = 0.004,r2 = 0.30). In contrast, in the YR shallow habitats, wefound no significant relationships between bivalve den-sity and sediment type (clam vs. percent sand regressionp = 0.648, clams vs. percent silt p = 0.653), possibly due tothe lower numbers of clams collected in the YR.
Shoreline bivalve and infauna densities. In the E-LRiver system, Macoma balthica density differed signif-icantly among shoreline types (Fig. 9a; ANOVA on log-transformed data: df = 2,15, F = 4.12, p = 0.037); thehighest densities occurred adjacent to natural marsh.For Tagelus plebeius there was no significant differ-ence in density among shoreline types (Fig. 9b;ANOVA on log-transformed data: df = 2,15, F = 0.63,p = 0.547). Total bivalve densities followed the patternsfor M. balthica with slightly higher densities adjacentto natural marsh (109.8 bivalves m–2) than rip-rap(38.2 bivalves m–2) or bulkhead (78.4 bivalves m–2)(df = 2,15, F = 2.12, p = 0.155). In the YR, total bivalvedensities were moderate adjacent to natural marsh(24.4 m–2) and rip-rap (31.2 m–2) and low adjacent tobulkhead (18.2 m–2) (ANOVA on log-transformed den-sities; df = 2,27, F = 1.77, p = 0.190). There wereslightly higher densities of M. balthica and T. plebeiusadjacent to rip-rap and natural marsh compared tobulkhead shorelines, however these differences werenot significant (M. balthica p = 0.987, T. plebeius p =0.377) since relatively low numbers of both specieswere collected and variability was high.
In the YR, 26 species of macrofauna were found, in-cluding several species of polychaetes and amphipods,along with bivalves (Table 5). Shannon-Wiener diversityof all infauna (including bivalves, polychaetes, am-phipods, etc.), which integrates species richness andevenness of the infaunal community, was significantlygreater adjacent to both natural marsh and rip-rap com-pared to bulkhead in the YR (Fig. 10a; df = 2,4, F = 14.4,p = 0.015; Tukey test). The density of organisms in the to-tal benthic community followed a similar pattern, withsignificantly greater values for natural marsh and rip-rapcompared to bulkhead habitats (Fig. 10b; df = 2,4, F =11.63, p = 0.022; Tukey test). In addition, multidimen-sional scaling (MDS) of the macrobenthic communityshowed a clear separation between bulkhead sites andnatural marsh or rip-rap sites in the YR (Fig. 11) with
19
a) All bivalves, E-L
0
5
10
15
20
25
b) Tagelus plebeius, E-L
Mea
n s
ize
(mm
)
0
10
20
30 *
*
c) All bivalves, YR
StrataDeep Shallow
0
10
20
30NS
Fig. 7. (a) Mean size (error bars + SE) of all bivalves indeep and shallow strata in the Elizabeth-Lafayette (E-L) Riversystem. (b) Mean size of Tagelus plebeius in deep and shal-low strata in the E-L system. (c) Mean size of all bivalves indeep and shallow strata in the York River (YR). Asterisksbetween bars indicate significant differences (p < 0.05). NS:
not significant

Mar Ecol Prog Ser 326: 11–27, 2006
stress = 0.01; ANOSIM, global R = 0.575and p = 0.048, indicating that there weresignificant differences among groups al-though some groups were overlapping.
Shoreline predators. In the E-L Riversystem, fish abundance did not changeappreciably with shoreline type(Fig. 12a; df = 2,10, F = 0.03, p = 0.973).There was, however, a tendency towardhigher blue crab abundance adjacent tonatural marsh than in rip-rap or bulk-head shorelines (Fig. 12b), though vari-ability was high and this difference wasnot significant (df = 2,10, F = 1.14, p =0.359). In the YR, a pattern tending to-wards slightly higher abundance ofpredators in natural marsh compared torip-rap or bulkhead shorelines occurredboth in fish (Fig. 12a) and in total crabs,including spider crabs and mud crabs(Fig. 12b), though these differences werenot significant (Fish: df = 2,45, F = 0.53,p = 0.592, crab: df = 2 45, F = 0.47, p =
0.628). Notably, including data from both rivers, therewere significantly higher crab densities in natural marshthan in rip-rap or bulkhead shorelines (2-way ANOVAwith River and Shoreline as factors; Shoreline df = 2,55,F = 3.63, p = 0.033, Tukey test). With fish predator datafrom both rivers, there were no significant differences indensities among levels of the factors Shoreline type orRiver (2-way ANOVA; Shoreline df = 2,55, F = 0.13, p =0.876).
The diversity of both total predators (Fig. 13a) andfish predators (Fig. 13b) in the E-L River system washigher in natural marsh than in rip-rap or bulkheadhabitats, and these differences were marginally signif-icant (total predators p = 0.089, fish predators p =0.123). A similar tendency was seen in YR total preda-tor richness (Fig. 13c) and fish predator richness(Fig. 13d), though variability was high and the patternswere non-significant (total predators p = 0.795, fishpredators p = 0.765).
DISCUSSION
Bivalve abundance and diversity in deep and shallowhabitats
Shallow-water habitats (<1.5 m) in both the E-LRiver system and YR in Chesapeake Bay had signifi-cantly higher bivalve density and abundance than didadjacent deep-water habitats. Specifically, bivalvedensity in shallow habitats was over 7 times higherthan that in deep habitats of the E-L River system and
20
a) Mean biomass E-L
Bio
mas
s (A
FDW
g m
–2)
0
2
4
6
8*
b) Mean biomass YR
Deep Shallow Deep Shallow0
2
4
6
8*
c) Total biomass E-L
05000
100001500020000250003000035000
d) Total biomass YR
Strata
Bio
mas
s (k
g A
FDW
)
0
1x10⁵
2x10⁵
3x10⁵
4x10⁵
5x10⁵
Fig. 8. Mean (+SE) bivalve biomass m–2 in deep and shallow strata for (a) Eliza-beth-Lafayette (E-L) River system and (b) York River (YR). Total biomass (kgAFDW) of bivalves in deep and shallow strata for (c) E-L system and (d) York River.
Asterisks between bars indicate significant differences (ANOVA, p < 0.05)
A
B
a) Macoma balthica
Mea
n (m
–2)
0
20
40
60
80
100
120
b) Tagelus plebeius
Shoreline typeNM RR B
0
20
40
60
80
p > 0.05
p = 0.037
A
B A B
Fig. 9. Macoma balthica and Tagelus plebeius. Mean (+SE)density of clams in shallow subtidal habitats adjacent to nat-ural marsh (NM), rip-rap (RR) or bulkhead (B) shorelines inthe Elizabeth-Lafayette River system for the bivalves (a) M. balthica and (b) T. plebeius. Different capital letters above
or within bars indicate significant differences (Tukey test)

Seitz et al.: Shoreline development effects on benthos
was similarly 7 times higher in shallow compared todeep habitats in the YR. Bivalve diversity (richness andShannon-Wiener H ’) and density of all 11 bivalve spe-cies but 1 (Anadara sp.) were higher in shallow than indeep habitats of E-L. In the YR, bivalve diversity wasapproximately 4 times greater in shallow than deephabitats.
Although high densities of bivalves have been ob-served previously in Chesapeake Bay (Hawthorne &Dauer 1983, Tourtellotte & Dauer 1983, Holland 1985,Dauer & Alden 1995, Seitz et al. 2001) and densitiescan be strikingly high during spring recruitment, nostudy to date has demonstrated such relatively highdensities in shallow compared to deep habitats. Theserelatively high bivalve densities persist even in theface of intense predation (Virnstein 1977), as many ofthe common species possess evolutionary adaptations,such as the ability to bury deep (Hines & Comtois 1985)to avoid predation (Seitz et al. 2001).
Even when accounting for the larger area of deep-water habitats, total bivalve abundance was muchhigher in shallow habitats due to the elevated densitiesof bivalves in the shallows. Within the E-L River sys-tem, we estimated that approximately 79% of the
bivalves in the system resided in theshallow stratum. Similarly, in the YR,80% of the total estimated bivalvesresided in shallow habitats. This sug-gests that the shallows are extremelyimportant for estuarine food webs, andthese habitats have typically not beensampled adequately.
As with abundance, bivalve biomasswas significantly higher in shallowbenthic habitats than in deep habitatsin both study systems. Since bivalvedensity in shallow-water habitats wasnearly 7-fold higher than that in thedeep habitats, and since bivalves werelarger in the shallows, the resultant bio-mass was much greater in shallowhabitats. Within the E-L River system,of the estimated total bivalve biomass,84% was in shallow habitats. In the YR,approximately 93% of the total esti-mated biomass was in the shallow stra-tum.
The clams that comprised the bio-mass in the shallow stratum were typi-cally large individuals of the Balticmacoma Macoma balthica, and thestout razor clam Tagelus plebeius. Al-though some T. plebeius and hardclams, Mercenaria mercenaria, ap-peared in deep habitats, they were usu-
ally smaller individuals (juveniles) with low biomass.Most of the large M. balthica in the shallow habitatswere reproductively active, since they mature at shelllengths greater than about 15 mm (Delano 2004).Moreover, M. balthica in Chesapeake Bay do notundergo ontogenetic changes in habitat (Seitz et al.2003b), which is common in the Baltic (Beukema 1993).Consequently, most of the spawning stock of M. balth-ica resides in shallow habitats. M. balthica, T. plebeius,and Mercenaria mercenaria are considered ‘estuarineendemics’ (sensu Boesch 1977) and are thought to bethe mainstay of the benthic community, persistingthrough environmental fluctuations, unlike ‘opportun-istic’ counterparts such as short-lived polychaetes.Moreover, many of the bivalves are extremely tolerantof temperature fluctuations, and M. balthica can with-stand up to 3 wk of low dissolved oxygen (Seitz et al.2003a).
In large estuaries (e.g. Chesapeake Bay), bivalvesmake up a high percentage of benthic prey biomass(Dauer et al. 1987, Hagy 2002), yet long-term monitor-ing programs have not regularly sampled shallowareas <1 m MLW (Weisberg et al. 1997, D. Dauer pers.comm.). For instance, in Chesapeake Bay prior to 1996,
21
Table 5. Mean number of macrofaunal organisms per 0.17 m2 sample by shore-line type collected in suction samples (1 mm sieve) in the York River with taxonindicated (A = amphipod, B = bivalve, G = gastropod, O = other, P = polychaete,S = shrimp). Species are listed in order of most abundant to least abundant
across all 3 shoreline types
Species Bulkhead Rip-rap Natural marsh
Aligena elevata (B) 0.0 5.7 17.5Tagelus plebeius (B) 5.0 6.7 5.5Phoronis sp. (O) 0.0 5.0 8.0Notomastus sp. (P) 1.0 7.0 4.5Spiochaetopterus sp. (P) 0.0 11.7 0.5Geukensia demissa (B) 0.0 0.0 7.5Littoraria littorea (G) 0.0 1.3 2.0Glycera americana (P) 0.5 0.7 2.0Macoma balthica (B) 0.5 0.7 1.0Mercenaria mercenaria (B) 0.0 0.0 2.0Loimia medusa (P) 0.0 0.3 1.5Macoma mitchelli (B) 1.5 0.0 0.0Ensis directus (B) 0.0 0.0 1.5Neanthes (Nereis) succinea (P) 0.0 1.0 0.5Capitella capitata (P) 0.0 1.3 0.0Diopatra cuprea (P) 0.0 0.7 0.5Drilonereis longa (P) 0.0 0.7 0.5Scoloplos fragilis (P) 1.0 0.0 0.0Scolelepis squamata (P) 0.0 0.0 1.0Mysidopsis bigelowii (S) 0.0 0.3 0.5Pectineria gouldii (P) 0.0 0.3 0.5Spionidae (P) 0.5 0.3 0.0Upogebia sp. (S) 0.0 0.0 0.5Mulinia lateralis (B) 0.0 0.3 0.0Rhyncecoela anopla (O) 0.0 0.3 0.0Gammarid amphipod (A) 0.0 0.3 0.0
Mean number of organisms 10.0 44.7 50.5Mean number of species 4.5 11.0 13.0

Mar Ecol Prog Ser 326: 11–27, 2006
shallow areas were not sampled at all, and currentlythe Chesapeake Bay benthic monitoring program’srandom sampling regime only samples a few shallowareas, but only those deeper than 1.0 m MLW (in pro-portion to their occurrence). In addition, the sampling
program uses a ‘Young grab’ that penetrates 10 cm intothe sediment. This shallow penetration depth couldpotentially miss deep-dwelling species, such asMacoma balthica, which have populations with over50% of their biomass below 10 cm in some habitats(Hines & Comtois 1985, Dauer et al. 1987). Thus, a sig-nificant and substantial segment of benthic prey bio-mass in estuaries such as Chesapeake Bay may havebeen overlooked in mechanistic interpretations ormodeling of critical ecological processes, such asenergy transfer in food webs. Because of the substan-tial fraction of biomass in the shallows demonstrated inour study, there is a clear need for additional modelingefforts that incorporate these important habitats. Wehave undertaken initial modeling studies of the YRthat will add the important shallow-water benthic bio-mass to existing food-web models to estimate theimpacts of this additional prey resource to uppertrophic levels (Seitz et al. unpubl. data).
Shallow habitats are likely to be much more signifi-cant than formerly believed as feeding grounds forepibenthic predators such as the blue crab and de-mersal fish (e.g. Atlantic croaker Micropogonias un-
22
A
b) Number of infaunal organisms
NM RR B
H' (
bits
ind
.–1)
0
10
20
30
40
50
60
a) Shannon-Wiener diversity
Shoreline type
Den
sity
(no.
m–2
)
1.0
1.5
2.0 p = 0.015
p = 0.022A
A
B
A
A
B
Fig. 10. (a) Mean (+SE) Shannon-Wiener diversity and (b)number of organisms of all benthic infauna in a subset (2 to 3per habitat) of shallow subtidal sites adjacent to natural marsh(NM), rip-rap (RR) or bulkhead (B) shorelines in the YorkRiver. Different capital letters within bars indicate significant
differences (Tukey test)
Fig. 11. Multidimensional scaling plot of York River communitymacrofauna adjacent to the 3 shoreline types: natural marsh,rip-rap, and bulkhead). Global R = 0.575, p = 0.048 and stressare from ANOSIM analysis for differences among shore-
line types
a) Fish predators
Tota
l ind
. tra
wl–1
0
2
4
6
8
b) Crab predators
Shoreline typeNM RR B
0
2
4
6
12E-LYR
E-LYR
Fig. 12. Mean (+SE) density of predators per 20 m2 areatrawled in shallow subtidal habitats adjacent to natural marsh(NM), rip-rap (RR) or bulkhead (B) shorelines in the Eliza-beth-Lafayette (E-L) River system (E-L only included habitatswithout significant algal structure) and York River (YR).
(a) Fish and (b) Callinectes sapidus, the blue crab

Seitz et al.: Shoreline development effects on benthos
dulatus), which prey heavily on larger bivalves andpolychaetes. Furthermore, whether considering asomewhat degraded river system such as the E-L or arelatively unstressed system such as the YR, the shal-lows emerged as a prime habitat for bivalves and otherlong-lived benthic infauna. Consequently, shallow-water habitats are important in providing foodresources to upper trophic levels, and they are highlydeserving of conservation and restoration efforts(Peterson & Lipcius 2003). The results obtained forthese tributaries are likely to be found in other Chesa-
peake Bay tributaries, and shallow-water habitats ingeneral. Other bay tributaries, such as the Rhode Riverin Maryland, have similarly high densities of bivalvesin the shallow habitats of <4 m depth (Seitz et al. 2001)and this pattern should be representative of shallowhabitats throughout the Chesapeake Bay.
The patterns in bivalve biomass and abundance mayhave been produced by any one of several mecha-nisms. Physical variables that may favor an increasedabundance and biomass in the shallows include sedi-ment grain size, temperature, or dissolved oxygen.Sediment grain size is a primary determinant of ben-thic community structure, which is enhanced wherethe grain size is not extremely fine or coarse (Holland1985, Schaffner et al. 2002). In our study, bivalve bio-mass was higher where the sand fraction was higher,in shallow habitats. Though salinity can control ben-thic densities in shallow waters (Holland 1985), the dif-ferences in salinity between deep and shallow habitatsin our study were minor; we therefore conclude thatsalinity did not affect infaunal densities within stratamore than did sediment type. Though hypoxia was notobserved during our sampling in September 2002, itmay have been prevalent in deep habitats in the pre-ceding summer (as was noted for YR deep habitats inJune 2003; R. Seitz & W. Long unpubl. data), leading tothe lower density and biomass of adult bivalves indeep habitats, as seen in the YR (Boesch & Rosenberg1981) and Chesapeake Bay (Kemp et al. 2005).
Higher abundance and biomass in the shallowscould also be due to increased food (e.g. benthicmacroalgae) for benthic deposit-feeders (Kneib et al.1980); shallow waters may allow decreased water-column degradation of carbon sources and quickerdelivery of high-quality food to the benthos. Shallowareas may also experience an increased subsidy ofallochthonous carbon from runoff through productivesalt marshes. Bottom-up control of benthic organismshas been documented for various systems (Crowder etal. 1988, McQueen et al. 1989, Menge & Olson 1990,Menge et al. 1997, Posey et al. 2005) including Chesa-peake Bay (Seitz et al. 2003b). In addition, lower den-sities of infaunal organisms in deep habitats could be aresult of human impacts, as anthropogenic low dis-solved oxygen in deep channels may lead to a reduc-tion of infauna at depth (Dauer et al. 2000, Zimmerman2000, Kemp et al. 2005).
The observed patterns and results of this study mustbe interpreted within the limitations of the timing ofthe study. For instance, we examined a single ‘snap-shot’ in time in the fall, after the majority of predationupon the benthos had occurred. Thus, the impact ofseasonality on bivalve abundance patterns remainsuncertain. However, the presence of large, long-livedbivalves such as Macoma balthica in shallow habitats
23
b) E-L fish species richness
Mea
n (in
d. t
raw
l–1)
1.5
2.0
2.5
3.0
3.5
4.0
a) E-L predator richness
3
4
5
6
7
8
p = 0.089
p = 0.123
c) YR predator richness
2.00
2.25
2.50
2.75
3.00p = 0.795
d) YR fish species richness
Shoreline typeNM RR B
1.50
1.75
2.00
2.25p = 0.765
Fig. 13. Mean (+SE) species richness of predators in shallowsubtidal habitats adjacent to natural marsh (NM), rip-rap (RR)or bulkhead (B) shorelines for (a) all predators and (b) fish inthe Elizabeth-Lafayette (E-L) River system, (c) all predatorsand (d) fish in the York River (YR). ANOVA p-values are
given

Mar Ecol Prog Ser 326: 11–27, 2006
and their absence in the deeper habitats indicates thatthe findings would not be likely to change qualitativelyin different seasons. The results further suggest that indeep habitats, juveniles of dominant benthic speciessuch as M. balthica either do not recruit, suffer highmortality, or emigrate to other habitats. We wouldexpect the magnitude of abundance to change season-ally, particularly during spring recruitment periods,but our conclusions regarding the comparative benthicabundance, biomass, and diversity in shallow anddeep habitats should not change qualitatively were weto repeat the study during other seasons. We are cur-rently continuing these studies to examine temporalvariation in these systems, and the spatial generality ofthe findings to other systems.
Effects of shoreline development upon benthicabundance and diversity
Benthic bivalve density and diversity were greatestadjacent to natural marsh habitats compared to rip-rapor bulkhead shorelines in the E-L River system, andinfaunal density and diversity were highest in naturalmarsh and rip-rap as compared to bulkhead in the YRsystem. The E-L River system is a waterway within thecity of Norfolk, which is ‘an urban, highly developedregion… with land use dominated by high-density res-idential districts, commercial and industrial develop-ments, and military reservations... [where] heavyindustrial, military, commercial, and residential de-velopment prevail… few shoreline miles remain unal-tered’ (Berman et al. 2002). In the E-L River system,which has over 50% of its shoreline developed(Berman et al. 2002), the pattern of high density adja-cent to natural marsh habitats was significant for den-sity of some bivalve species (e.g. Macoma balthica),but not for others (e.g. Tagelus plebeius).
We suggest that developed shorelines have negativeimpacts on benthic infauna in subtidal habitats adja-cent to the shoreline, and not just to shoreline habitatssuch as salt marshes themselves (Carroll 2003). Thismay arise because the allochthonous input of carbonfrom marsh materials may be an important food source(Currin et al. 1995, French McCay & Rowe 2003), par-ticularly for deposit-feeding infauna (e.g. Macomabalthica), and this input is reduced where shorelinesare developed with an impermeable bulkhead. Thisidea is supported by the trend of slightly increasedwater clarity in our bulkhead sites compared to naturalmarsh sites in the YR. This may also explain whyorganisms that are not deposit feeders (e.g. the sus-pension-feeding Tagelus plebeius in the E-L River sys-tem) were not affected by shoreline type, since theymay rely on water-column food sources that are inte-
grated from water that has passed over distant habi-tats. Another explanation could be that hydrodynamicsare changed by the alteration of the shoreline such thathigher current flow impedes settlement of some ben-thic organisms. This explanation is not supported byour sediment grain size comparison that showed nosignificant differences among shoreline types. Theonly other study of which we are aware that demon-strates negative effects of shoreline development uponthe subtidal benthic community was one that exam-ined the impact of toxics in CCA-treated wooden bulk-heads (Weis et al. 1998). Such a negative impact ofchemically treated wood could partially explain theresults found in our study; however, only some of thebulkhead shorelines we studied used treated wood,whereas others used metal or concrete.
In the YR, a less-developed and larger system thanthe E-L system, bivalve prey abundance and benthiccommunity diversity were greater in both naturalmarsh and rip-rap than in bulkhead habitats. The YRhas approximately 86% of the distance along its shore-line as natural marsh, whereas about 6% is developed(rip-rap, bulkhead, groin or miscellaneous includingtires, concrete or railroad ties) and ~8% is upland suchas beaches (Berman et al. 1999). We hypothesize thatthe YR system has much larger expanses of unalteredmarsh habitat available to subsidize adjacent devel-oped shorelines; rip-rap shorelines tend to be sur-rounded by natural marsh habitats, and therefore rip-rap habitats in the YR are not as negatively influencedby development as those in heavily developed systemssuch as the E-L River system.
A handful of studies have looked at the impacts ofshoreline structures on predators alone. One studysuggested moderate impacts of rip-rap shorelines com-pared to natural marsh on nekton; abundances of juve-nile crabs were decreased in rip-rap compared to nat-ural marsh habitats (Carroll 2003). Moreover, fish andcrabs were least abundant along shorelines alteredwith bulkheads or rubble and most abundant alongmarsh habitats (Peterson et al. 2000). Diversity of thosepredators was lower adjacent to altered marshes thanadjacent to natural marshes. In an additional study,abundance of gobies was significantly higher in watersadjacent to unaltered marsh than adjacent to alteredhabitats (Hendon et al. 2000). The authors suggestedthat these reductions were due to reduced habitatsuitability for these benthic fish.
Several studies have examined nekton and benthoswithin the marsh, but these studies did not venture fur-ther than 1 m from the marsh edge (e.g. Whaley &Minello 2002). A few months after marsh establish-ment, macroinfaunal abundance was greater in naturalmarshes than created marshes in Galveston, Texas(Minello & Webb 1997). However, after 1 yr, created
24

Seitz et al.: Shoreline development effects on benthos
marshes apparently reached their maximum supportpotential for nekton, and densities were similarbetween natural and created marshes (Minello 2001).Moreover, benthic infauna may serve as prey for manymarsh predators (e.g. juvenile fishery species) thataggregate near the marsh edge (Whaley & Minello2002). Because of the high productivity of marshes,they have been proposed as one of the nearshoreecosystems serving as a nursery for many fish andinvertebrates (Beck et al. 2001). A meta-analysis of thenursery role hypothesis for marshes indicated thatmarshes serve as nurseries for nekton (decapod crus-taceans and fishes); thus, these species are likely to beadversely affected by marsh depletion (Minello et al.2003).
In our study, density and diversity of epibenthicpredators (e.g. spot, croaker, hogchoker and blue crab)tended to mirror prey densities, with a trend towardshigher density and diversity in natural marsh than inbulkhead shorelines (with significantly higher densi-ties of crabs next to natural marsh in both systems com-bined). The generally similar pattern of predator andprey densities in relation to shoreline type in both sys-tems suggests that there is a functional relationshipbetween predators and prey whereby predators maybe concentrating in habitats with elevated prey densi-ties, and where food is therefore abundant (i.e. bottom-up control). Evidence for bottom-up control of the bluecrab by its principal prey (i.e. thin-shelled clams) in theYR has been documented (Seitz et al. 2003b), and theresults of this study support previous findings.Although elevated densities of prey and predators inshallow habitats may have been caused by an inde-pendent factor (e.g. sediment type or hydrodynamics),we suggest that reduced infaunal densities adjacent tobulkhead shorelines diminished predator densitiesand likely diminished corresponding production of thesystem. Given the extent of shoreline development inpopulated coastal areas, this loss of ecosystem services(Peterson & Lipcius 2003) could have a major impact onoverall productivity in estuaries such as ChesapeakeBay.
Our study was conducted in a drought year (2002)when there was minimal runoff into the system. Typi-cally, salt marshes buffer shallow waters from surfacerunoff and may thereby reduce toxic inputs. Duringthis drought year, the differences we detected be-tween natural marsh and developed shorelines mayhave been minimal since little buffering was required.In high-runoff years, rip-rap and bulkhead shorelinesmay allow direct deposition of polluted water (unfil-tered by the marsh system), and may have a substan-tially greater impact on benthic communities.
The higher abundance, biomass, and diversity ofbivalves, and possibly that of other long-lived benthic
infauna, in shallow habitats has critical implications forfood web dynamics and the restoration of degradedestuaries such as Chesapeake Bay (Kemp et al. 2005).Future efforts must be directed at discerning the role ofthe elevated shallow-water benthic prey biomass inecosystem processes (e.g. filtration, buffering), inenergy flow through the food web, and in the dynam-ics of lower and higher trophic levels. Moreover, a keylink exists between salt marsh habitat, food availabilityfor predators, and predator abundance. Consequently,protection and restoration of salt marsh habitats maybe essential to the maintenance of high benthic pro-duction and consumer biomass in estuarine eco-systems.
Acknowledgements. We thank the staff and students at theVirginia Institute of Marine Science who helped with this pro-ject including K. Delano, M. Montane, W. C. Long, T. Chil-dress, S. Gera and Captain C. Machen. The manuscript wassignificantly improved by constructive comments from R.Diaz, D. Dauer, W. C. Long, J. Long, and 2 anonymousreviewers. Funding was provided by the Army Corps of Engi-neers, by the Chesapeake Bay Restoration Fund, by theNational Science Foundation Research Experiences forUndergraduates Program, by Virginia Sea Grant, by theEssential Fish Habitat Program of the National Sea GrantOffice, by the Governor’s School Program of the Common-wealth of Virginia, and by a grant to the Blue Crab AdvancedResearch Consortium from the National Oceanic and Atmos-pheric Administration’s Chesapeake Bay Office. This is con-tribution number 2745 from the Virginia Institute of MarineScience.
LITERATURE CITED
Baird D, Ulanowicz RE (1989) Seasonal dynamics of theChesapeake Bay ecosystem. Ecol Monogr 59:329–364
Beck MW, Heck KL Jr, Able KW, Childers DL and 9 others(2001) The identification, conservation, and managementof estuarine and marine nurseries for fish and inverte-brates. Bioscience 51:633–641
Berman M, Berquist H, Dewing S, Thoman G, Laird R (1999)Gloucester county shoreline and tidal marsh inventory.Special Report in Applied Marine Science and OceanEngineering, No. 351 Virginia Institute of Marine Science,Gloucester Point, VA. RMAP.99.003.1
Berman M, Berquist H, Hershner C, Killeen S, Rudnicky T,Schatt D, Weiss D, Woods H (2002) City of Norfolk —shoreline situation report. Special report in AppliedMarine Science and Ocean Engineering, No. 378 VirginiaInstitute of Marine Science, Gloucester Point, VA
Bernstein C, Auger P, Poggiale JC (1999) Predator migrationdecisions, the ideal free distribution, and predator-preydynamics. Am Nat 153:267–281
Beukema JJ (1993) Successive changes in distribution pat-terns as an adaptive strategy in the bivalve Macoma balth-ica (L.) in the Wadden Sea. Helgol Meeresunters 47:287–304
Boesch DF (1977) A new look at the zonation of benthos alongthe estuarine gradient. In: Coull BC (ed) Ecology of marinebenthos. Belle W. Baruch Marine Library in Marine Sci-ence, Vol 6. University of South Carolina Press, Columbia,SC, p 245–266
25

Mar Ecol Prog Ser 326: 11–27, 2006
Boesch DF, Rosenberg R (1981) Response to stress in marinebenthic communities. In: Barrett GW, Rosenberg R (eds)Stress effects on natural ecosystems. Wiley, New York,p 179–200
Carroll R (2003) Nekton utilization of intertidal fringing saltmarsh and revetment hardened shorelines. Masters thesis,The College of William and Mary, Virginia Institute ofMarine Science, Gloucester Point, VA
Cicchetti G (1998) Habitat use, secondary production andtrophic export by salt marsh nekton in shallow waters.PhD dissertation, The College of William and Mary,Virginia Institute of Marine Science, Gloucester Point, VA
Cicchetti G, Diaz RJ (2000) Types of salt marsh edge andexport of trophic energy from marshes to deeper habitats.In: Weinstein MP, Kreeger DA (eds) Concepts and contro-versies in tidal marsh ecology. Kluwer Academic Publish-ers, Dordrecht, p 515–542
Clark KR, Gorley RN (2001) Primer v5, user manual. PlymouthMarine Laboratory, Plymouth
Clarke KR, Warwick RM (2001) Change in marine communi-ties: an approach to statistical analysis and interpretation,2nd edn. Plymouth Marine Laboratory, Plymouth
Clark RD, Christensen JD, Monaco ME, Caldwell PA,Matthews GA, Minello TJ (2004) A habitat-use model todetermine essential fish habitat for juvenile brown shrimp(Farfantepenaeus aztecus) in Galveston Bay, Texas. FishBull 102:264–277
Connell JH (1978) Diversity in tropical rain forests and coralreefs. Science 199:1302–1310
Crowder LB, Drenner RW, Kerfoot C, McQueen DJ, Mills EL,Sommer U, Spencer CN (1988) Food web interactions inlakes. In: Carpenter SR (ed) Complex interactions in lakecommunities. Springer-Verlag, New York, p 141–160
Currin CA, Newell SY, Pearl HW (1995) The role of standingdead Spartina alterniflora and benthic microalgae in saltmarsh food webs: considerations based on multiple iso-tope analysis. Mar Ecol Prog Ser 121:99–116
Dauer DM (2001) Benthic biological monitoring program ofthe Elizabeth River watershed (2000). Report for VirginiaDepartment of Environmental Quality. Old Dominion Uni-versity, Norfolk, VA
Dauer DM, Alden RW (1995) Long-term trends in the macro-benthos and water quality of the lower Chesapeake Bay(1985–1991). Mar Pollut Bull 30:840–850
Dauer DM, Ewing RM, Rodi AJ (1987) Macrobenthic distribu-tion within the sediment along an estuarine salinity gradi-ent. Int Rev Gesamten Hydrobiol 72:529–538
Dauer DM, Weisberg SB, Ranasinghe JA (2000) Relationshipsbetween benthic community condition, water quality,sediment quality, nutrient loads, and land use patterns inChesapeake Bay. Estuaries 23:80–96
Delano K (2004) Variation in reproductive output of the Balticclam, Macoma balthica, in shallow systems of the Chesa-peake Bay: habitat type and spatial scale. Masters thesis,The College of William and Mary, Virginia Institute ofMarine Science, Gloucester Point, VA
Diaz RJ, Schaffner LC (1990) The functional role of estuarinebenthos. In: Haire M, Krome EC (eds) Perspectives on theChesapeake Bay, 1990. Advances in estuarine sciences,Report no. CBP/TRS41/90. Chesapeake Research Consor-tium, Gloucester Point, VA, p 25–56
Eggleston DB, Lipcius RN, Hines AH (1992) Density-dependent predation by blue crabs upon infaunal clamspecies with contrasting distribution and abundancepatterns. Mar Ecol Prog Ser 85:55–68
Folk RL (1980) Petrology of sedimentary rocks. Hemphill Pub-lishing, Austin, TX
French McCay DF, Rowe JJ (2003) Habitat restoration asmitigation for lost production at multiple trophic levels.Mar Ecol Prog Ser 264:233–247
Gray JS (2000) The measurement of marine species diversity,with an application to the benthic fauna of the Norwegiancontinental shelf. J Exp Mar Biol Ecol 250:23–49
Hagy JD (2002) Eutrophication, hypoxia, and trophic tranferefficiency in Chesapeake Bay. PhD dissertation, Uni-versity of Maryland, Center for Environmental Science,Solomons, MD
Hawthorne SD, Dauer DM (1983) Macrobenthic communitiesof the Chesapeake Bay. III. Southern branch of the Eliza-beth River. Int Rev Gesamten Hydrobiol 68:193–205
Hendon JR, Peterson MS, Comyns BH (2000) Spatio-temporaldistribution of larval Gobiosoma bosc in waters adjacent tonatural and altered marsh-edge habitats of Mississippicoastal waters. Bull Mar Sci 66:143–156
Hines AH, Comtois KL (1985) Vertical distribution of infaunain sediments of a subestuary of central Chesapeake Bay.Estuaries 8:296–304
Hines AH, Haddon AM, Wiechert LA (1990) Guild structureand foraging impact of blue crabs and epibenthic fish in asubestuary of Chesapeake Bay. Mar Ecol Prog Ser 67:105–126
Holland AF (1985) Long-term variation in macrobenthos in themesohaline region of Chesapeake Bay. Estuaries 8:93–113
Horwitz RJ (1987) Fish. In: Heck KL (ed) Ecological studiesin the middle reach of Chesapeake Bay, Calvert Cliffs, Vol23. Lecture notes on coastal and estuarine studies.Springer-Verlag, New York, p 167–225
Jackson JBC (1972) The ecology of the molluscs of Thalassiacommunities, Jamaica, West Indies. II. Molluscan popula-tion variability along an environmental stress gradient.Mar Biol 14:304–337
Jivoff PR, Able KA (2003) Evaluating salt marsh restoration inDelaware Bay: the response of blue crabs, Callinectessapidus, at former salt hay farms. Estuaries 26:709–719
Kemp WM, Boynton WR, Adolf JE, Boesch DF and 14 others(2005) Eutrophication of Chesapeake Bay: historicaltrends and ecological interactions. Mar Ecol Prog Ser 303:1–29
King RS, Hines AH, Craige FD, Grap S (2005) Regional,watershed, and local correlates of blue crab and bivalveabundances in subestuaries of Chesapeake Bay, USA.J Exp Mar Biol Ecol 319:101–116
Kneib RT (1997) The role of tidal marshes in the ecology ofestuarine nekton. Ocean Mar Biol Ann Rev 35:163–220
Kneib RT, Stiven AE, Haines EB (1980) Stable carbon isotoperatios in Fundulus heteroclitus (L.) on a North Carolina saltmarsh. J Exp Mar Biol Ecol 46:89–98
Laughlin RA (1982) Feeding habits of the blue crab, Calli-nectes sapidus Rathbun, in the Apalachicola estuary,Florida. Bull Mar Sci 32:807–822
Mansour RA (1992) Foraging ecology of the blue crab, Calli-nectes sapidus Rathbun, in lower Chesapeake Bay. PhDdissertation, The College of William and Mary, VirginiaInstitute of Marine Science, Gloucester Point, VA
Mansour RA, Lipcius RN (1991) Density-dependent foragingand mutual interference in blue crabs preying upon infau-nal clams. Mar Ecol Prog Ser 72:239–246
McQueen DJ, Johannes MRS, Post JR, Steward TJ, Lean DRS(1989) Bottom-up and top-down impacts on freshwaterpelagic community structure. Ecol Monogr 59:289–309
Menge BA, Olson AM (1990) Role of scale and environmentalfactors in regulation of community structure. Trends EcolEvol 5:52–57
Menge BA, Daley B, Wheeler PA (1996) Control of interaction
26

Seitz et al.: Shoreline development effects on benthos
strength in marine benthic communities. In: Polis GA,Winemiller KO (eds), Food webs: integration of patternand dynamics. Chapman & Hall, New York, p 258–274
Menge BA, Daley B, Wheeler PA, Strub PT (1997) Rockyintertidal oceanography: an association between commu-nity structure and nearshore phytoplankton concentra-tion. Limnol Oceanogr 42:57–66
Minello TJ (2001) Temporal development of salt marsh valuefor nekton and epifauna: utilization of dredged materialmarshes in Galveston Bay, Texas, USA. Wetlands EcolManag 8:327–341
Minello TJ, Webb JW Jr (1997) Use of natural and createdSpartina alterniflora salt marshes by fishery species andother aquatic fauna in Galveston Bay, Texas, USA. MarEcol Prog Ser 151:165–179
Minello TJ, Able KW, Weinstein MP, Hays CG (2003) Saltmarshes as nurseries for nekton: testing hypotheses ondensity, growth and survival through meta-analysis. MarEcol Prog Ser 246:39–59
Paine RT (1966) Food web complexity and species diversity.Am Nat 100:65–75
Peterson CH, Lipcius RN (2003) Conceptual progress towardspredicting quantitative ecosystem benefits of ecologicalrestorations. Mar Ecol Prog Ser 264:297–307
Peterson MS, Comyns BH, Hendon JR, Bond PJ, Duff GA(2000) Habitat use by early life-history stages of fishes andcrustaceans along a changing estuarine landscape: Differ-ences between natural and altered shoreline sites. Wet-lands Ecol Manag 8:209–219
Posey M, Powell C, Cahoon L, Lindquist D (1995) Top downvs. bottom up control of benthic community compositionon an intertidal tideflat. J Exp Mar Biol Ecol 185:19–31
Rex MA, Stuart CT, Hessler RR, Allen JA, Sanders HL, WilsonGDF (1993) Global-scale latitudinal patterns of speciesdiversity in deep sea benthos. Nature 65:636–639
Schaffner LC, Friedrichs CT, Dauer DM (2002) Review of thebenthic process model with recommendation for futuremodeling efforts. A report from the benthic process modelreview team. Virginia Institute of Marine Science,Gloucester Point, VA
Seitz RD, Lipcius RN, Hines AH, Eggleston DB (2001) Den-sity-dependent predation, habitat variation, and the per-sistence of marine bivalve prey. Ecology 82:2435–2451
Seitz RD, Marshall LS Jr, Hines AH, Clark KL (2003a) Effects
of hypoxia on predator–prey dynamics of the blue crabCallinectes sapidus and the Baltic clam Macoma balthicain Chesapeake Bay. Mar Ecol Prog Ser 257:179–188
Seitz RD, Lipcius RN, Stockhausen WT, Delano KA, SeeboMS, Gerdes PD (2003b) Potential bottom-up control ofblue crab (Callinectes sapidus) distribution at broadspatial scales. Bull Mar Sci 72:471–490
Seneca ED, Broome SW (1992) Restoring tidal marshes inNorth Carolina and France. In: Thayer GW (ed) Restoringthe nation’s marine environment. Maryland Sea Grant,College Park, MD, p 53–73
Sih A, Crowley P, McPeek M, Petranka J, Strohmeier K (1985)Predation, competition, and prey communities: a review offield experiments. Ann Rev Ecol Syst 16:269–311
Thayer GW (1992) (ed) Restoring the nation’s marine environ-ment. Maryland Sea Grant, College Park, MD
Tourtellotte GH, Dauer DM (1983) Macrobenthic communi-ties of the Chesapeake Bay. II. Lynnhaven Roads, Lynn-haven Bay, Broad Bay, Linkhorn Bay. Int Rev GesamtenHydrobiol 68:59–72
Virnstein RW (1977) The importance of predation by bluecrabs and fishes on benthic infauna in Chesapeake Bay.Ecology 58:1199–1217
Virnstein RW, Nelson WG, Nelson FG III, Howard RK (1984)Latitudinal patterns in seagrass epifauna: Do patternsexist, and can they be explained? Estuaries 7:310–330
Weis JS, Weis P, Proctor T (1998) The extent of benthicimpacts of CCA-treated wood structures in Atlantic coastestuaries. Arch Environ Contam Toxicol 34:313–322
Weisberg SB, Ranasinghe JA, Dauer DM, Schaffner LC, DiazRJ, Frithsen JB (1997) An estuarine benthic index of bioticintegrity (B-IBI) for Chesapeake Bay. Estuaries 20:149–158
Whaley, SD, Minello TJ (2002) The distribution of benthicinfauna of a Texas salt marsh in relation to the marshedge. Wetlands 22:753–766
Zedler JB (1992) Restoring cordgrass marshes in SouthernCalifornia. In: Thayer GW (ed) Restoring the nation’smarine environment. Maryland Sea Grant, College Park,MD, p 7–41
Zimmerman AR (2000) Organic matter composition of sedi-ments and the history of eutrophication and anoxia in themesohaline Chesapeake Bay. PhD dissertation, College ofWilliam and Mary, Virginia Institute of Marine Science,Gloucester Point, VA
27
Editorial responsibility: Otto Kinne (Editor-in-Chief), Oldendorf/Luhe, Germany
Submitted: March 1, 2005; Accepted: May 2, 2006Proofs received from author(s): November 9, 2006