influence of quechers modifications on recovery and matrix ... · # the author(s) 2017. this...
TRANSCRIPT

RESEARCH ARTICLE
Influence of QuEChERS modifications on recovery and matrixeffect during the multi-residue pesticide analysis in soilby GC/MS/MS and GC/ECD/NPD
Bożena Łozowicka1 & Ewa Rutkowska1 & Magdalena Jankowska1
Received: 13 June 2016 /Accepted: 25 December 2016 /Published online: 16 January 2017# The Author(s) 2017. This article is published with open access at Springerlink.com
Abstract A QuEChERS extraction followed by GC/MS/MSand GC-μECD/NPD for 216 pesticide and metabolites deter-mination in soil simultaneously were developed and com-pared. Volume of water, volume and polarity of solvent, andcleanup sorbents (C18, GCB, PSA) were optimized. TheQuEChERS with and without purification step were appliedto estimate effectiveness of the method. The recovery andmatrix effect (ME) were critical parameters within each testedprocedure. The optimal method without cleanup was validat-ed. Accuracy (expressed as recovery), precision (expressed asRSD), linearity, LOQ, and uncertainty were determined. Therecoveries at the three spiking levels using matrix-matchedstandards ranged between 65 and 116% with RSD ≤17 and60–112% with RSD ≤18% for MS/MS and μEC/NP, respec-tively. The LOQ ranged from 0.005–0.01 mg/kg for MS/MSto 0.05 mg/kg for μEC/NP. The ME for most of pesticidesresulted in enhancement of the signal and depended on theanalyte and detection system: MS/MS showed ME from −25to 74%, while μEC/NP from −45 to 96%. A principal com-ponent analysis was performed to explain the relationshipsbetween physicochemical parameters and ME of 216 pesti-cides. The QuEChERS protocol without the cleanup step isa promising option to make the method less expensive and
faster. This methodology was applied in routine analysis of263 soil samples in which p,p’ DDTwas the most frequentlydetected (23.5% of samples) and pendimethalin with thehighest concentration (1.63 mg/kg).
Keywords Pesticide . Soil . Optimization .Multi-residuemethod . QuEChERS . Gas chromatography
Introduction
Soil is an important resource of agriculture which has an abil-ity to retain agro-chemicals. Soil contamination causes thepresence of xenobiotic chemicals and very varied fromindustrial activity, improper disposal of waste to agriculturalchemicals. The presence of pesticide compounds in soils mayhave different sources: direct application, accidental spillage,runoff from the surface of plants, or from incorporation ofpesticide contaminated plant materials (Rashid et al. 2010).Agricultural soil is a high value component, so its irreversibledegradation should be avoided to guarantee its fertility andcurrent and future value.
Soil is a complex and heterogeneous matrix with a porousstructure that contains both inorganic (variable percentage ofsand, silt, and clay) and natural organic components mainlycomposed by humic substances (10–15%), lipids, carbohy-drates, lignin, flavonoids, pigments, resins and fulvic acids(Pinto et al. 2011). These compounds are characterized bythe diverse chemical structure and physicochemical proper-ties, which cause many analytical problems. Therefore, pesti-cide analysis at low concentration levels in these samples is avery difficult and challenging task.
In the literature, the analytical procedures for the determi-nation of pesticide residues in soil commonly are based ontraditional sample preparation methods, such as: liquid solid
Responsible editor: Roland Kallenborn
Electronic supplementary material The online version of this article(doi:10.1007/s11356-016-8334-1) contains supplementary material,which is available to authorized users.
* Ewa [email protected]
1 Plant Protection Institute - National Research Institute, Laboratory ofPesticide Residues, Chelmonskiego 22, Postal code:15-195 Bialystok, Poland
Environ Sci Pollut Res (2017) 24:7124–7138DOI 10.1007/s11356-016-8334-1

(LSE) (Durović et al. 2012), solid phase extraction (SPE)(Dąbrowska et al. 2003), ultrasonication in acetone(Harrison et al. 2013), and in soxhlet apparatus extraction(Sanghi and Kannamkumarath 2004). Other methods, suchas accelerated solvent (ASE) (Rouvière et al. 2012), dispersiveliquid-liquid microextraction (DLLME) (Pastor-Belda et al.2015), matrix solid phase dispersion (MSPD) (Łozowickaet al. 2012), ultrasonic solvent (USE) (Tor et al. 2006), micro-wave assisted (MAE) (Guo and Lee 2013; Fuentes et al.2007), pressurized liquid (PLE) (Martinez Vidal et al. 2010;Masiá et al. 2015), solid phase microextraction (SPME)(Moreno et al. 2006), supercritical fluid extraction (SFE)(Naeeni et al. 2011) have been developed to reduce theamount of reagents and time provided on sample preparation.
Nowadays, in pesticide residue analysis, QuEChERSmethod (ang. Ouick, Easy, Cheap, Effective, Rugged andSafe), developed by Anastassiades et al. (2003), become avery popular technique for different matrix sample prepa-rations such as: cereals (He et al. 2015), fruit and vegeta-bles (Lehotay et al. 2010), honey (Bargańska et al. 2013),tea (Lozano et al. 2012) and tobacco (Łozowicka et al.2015), because of its simplicity, low cost, amenability tohigh throughput, and high efficiency with a minimalnumber of steps. It involves two steps, extraction basedon partitioning between an aqueous and an organic layervia salting-out and dispersive SPE for further cleanupusing combinations of MgSO4 and different sorbents, suchas C18, primary-secondary amine (PSA), or graphitizedcarbon (GCB) to remove interfering substances (Anastassiadeset al. 2003).
The QuEChERS method has been described to a limitedextent for the extraction of wide range of pesticides from soil.The QuEChERSmethodology was the first time applied to theextraction of pesticides from soils in 2008 by Lesueur et al.(2008). In that study, the authors compared different extrac-tion methods for 24 pesticides that were commonly reportedas soil pollutants in the literature, those belonging to specificclasses. Other researchers have applied the QuEChERS for theextraction of the particular classes such as the amide, carba-mate, organochlorine, organophosphorus, triazine, triazinone,thiadiazine, and urea. (Asensio-Ramos et al. 2010; Correia-Sáet al. 2012; Li et al. 2012; Fernandes et al. 2013;Mantzos et al.2013; Masiá et al. 2015).
Gas chromatography (GC) with the variety of sensitivedetectors such as electron capture (EC) and nitrogen phos-phorus (NP) (Łozowicka et al. 2012), mass spectrometry(MS) (Rouvière et al. 2012; Wu and Hu 2014), tandemmass spectrometry (MS/MS) (Rashid et al. 2010) are tech-niques usually utilized in pesticide residue analysis insoils. Besides GC, which has some limitation, a perfectcomplement is high or ultra-high pressure liquid chroma-tography (HPLC, UHPLC) (Martinez Vidal et al. 2010;Moreno et al. 2006), liquid chromatography–mass
spectrometry (LC/MS) (Chen et al. 2010) or tandem massspectrometry (LC/MS/MS) (Kaczyński et al. 2016).
Despite the continuous appearance of many new analyticalmethods and instrumental equipments, one of the greatest dif-ficulties in pesticide residue analysis is matrix effect and itsunfavorable influence on quantitative and qualitative analytedetermination, particularly in the analysis of complex sam-ples. Matrix effect depends on the nature of compounds (mo-lecular size, polarity, thermal stability, volatility, etc.) and theanalyte concentration. Numerous methods have been pro-posed to correct its effects, including the use of analyte prot-estants (Anastassiades et al. 2013), coated inlet liners, com-pensation factors, different injection techniques, dilution, in-ternal standards, extensive sample cleanup, GC priming, andlabeled internal standards, but the majority method is to per-form matrix-matched calibrations (Erney et al. 1997).
Therefore, an existing knowledge needs to be filled (Veraet al. 2013; Bruzzoniti et al. 2014) by finding cheaper andfaster method for the simultaneous analysis of pesticides cov-ering a wide range of polarities in complex matrix such as soilthat has been carried out. On the results of an analysis, affectinterfering substances can be co-extracted with analytes; thus,it is very challenging to determine substances at very lowconcentration levels. Due to the use in agriculture of diverseclasses of pesticides, multi-residue methods are required forthe accurate and simultaneous determination of pesticides.
In this paper, the influence of modifications of QuEChERSon the recovery and matrix effect during the analysis of over50 multiple classes’ of pesticides in soil was reported. Anadditional objective of the study was to determine and com-pare the extent and variability of matrix effects of analytesusing gas chromatography with different types of detectors.Otherwise, it was attempted to find the correlation betweenselected physicochemical properties of 216 pesticides includ-ing metabolites and matrix effect using a principal componentanalysis (PCA).
Material and methods
Reagents and materials
Acetone, acetonitrile (AcN), and ethyl acetate (EtOAc)were analytical grade and provided for pesticide residueanalysis by J.T. Baker (Deventer, The Netherlands).Water was purified by Milli-Q (Millipore, Billerica, MA,USA) system. Water was cooled to temperature about 4 °C.QuEChERS sorbent kits and pouches of salts were pur-chased from the Agilent Technologies (Santa Clara, CA,USA). The sorbents used in this study were as follows:PSA (primary-secondary amine), C18, GCB (graphitizedcarbon black), and pouches of salts: magnesium sulfate,
Environ Sci Pollut Res (2017) 24:7124–7138 7125

sodium chloride, sodium citrate, citric acid disodium salt.Formic acid were supplied by Fluka (98% purity).
Pesticides (purity for all standards >95%) were purchasedfrom Dr. Ehrenstorfer Laboratory (Augsburg, Germany). Thetriphenyl phosphate (TPP, 20 mg/mL) as the internal standardwas obtained from Sigma-Aldrich (Steinheim, Germany). ForGC-μECD/NPD analysis, each stock standard solution wasprepared at various concentrations (at range 100–250 mg/mL) in acetone and stored in dark below 4 °C (for GC/MS/MS at 100 mg/mL). Standard working solutions of multi-compounds were prepared by dissolving the appropriateamounts of each stock solution in n-hexane/acetone (9:1,v/v) mixture. The stock and working solutions were stored incompletely filled vials, closed with parafilm at −20 °C untilthe time of analysis.
Soil samples
Blank soil samples previously check for the presence of pes-ticides, for the method optimization and validation were used.Soils were collected with a stainless steel scoop in depth be-tween 0 and 20 cm from the field located from the vicinity ofBialystok (53°07′ N latitude and 23°09′ E). The soil sampleswere stored in PE bags at 4 °C away from light. Soil sampleswere homogenized, sieved (2-mmmesh) and air-dried at roomtemperature before their use. The physicochemical character-istics of soil are the following: textural class—loamy sand,organic matter 1.45%, pH 6.6, % silt 22.45 (0.002–0.05 mm), % sand 75.32 (0.05–2 mm), and % clay 2.43(<0.002 mm).
Sample preparation
Representative portions of soil (500 g) was air-dried at about40 °C and then sieved through a mesh with a grain size of2 mm. They were stored at room temperature until analysis.
Five grams of homogenized soil sample and 10 mL of coldpurified water in a 50 mL polypropylene centrifuge tube werehand shaken for 1 min to hydrate the samples and allowed tostand for 10 min. Ten milliliters of 1% formic acid in acetoni-trile and 100 μL of internal standard solution TPP (in the caseof GC/MS/MS) were added and the sample was vortexed for7 min. A salt mixture, 4 g MgSO4, 1 g NaCl, 1 g trisodiumcitrate dihydrate (Na3C6H5O7•2H2O), and 0.5 g disodium hy-drogen citrate sesquehydrate (Na2HC6H5O7•1.5H2O), wasadded. The tube was immediately shaken for 1 min to preventformation of crystalline agglomerates during MgSO4 hydra-tion and vortexed for 5 min at 4500 rpm. The tube was placedin the −60 °C freezer for 30 min and let the supernatant reachroom temperature. Two milliliters of extract were transferredinto a flask and acidified with 20 μL of 1% formic acid inacetonitrile. Two droplets of dodecane were added. The ex-tract was evaporated at 40 °C in a rotary evaporator to near
dryness. The residue was dissolved in 2 mL n-hexane/acetone(9:1, v/v) and was filtered through a 0.45 μm nylon filter to anautosampler vial and subsequently analyzed via GC/MS/MS.
Vortex-Mixer (Velp Scientifica, Usmate, Italy) and Rotina420R (Hettich, Tuttlingen, Germany) were used in sampleextraction.
GC/MS/MS analysis
The analysis was performed by GC/MS/MS: an Agilent7890A GC system (Agilent Technologies, Palo alto, CA,USA) was equipped with an Agilent 7693 autosampler andwas coupled to a triple quadrupole mass spectrometer 7000B(Agilent Technologies) and operated in electron ionizationmode (EI −70 eV). Splitless injection of a 2-μL sample wasseparated by an HP-5 MS capillary column ((5%-phenyl)-methylpolysiloxane; 30 m × 0.25 mm ID and film thicknessof 0.25μm;Agilent Technologies). The oven temperature wasprogrammed as follows: 70 °C (2 min hold) to 150 °C at a rate25 °C/min−1, increased to 200 °C at 3 °C/ min−1, and finally to280 °C at 8 °C/min−1 and held for 10 min. Helium (99.9998%purity) was used as the carrier gas at a constant flow rate of2.1 mL/min−1. The total running time was 41.88 min. Thetemperatures of the transfer line, the ion source, first quadru-pole, and second quadrupole were 280, 300, 180, and 180 °C,respectively. Helium (99.9998% purity) and nitrogen(99.9998% purity) were collision gases at a flow rate of 2.25and 1.5 mL/min−1, respectively. MassHunter quantitativeanalysis software (version B.06.00) (Agilent Technologies)was used for data processing. MRM transitions and other ac-quisition parameters can be found in Table S1.
GC-μECD/NPD analysis
Pesticides were analyzed by using an Agilent (Waldbronn,Germany) model 7890 A gas chromatograph (GC) equippedwith micro-electron capture (μEC) and nitrogen phosphorus(NP) detectors. A capillary column HP-5 ((5%-phenyl)-meth-ylpolysiloxane; 30 m × 0.32 mm ID and film thickness0.25 μm, Agilent Technologies) were used. Chemstationquantitative analysis software (version A.10.2) (AgilentTechnologies) was used for data processing. The injectorand detector temperature were set at 210 and 300 °C, respec-tively. The oven temperature was programmed as follows: 120to 190 °C at a rate 16 °C min−1, increased to 230 °C at8 °C min−1, and finally to 285 °C at 18 °C min−1 and heldfor 10 min. Helium (99.9998% purity) was used as carrier gasat a flow rate of 3.0 mL min−1. Nitrogen (99.9998% purity) asa make-up gas at a flow rate of 57 mL min−1 (for EC) and8 mL min−1 (for NP) was used. Hydrogen (99.9998% purity)and air (99.9998% purity) (for NP) gas flows were set at 3.0and 60 mL min−1. Two microliters of the sample extract was
7126 Environ Sci Pollut Res (2017) 24:7124–7138

injected in splitless mode (purge-off time 2 min). Total time ofanalysis is 25 min.
Method validation
Soil samples, free of pesticides, were used for this study. Themethod validation was performed using the following param-eters: accuracy (expressed as recovery), precision (expressedas RSD), linearity (expressed as R2), limit of quantification(LOQ), and uncertainty according to the European Unionguideline SANCO (SANCO 2013).
The method accuracy and precision were evaluated byperforming recovery studies. Precision was expressed as rela-tive standard deviation (%RSD). Accuracy was expressed asand recovery. Three different levels have to be analyzed(LOQ, 10 × LOQ, 100 × LOQ) with five replicates for eachlevel on five different days. After homogenization, matrixblanks were spiked with the pesticide standard mixture andequilibrated for 30 min at room temperature prior toQuEChERS extraction to allow the pesticides to be incorpo-rated into the soil matrix.
Linearity was studied by analyzing matrix-matched stan-dards at five concentration levels. The range of analyzed con-centrations was within the range of LOQ to 100 × LOQ. TheLOQ for each pesticide was defined as the lowest spikinglevel meeting the requirement of recovery and RSD for differ-ent fortification levels. Expanded measurement uncertaintieswere estimated using a Btop-down^ empirical model accord-ing to the data obtained in the validation study (coverage fac-tor k = 2, confidence level 95%).
For special group of pesticides (pyrethroid insecticides),the quantification of these compounds was performed by sum-ming the peak areas of their isomers. They contain two orthree chiral centers, making them a family of pesticides withstereoisomers. Therefore, multiple peaks were observed forseveral of the pyrethroids, corresponding to the separation oftheir diastereoisomers. Deltamethrin, difenoconazole,dimethomorph, esfenvalerate/fenvalerate, lambdacyhalothrin, permethrin, tau fluvalinate, and tetramethrin wereresolved using two peaks, while four peaks were observed forcypermethrin and cyfluthrin (Li et al. 2012).
Matrix effect and process efficiency
Initially, all of the procedures were evaluated in terms of ME,by comparison between the areas of standard in the extract andthe standard in the solvent, as shows equation:ME (%) = (areaof the standard in matrix/area of the standard in the sol-vent) × 100. The ME near to 100% indicated no influencefrom the matrix, while out of the range 80–120% showedsignificant matrix effect. For the validated method, using pro-cedure without cleanup, the ME was calculated as follows:ME (%) = [(slope in matrix/slope in solvent)−1] × 100.
Negative values of matrix effects signify suppression of thesignal, and positive values signify enhancement. For betterunderstanding of the results, the values were categorized intothree groups: (i) soft matrix effect <±20%, (ii) medium >±20and <±50%, and (iii) strong >±50%. Values <20% indicatednoME or its insignificance, and values >20%were consideredas a high ME.
The process efficiency (PE) evaluates the overall perfor-mance of the extraction method. The PE was calculated asfollows: PE = (R × ME)/100. PE values near 100% indicatedrecoveries and low matrix effect (Arias et al. 2014).
Statistical analysis
PCA was performed to explain the relationships betweenphysicochemical parameters and matrix effect of 216 pesti-cides and metabolites in complex soil matrices. Data werestatistically evaluated by PCA using Statistica version 11.0software (StatSoft).
Results and discussion
Comparison of soil sample preparation and choiceof the optimum method
This study presents modification of one of the most widelydescribed multi-residue methodologies —QuEChERS ap-proach, which has many advantages including speed, cost,and ease of use; good performance characteristics; and wideapplicability range (matrices and analytes).
Volume of water, solvent volume and polarity, and cleanupsorbents (C18, GCB, PSA), which are parameters affectingthe extraction efficiency, were optimized to get the Bcleanest^matrix. The QuEChERS with and without purification stepwere applied to estimate effectiveness of the method.
The first step for modification is based on added water todry soil samples before extraction. Soil samples belong tomatrices with low-moisture matrices. The originalQuEChERSmethod was designed for samples with more than75% moisture and for products with a water content lowerthan 25%; the QuEChERS method has been modified(Cajka et al. 2012). According to Cajka et al. (2012), addingwater to the sample is a key to achieve maximum extractionyield and accurate results. Therefore, choice of appropriatevolume of cold water was tested. Additionally, cold water thatis used to compensate the heat generated when magnesiumsulfate is added to sample during extraction (an exothermicreaction); this helps to protect heat-sensitive pesticides. Thetested water dosages were 5, 7.5, and 10 mL. It was not pos-sible to use the same amount of water (5 mL) as sample (5 g)because of the complete absorption of the whole volume ofwater by the soil. For about 40% of the tested compound better
Environ Sci Pollut Res (2017) 24:7124–7138 7127

recoveries were obtained when the soil was hydrated with10mL of water for 5 g soil. Some authors have tested differentratios (sample:water) and compared the recoveries obtainedwith various volumes of water addition (Radish et al. 2010;Correia-Sá et al. 2012; Fernandes et al. 2013). The resultsconfirmed the importance of the hydration step for the successextraction of the analytes.
The proposed residue analysis covered the wide range ofpesticides; therefore, the appropriate conditions of extractionand isolation must be ensured.
One of the critical steps and the most important parametersto optimize is choice of extraction solvent. In extraction oftarget pesticides from solid sample, the extraction solventmust be characterized by a high dissolving ability for pesti-cides and good permeability into the matrix, especially for drysamples (Kolberg et al. 2011). Therefore, three solvents forextraction (sorted in order of increasing polarity index, PI):EtOAc (PI 4.4), acetone (PI 5.1), and AcN (PI 5.8) were used.These solvents were chosen, because they are commonly usedfor multi-residue analysis for a wide range of pesticides indifferent food matrices such as fruit and vegetables (Molet al. 2007), olive (Moreno López et al. 2014), sugar beets,and beet molasses (Łozowicka et al. 2016). The extraction ofacetone or EtOAc gave similar recoveries and 25% of alltested compounds have unsatisfactory values. More polarcompounds (e.g., azoxystrobin 69 → 106%, dicrotophos65 → 85%, methamidophos 59 → 79%, propoxur 72 →85%) showed recovery increase when the AcN was used incomparison to acetone/EtOAc. Acetonitrile was selected be-cause it yielded acceptable extraction efficiency in a widerange of pesticides. Finally, for extraction, 10 mL of 1%formic acid in acetonitrile was added.
Additionally, addition of the internal standard (TPP) to thesamples after the extraction solvent allows to control the entireanalytical process what contributes to minimization of theerror generated in the multiple steps and improves precisionand accuracy.
Pesticides such as base- and acid-sensitive which requirespecial pH were within the scope of this analysis. Therefore,pH is a very important parameter in the stability of severalbase-sensitive, e.g., captan (76%), dichlofluanid (65%),dicofol (85%), folpet (68%), and tolylfluanid (68%) and it isalso critical for acid-sensitive pesticides, e.g., amitraz (75%)and carbosulfan (73%). Therefore, by adding the citrate buff-ering salts, the samples obtained pH values between 5.0 and5.5. This pH range was a compromise, between the quantita-tive extraction and protection of alkali and acid-labilecompounds.
The most important task of extraction is not only transfer-ring interested analytes from the matrix to the extraction sol-vent but also reducing the co-extracted components of matrixas far as possible, because this background may negativelyaffect the ruggedness of the GC analysis. Therefore, the parts
of co-eluting compounds were separated from the extracts to alarge extent by putting them in the freezer (−60 °C) for 30min.
The need for further purification stepwas examined and theresults were compared to those without cleanup. Cleanup stepwas necessary in preparation of complex matrices such as soilto reduce interferences, improve quantification, and do notdisturb the signal on the chromatographic system.
Therefore, in this work efficiency of removal of impuritiesby three kinds of d-SPE adsorbents was tested. Octadecylsilane(C18) is a nonpolar sorbent that effectively traps and removestrace amounts of lipids, starch, sugar, and other interferences ashumic substances. Primary-secondary amine (PSA) is a weakanion exchange sorbent that removes sugars a fatty and otheracids. Graphitize carbon black (GCB) is used for removal ofpigments.
To remove residual water, PSA sorbent with anhydrousmagnesium sulfate (MgSO4) and their mixtures with GCBor/and C18 were applied. The sorbents were the following:
1. 20 mg anhydrous MgSO4 + 10 mg PSA,2. 20 mg anhydrous MgSO4 + 25 mg PSA + 25 mg C18;3. 20 mg anhydrous MgSO4 + 25 mg PSA + 2.5 mg GCB;4. 20 mg anhydrous MgSO4 + 30 mg PSA + 25 mg C18 +
2.5 mg GCB.
PSA was used in each variant. PSA is the most commonsorbent used and can act both as a polar phase and weak anionexchanger with the ability to remove a lot of matrix co-extractives (Kinsella et al. 2009). Addition to the extract ofPSA increases the pH of the extracts, reaching values above 8.This compromises the stability of base-sensitive pesticides(e.g., captan, chlorthalonil, and folpet). On the other hand,degradation of acid-labile pesticides (e.g., amitraz,carbosulfan) was reduced sufficiently by acidifying the ex-tracts quickly up to pH ~5 by adding 1% formic acid in ace-tonitrile. This step allowed storing the extracts for several daysat room temperature without the occurrence of unacceptablelosses of most pesticides, particularly for acid-labilepesticides.
The useful parameter to assess the effectiveness of the pu-rification step is recovery and matrix effect (ME). TheEuropean Union guideline SANCO (SANCO 2013) as theacceptance criteria of the validation parameters of the methodwas adopted to procedure, according to which the averagerecovery should be in the range 70–120% with RSD less orequal 20%. A practical default range of 60–140%may be usedfor individual recoveries in routine analysis. Recovery andmatrix effect were studied using MS/MS and μECD/NPDdetection.
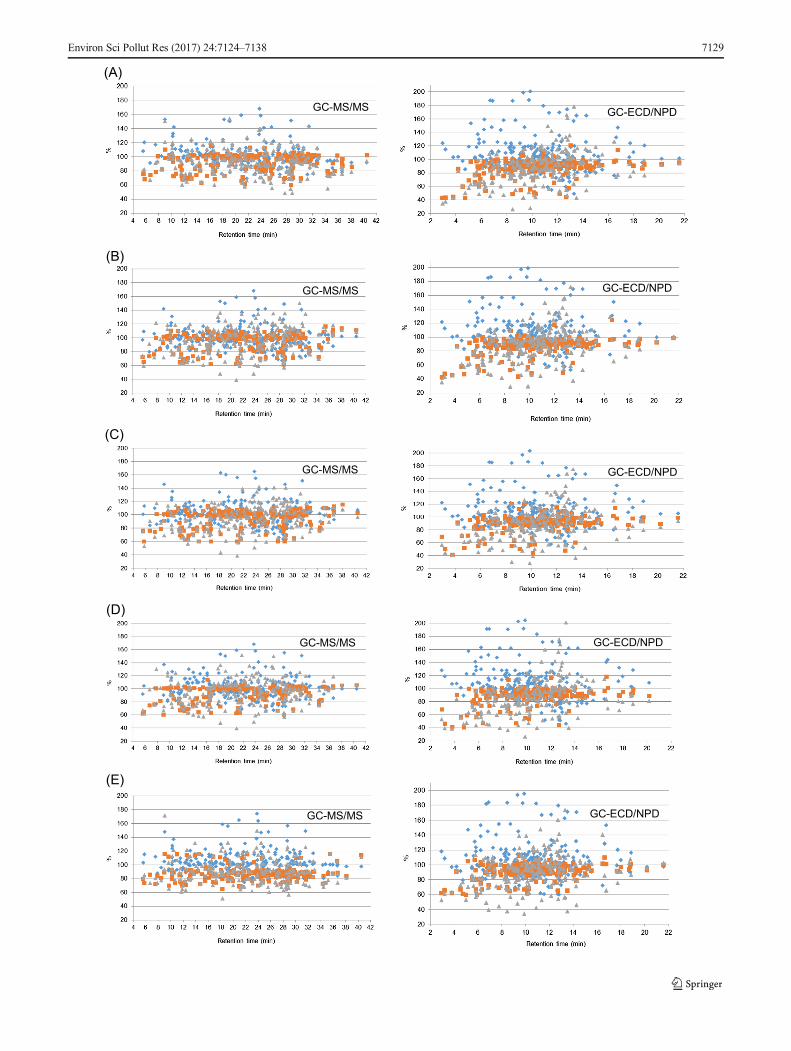
In the first variant (A), as is presented in Fig. 1a, the num-ber of pesticides with satisfactory recoverywas obtained usingPSA sorbents (95%, 91% analysis by GC/MS/MS andGC-μECD/NPD, respectively) as well as in combination with
7128 Environ Sci Pollut Res (2017) 24:7124–7138
(A)
(B)
(C)
GC-MS/MS
GC-MS/MS
GC-MS/MS GC-ECD/NPD
GC-ECD/NPD
GC-ECD/NPD
(D)
(E)
GC-MS/MS
GC-MS/MS GC-ECD/NPD
GC-ECD/NPD
Environ Sci Pollut Res (2017) 24:7124–7138 7129

C18 (variant B). This sorbent also ensured the best matrixeffect values. Matrix effect in the range 80–120% showed77% of tested compounds in MS/MS and μECD/NPDdetection.
The use of nonpolar sorbents such as the octadecyl (C18)with combination with PSA (variant B) during cleanup gavesatisfactory recoveries for the most of the target compoundsanalyzed by GC/MS/MS and GC-μECD/NPD (95%, 91% oftested compound, respectively) (Fig. 1b). For this combina-tion recoveries did not reach the expected range 60–140% for12 substances and 25% of analyzed pesticides showed MEoutside the acceptable range.
In the variant C and D based onGCB addition, about 5% ofpesticides had very low recovery values (Fig. 1c, d). Fourteenof the compounds had unacceptable recoveries when the com-bination with PSA and 11 with PSA + C18 was used. The useof GCB retained some planar pesticides (e.g., captan,chlorothalonil, dichlobenil, dichlorvos, dichlofluanid, folpet,methacrifos, imazalil, thiabendazole, and tolylfluanid) andthus sorbent was not used in the further cleanup. In addition,the matrix effects for about 23% of pesticides (above 120%)signified strong enhancement of the chromatographic signaldetermined by GC/MS/MS and GC-μECD/NPD.
Similarly, the effectiveness of QuEChERS method withoutpurification was estimated.
The procedure without the cleanup step gave very goodrecoveries (70–120%) for almost all tested compounds expectfive pesticides using GC/MS/MS and 17 using GC-μECD/NPD with recoveries between 60 and 69% (RSD 1–17%and 1–19%, respectively) (Fig. 1e). It is evident that matrixeffects of the QuEChERS method without cleanup step aregenerally less pronounced (%ME closer to 100%) than matrixeffects for the QuEChERS method when sorbents are used.Only 13% tested substances showed ME values insignificant-ly outside the range of 80–120%.
The use of different sorbents did not have a significantinfluence on the recovery of pesticides from the extracts.
Similarly, Caldas et al. (2011) and Wang et al. (2012) stud-ied PSA and C18 sorbents for soil sample cleanup and provedthat they did not have a significant influence on the purifica-tion and recovery of analytes from the extract.
Process efficiency
Another useful parameter in assessing the effectiveness ofcleaning by PSA and its combinations of a purification stepand without cleanup step and help to choice the most appro-priate method was process efficiency (PE) introduced by
Varga et al. (2011). PEwas evaluated in order to obtain a directrelationship between the recovery of the analytes and matrixeffect.
PE was calculated and compared for QuEChERS methodwithout and with cleanup step for all tested sorbents (Fig. 1).Generally, the signal enrichment due to the ME (e.g.,azaconazole, isoprocarb, imazalil) usually increases the PE(e.g., bifenazat, fipronil, iprodione). QuEChERS methodwithout purification had more compounds within the range80–120% and satisfactory results were obtained for the 64%of tested pesticides.
Basing on optimal parameters such as recovery, matrix ef-fect and summering process efficiency QuEChERS methodwithout cleanup was chosen as the most efficient method.Additionally, an advantage of this procedure without cleanupis more practical due to consumption of less solvent and ewerreagents in comparison with method including purificationstep.
Method validation
The optimized analytical method without cleanup step for 216pesticides and metabolites in soil using MS/MS and μEC/NPD detection was evaluated. Different parameters such asaccuracy (expressed as recovery), precision (expressed asRSD), linearity (expressed as R2), LOQ, and uncertainty weredetermined. Validation parameters obtained in this study areshown in Supplementary data Table S2.
Recovery and precision of the proposed method for allpesticides at three spiking levels (LOQ, 10 × LOQ,100 × LOQ mg/kg) in five replicates were performed. In thecase of MS/MS detection, the recoveries for almost all pesti-cides (without five 65–69%) were satisfactory and rangedfrom 71 to 120% (RSD 1–17%). Contrary to μECD/NPDdetection, 17 analytes which showed 60–69% with acceptableother validation parameters (RSD 1–18%). In both systems ofdetection, for some planar compounds such as captan,dichlofluanid, folpet, thiabendazole, and tolylfluanid, low re-coveries between 63 and 69% were obtained. For instance,captan and folpet are prone to degradation during samplepreparation and GC injection; thus, it could be the possiblereason for their relatively poor analytical performance.However, other validation parameters were satisfactory(RSDs of <20% were acceptable) (SANCO 2013).Moreover, dichlobenil, dichlorvos, diphenylamine, andmethamidophos analyzed by selective detectors μECD/NPDshowed recoveries in the range 60–66%. In both MS/MS andμECD/NPD detection, general tendency of higher RSDvalues at low spiking concentrations equal LOQ wasobserved.
Linearity was assessed using matrix-matched calibrationsolutions at five concentration levels, LOQ, 2 × LOQ,10 × LOQ, 50 × LOQ, and 100 × LOQ for each pesticide.
�Fig. 1 Recoveries, matrix effects, and process efficiency of pesticidesfrom varying d-SPE cleanup conditions using GC/MS/MS and GC-μECD/NPD: a MgSO4 + PSA, b MgSO4 + PSA + C18, c MgSO4 +PSA + GCB, d MgSO4 + PSA + C18 + GCB, and e without cleanup
7130 Environ Sci Pollut Res (2017) 24:7124–7138

LOQ was set at the lowest spiking concentration and waswithin the range 0.005–0.01 mg/kg for MS/MS and 0.005–0.05 mg/kg for μECD/NPD, showing that detector MS/MSused in analysis was more sensitive than μECD/NPD.Linearity of both system of detector response was similarand found for all pesticides at concentrations within the testintervals, with the linear regression coefficients (R2) higherthan 0.99.
The expanded measurement uncertainties were establishedusing a Btop-down^ empirical model and their values rangedfrom 10 to 28% and from 16 to 30% (coverage factor k = 2,confidence level 95%) by using MS/MS and μECD/NPD,respectively. This is distinctively less than the maximumthreshold value of 50% recommended by European Unionguidelines (SANCO 2013), demonstrating suitability of theoptimized and validated method.
The proposed instrumental method (μGC-ECD/NPD)allowed for the determination of pesticides in soil byGC with two selective detectors functioning simultaneous-ly. In the presented work, we used configuration with aBY^ piece at the end of the GC column in order to dividethe flux at the end of the GC column into two branchesof equal flow (one to the NPD and the other to the ECD),thus allowing pesticides of different nature to be quantifiedin the same run; 180 pesticides were detected by theECD, whereas 179 were analyzed by NPD, althoughECD and NPD also provided a discernible signal for143 of them (Łozowicka et al. 2015).
Matrix effect
The challenging task in this study was to estimate thevariability of matrix effects for 216 representative pesti-cides and metabolites in soil samples extracted usingQuEChERS method without cleanup for MS/MS andμECD/NPD analysis. Matrix interferences are one of themajor problems of pesticide residue analysis in differentmatrices because it can suppress or enhance the chromato-graphic signals (Kruve et al. 2008, Zhang et al. 2011).These effects may result in low or high analyte recoveries,respectively. This problem may be omitted by preparingmatrix-matched standards instead of pure solvent, whichwas presented in this work.
Matrix effects for almost all pesticides analyzed by MS/MS and μECD/NPD detection exhibited enhancement morecommon than suppression. It is typical for the GC to ob-serve an enhancement effect resulting from blocking of ac-tive column sites by matrix components; thus, more pesti-cide particles can reach the detector (Anastassiades et al.2003). In GC/MS/MS, the signal enhancement was ob-served for 65% analyzed pesticides and in GC-μECD/
NPD for 55%. Results from the evaluation of the ME underthe optimized QuEChERS conditions MS/MS and μECD/NPD detection are presented in Table S2. However, not allthe compounds were equally vulnerable to enhancement.For example, bifenthrin and iprodione eluted with the sameretention time but the first compound exhibited 9% (MS/MS) and 13% (GC-μECD/NPD) enhancement whereas thesecond −25% (GC/MS/MS) and −39% (GC-μECD/NPD)was suppressed.
In the soil extracts analyzed by MS/MS, 87% pesticidesexhibited MEs lower than ±20%; 10.6% showed a mediumME with values ranging from −25 to −21% and 21 to 49%,only six pesticides showed a strong ME (bromacyl, dicofol,dimoxystrobin, imazalil, p,p DDE, and thiabendazole).Imazalil showed the greatest ME value of 74%.
ApplingμECD/NPD detection for analysis, 74% pesticidesshowed a soft ME; 36 pesticides had values ranging from −45to −21% and from 21 to 47% and the remaining 17 pesticidesshowed a strong ME. Thiabendazole exhibited the greatestsignal enhancement of 96%.
Generally, for MS/MS detection, values of ME were small-er than those found with μECD/NPD. This finding wascorresponded for several pesticides including acetamiprid,amitraz, carbofuran, chlorothalonil, cyproconazole, dicloran,esfenvalerate/fenvalerate, fenhexamid, flufenacet, fostiazate,fuberidazole, permethrin, pencycuron, and triticonazole(Fig. 2). Probably, the interferences and background noisewere reduced by the use of a more sensitive MS/MS system.
The rule of suppression or enhancement for the mostanalytes in MS/MS and μEC/NP detection was observed ex-cept for the group of 37 compounds (17%, e.g., EPN, endrin,fenarimol, kresoxim-methyl, mevinphos, oksadiksyl,propiconazole, and triazophos (Table S2)).
For instance, alpha, beta, and sulfate endosulfane; dichlor-vos; methamidophos; oxyflurofen; and oxamyl showed posi-tive matrix effects, in contrast to bupirimate, dichlobenil,etaconazole, propham, trifloxystrobin with negative matrixeffects using MS/MS and μEC/NP detection.
Similarly, other authors also found that ME was a majordrawback for quantitative trace determination of pesticides insoil samples, so they used matrix-matched calibrations(Radish et al. 2010; Correia-Sá et al. 2012). Fernandes et al.(2013) observed ME for 12 pesticides (α- and β-HCH, HCB,endrin, o,p-DDT, bupirimate, chlorpyrifos, fludioxonil,iprodione, malathion, methiocarb, and pendimetaline) from agroup of 36 pesticides. In this study, ME was confirmed onlyfor iprodione among the tested compounds listed above(−25% MS/MS and −39% μECD/NPD). Asensio-Ramoset al. (2010) observed significant ME for 11 pesticides(buprofezin, chlorpyrifos, chlorpyrifos-methyl, diazinon,dimethoate, ethoprofos, fenirothion, malaoxon, malathion,
Environ Sci Pollut Res (2017) 24:7124–7138 7131

and phosmet) and in this study no ME was achieved for thesesubstances.
In order to better understand the matrix effect in themethod without cleanup, correlations between selected pa-rameters (molecular mass, log P, log S, and log V.P.) ofthe pesticides (EU Pesticides database) and MS/MS andμECD/NPD analyte responses were found applying aPCA.
The first four principal components summarized about81.86% of the available information (the loadings associatedwith principal components with eigenvalues larger than 1were as follows: PC1 49.08%, PC2 15.93%, PC3 9.65%,and PC4 7.20%). PC3 and PC4 eigenvalues were relativelysmall. The first PC1 and the second principal component PC2described more 65% of the variation and were further ana-lyzed according to scree plot showing Belbow^ on graph afterPC2 (Fig. 3).
Figure 4 presents score and loading plot of the first (PC1)vs. second principal component (PC2). The compounds hav-ing the highest PC1 scores were bifenazat (ID 12; 2.01%),bromacyl (16; 4.08%), dicloran (51, 2.02%), dicofol (52,3.14%), dimoxystrobin (60, 4.72%), flufenacet (91; 3.25%),fuberidazol (102; 2.03%), imazalil (112; 7.15%), iprodione(115; 2.23%), isoprocarb (120; 2.93%), and thiabendazole(204; 7.69%).
The correlations between the matrix effect of 216 pesti-cides and their physicochemical parameters were found andthe groups of pesticides with similar properties were defineddividing them into seven clusters (Fig. 4). The ID number ofeach pesticide is given in Supplementary Table S2.Interpreting the scores and loadings, the pesticides were cate-gorized into cluster: (C1) with high matrix effect value deter-mined by GC/MS/MS (about 150–160%) (e.g., 16, 52, 60,112, 120, 204); (C2) highly polar with negative logP (e.g.,7, 8, 15, 19, 30, 56, 58, 62, 65, 71, 127, 130, 131, 137, 143,149, 150, 165, 170, 180, 184, 188, 206, 209 with exception34, 36, 50, 57, 109, 135, 138, 141, 185, 126, 173, 179, 180with low value of logP < 1.3); (C3) with logP > 3 (e.g., 21, 24,28, 63, 73, 79, 81, 83, 95, 103, 132, 162, 168, 169, 172, 178,182, 190, 194, 195, 198, 200, 202, 216, 210, except 10, 133,171); (C4) with high matrix effect value determined by GC/EC/NP (e.g., 27, 42, 51, 80, 91, 101, 102 with ME = 180–190%; 5, 31, 32, 53, 69, 158, 160, 214, 212 with ME = 130–160% and 37, 45, 154, 176, 193 with ME = 110–130%); (C5)with molecular mass >300 g/mol (e.g., 11, 12, 14, 20, 22, 49,59, 68, 77, 78, 85, 87, 98, 115, 116, 136, 145, 175 except 48,90 with M below 300 g/mol); (C6) very soluble (e.g., 2, 9, 18,74, 88, 92, 100, 121, 123, 134, 140, 147, 159, 215 except 3,193) and (C7) with ME 50–90% on GC/EC/NP (e.g., 1, 24,29, 75, 117, 163, 181, 183, 186, 189).
Fig. 2 Matrix effect (ME %) forselected pesticides obtained byoptimized QuEChERS method
7132 Environ Sci Pollut Res (2017) 24:7124–7138

The dominant variables influencing the matrix effectwere polarity and solubility of pesticides concentratingthe largest number of compounds. Thus, red cluster in-cluding C3 + C6 and other compounds were separatedconsisting of highly soluble (Sw > 4 mg/l) and nonpolar(logP > 3) pesticides.
In summary, both the matrix effect and recovery dependedon applied detection system. Additionally, gas chromatogra-phy with selective detectors offers only limited specificity anddoes not provide unambiguous identification. Therefore, tan-dem mass spectrometry in conjunction with gas chromatogra-phy is a very powerful combination for identification ofanalytes in the soil extract. The selection of three transitions,one for quantification and two for confirmation, gives excel-lent selectivity and sensitivity and the possibility of safe iden-tification (Table S2).
Quality control procedure
Certified Reference Material (CRM, ERA—A WaterCompany) was used to verify accuracy of the proposed pro-cedure for the quantitative determination of variety range ofpesticides in soils. Certified values of CRMwith uncertaintieswere compared with the values obtained from the analysis ofsoil samples using QuEChERS method without cleanup ana-lyzing by GC/MS/MS and GC-μECD/NPD (Table 1).
The results for carbaryl, carbofuran, and propham obtainedin two systems of detection were very comparable to theassigned true concentrations, within the interlaboratory
uncertainty intervals. Overall, the results were in acceptancevalue; moreover, the GC/MS/MS results are a bit higher thanthe GC-μECD/NPD, in correspondence with reported respec-tive lower recoveries (70, 73, and 67% for GC-μECD/NPDand 75, 79, 84% for GC/MS/MS).
Application to real sample
The results of the method were applied to 263 soil samplesfrom the north-eastern Poland collected in 2015 are in Table 2.Of the samples, 58.2% (153) were found pesticide residues.Pesticides like organochlorines banded in Europe as plantprotection products were detected in soil samples, due to theirpersistence in the environment. P,p’ DDT (23.5% of positivesamples) and p,p’ DDE (17% of positive samples) were themost frequently detected. The highest concentration wasfound for pendimethalin (1.63 mg/kg). The recovery factorswere used for calculating pesticide concentration only in thecase of pesticides that indicate recoveries outside the range70–120% (within the range 60−69% and 121−130%)(SANCO 2013).
Typical chromatograms of real sample extract that containthree pesticide residues chlorpyrifos, epoxiconazole, andtebuconazole using GC/MS/MS and GC-μECD/NPD areshown Fig. 5.
Therefore, the objective of this study is relevant to moni-toring research of pesticide residues by innovative and conve-nience of QuEChERS method for the determination of over210 compounds.
Fig. 3 Scree plot graphpresenting the eigenvalue againstthe component number
Environ Sci Pollut Res (2017) 24:7124–7138 7133

Table 1 Results of analyzedpesticides by QuEChERSwithoutcleanup method using the gaschromatography with MS/MSand EC/NP detection and value ofCertified Reference Material
Activesubstance
Certified value (mg/kg) ± uncertainty (%)
Acceptance limits(mg/kg)
Laboratory results ± U (mg/kg)
μECD/NPD MS/MS
Carbaryl 0.870 ± 0.652 0.416–0.957 0.653 ± 0.1241 0.726 ± 0.1116
Carbofuran 2.060 ± 0.668 0.793–2.390 1.012 ± 0.2948 1.452 ± 0.2755
Propham 0.886 ± 5.620 0.211–1.220 0.438 ± 0.0919 0.668 ± 0.1002
l o g V plo g P
-1,0 -0,5 0,0 0,5 1,0
PC1 : 49.08%
-1,0
-0,5
0,0
0,5
1,0
PC
2 : 1
5.93
%
P e s t i c id e
M
S w
v.0 A
v.0 B
v.1 Av.2 A
v.2 B
v.3 B
v.4 B
v.4 A
v.3 A
v.1 B
51
5466
102
-15 -10 -5 0 5 10 15
PC1: 49.08%
-6
-4
-2
0
2
4
6
PC2:
15.
93%
2
3
6
15 24
3034
35
37
38
41
44
45
47
48
50
55
5657 58
64
65
67
77
78
82
83
88
9092
93
100
109
110
122126
128
130
131
134
138
140
141146
151
156
161
162
164
169171
172180
182
185190191
193
194
197 198
203
206
211
212
213
215
-3 -2 -1 0 1 2 3
-1,2
0,0
1,2
4
10
11
13
1417
18
20
21
22
2325
26
28
33
34
39 40
46
54
59
616365
66
70
7172
73
74
7981 83
84
85
868994
9596
97
98
99
103104
105106107108
110
111
113
114
116
121
123124
125
129
130 132 133
139144
147148
152
153155
157
159
164
167168 171172
173
174
177
178180
182
192
194195
196199
200
201
202
205
207208
210
211
212
216
126
185137 76
91
5
7
8
12
1619
20
24
27
29
31
32
36
3742
43
48
49
52
53
54
60
62
68
69
71
75
77
80
87
91
101
112
115
117118 119
120 135
136
137
142143
145
149
150
151154
158
160
163
165
170
173
175
176
179
181
182
183184
185
186
187188
189
193
204
209
212
214
166
C1
C2 C7
C5
C6
C4
C3
Fig. 4 Score and loading plot ofthe first (PC1) vs. second princi-pal component (PC2)
7134 Environ Sci Pollut Res (2017) 24:7124–7138

Conclusions
The influence of modifications of QuEChERS on recoveryand matrix effect during the multi-residue analysis of widerange of pesticides in soil was compared.
For the first time for sensitive identification and determina-tion, a broad scope of pesticides and metabolites (216) in soilsamples using gas chromatography (GC) coupled with tandemmass spectrometry (MS/MS) and dual system electroncapture/phosphorous-nitrogen detectors (μECD/NPD). Itwas a very challenging task, because soil is a complex matrixand compounds are characterized by great structural variabil-ity and physicochemical properties, which cause many analyt-ical problems.
The optimal validation parameters for procedure with-out cleanup step were obtained and this modificationallowed for gently reducing the time of analysis.Nevertheless, validation parameters for gas chromatogra-phy coupled with mass spectrometry fulfilled the criteria
of pesticide residue guide largely than selective systemof detection μECD/NPD for several pesticides. Theanalysis covered a wide range of pesticides and maybe used single and complementary.
For the QuEChERS method without cleanup, recov-eries for 216 pesticides and metabolites were satisfacto-ry; they ranged 65–116% (RSD ≤17%) and 60–112%(RSD ≤18%) for MS/MS and μEC/NP, respectively.GC/MS/MS gave smaller matrix effects showing sup-pression or enhancement in the range (−25 to 74%),contrary to μEC/NP (−45 to 96%).
For better understanding on matrix effect PCA anal-ysis, a powerful statistical tool was used. The correla-tions between the selected physicochemical properties of216 pesticides and metabolites were found and the keyparameters influencing the matrix effect were polarityand solubility of pesticides.
Compared to other works involving pesticide residue anal-ysis in soil, the proposed QuEChERS method has
Table 2 Pesticide residues foundin soil real samples (total 263samples)
Pesticide (category) No. and frequency
of positive samples (%)
LOQa
(mg/kg)
Concentration range
(mg/kg)
Min Max
Acetochlor (H) 2 (0.3) 0.005 0.04 0.12
Azoxystrobin (F) 1 (0.2) 0.005 0.03
Boscalid (F) 2 (0.3) 0.005 0.07 0.12
Bupirimate (F) 2 (0.3) 0.005 0.01 0.03
Chlorpyrifos (I) 14 (2.4) 0.005 0.01 0.27
Cypermethrin (I) 2 (0.3) 0.005 0.01
Cyprodinil (F) 2 (0.3) 0.005 0.01 0.08
p,p’ DDD (I) 16 (2.7) 0.005 0.003 0.037
p,p DDE (I) 101 (17.0) 0.005 0.003 0.055
o,p’ DDT (I) 7 (1.2) 0.005 0.003 0.042
p,p’ DDT (I) 140 (23.5) 0.005 0.003 0.265
Epoxiconazole (F) 4 (0.7) 0.005 0.02
Fenazaquin (A) 1 (0.2) 0.005 0.03
Fludioxonil (F) 1 (0.2) 0.005 0.03
Lenacil (H) 11 (1.9) 0.005 0.02 0.75
Methoxychlor (DMDT) (I) 2 (0.3) 0.005 0.01
Napropamide (H) 5 (0.8) 0.005 0.03 0.06
Oxyflurofen (H) 1 (0.2) 0.005 0.14
Pendimethalin (H) 19 (3.2) 0.005 0.01 1.63
Spirodiclofen (A) 3 (0.5) 0.01 0.02
Simazine (H) 3 (0.5) 0.005 0.01 0.03
Tebuconazole (F) 1 (0.2) 0.005 0.02
Tetraconazole (F) 6 (1.0) 0.005 0.01
H herbicide, F fungicide, I insecticide, A acaricidea Limit of quantification (GC/MS/MS)
Environ Sci Pollut Res (2017) 24:7124–7138 7135

considerable superiorities in respect of target number, sampleextraction procedure, and method validation.
In conclusion, the proposed method meets the EU criteriaand MRL levels and is thus useful for routine residue analysisof pesticides in soil matrices and detecting p,p’ DDT, p,p’DDE, pendimethalin, p,p’ DDD, chlorpyrifos, lenacil, andother.
The applicability of QuEChERS for this type of organiccontaminants as well as the excellent sensitivity obtainedusing GC/MS/MS/EC/NP has been demonstrated.
Acknowledgements This work was supported by the Ministry ofScience and Higher Education, Poland (grant number SBI-05BDevelopment and implementation of methods for the determina-tion of pesticide residues in plant material using GC/MS/MS andLC/MS/MS^).
Compliance with ethical standards
Conflict of interest The authors declare that they have no conflict ofinterest.
Open Access This article is distributed under the terms of the CreativeCommons At t r ibut ion 4 .0 In te rna t ional License (h t tp : / /creativecommons.org/licenses/by/4.0/), which permits unrestricted use,distribution, and reproduction in any medium, provided you giveappropriate credit to the original author(s) and the source, provide a linkto the Creative Commons license, and indicate if changes were made.
References
Anastassiades M, Lehotay SJ, Stajnbaher D, Schenck FJ (2003) Residuesand trace elements fast and easy multiresidue method employing
Fig. 5 Chromatogram of real soil sample containing chlorpyrifos (0.06 mg/kg), epoxiconazole (0.06 mg/kg), and tebuconazole (0.24 mg/kg) using aGC/MS/MS, b GC-μECD, and c GC-NPD
7136 Environ Sci Pollut Res (2017) 24:7124–7138

acetonitrile extraction partitioning and Bdispersive solid-phaseextraction^. J AOAC Int 86:412–431
Anastassiades M, Maštovská K, Lehotay SJ (2013) Evaluation of analyteprotectants to improve gas chromatographic analysis of pesticides. JChromatogr A 1015:163–184. doi:10.1016/S0021-9673(03)01208-1
Arias JLO, Rombaldi C, Caldas SS, Primel EG (2014) Alternative sor-bents for the dispersive solid-phase extraction step inquick, easy,cheap, effective, rugged and safe method for extraction of pesticidesfrom rice paddy soils with determination by liquid chromatographytandem mass spectrometry. J Chromatogr A 1360:66–75.doi:10.1016/j.enmm.2015.02.001
Asensio-Ramos M, Hernandez-Borges J, Ravelo-Perez LM,Rodriguez-Delgado MA (2010) Evaluation of a modifiedQuEChERS method for the extraction of pesticides from agricul-tural, ornamental and forestal soils. Anal Bioanal Chem 396:2307–2319. doi:10.1007/s00216-009-3440-2
Bargańska Ż, ŚlebiodaM, Namieśnik J (2013) Pesticide residues levels inhoney from apiaries located of Northern Poland. Food Control 31:196–201. doi:10.1016/j.foodcont.2012.09.049
Bruzzoniti MC, Checchini L, De Carlo RM, Orlandini S, Rivoira L, DelBubba M (2014) QuEChERS sample preparation for the determina-tion of pesticides and other organic residues in environmental ma-trices: a critical review. Anal Bioanal Chem 406(17):4089–4116.doi:10.1007/s00216-014-7798-4
Cajka T, Sandy C, Bachanova V, Drabova L, Kalachova K, PulkrabovaJ, Hajslova J (2012) Streamlining sample preparation and gaschromatography-tandem mass spectrometry analysis of multiplepesticide residues in tea. Anal Chim Acta 743:51–60.doi:10.1016/j.aca.2012.06.051
Caldas SS, Bolzan CM, Cerqueira MB, Tomasini D, Furlong EB,Fagundes C, Primel EG (2011) Evaluation of a modifiedQuEChERS extraction of multiple classes of pesticides from a ricepaddy soil by LC-APCI-MS/MS. J Agric Food Chem 59:11918–11926. doi:10.1021/jf202878s
Chen L, Li XS, Wang ZQ, Pan CP, Jin RC (2010) Residue dynamics ofprocymidone in leeks and soil in greenhouses by smoke generatorapplication. Ecotox Environ Safe 73:73–77. doi:10.1016/j.ecoenv.2009.07.006
Correia-Sá L, Fernandes VC, Carvalho M, Calhau C, Domingues VF,Delerue-Matos C (2012) Optimization of QuEChERS method forthe analysis of organochlorine pesticides in soils with diverse organ-ic matter. J Sep Sci 35(12):1521–1530. doi:10.1002/jssc.201200087
Dąbrowska H, Dąbrowski L, Biziuk M, Gaca J, Namieśnik J(2003) Solid-phase extraction clean-up of soil and sedimentextracts for the determination of various types of pollutantsin a single run. J Chromatogr A 1003(1–2):29–42.doi:10.1016/S0021-9673(03)00849-5
Durović R, Dordević T, Radivojević L, Šantrić L, Gajić Umiljendić J(2012) Multiresidue analysis of pesticides in soil by liquid-solidextraction procedure. Pestic Phytomed 27(3):239–244.doi:10.2298/PIF1203239D
Erney DR, Pawlowski TM, Poole CF (1997) Matrix-induced peak en-hancement of pesticides in gas chromatography: is there a solution?J High Resol Chromatogr 20(7):375–378
EU Pesticides database. Available at http://ec.europa.eu/sanco_pesticides/public/index.cfm
Fernandes VC, Domingues VF, Mateus N, Delerue-Matos C (2013)Multiresidue pesticides analysis in soils using modified QuEChERSwith disposable pipette extraction and dispersive solid-phase extrac-tion. J Sep Sci 36:376–382. doi:10.1002/jssc.201200673
Fuentes E, Báez ME, Labra R (2007) Parameters affecting microwave-assisted extraction of organophosphorus pesticides from agriculturalsoil. J Chromatogr A 1169:40–46. doi:10.1016/j.chroma.2007.08.064
Guo L, Lee HK (2013) Microwave assisted extraction combined withsolvent bar microextraction for one-step solvent-minimized extrac-tion, cleanup and preconcentration of polycyclic aromatic
hydrocarbons in soil samples. J Chromatogr A 1286:9–15.doi:10.1016/j.chroma.2013.02.067
Harrison R, Bull I, Michaelides K (2013) A method for the simultaneousextraction of seven pesticides from soil and sediment. Anal Methods5:2053–2058. doi:10.1039/C3AY26413K
He Z, Wang L, Peng Y, Luo M, Wang W, Liu X (2015) Multiresidueanalysis of over 200 pesticides in cereals using a QuEChERS andgas chromatography-tandem mass spectrometry-based method.Food Chem 169:372–380. doi:10.1016/j.foodchem.2014.07.102
Kaczyński P, Łozowicka B, Jankowska M, Hrynko I (2016) Rapid deter-mination of acid herbicides in soil by liquid chromatography withtandem mass spectrometric detection based on dispersive solidphase extraction. Talanta 152:127–136. doi:10.1016/j.talanta.2016.02.001
Kinsella B, O’Mahony J, Malone E, Moloney M, Cantwell H, Furey A,Danaher M (2009) Current trends in sample preparation for growthpromoter and veterinary drug residue analysis. J Chromatogr A1216(46):7977–8015. doi:10.1016/j.chroma.2009.09.005
Kolberg DI, Prestes OD, AdaimeMB, Zanella R (2011) Development of afast multiresidue method for the determination of pesticides in drysamples (wheat grains, flour and bran) usingQuEChERS basedmeth-od and GC-MS. Food Chem 125(4):1436–1442. doi:10.1016/j.foodchem.2010.10.041
Kruve A, Künnapas A, Herodes K, Leito I (2008) Matrix effects in pes-ticide multi-residue analysis by liquid chromatography-mass spec-trometry. J Chromatogr A 1187(1–2):58–66. doi:10.1016/j.chroma.2008.01.077
Lesueur C, Gartner M, Mentler A, Fuerhacker M (2008) Comparison offour extraction methods for the analysis of 24 pesticides in soilsamples with gas chromatography-mass spectrometry and liquidchromatography-ion trap-mass spectrometry. Talanta 75:284–293.doi:10.1016/j.talanta.2007.11.031
Lehotay SJ, Son KA, Kwon H, Koesukwiwat U, Fu W, Mastovska K,Hoh E, Leepipatpiboon N (2010) Comparison of QuEChERS sam-ple preparation methods for the analysis of pesticide residues infruits and vegetables. J Chromatogr A 1217:2548–2560. doi:10.1016/j.chroma.2010.01.044
Li Y, Dong F, Liu X, Xu J, Li J, Kong Z, Chen X, Liang X, Zheng Y(2012) Simultaneous enantioselective determination of triazole fun-gicides in soil and water by chiral liquid chromatography/tandemmass spectrometry. J Chromatogr A 1224:51–60. doi:10.1016/j.chroma.2011.12.044
Lozano A, Rajski Ł, Belmonte-Valles N, Ucles A, Ucles S, Mezcua M,Fernandez-Alba AR (2012) Pesticide analysis in teas and chamo-mile by liquid chromatography and gas chromatography tandemmass spectrometry using a modified QuEChERSmethod: validationand pilot survey in real samples. J Chromatogr A 1268:109–122.doi:10.1016/j.chroma.2012.10.013
Łozowicka B, Jankowska M, Rutkowska E, Kaczyński P, Hrynko I(2012) Comparison of extraction techniques by matrix solid phasedispersion and liquid–liquid for screening 150 pesticides from soil,and determination by gas chromatography. Pol J Environ Stud 21:973–992
Łozowicka B, Rutkowska E, Hrynko I (2015) Simultaneous deter-mination of 223 pesticides in tobacco by GC with simultaneouselectron capture and nitrogen-phosphorous detection and massspectrometric confirmation. Open Chem 13:1137–1149.doi:10.1515/chem-2015-0129
Łozowicka B, Ilyasova G, Kaczynski P, Jankowska M, Rutkowska E,Hrynko I, Mojsak P, Szabunko J (2016) Multi-residue methods forthe determination of over four hundred pesticides in solid and liquidhigh sucrose content matrices by tandem mass spectrometry coupledwith gas and liquid chromatograph. Talanta 151:51–61. doi:10.1016/j.talanta.2016.01.020
Mantzos N, Karakitsou A, Zioris I, Leneti E, Konstantinou I (2013)QuEChERS and solid phase extraction methods for the
Environ Sci Pollut Res (2017) 24:7124–7138 7137
determination of energy crop pesticides in soil, plant and runoffwater matrices. Inter J Environ Anal Chem 93(15):1566–1584.doi:10.1080/03067319.2013.803282
Martinez Vidal JL, Padilla Sanchez JA, Plaza-Bolanos P, Garrido FrenichA, Romero-Gonzalez R (2010) Use of pressurized liquid extractionfor the simultaneous analysis of 28 polar and 94 non-polar pesticidesin agricultural soils by GC/QqQ-MS/MS and UPLC/QqQ-MS/MS.J AOAC Int 93:1715–1731
Masiá A, Vásquez K, Campo J, Picó Y (2015) Assessment of two ex-traction methods to determine pesticides in soils, sediments andsludges. Application to the Túria River Basin J Chromatogr A1378:19–31. doi:10.1016/j.chroma.2014.11.079
Mol HGJ, Rooseboom A, van Dam R, Roding M, Arondeus K,Sunarto S (2007) Modification and re-validation of the ethylacetate-based multi-residue method for pesticides in produce.Anal Bioanal Chem 389(6):1715–1754. doi:10.1007/s00216-007-1357-1
Moreno D, Ferrera VZ, Rodriguez J (2006) Sample extraction methodcombining micellar extraction-SPME and HPLC for the determina-tion of organochlorine pesticides in agricultural soils. J Agr FoodChem 54:7747–7752. doi:10.1021/jf0614544
Moreno López A, Moreno López L, Pineda Lucas JL, Stevens J (2014)Multiresidue analysis of pesticides in olive samples using GC/MS/MS. application note, food testing and agriculture. AgilentTechnologies:1–8
Naeeni MH, Yamini Y, Rezaee M (2011) Combination of supercriticalfluid extraction with dispersive liquid-liquid microextraction for ex-traction of organophosphorus pesticides from soil and marine sedi-ment samples. Journal Supercrit Fluids 57:219–226. doi:10.1016/j.supflu.2011.03.005
Pastor-Belda M, Garridob I, Campilloa N, Vinasa P, Hellínb P, Floresb P,Fenollb J (2015) Dispersive liquid-liquid microextraction for thedetermination of new generation pesticides in soils by liquid chro-matography and tandem mass spectrometry. J Chromatogr A 1394:1–8. doi: 10.1016/j.chroma.2015.03.032
Pinto CG, Martin SH, Pavon JLP, Cordero BM (2011) A simplifiedQuick, Easy, Cheap, Effective, Rugged and Safe approach for thedetermination of trihalomethanes and benzene, toluene, ethylben-zene and xylenes in soil matrices by fast gas chromatography withmass spectrometry detection. Anal Chim Acta 689:129–136.doi:10.1016/j.aca.2011.01.023
Rashid A, Nawaz S, Barker H, Ahmad I, Ashraf M (2010) Developmentof a simple extraction and clean-up procedure for determination oforganochlorine pesticides in soil using gas chromatography-tandemmass spectrometry. J Chromatogr A 1217:2933–2939. doi: 10.1016/j.chroma.2010.02.060
Rouvière F, Buleté A, Cren-Olivé C, Arnaudguilhem C (2012)Multiresidue analysis of aromatic organochlorines in soil by gaschromatography-mass spectrometry and QuEChERS extractionbased on water/dichloromethane partitioning. Comparison with ac-celerated solvent extraction. Talanta 93:336–344. doi:10.1016/j.talanta.2012.02.048
SANCO (2013) Document No. SANCO/12571/2013. Guidance docu-ment on analytical quality control and validation procedures forpesticide residues in food and feed
Sanghi R, Kannamkumarath SS (2004) Comparison of extractionmethods by soxhlet, sonicator, and microwave in the screening ofpesticide residues from solid matrices. J Anal Chem 59(11):1032–1036. doi:10.1023/B:JANC.0000047004.71892.0e
Tor A, Aydin ME, Ozcan S (2006) Ultrasonic solvent extraction of or-ganochlorine pesticides from soil. Anal Chim Acta 559:173–180.doi:10.1016/j.aca.2005.11.078
Varga R, Somogyvári I, Eke Z, Torkos K (2011) Determination of antihy-pertensive and anti-ulcer agents from surface water with solid-phaseextraction–liquid chromatography–electrospray ionization tandemmass spectrometry. Talanta 83(5):1447–1454. doi:10.1016/j.talanta.2010.11.030
Vera J, Correia-Sá L, Paíga P, Bragança I, Fernandes VC, Domingues VF,Delerue-Matos C (2013) QuEChERS and soil analysis. An over-view. Sample Perp 1:54–77. doi:10.2478/sampre-2013-0006
Wang YH, Du LW, Zhou XM, Tan HH, Bai LY, Zeng DQ, Tian H (2012)QuEChERS extraction for high performance liquid chromatograph-ic determination of pyrazosulfuron-ethyl in soils. J Chem Soc Pak34:28–32
Wu M, Hu J (2014) Residue analysis of fosthiazate in cucumber and soilby QuEChERS and GC-MS. Chem Pap 68(10):1368–1374.doi:10.2478/s11696-014-0589-8
Zhang K, Wong JW, Yang P, Tech K, Dibenedetto AL, Lee NS et al(2011) Multiresidue pesticide analysis of agricultural commoditiesusing acetonitrile salt-out extraction, dispersive solid-phase sampleclean-up, and high-performance liquid chromatography-tandemmass spectrometry. J Agr Food Chem 59(14):7636–7646.doi:10.1021/jf2010723
7138 Environ Sci Pollut Res (2017) 24:7124–7138