influence of petrophysical and fluid properties on array ...the presence of obm invasion, and...
TRANSCRIPT
SPWLA 48th Annual Logging Symposium, June 3-6, 2007
1
INFLUENCE OF PETROPHYSICAL AND FLUID PROPERTIES ON ARRAY-INDUCTION MEASUREMENTS ACQUIRED IN THE
PRESENCE OF OIL-BASE MUD-FILTRATE INVASION
Mayank Malik, Jesús M. Salazar, Carlos Torres-Verdín, Gong Li Wang, Hee Jae Lee, and Kamy Sepehrnoori, The University of Texas at Austin
Copyright 2007, held jointly by the Society of Petrophysicists and Well Log Analysts (SPWLA) and the submitting authors. This paper was prepared for presentation at the SPWLA 48th Annual Logging Symposium held in Austin, Texas, United States, June 3-6, 2007. ABSTRACT This paper quantifies the influence of petrophysical and fluid properties on array-induction resistivity measurements acquired in the presence of oil-base mud (OBM) filtrate invasion. To simulate OBM-filtrate invasion, we consider a simple two-component formulation for the oil phase (OBM and reservoir oil) wherein the components are first-contact miscible. Simulations also include the presence of irreducible, capillary-bound, and movable water. The dynamic process of OBM invasion causes the component concentrations to vary with space and time. In addition, the relative mobility of the oil phase varies during the process of invasion given that oil viscosity and oil density are both dependent on component concentrations. This behavior in turn affects the spatial distribution of electrical resistivity and, consequently, the borehole array-induction measurements. We use an implicit pressure, explicit concentration (IMPEC) reservoir simulator with two-component formation fluids to simulate the invasion process in axi-symmetric rock formations penetrated by a vertical well. The invasion rate is volume averaged and depends on both mud and formation properties. Simulations of the process of OBM-filtrate invasion yield two-dimensional spatial distributions of water and oil saturation that are transformed into spatial distributions of electrical resistivity using Archie’s or Waxman-Smits’ formulations. Subsequently, we simulate array-induction measurements with a numerical mode-matching method. Simulation of induction measurements in the presence of OBM are compared against the corresponding measurements acquired in the presence of water-base mud (WBM). This helps us to contrast the effect of the two different mud-filtrate invasion processes using field measurements acquired in a deepwater Gulf-of-Mexico reservoir.
We perform sensitivity analysis that includes different values of formation porosity-permeability, movable water zone, relative permeability, mud-filtrate invasion rates, and fluid viscosity to quantify the effect of oil-base mud-filtrate invasion on array-induction logs. In addition, we quantify the effect of changes of rock wettability due to OBM invasion on field measurements. The combined simulation of OBM-filtrate invasion and array-induction logs provides reliable estimates of water saturation to improve the assessment of in-place hydrocarbon reserves. INTRODUCTION The array-induction imager tool (AIT*) is widely used to measure formation resistivity in the presence of OBM. Resistivity measurements remain influenced by the process of mud-filtrate invasion that takes place under overbalanced drilling conditions. In the case of oil-base muds, invading mud-filtrate is miscible with formation oil. Oil-base mud causes changes in fluid density and fluid viscosity, thereby altering the apparent oil phase mobility in the near-wellbore region. The fluid saturation front in the near-wellbore region varies with time due to invasion. In addition, the saturation front can be altered due to variations of oil-phase mobility. Thus, it becomes imperative to accurately model the effect of OBM on the invasion process and, subsequently, on AIT measurements acquired some time after the onset of invasion. Oil-base muds contain a mixture of oil, water, and surfactants necessary to maintain the oil-water mixture as an emulsion (Bourgoyne Jr et al., 1986.; La Vigne et al., 1997), in which oil is the continuous phase and encapsulates the water (Proett et al. 2002). The continuous phase dominates the process of invasion and mixes with formation fluids. Proett et al. (2002) simulated the process of OBM invasion via Todd and Longstaff’s (1972) miscible displacement algorithm in which the OBM was treated as a solvent. In this paper, we assume oil as the main component of the OBM and neglect the effect of water and surfactants in the emulsion. Therefore, oil and water phases remain immiscible. This assumption is not restrictive in field * Mark of Schlumberger
AAA
SPWLA 48th Annual Logging Symposium, June 3-6, 2007
2
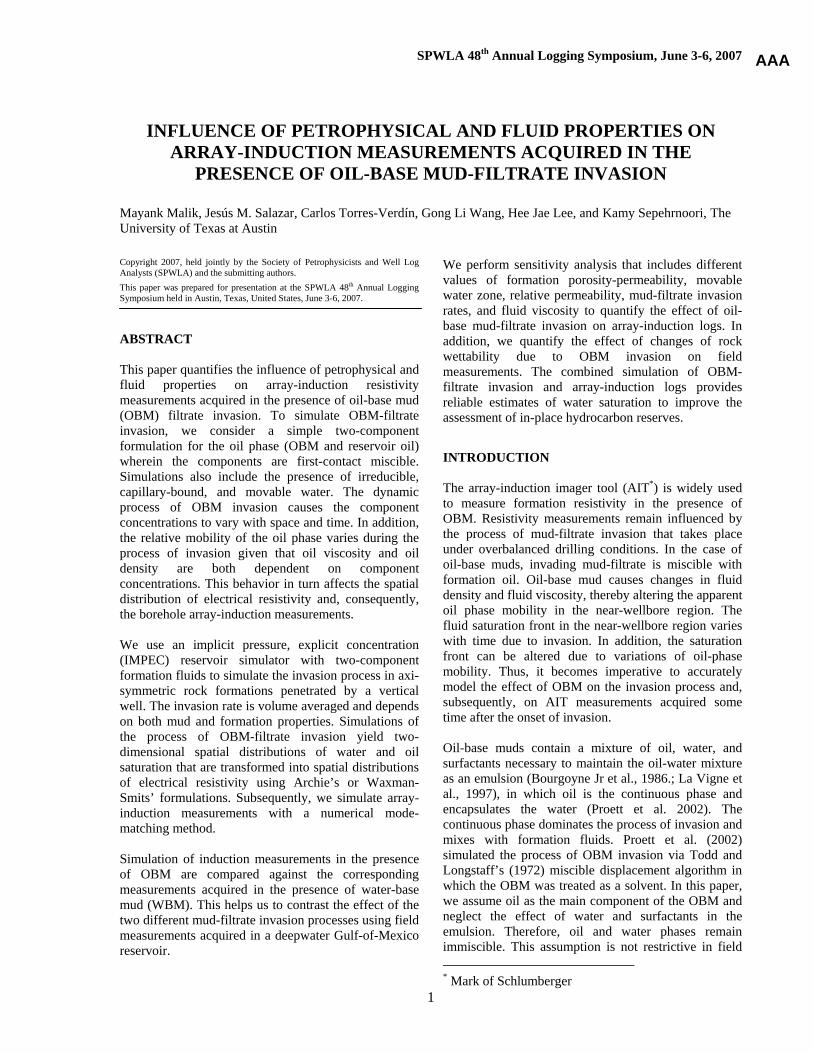
applications, especially when the chemical activity of the OBM does not cause a separation of phases within the mud as the latter invades the formation. We are interested in analyzing the time-space variability of AIT measurements in the presence of OBM-filtrate invasion. La Vigne et al (1997) studied several field cases where such variability was attributed not only to invasion, but also to shale fracturing. While performing experiments using OBM invasion on sandstone cores, Yan and Sharma (1989) observed considerable changes on wettability as well as a reduction of permeability. The latter laboratory evidence provides solid footing upon which to analyze the effect of invasion observed in induction resistivity measurements acquired in wells drilled with OBM. In this paper, we first analyze the field measurements available to study the process of mud-filtrate invasion in a clastic formation. Subsequently, we explain the methodology to simulate the process of oil-base mud-filtrate invasion and array-induction resistivity measurements. Sensitivity analysis sheds insight to the petrophysical and fluid properties affecting the depth and shape of the invasion front. In addition, it provides a quantitative framework to interpret the resistivity measurements. Finally, we use the results of the sensitivity analysis to history match induction resistivity curves measured in a deepwater turbidite reservoir. GEOLOGICAL DESCRIPTION The formation under analysis consists of unconsolidated shaly sands in a turbidite system formed mainly by channel levees located in the deepwater Gulf of Mexico. The sedimentary structure includes ripple stratification, clay laminations, and massive intervals with moderate to good grain sorting. Based on thin-section interpretations, it is known that cement of clinoptilolite and smectite are present in this system. Quartz concentration is between 85% and 95%, being clay minerals the remaining components of the rock. The latter minerals include illite/smectite, illite/mica, and kaolinite and chlorite in small amounts. In rare cases, it is possible to observe electrical conductive minerals like siderite and pyrite, as well as traces of calcite and dolomite. Porosity ranges between 20% and 34% while permeability varies from 10 md in low-porosity zones to 2,500 md in high-porosity intervals. Figure 1 shows photographs of two core sections displaying both shaly and massive sand intervals.
Figure 1: Core photographs showing clay-laminated (left panel) and massive (right-most panel) sand intervals. The vertical scale is given in units of 1/10th of foot. PETROPHYSICAL ASSESSMENT We focus our attention to three intervals of the formation penetrated by a cored well. The first one is at the lower section of the formation and is a 100% water saturated interval that is assumed homogeneous (single layer). This interval is used to calibrate our synthetic base case where we perform sensitivity analyses to several petrophysical and fluid properties. The second and third intervals, located in the upper section of the formation, correspond to partially oil-saturated rocks containing movable water. These two intervals will be subsequently used to simulate the process of mud-filtrate invasion and to reproduce field measurements with a history-matching approach. Water Saturation: The formation is mainly composed of shaly sands. Therefore, we use Waxman-Smits’ (1968) equations to calculate water saturation (Sw). However, since the connate water salt concentration is very high (>200 kppm), Archie’s (1942) equation can also be applied to calculate Sw in cases of low values of hydrocarbon saturation. Waxman-Smits’ equation is given by
( ) ( ) ( )( )
**1 1,
, ,
mn v
wt w w
z BQS r zR r z a R S r z
φ ⎡ ⎤= +⎢ ⎥
⎢ ⎥⎣ ⎦, (1)
where r is the radial distance from the wellbore, z is the vertical distance with respect to the top of the
SPWLA 48th Annual Logging Symposium, June 3-6, 2007
3
formation, Rt is true formation resistivity Rw is connate water resistivity, a is the tortuosity factor, m* and n* are clay-corrected Archie’s cementation and saturation exponents, respectively, Qv is the volumetric concentration of sodium exchange cations (CEC) associated with the clay, and B designates the equivalent conductance of the counterions as a function of connate water resistivity. We use equation (19) of Waxman and Smits’ (1968) work to calculate B, whereas m*, n* and Qv are obtained from laboratory measurements. Equation (1) is solved iteratively for Sw starting with Archie’s Sw as the initial-guess. Table 1 describes the input parameters used to calculate initial water saturation using the Waxman-Smits model. Such parameters were obtained from laboratory measurements performed on cores and fluid samples withdrawn from the formation. Porosity and Permeability: We followed the methodology applied by Salazar et al. (2006) to calculate porosity and permeability. Porosity is calculated from density and neutron measurements by accounting for the presence of two fluids (oil and water) and two minerals (quartz and clay) in the porous medium. Permeability is calculated via a modified Timur-Tixier equation from porosity and irreducible water saturation. The specific equation for permeability was obtained with calibration of porosity-permeability measurements, and is given by
7.56
0.094.22 10wir
kSφ
= × , (2)
where k (md) is permeability, φ (fraction) is porosity, and Swir (fraction) is irreducible water saturation. The coefficient and the exponents of the above equation were estimated with a multi-linear least-squares regression. Figure 2 shows the results obtained from the petrophysical analysis in the water interval. Figure 3 describes the results obtained from the petrophysical assessment in the two partially hydrocarbon-saturated zones. SIMULATION OF BOREHOLE ARRAY-INDUCTION RESISTIVITY MEASUREMENTS We describe the simulation of borehole AIT measurements in two stages. The first stage discusses our reservoir simulation methodology for oil-base mud-filtrate invasion in the formation. The second stage describes our resistivity simulation technique that uses spatial distributions of water saturation, calculated in the presence of OBM invasion, and transforms them into spatial distributions of electrical resistivity via equation (1).
Table 1- Summary of Waxman-Smits’ parameters and rock and fluid properties assumed in the calculation of water saturation and porosity. Variable Units Value Archie’s tortuosity factor a - 1.00 Clay corrected m, m* 1.92 Clay corrected n, n* 2.00 Volumetric CEC, Qv equiv/liters 0.064 Connate water resistivity @ 120 F ohm.m 0.02 Matrix density g/cm3 2.65 Shale density g/cm3 2.50 Water density g/cm3 1.00 Hydrocarbon density g/cm3 0.75
Numerical Simulation of the Process of Mud-Filtrate Invasion with a Compositional Simulator: We use an IMPEC numerical formulation to calculate the spatial distribution of water saturation due to OBM-filtrate invasion. The formulation and the algorithm used in this simulations are similar to those of Malik et al.’s (2006). We assume azimuthal symmetry in formation properties with respect to the axis of a vertical borehole. Our formulation enforces boundary and source flow-rate conditions on specific depth segments along the wellbore. The outer limits of the reservoir consist of impermeable zones with no-flow boundary conditions. Peng-Robinson (1976) equation of state is used to calculate the compressibility factor and to solve for oil phase density. Since we assume that the OBM is water-free, salt concentration in the water phase is considered constant across the formation and equal to that of connate water. Malik et al. (2006) simulated formation testing and pressure transient measurements using a multi-component formulation in the presence of OBM invasion. They represented hydrocarbon phase components in the formation using four pseudo-components whereas mud filtrate was modeled with one pseudo-component. Increasing the number of pseudo-components can lead to longer computation times. In addition, due to uncertainty in formation oil properties and due to the averaging of fluid component properties, we may not observe a significant difference in the saturation front (and, therefore on AIT measurements) by increasing the number of pseudo-components. Thus, in order to keep computational time to a minimum, we use a simpler binary formulation to describe both mud filtrate and formation oil. All components of OBM filtrate and formation oil are lumped into a total of two pseudo-components. Table 2 summarizes the geometrical properties for the numerical grid used to simulate the base case. The wellbore radius is equal to 0.49 ft and the external radius is 1000 ft, with the grid consisting of 50 nodes in the radial direction and 60 nodes in the vertical
AAA
SPWLA 48th Annual Logging Symposium, June 3-6, 2007
4
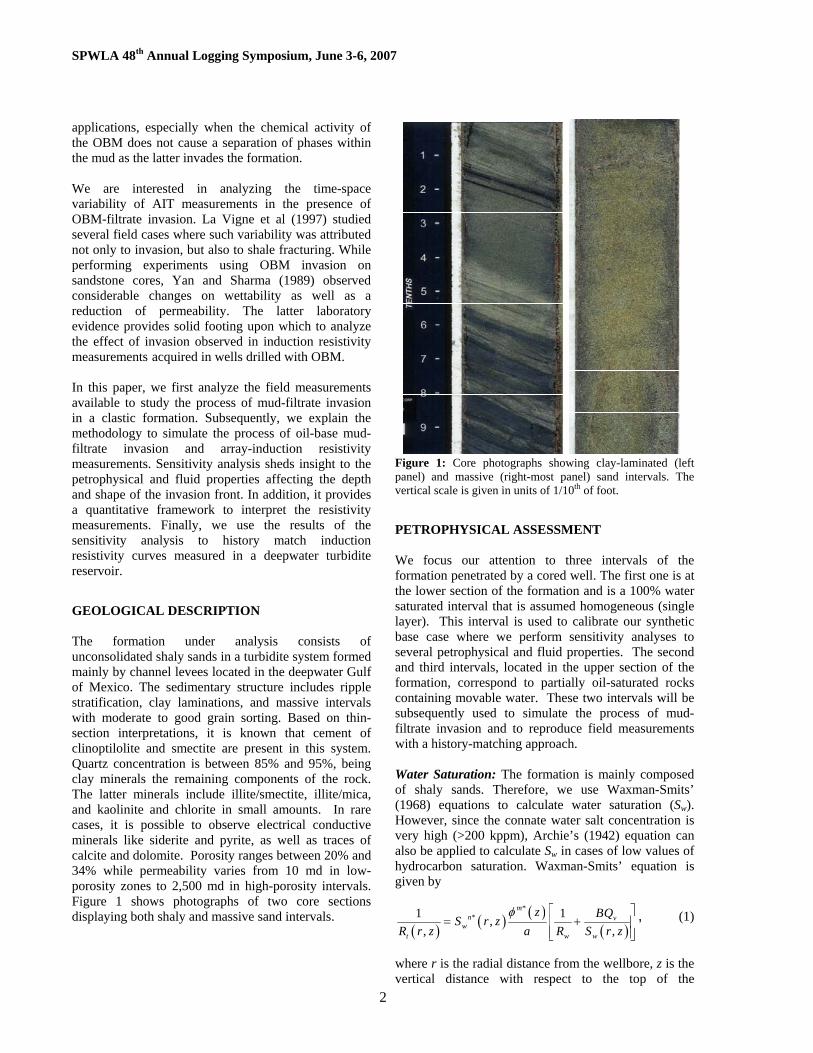
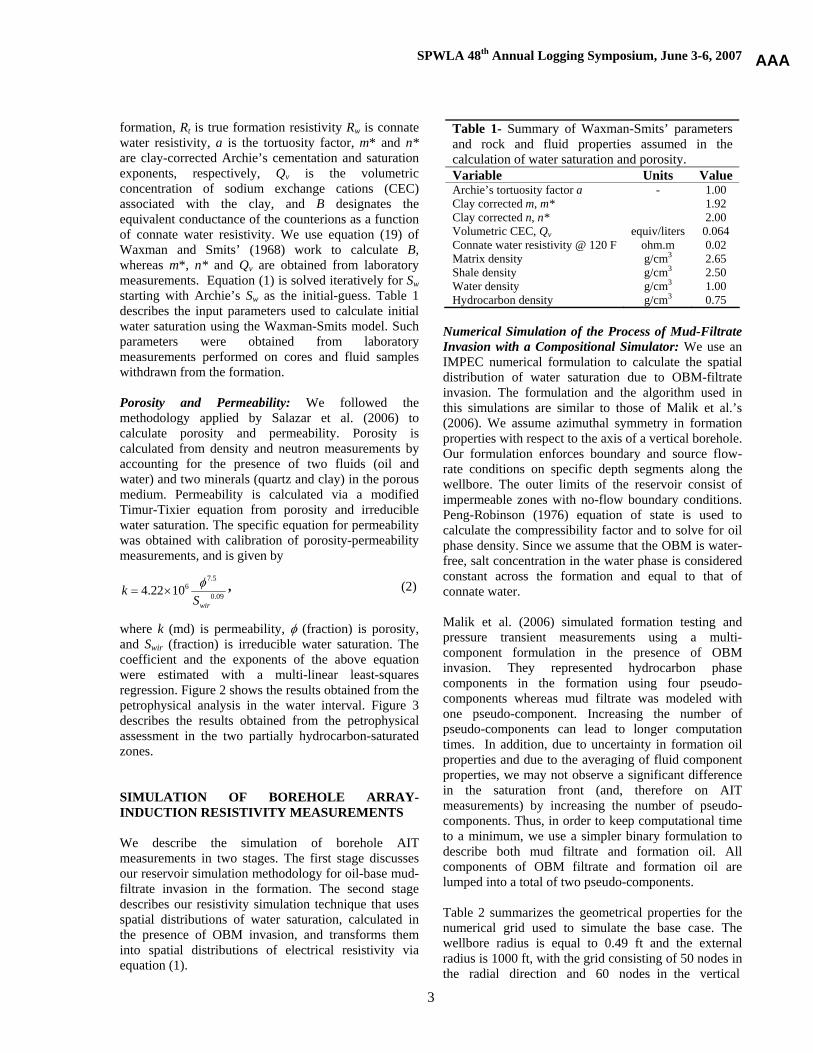
Figure 2: Petrophysical assessment within the water zone. Track 1 shows depth. Track 2 displays gamma-ray and caliper logs. Track 3 shows array-induction resistivity measurements (2-foot vertical resolution). Track 4 displays the estimated permeability. Track 5 describes the volumetric analysis with shale concentration, bulk volume water, and effective porosity. This depth interval is regarded as the base case for analysis. Figure 3: Petrophysical assessment of hydrocarbon zones. Track 1 shows depth. Track 2 displays gamma-ray and caliper logs. Track 3 shows array-induction resistivity measurements (2-foot vertical resolution). Track 4 displays log estimated and rock-core permeability. Track 5 describes the volumetric analysis with shale concentration, bulk volume water, and log estimated effective and rock-core porosity. The upper section is vertically heterogeneous while the lower depth interval is a fairly homogenous sand unit.
direction. In keeping with the rapid space-time variations of pressure and component concentrations in the near-borehole region, radial nodes are logarithmically spaced from the wellbore toward the outer grid boundary (located 1000 ft away from the axis of the borehole). Along the vertical direction, grid nodes are spaced uniformly. We simulate the process of OBM-filtrate invasion with flow rates of invasion calculated on the basis of specific formation and mud properties. The calculation of the invasion flow rate is based on the work by Wu et al. (2005), to simulate water-base mud-filtrate invasion. At the onset of the mud-filtrate invasion process, the flow rate of filtrate is high due to the overbalance pressure in the wellbore. As the mudcake thickens, the filtrate flow rate gradually decreases with time. Although mudcake eventually becomes impermeable, invasion continues at a slow rate until the casing is set in the wellbore. Since OBM and formation oil are miscible, the invasion process in the presence of OBM differs from WBM. In our work, we use a constant volume-averaged flow rate that was intended to simulate water-base mud-filtrate invasion as described by Wu et al., (2005). Rather than developing a new algorithm to quantify the mud-filtrate invasion process in the presence of OBMs, we use the theoretical WBM algorithm of Wu et al. (2005) and adjust it as necessary to reproduce borehole resistivity measurements and calculate flow rates of invasion. We assume that the original formation hydrocarbons consist of components in the range from C2 to C30+. These hydrocarbons are lumped into one component (FHC1) using their pseudo properties summarized in Table 3. Oil-base mud filtrate is assumed to consist of components from C14 to C18 that are also lumped into one component (MC16). The binary-interaction parameter between the hydrocarbon components is assumed null. We calculate oil viscosity of the hydrocarbon phase, μo, using a quarter-power mixing rule (Todd and Longstaff, 1972) applied to the sum of component concentrations of formation oil (xfo) and OBM (xOBM), given by
[ ]44/14/1OBMOBMfofoo xx μμμ ⋅+⋅= .
In the above expression, component viscosities ( foμ , OBMμ ) are initialized to specific values of formation temperature and pressure. Under dynamic drilling conditions, drilling mud mixes with the solid particulate matter and formation fluids when the drill bit penetrates through the formation. This can modify the composition and viscosity of the mud. In addition, due to the high cost of OBM compared to WBM, OBM
XX780
XX800
XX780
XX800
XX240
XX260
XX280
XX340
XX240
XX260
XX280
XX340
SPWLA 48th Annual Logging Symposium, June 3-6, 2007
5
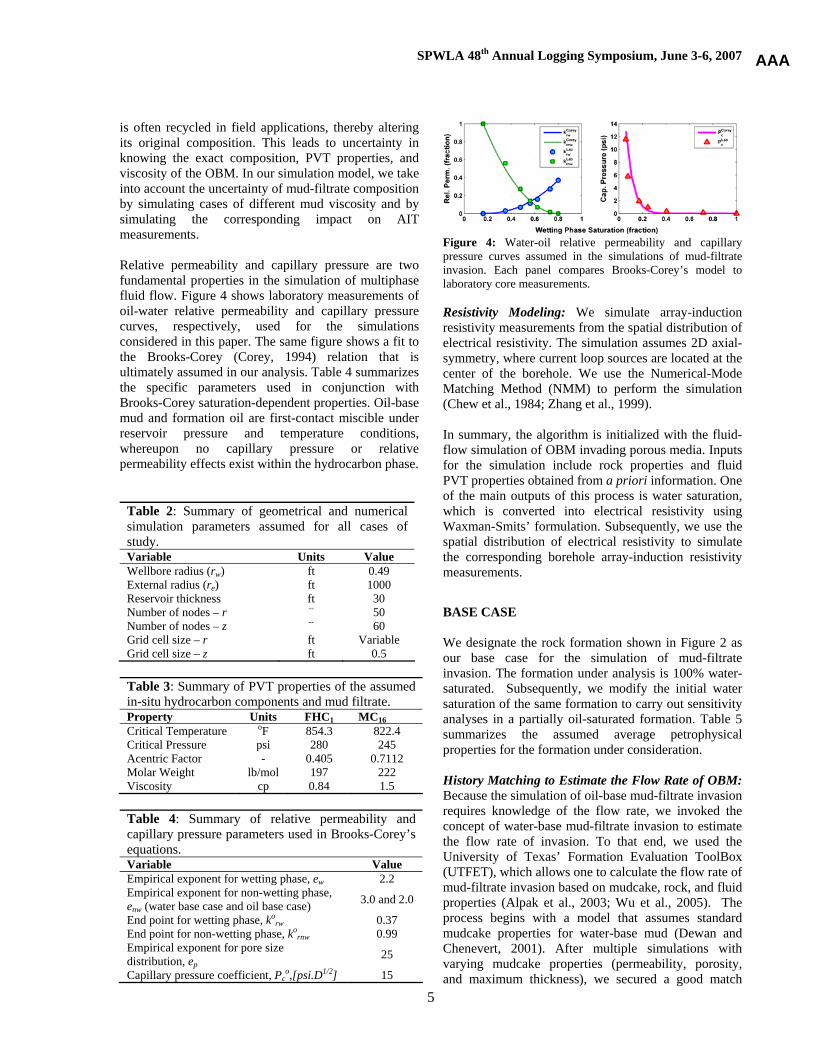
is often recycled in field applications, thereby altering its original composition. This leads to uncertainty in knowing the exact composition, PVT properties, and viscosity of the OBM. In our simulation model, we take into account the uncertainty of mud-filtrate composition by simulating cases of different mud viscosity and by simulating the corresponding impact on AIT measurements. Relative permeability and capillary pressure are two fundamental properties in the simulation of multiphase fluid flow. Figure 4 shows laboratory measurements of oil-water relative permeability and capillary pressure curves, respectively, used for the simulations considered in this paper. The same figure shows a fit to the Brooks-Corey (Corey, 1994) relation that is ultimately assumed in our analysis. Table 4 summarizes the specific parameters used in conjunction with Brooks-Corey saturation-dependent properties. Oil-base mud and formation oil are first-contact miscible under reservoir pressure and temperature conditions, whereupon no capillary pressure or relative permeability effects exist within the hydrocarbon phase.
Table 2: Summary of geometrical and numerical simulation parameters assumed for all cases of study. Variable Units Value Wellbore radius (rw) ft 0.49 External radius (re) ft 1000 Reservoir thickness ft 30 Number of nodes – r -- 50 Number of nodes – z -- 60 Grid cell size – r ft Variable Grid cell size – z ft 0.5
Table 3: Summary of PVT properties of the assumed in-situ hydrocarbon components and mud filtrate. Property Units FHC1 MC16 Critical Temperature oF 854.3 822.4 Critical Pressure psi 280 245 Acentric Factor - 0.405 0.7112 Molar Weight lb/mol 197 222 Viscosity cp 0.84 1.5
Table 4: Summary of relative permeability and capillary pressure parameters used in Brooks-Corey’s equations. Variable Value Empirical exponent for wetting phase, ew 2.2 Empirical exponent for non-wetting phase, enw (water base case and oil base case) 3.0 and 2.0
End point for wetting phase, korw 0.37
End point for non-wetting phase, kornw 0.99
Empirical exponent for pore size distribution, ep
25
Capillary pressure coefficient, Pco,[psi.D1/2] 15
Figure 4: Water-oil relative permeability and capillary pressure curves assumed in the simulations of mud-filtrate invasion. Each panel compares Brooks-Corey’s model to laboratory core measurements. Resistivity Modeling: We simulate array-induction resistivity measurements from the spatial distribution of electrical resistivity. The simulation assumes 2D axial-symmetry, where current loop sources are located at the center of the borehole. We use the Numerical-Mode Matching Method (NMM) to perform the simulation (Chew et al., 1984; Zhang et al., 1999). In summary, the algorithm is initialized with the fluid-flow simulation of OBM invading porous media. Inputs for the simulation include rock properties and fluid PVT properties obtained from a priori information. One of the main outputs of this process is water saturation, which is converted into electrical resistivity using Waxman-Smits’ formulation. Subsequently, we use the spatial distribution of electrical resistivity to simulate the corresponding borehole array-induction resistivity measurements. BASE CASE We designate the rock formation shown in Figure 2 as our base case for the simulation of mud-filtrate invasion. The formation under analysis is 100% water-saturated. Subsequently, we modify the initial water saturation of the same formation to carry out sensitivity analyses in a partially oil-saturated formation. Table 5 summarizes the assumed average petrophysical properties for the formation under consideration. History Matching to Estimate the Flow Rate of OBM: Because the simulation of oil-base mud-filtrate invasion requires knowledge of the flow rate, we invoked the concept of water-base mud-filtrate invasion to estimate the flow rate of invasion. To that end, we used the University of Texas’ Formation Evaluation ToolBox (UTFET), which allows one to calculate the flow rate of mud-filtrate invasion based on mudcake, rock, and fluid properties (Alpak et al., 2003; Wu et al., 2005). The process begins with a model that assumes standard mudcake properties for water-base mud (Dewan and Chenevert, 2001). After multiple simulations with varying mudcake properties (permeability, porosity, and maximum thickness), we secured a good match
AAA
SPWLA 48th Annual Logging Symposium, June 3-6, 2007
6
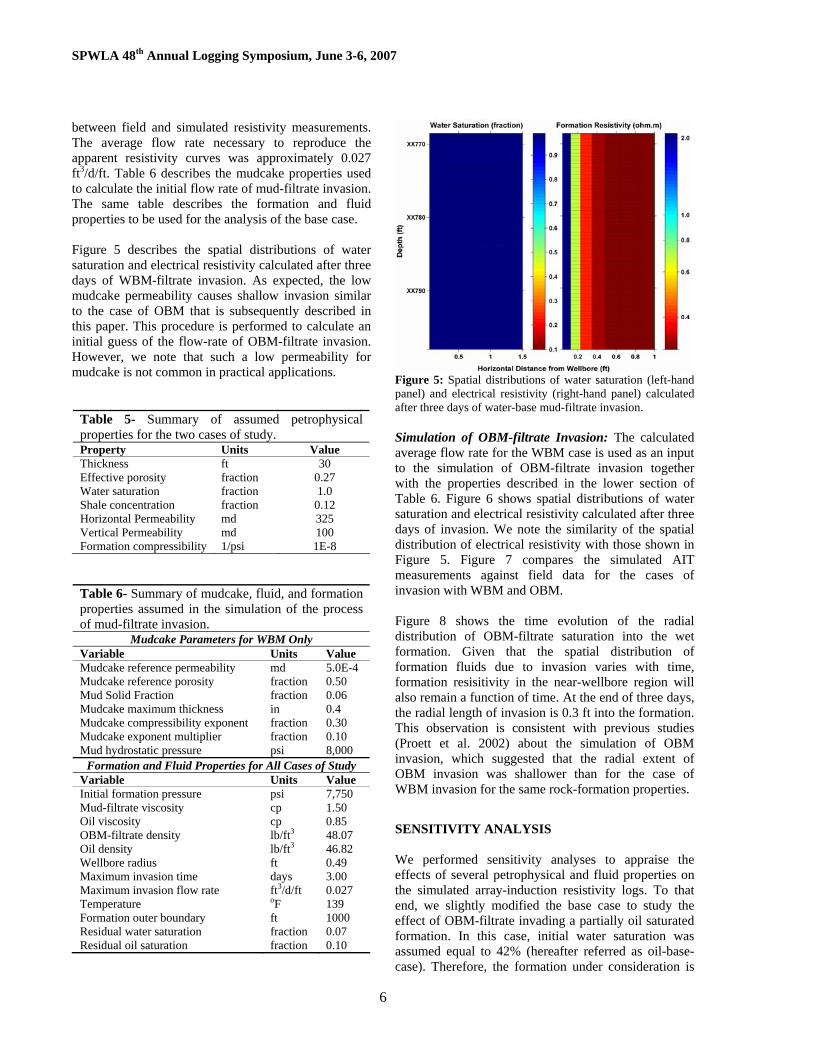
between field and simulated resistivity measurements. The average flow rate necessary to reproduce the apparent resistivity curves was approximately 0.027 ft3/d/ft. Table 6 describes the mudcake properties used to calculate the initial flow rate of mud-filtrate invasion. The same table describes the formation and fluid properties to be used for the analysis of the base case. Figure 5 describes the spatial distributions of water saturation and electrical resistivity calculated after three days of WBM-filtrate invasion. As expected, the low mudcake permeability causes shallow invasion similar to the case of OBM that is subsequently described in this paper. This procedure is performed to calculate an initial guess of the flow-rate of OBM-filtrate invasion. However, we note that such a low permeability for mudcake is not common in practical applications.
Table 5- Summary of assumed petrophysical properties for the two cases of study. Property Units Value Thickness ft 30 Effective porosity fraction 0.27 Water saturation fraction 1.0 Shale concentration fraction 0.12 Horizontal Permeability md 325 Vertical Permeability md 100 Formation compressibility 1/psi 1E-8
Table 6- Summary of mudcake, fluid, and formation properties assumed in the simulation of the process of mud-filtrate invasion.
Mudcake Parameters for WBM Only Variable Units Value Mudcake reference permeability md 5.0E-4 Mudcake reference porosity fraction 0.50 Mud Solid Fraction fraction 0.06 Mudcake maximum thickness in 0.4 Mudcake compressibility exponent fraction 0.30 Mudcake exponent multiplier fraction 0.10 Mud hydrostatic pressure psi 8,000
Formation and Fluid Properties for All Cases of Study Variable Units Value Initial formation pressure psi 7,750 Mud-filtrate viscosity cp 1.50 Oil viscosity cp 0.85 OBM-filtrate density lb/ft3 48.07 Oil density lb/ft3 46.82 Wellbore radius ft 0.49 Maximum invasion time days 3.00 Maximum invasion flow rate ft3/d/ft 0.027 Temperature oF 139 Formation outer boundary ft 1000 Residual water saturation fraction 0.07 Residual oil saturation fraction 0.10
Figure 5: Spatial distributions of water saturation (left-hand panel) and electrical resistivity (right-hand panel) calculated after three days of water-base mud-filtrate invasion. Simulation of OBM-filtrate Invasion: The calculated average flow rate for the WBM case is used as an input to the simulation of OBM-filtrate invasion together with the properties described in the lower section of Table 6. Figure 6 shows spatial distributions of water saturation and electrical resistivity calculated after three days of invasion. We note the similarity of the spatial distribution of electrical resistivity with those shown in Figure 5. Figure 7 compares the simulated AIT measurements against field data for the cases of invasion with WBM and OBM. Figure 8 shows the time evolution of the radial distribution of OBM-filtrate saturation into the wet formation. Given that the spatial distribution of formation fluids due to invasion varies with time, formation resisitivity in the near-wellbore region will also remain a function of time. At the end of three days, the radial length of invasion is 0.3 ft into the formation. This observation is consistent with previous studies (Proett et al. 2002) about the simulation of OBM invasion, which suggested that the radial extent of OBM invasion was shallower than for the case of WBM invasion for the same rock-formation properties. SENSITIVITY ANALYSIS We performed sensitivity analyses to appraise the effects of several petrophysical and fluid properties on the simulated array-induction resistivity logs. To that end, we slightly modified the base case to study the effect of OBM-filtrate invading a partially oil saturated formation. In this case, initial water saturation was assumed equal to 42% (hereafter referred as oil-base-case). Therefore, the formation under consideration is
SPWLA 48th Annual Logging Symposium, June 3-6, 2007
7
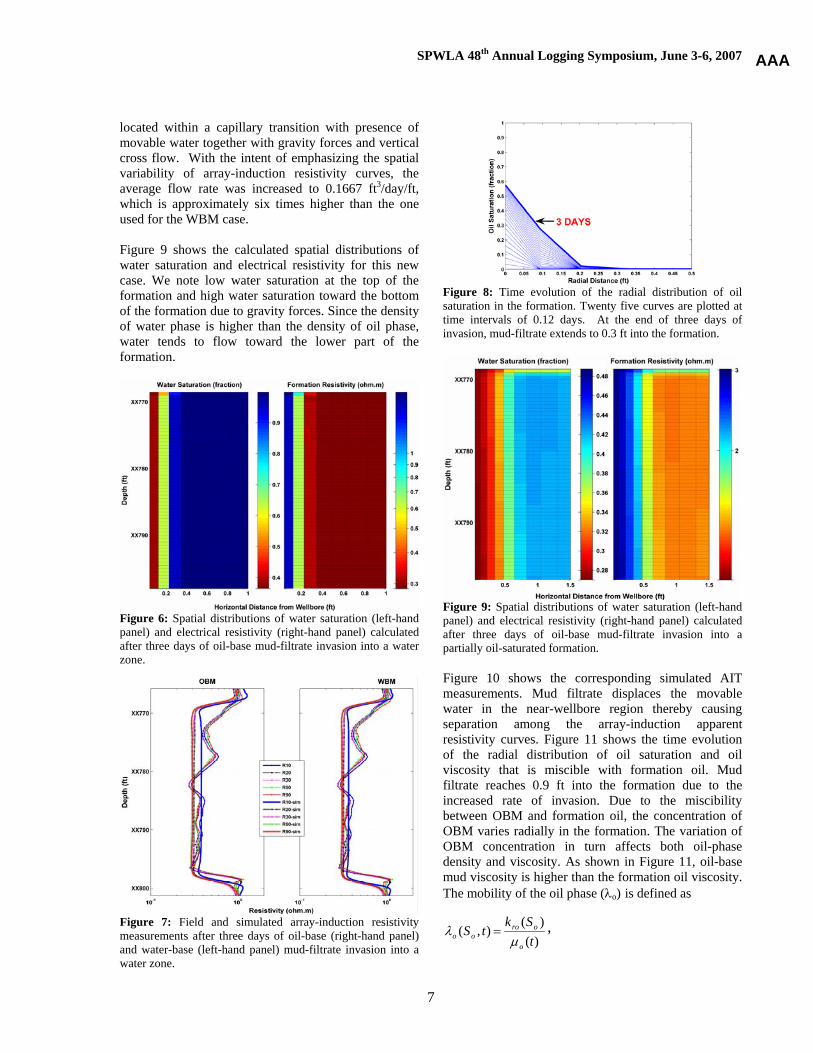
located within a capillary transition with presence of movable water together with gravity forces and vertical cross flow. With the intent of emphasizing the spatial variability of array-induction resistivity curves, the average flow rate was increased to 0.1667 ft3/day/ft, which is approximately six times higher than the one used for the WBM case. Figure 9 shows the calculated spatial distributions of water saturation and electrical resistivity for this new case. We note low water saturation at the top of the formation and high water saturation toward the bottom of the formation due to gravity forces. Since the density of water phase is higher than the density of oil phase, water tends to flow toward the lower part of the formation.
Figure 6: Spatial distributions of water saturation (left-hand panel) and electrical resistivity (right-hand panel) calculated after three days of oil-base mud-filtrate invasion into a water zone.
Figure 7: Field and simulated array-induction resistivity measurements after three days of oil-base (right-hand panel) and water-base (left-hand panel) mud-filtrate invasion into a water zone.
Figure 8: Time evolution of the radial distribution of oil saturation in the formation. Twenty five curves are plotted at time intervals of 0.12 days. At the end of three days of invasion, mud-filtrate extends to 0.3 ft into the formation.
Figure 9: Spatial distributions of water saturation (left-hand panel) and electrical resistivity (right-hand panel) calculated after three days of oil-base mud-filtrate invasion into a partially oil-saturated formation. Figure 10 shows the corresponding simulated AIT measurements. Mud filtrate displaces the movable water in the near-wellbore region thereby causing separation among the array-induction apparent resistivity curves. Figure 11 shows the time evolution of the radial distribution of oil saturation and oil viscosity that is miscible with formation oil. Mud filtrate reaches 0.9 ft into the formation due to the increased rate of invasion. Due to the miscibility between OBM and formation oil, the concentration of OBM varies radially in the formation. The variation of OBM concentration in turn affects both oil-phase density and viscosity. As shown in Figure 11, oil-base mud viscosity is higher than the formation oil viscosity. The mobility of the oil phase (λo) is defined as
)()(
),(t
SktS
o
orooo μ
λ = ,
AAA
SPWLA 48th Annual Logging Symposium, June 3-6, 2007
8
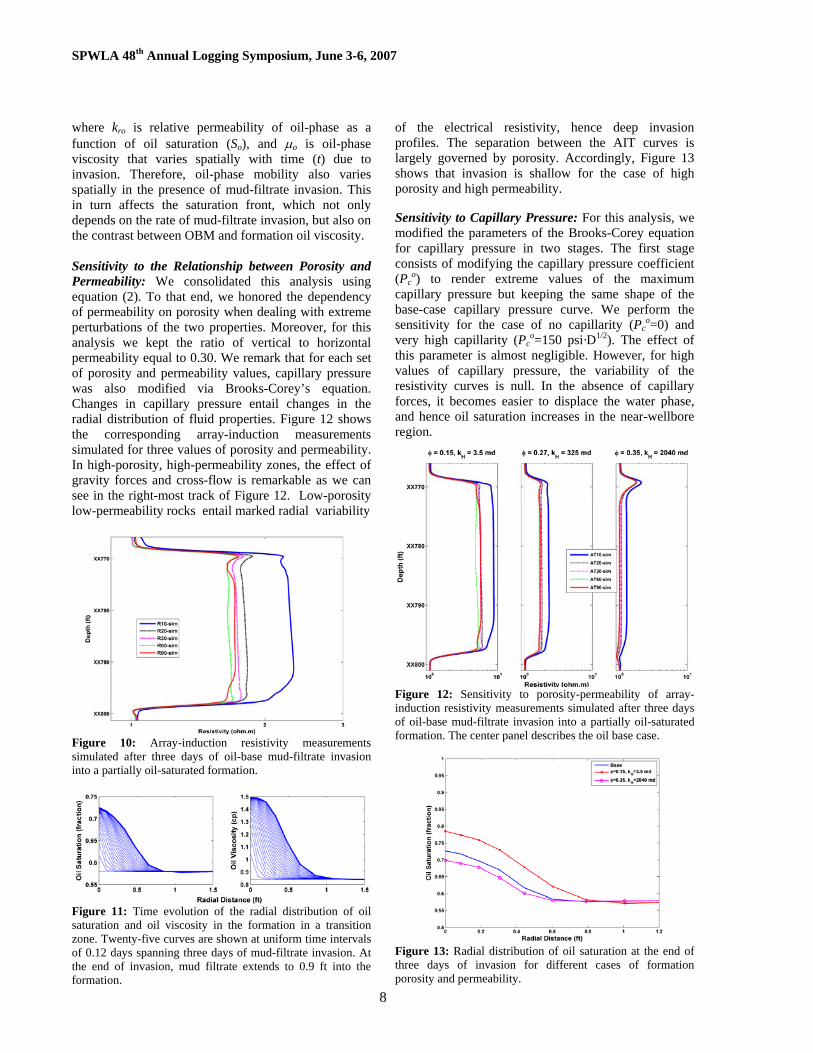
where kro is relative permeability of oil-phase as a function of oil saturation (So), and μo is oil-phase viscosity that varies spatially with time (t) due to invasion. Therefore, oil-phase mobility also varies spatially in the presence of mud-filtrate invasion. This in turn affects the saturation front, which not only depends on the rate of mud-filtrate invasion, but also on the contrast between OBM and formation oil viscosity. Sensitivity to the Relationship between Porosity and Permeability: We consolidated this analysis using equation (2). To that end, we honored the dependency of permeability on porosity when dealing with extreme perturbations of the two properties. Moreover, for this analysis we kept the ratio of vertical to horizontal permeability equal to 0.30. We remark that for each set of porosity and permeability values, capillary pressure was also modified via Brooks-Corey’s equation. Changes in capillary pressure entail changes in the radial distribution of fluid properties. Figure 12 shows the corresponding array-induction measurements simulated for three values of porosity and permeability. In high-porosity, high-permeability zones, the effect of gravity forces and cross-flow is remarkable as we can see in the right-most track of Figure 12. Low-porosity low-permeability rocks entail marked radial variability
Figure 10: Array-induction resistivity measurements simulated after three days of oil-base mud-filtrate invasion into a partially oil-saturated formation.
Figure 11: Time evolution of the radial distribution of oil saturation and oil viscosity in the formation in a transition zone. Twenty-five curves are shown at uniform time intervals of 0.12 days spanning three days of mud-filtrate invasion. At the end of invasion, mud filtrate extends to 0.9 ft into the formation.
of the electrical resistivity, hence deep invasion profiles. The separation between the AIT curves is largely governed by porosity. Accordingly, Figure 13 shows that invasion is shallow for the case of high porosity and high permeability. Sensitivity to Capillary Pressure: For this analysis, we modified the parameters of the Brooks-Corey equation for capillary pressure in two stages. The first stage consists of modifying the capillary pressure coefficient (Pc
o) to render extreme values of the maximum capillary pressure but keeping the same shape of the base-case capillary pressure curve. We perform the sensitivity for the case of no capillarity (Pc
o=0) and very high capillarity (Pc
o=150 psi·D1/2). The effect of this parameter is almost negligible. However, for high values of capillary pressure, the variability of the resistivity curves is null. In the absence of capillary forces, it becomes easier to displace the water phase, and hence oil saturation increases in the near-wellbore region.
Figure 12: Sensitivity to porosity-permeability of array-induction resistivity measurements simulated after three days of oil-base mud-filtrate invasion into a partially oil-saturated formation. The center panel describes the oil base case.
Figure 13: Radial distribution of oil saturation at the end of three days of invasion for different cases of formation porosity and permeability.
SPWLA 48th Annual Logging Symposium, June 3-6, 2007
9
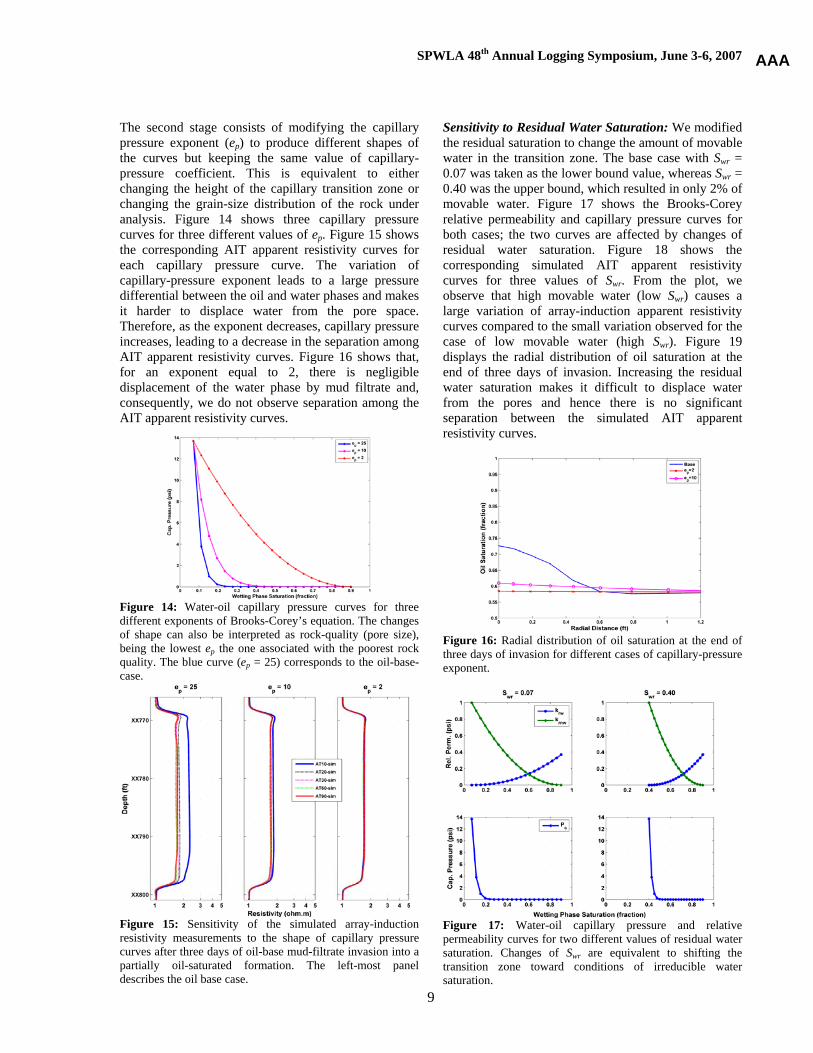
The second stage consists of modifying the capillary pressure exponent (ep) to produce different shapes of the curves but keeping the same value of capillary-pressure coefficient. This is equivalent to either changing the height of the capillary transition zone or changing the grain-size distribution of the rock under analysis. Figure 14 shows three capillary pressure curves for three different values of ep. Figure 15 shows the corresponding AIT apparent resistivity curves for each capillary pressure curve. The variation of capillary-pressure exponent leads to a large pressure differential between the oil and water phases and makes it harder to displace water from the pore space. Therefore, as the exponent decreases, capillary pressure increases, leading to a decrease in the separation among AIT apparent resistivity curves. Figure 16 shows that, for an exponent equal to 2, there is negligible displacement of the water phase by mud filtrate and, consequently, we do not observe separation among the AIT apparent resistivity curves.
Figure 14: Water-oil capillary pressure curves for three different exponents of Brooks-Corey’s equation. The changes of shape can also be interpreted as rock-quality (pore size), being the lowest ep the one associated with the poorest rock quality. The blue curve (ep = 25) corresponds to the oil-base- case.
Figure 15: Sensitivity of the simulated array-induction resistivity measurements to the shape of capillary pressure curves after three days of oil-base mud-filtrate invasion into a partially oil-saturated formation. The left-most panel describes the oil base case.
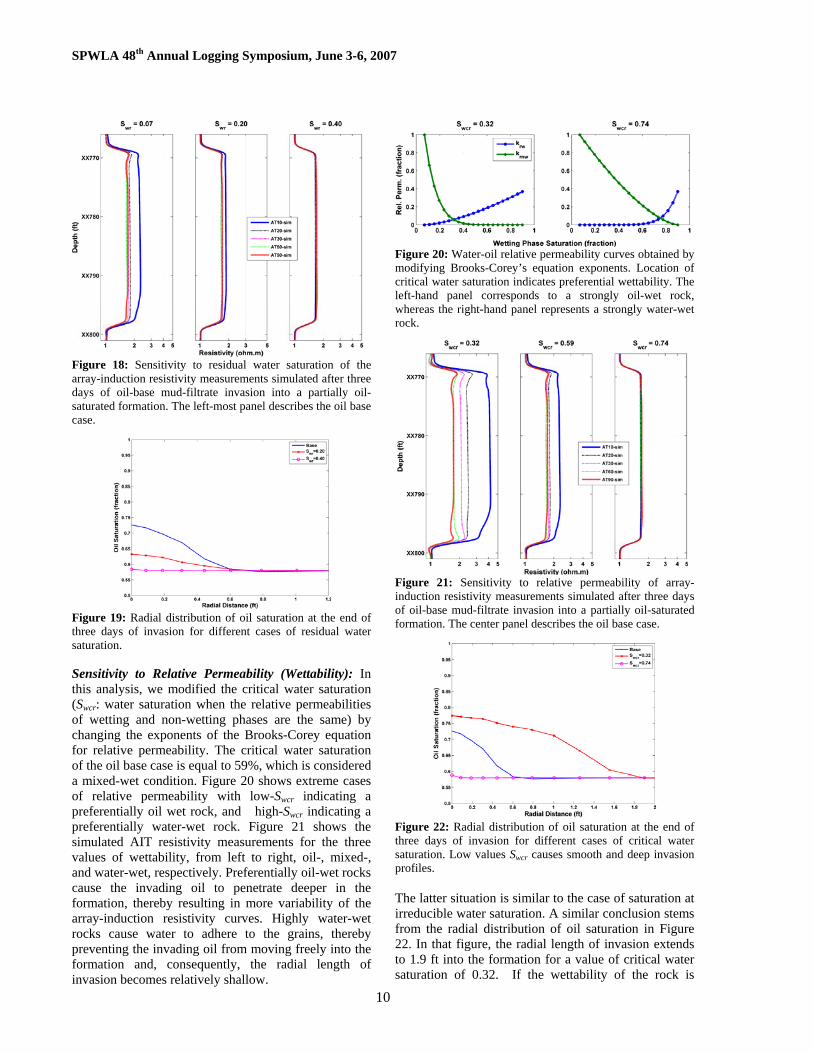
Sensitivity to Residual Water Saturation: We modified the residual saturation to change the amount of movable water in the transition zone. The base case with Swr = 0.07 was taken as the lower bound value, whereas Swr = 0.40 was the upper bound, which resulted in only 2% of movable water. Figure 17 shows the Brooks-Corey relative permeability and capillary pressure curves for both cases; the two curves are affected by changes of residual water saturation. Figure 18 shows the corresponding simulated AIT apparent resistivity curves for three values of Swr. From the plot, we observe that high movable water (low Swr) causes a large variation of array-induction apparent resistivity curves compared to the small variation observed for the case of low movable water (high Swr). Figure 19 displays the radial distribution of oil saturation at the end of three days of invasion. Increasing the residual water saturation makes it difficult to displace water from the pores and hence there is no significant separation between the simulated AIT apparent resistivity curves.
Figure 16: Radial distribution of oil saturation at the end of three days of invasion for different cases of capillary-pressure exponent.
Figure 17: Water-oil capillary pressure and relative permeability curves for two different values of residual water saturation. Changes of Swr are equivalent to shifting the transition zone toward conditions of irreducible water saturation.
AAA
SPWLA 48th Annual Logging Symposium, June 3-6, 2007
10
Figure 18: Sensitivity to residual water saturation of the array-induction resistivity measurements simulated after three days of oil-base mud-filtrate invasion into a partially oil-saturated formation. The left-most panel describes the oil base case.
Figure 19: Radial distribution of oil saturation at the end of three days of invasion for different cases of residual water saturation. Sensitivity to Relative Permeability (Wettability): In this analysis, we modified the critical water saturation (Swcr: water saturation when the relative permeabilities of wetting and non-wetting phases are the same) by changing the exponents of the Brooks-Corey equation for relative permeability. The critical water saturation of the oil base case is equal to 59%, which is considered a mixed-wet condition. Figure 20 shows extreme cases of relative permeability with low-Swcr indicating a preferentially oil wet rock, and high-Swcr indicating a preferentially water-wet rock. Figure 21 shows the simulated AIT resistivity measurements for the three values of wettability, from left to right, oil-, mixed-, and water-wet, respectively. Preferentially oil-wet rocks cause the invading oil to penetrate deeper in the formation, thereby resulting in more variability of the array-induction resistivity curves. Highly water-wet rocks cause water to adhere to the grains, thereby preventing the invading oil from moving freely into the formation and, consequently, the radial length of invasion becomes relatively shallow.
Figure 20: Water-oil relative permeability curves obtained by modifying Brooks-Corey’s equation exponents. Location of critical water saturation indicates preferential wettability. The left-hand panel corresponds to a strongly oil-wet rock, whereas the right-hand panel represents a strongly water-wet rock.
Figure 21: Sensitivity to relative permeability of array-induction resistivity measurements simulated after three days of oil-base mud-filtrate invasion into a partially oil-saturated formation. The center panel describes the oil base case.
Figure 22: Radial distribution of oil saturation at the end of three days of invasion for different cases of critical water saturation. Low values Swcr causes smooth and deep invasion profiles. The latter situation is similar to the case of saturation at irreducible water saturation. A similar conclusion stems from the radial distribution of oil saturation in Figure 22. In that figure, the radial length of invasion extends to 1.9 ft into the formation for a value of critical water saturation of 0.32. If the wettability of the rock is
SPWLA 48th Annual Logging Symposium, June 3-6, 2007
11
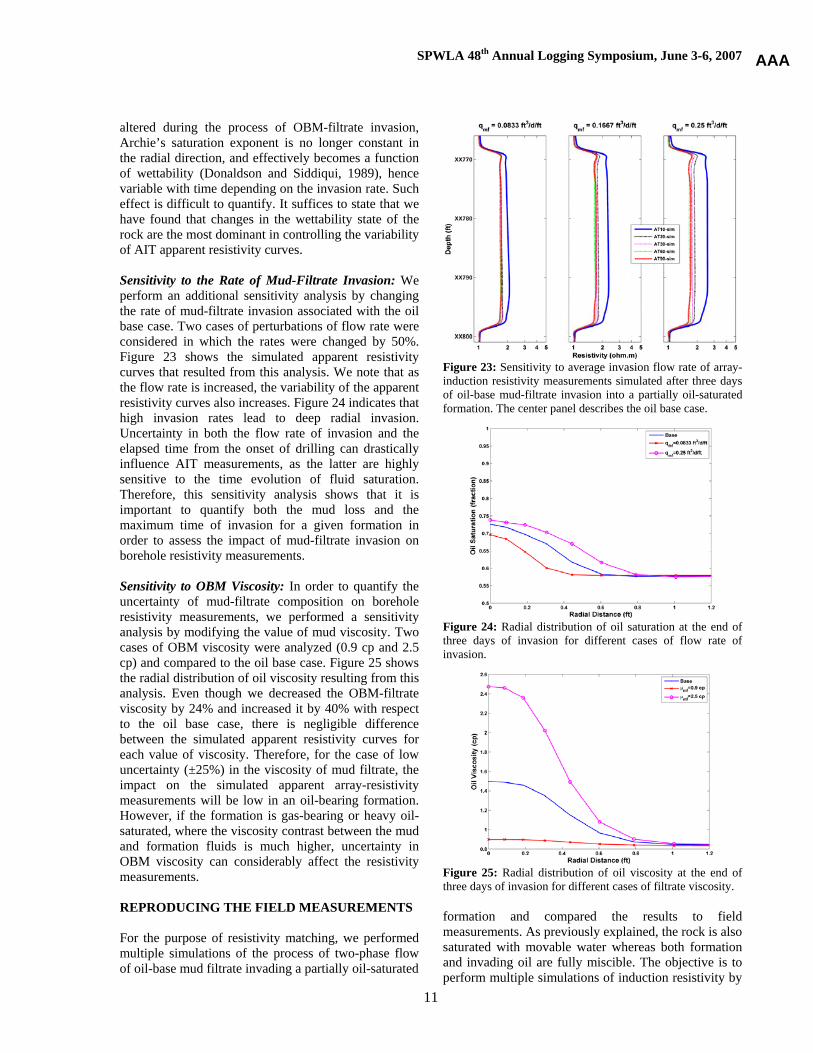
altered during the process of OBM-filtrate invasion, Archie’s saturation exponent is no longer constant in the radial direction, and effectively becomes a function of wettability (Donaldson and Siddiqui, 1989), hence variable with time depending on the invasion rate. Such effect is difficult to quantify. It suffices to state that we have found that changes in the wettability state of the rock are the most dominant in controlling the variability of AIT apparent resistivity curves. Sensitivity to the Rate of Mud-Filtrate Invasion: We perform an additional sensitivity analysis by changing the rate of mud-filtrate invasion associated with the oil base case. Two cases of perturbations of flow rate were considered in which the rates were changed by 50%. Figure 23 shows the simulated apparent resistivity curves that resulted from this analysis. We note that as the flow rate is increased, the variability of the apparent resistivity curves also increases. Figure 24 indicates that high invasion rates lead to deep radial invasion. Uncertainty in both the flow rate of invasion and the elapsed time from the onset of drilling can drastically influence AIT measurements, as the latter are highly sensitive to the time evolution of fluid saturation. Therefore, this sensitivity analysis shows that it is important to quantify both the mud loss and the maximum time of invasion for a given formation in order to assess the impact of mud-filtrate invasion on borehole resistivity measurements. Sensitivity to OBM Viscosity: In order to quantify the uncertainty of mud-filtrate composition on borehole resistivity measurements, we performed a sensitivity analysis by modifying the value of mud viscosity. Two cases of OBM viscosity were analyzed (0.9 cp and 2.5 cp) and compared to the oil base case. Figure 25 shows the radial distribution of oil viscosity resulting from this analysis. Even though we decreased the OBM-filtrate viscosity by 24% and increased it by 40% with respect to the oil base case, there is negligible difference between the simulated apparent resistivity curves for each value of viscosity. Therefore, for the case of low uncertainty (±25%) in the viscosity of mud filtrate, the impact on the simulated apparent array-resistivity measurements will be low in an oil-bearing formation. However, if the formation is gas-bearing or heavy oil-saturated, where the viscosity contrast between the mud and formation fluids is much higher, uncertainty in OBM viscosity can considerably affect the resistivity measurements. REPRODUCING THE FIELD MEASUREMENTS For the purpose of resistivity matching, we performed multiple simulations of the process of two-phase flow of oil-base mud filtrate invading a partially oil-saturated
Figure 23: Sensitivity to average invasion flow rate of array-induction resistivity measurements simulated after three days of oil-base mud-filtrate invasion into a partially oil-saturated formation. The center panel describes the oil base case.
Figure 24: Radial distribution of oil saturation at the end of three days of invasion for different cases of flow rate of invasion.
Figure 25: Radial distribution of oil viscosity at the end of three days of invasion for different cases of filtrate viscosity.
formation and compared the results to field measurements. As previously explained, the rock is also saturated with movable water whereas both formation and invading oil are fully miscible. The objective is to perform multiple simulations of induction resistivity by
AAA
SPWLA 48th Annual Logging Symposium, June 3-6, 2007
12
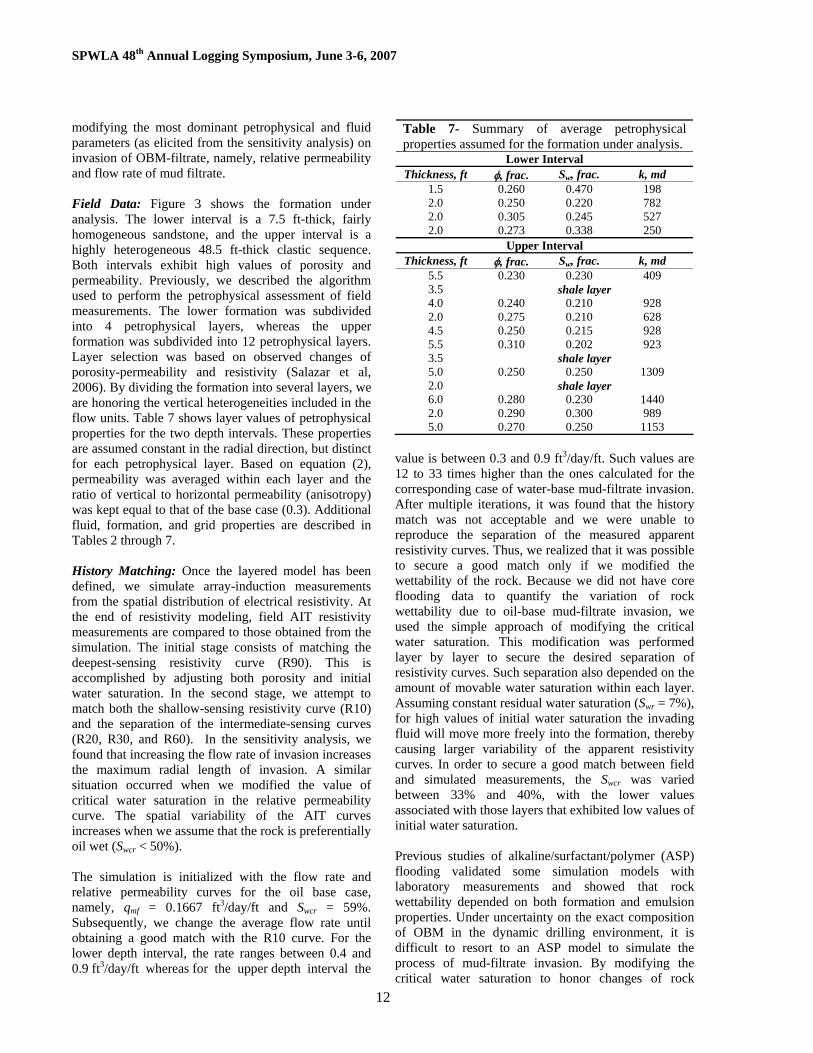
modifying the most dominant petrophysical and fluid parameters (as elicited from the sensitivity analysis) on invasion of OBM-filtrate, namely, relative permeability and flow rate of mud filtrate. Field Data: Figure 3 shows the formation under analysis. The lower interval is a 7.5 ft-thick, fairly homogeneous sandstone, and the upper interval is a highly heterogeneous 48.5 ft-thick clastic sequence. Both intervals exhibit high values of porosity and permeability. Previously, we described the algorithm used to perform the petrophysical assessment of field measurements. The lower formation was subdivided into 4 petrophysical layers, whereas the upper formation was subdivided into 12 petrophysical layers. Layer selection was based on observed changes of porosity-permeability and resistivity (Salazar et al, 2006). By dividing the formation into several layers, we are honoring the vertical heterogeneities included in the flow units. Table 7 shows layer values of petrophysical properties for the two depth intervals. These properties are assumed constant in the radial direction, but distinct for each petrophysical layer. Based on equation (2), permeability was averaged within each layer and the ratio of vertical to horizontal permeability (anisotropy) was kept equal to that of the base case (0.3). Additional fluid, formation, and grid properties are described in Tables 2 through 7. History Matching: Once the layered model has been defined, we simulate array-induction measurements from the spatial distribution of electrical resistivity. At the end of resistivity modeling, field AIT resistivity measurements are compared to those obtained from the simulation. The initial stage consists of matching the deepest-sensing resistivity curve (R90). This is accomplished by adjusting both porosity and initial water saturation. In the second stage, we attempt to match both the shallow-sensing resistivity curve (R10) and the separation of the intermediate-sensing curves (R20, R30, and R60). In the sensitivity analysis, we found that increasing the flow rate of invasion increases the maximum radial length of invasion. A similar situation occurred when we modified the value of critical water saturation in the relative permeability curve. The spatial variability of the AIT curves increases when we assume that the rock is preferentially oil wet (Swcr < 50%). The simulation is initialized with the flow rate and relative permeability curves for the oil base case, namely, qmf = 0.1667 ft3/day/ft and Swcr = 59%. Subsequently, we change the average flow rate until obtaining a good match with the R10 curve. For the lower depth interval, the rate ranges between 0.4 and 0.9 ft3/day/ft whereas for the upper depth interval the
Table 7- Summary of average petrophysical properties assumed for the formation under analysis.
Lower Interval Thickness, ft φ, frac. Sw, frac. k, md
1.5 0.260 0.470 198 2.0 0.250 0.220 782 2.0 0.305 0.245 527 2.0 0.273 0.338 250
Upper Interval Thickness, ft φ, frac. Sw, frac. k, md
5.5 0.230 0.230 409 3.5 shale layer 4.0 0.240 0.210 928 2.0 0.275 0.210 628 4.5 0.250 0.215 928 5.5 0.310 0.202 923 3.5 shale layer 5.0 0.250 0.250 1309 2.0 shale layer 6.0 0.280 0.230 1440 2.0 0.290 0.300 989 5.0 0.270 0.250 1153
value is between 0.3 and 0.9 ft3/day/ft. Such values are 12 to 33 times higher than the ones calculated for the corresponding case of water-base mud-filtrate invasion. After multiple iterations, it was found that the history match was not acceptable and we were unable to reproduce the separation of the measured apparent resistivity curves. Thus, we realized that it was possible to secure a good match only if we modified the wettability of the rock. Because we did not have core flooding data to quantify the variation of rock wettability due to oil-base mud-filtrate invasion, we used the simple approach of modifying the critical water saturation. This modification was performed layer by layer to secure the desired separation of resistivity curves. Such separation also depended on the amount of movable water saturation within each layer. Assuming constant residual water saturation (Swr = 7%), for high values of initial water saturation the invading fluid will move more freely into the formation, thereby causing larger variability of the apparent resistivity curves. In order to secure a good match between field and simulated measurements, the Swcr was varied between 33% and 40%, with the lower values associated with those layers that exhibited low values of initial water saturation. Previous studies of alkaline/surfactant/polymer (ASP) flooding validated some simulation models with laboratory measurements and showed that rock wettability depended on both formation and emulsion properties. Under uncertainty on the exact composition of OBM in the dynamic drilling environment, it is difficult to resort to an ASP model to simulate the process of mud-filtrate invasion. By modifying the critical water saturation to honor changes of rock
SPWLA 48th Annual Logging Symposium, June 3-6, 2007
13
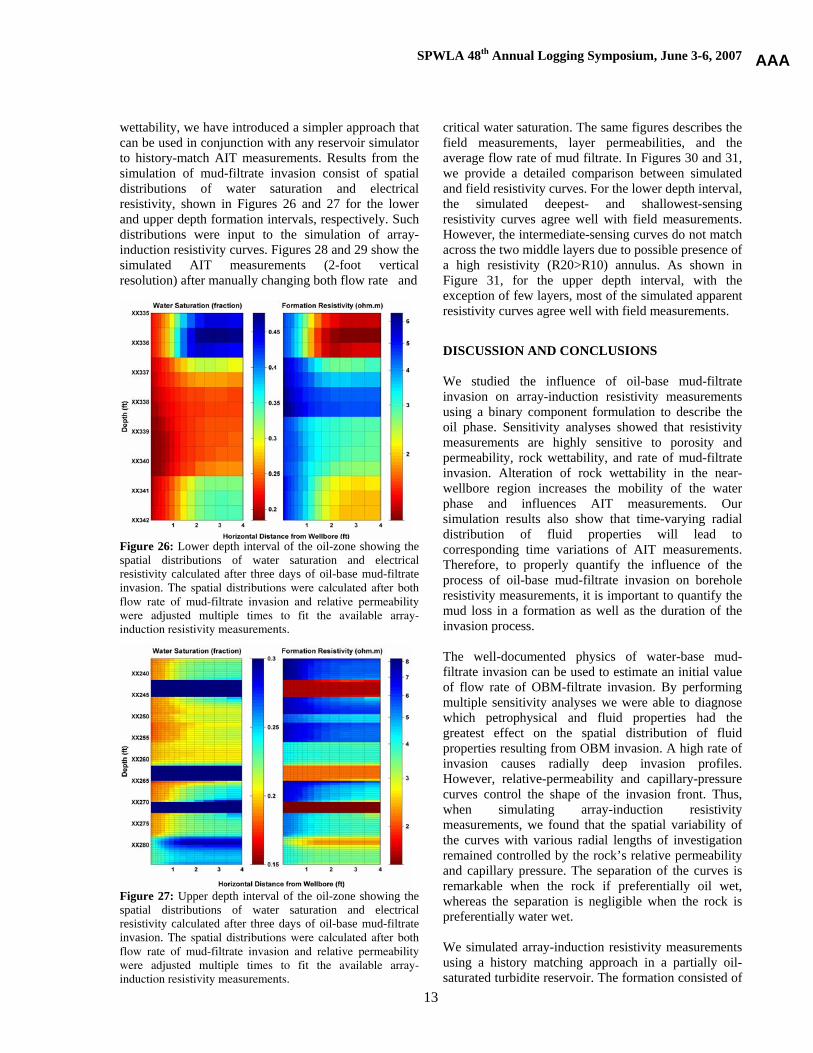
wettability, we have introduced a simpler approach that can be used in conjunction with any reservoir simulator to history-match AIT measurements. Results from the simulation of mud-filtrate invasion consist of spatial distributions of water saturation and electrical resistivity, shown in Figures 26 and 27 for the lower and upper depth formation intervals, respectively. Such distributions were input to the simulation of array-induction resistivity curves. Figures 28 and 29 show the simulated AIT measurements (2-foot vertical resolution) after manually changing both flow rate and
Figure 26: Lower depth interval of the oil-zone showing the spatial distributions of water saturation and electrical resistivity calculated after three days of oil-base mud-filtrate invasion. The spatial distributions were calculated after both flow rate of mud-filtrate invasion and relative permeability were adjusted multiple times to fit the available array-induction resistivity measurements.
Figure 27: Upper depth interval of the oil-zone showing the spatial distributions of water saturation and electrical resistivity calculated after three days of oil-base mud-filtrate invasion. The spatial distributions were calculated after both flow rate of mud-filtrate invasion and relative permeability were adjusted multiple times to fit the available array-induction resistivity measurements.
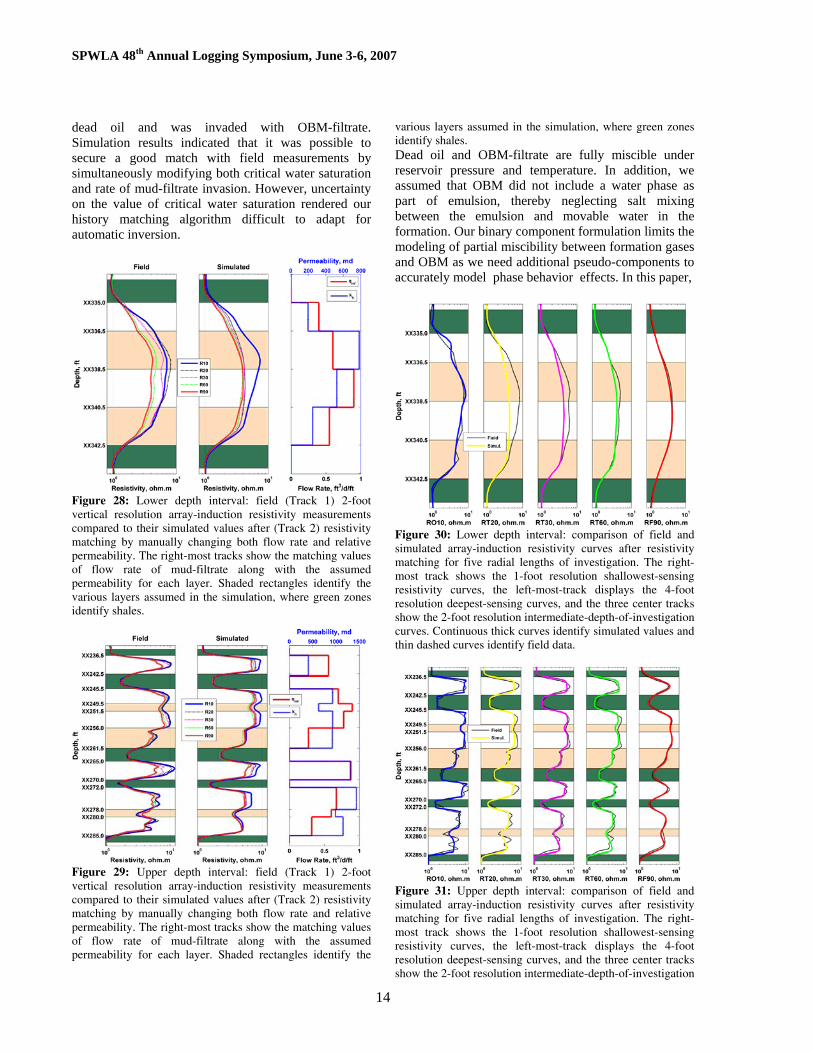
critical water saturation. The same figures describes the field measurements, layer permeabilities, and the average flow rate of mud filtrate. In Figures 30 and 31, we provide a detailed comparison between simulated and field resistivity curves. For the lower depth interval, the simulated deepest- and shallowest-sensing resistivity curves agree well with field measurements. However, the intermediate-sensing curves do not match across the two middle layers due to possible presence of a high resistivity (R20>R10) annulus. As shown in Figure 31, for the upper depth interval, with the exception of few layers, most of the simulated apparent resistivity curves agree well with field measurements. DISCUSSION AND CONCLUSIONS We studied the influence of oil-base mud-filtrate invasion on array-induction resistivity measurements using a binary component formulation to describe the oil phase. Sensitivity analyses showed that resistivity measurements are highly sensitive to porosity and permeability, rock wettability, and rate of mud-filtrate invasion. Alteration of rock wettability in the near-wellbore region increases the mobility of the water phase and influences AIT measurements. Our simulation results also show that time-varying radial distribution of fluid properties will lead to corresponding time variations of AIT measurements. Therefore, to properly quantify the influence of the process of oil-base mud-filtrate invasion on borehole resistivity measurements, it is important to quantify the mud loss in a formation as well as the duration of the invasion process. The well-documented physics of water-base mud-filtrate invasion can be used to estimate an initial value of flow rate of OBM-filtrate invasion. By performing multiple sensitivity analyses we were able to diagnose which petrophysical and fluid properties had the greatest effect on the spatial distribution of fluid properties resulting from OBM invasion. A high rate of invasion causes radially deep invasion profiles. However, relative-permeability and capillary-pressure curves control the shape of the invasion front. Thus, when simulating array-induction resistivity measurements, we found that the spatial variability of the curves with various radial lengths of investigation remained controlled by the rock’s relative permeability and capillary pressure. The separation of the curves is remarkable when the rock if preferentially oil wet, whereas the separation is negligible when the rock is preferentially water wet. We simulated array-induction resistivity measurements using a history matching approach in a partially oil-saturated turbidite reservoir. The formation consisted of
AAA
SPWLA 48th Annual Logging Symposium, June 3-6, 2007
14
dead oil and was invaded with OBM-filtrate. Simulation results indicated that it was possible to secure a good match with field measurements by simultaneously modifying both critical water saturation and rate of mud-filtrate invasion. However, uncertainty on the value of critical water saturation rendered our history matching algorithm difficult to adapt for automatic inversion.
Figure 28: Lower depth interval: field (Track 1) 2-foot vertical resolution array-induction resistivity measurements compared to their simulated values after (Track 2) resistivity matching by manually changing both flow rate and relative permeability. The right-most tracks show the matching values of flow rate of mud-filtrate along with the assumed permeability for each layer. Shaded rectangles identify the various layers assumed in the simulation, where green zones identify shales.
Figure 29: Upper depth interval: field (Track 1) 2-foot vertical resolution array-induction resistivity measurements compared to their simulated values after (Track 2) resistivity matching by manually changing both flow rate and relative permeability. The right-most tracks show the matching values of flow rate of mud-filtrate along with the assumed permeability for each layer. Shaded rectangles identify the
various layers assumed in the simulation, where green zones identify shales. Dead oil and OBM-filtrate are fully miscible under reservoir pressure and temperature. In addition, we assumed that OBM did not include a water phase as part of emulsion, thereby neglecting salt mixing between the emulsion and movable water in the formation. Our binary component formulation limits the modeling of partial miscibility between formation gases and OBM as we need additional pseudo-components to accurately model phase behavior effects. In this paper,
Figure 30: Lower depth interval: comparison of field and simulated array-induction resistivity curves after resistivity matching for five radial lengths of investigation. The right-most track shows the 1-foot resolution shallowest-sensing resistivity curves, the left-most-track displays the 4-foot resolution deepest-sensing curves, and the three center tracks show the 2-foot resolution intermediate-depth-of-investigation curves. Continuous thick curves identify simulated values and thin dashed curves identify field data.
Figure 31: Upper depth interval: comparison of field and simulated array-induction resistivity curves after resistivity matching for five radial lengths of investigation. The right-most track shows the 1-foot resolution shallowest-sensing resistivity curves, the left-most-track displays the 4-foot resolution deepest-sensing curves, and the three center tracks show the 2-foot resolution intermediate-depth-of-investigation
SPWLA 48th Annual Logging Symposium, June 3-6, 2007
15
curves. Continuous thick curves identify simulated values and thin dashed curves identify field data. we focused our analysis to a high-porosity, high-permeability formation and concluded that flow rate of invasion and relative permeability are the most dominant properties on the radial length of invasion and variability of AIT curves. However, this conclusion may not hold in low-porosity, low-permeability formations. As observed in the sensitivity analysis, low-porosity rocks entail deep invasion and hence result in significant variability of the apparent resistivity curves. Given the lack of laboratory measurements of wettability, we did not quantify the effect of variation of wettability on the saturation exponent. Donaldson and Siddiqui (1989) performed laboratory experiments by flooding crude oil into core samples and measured different values of Archie’s saturation exponent, n, for different values of oil saturation. As they injected oil, the rock became strongly oil-wet, thereby increasing the saturation exponent. Based on our comparisons to field measurements, we found that resistivity measurements acquired in the lower-depth interval oil zone were difficult to match due to the possible presence of a high-resistivity annulus. Such non-trivial radial invasion profiles could be attributed to the presence of surfactants on the emulsion forming the OBM. Including the presence of surfactants in the OBM is still work in progress. Finally, we showed that array-induction resistivity measurements can be modified due to deep invasion in zones with movable water saturation. ACKNOWLEDGEMENTS A note of special gratitude goes to Kerr-McGee for providing the data used in the field studies. The work reported in this paper was funded by the University of Texas at Austin’s Research Consortium on Formation Evaluation, jointly sponsored by Anadarko, Aramco, Baker Atlas, BP, British Gas, ConocoPhilips, Chevron, ENI E&P, ExxonMobil, Halliburton Energy Services, Hydro, Marathon Oil Corporation, Mexican Institute for Petroleum, Occidental Petroleum Corporation, Petrobras, Schlumberger, Shell International E&P, Statoil, TOTAL, and Weatherford. REFERENCES Alpak, F.O., Dussan V., E.B., Habashy, T.M., and Torres-Verdín, C., 2003, “Numerical simulation of mud filtrate invasion in horizontal wells and sensitivity analysis of array induction tools,” Petrophysics, v. 44, no. 6, pp. 396-411.
Archie, G.E., 1942, “The electrical resistivity log as and aid in determining some reservoir characteristics,” Petroleum Transactions, AIME, v. 146, pp. 54-62. Bourgoyne Jr., A.T., Millheim, K.K., Chenevert, M.E., and Young Jr., F.S., 1986, “Applied Drilling Engineering,” SPE Textbook Series, v. 2, Richardson, TX. Corey, A.T., 1994, “Mechanics of Immiscible Fluids in Porous Media,” Water Resources Publications, Highland Ranch, Colorado. Dewan, J.T. and Chenevert, M.E., 2001, “A model for filtration of water-base mud during drilling: determination of mudcake parameters,” Petrophysics, v. 42, no. 3, May-June, p. 237-250. Donaldson, E.C., and Siddiqui, T.K., 1989, “Relationship between the Archie saturation exponent and wettability,” SPE Formation Evaluation, v. 4, no. 3, pp. 359-362. La Vigne, J., Barber, T., and Bratton, T., 1997, Strange invasion profiles: what multiarray induction logs can tell us about how oil-based mud affects the invasion process and wellbore stability, paper B presented at the 38th Annual Logging Symposium: Society of Professional Well Log Analysts, Houston, TX, June 15-18, 12 p. Malik, M., Torres-Verdín, C., and Sepehrnoori, K., 2006, “Robust and efficient simulation of formation-tester measurements with a rigorous compositional simulation code,” paper SPE 102151 presented at the SPE Annual Technical Conference and Exhibition, San Antonio, Texas, September 24-27, 12 p. Peng, D. Y., and Robinson, J. D., 1976, “A new two-constant equation of state,” Industrial and Engineering Chemistry Fundamentals, v. 15, pp 59-64 Proett, M.A., Chin, W., Wu, J., and Manohar, M., 2002, “Sample quality prediction with integrated oil and water-based mud invasion modeling,” paper SPE 77964 presented at the SPE Asia Pacific Oil and Gas Conference and Exhibition, Melbourne, Australia, October, 8-10, 14 p. Salazar, J.M., Torres-Verdín, C., Alpak, F.O., Habashy, T.M., and Klein, J.D., 2006, “Estimation of permeability from borehole array induction measurements: application to the petrophysical appraisal of tight-gas sands,” Petrophysics, v. 47, no. 6, pp. 527-544. Todd, M. R., and Longstaff, W. J., 1972, “The development, testing, and application of a numerical simulator for predicting miscible flood performance,” Journal of Petroleum Technology, v. 253, pp. 874-882.
AAA
SPWLA 48th Annual Logging Symposium, June 3-6, 2007
16
Waxman, M.H. and Smits, L.J.M., 1968, “Electrical conductivities in oil-bearing shaly sands,” Transactions AIME, v. 243, Part II, p. 107-122.
Wu, J, Torres-Verdín, C., Sepehrnoori, K., and Proett, M.A., 2005, “The influence of water-base mud properties and petrophysical parameters on mudcake growth, filtrate invasion, and formation pressure,” Petrophysics, v. 46, no. 1, pp. 14-32. Yan, J. and Sharma M.M., 1989, “Wettability alteration and restoration for cores contaminated with oil-based muds,” Journal of Petroleum Science & Engineering, v. 2, no. 2, pp. 63-76. Zhang, G.J., Wang, G.L., and Wang, H.M, 1999, “Application of novel basis functions in a hybrid method simulation of the response of induction logging in axisymmetrical stratified media,” Radio Science, v. 34, no. 1, pp. 19-26. ABOUT THE AUTHORS
Mayank Malik is a Graduate Research Assistant and a Ph.D. Candidate in the Department of Petroleum and Geosystems Engineering at The University of Texas at Austin. He received a B.E. in Mechanical Engineering from Delhi College of Engineering in 2001 and M.A.Sc. in Mechanical Engineering from University of Toronto in 2004. Mayank has also worked as a summer intern for Shell International E&P on quantifying parameters affecting WFT measurements in gas condensates. He was bestowed two scholarships by the SPWLA. His research interests include petrophysics, inverse problems, and reservoir engineering. Jesús M. Salazar is a Graduate Research Assistant and a Ph.D. Candidate in the Department of Petroleum and Geosystems Engineering of The University of Texas at Austin. He received a B.Sc. degree in Physics (with honors) from Universidad Central de Venezuela in 1998 and a M.Sc. degree in Petroleum Engineering from The University of Texas at Austin in 2004. He worked 5 years for PDVSA (Maracaibo, Venezuela) as a petrophysicist and well-log analyst. Jesús has also worked as a summer intern for ConocoPhillips and Oxy performing petrophysical interpretation and modeling. He was bestowed a student grant, and three scholarships, by the SPWLA. His research interests include petrophysics, log analysis, inverse problems, and numerical reservoir simulation. Carlos Torres-Verdín received a Ph.D. degree in Engineering Geoscience from the University of California, Berkeley, in 1991. During 1991–1997 he held the position of Research Scientist with Schlumberger-Doll Research. From 1997–1999, he was Reservoir Specialist and Technology Champion with
YPF (Buenos Aires, Argentina). Since 1999, he has been with the Department of Petroleum and Geosystems Engineering of The University of Texas at Austin, where he currently holds the position of Associate Professor. He conducts research on borehole geophysics, well logging, formation evaluation, and integrated reservoir characterization. Torres-Verdín has served as Guest Editor for Radio Science, and is currently a member of the Editorial Board of the Journal of Electromagnetic Waves and Applications, and an associate editor for Petrophysics (SPWLA) and the SPE Journal. He is co-recipient of the 2003 and 2004 Best Paper Award by Petrophysics, and is recipient of SPWLA’s 2006 Distinguished Technical Achievement Award. Gong Li Wang received a B.Sc. degree in geophysical well logging and a Ph.D. degree in geophysics from the University of Petroleum, East China, in 1993 and 2001, respectively. From 1993 to 2002, he was affiliated with the University of Petroleum, East China teaching courses and conducting research on electromagnetic well logging. From 2002-2005, he was a Visiting Scholar and a Postdoctoral Research Associate with the Center for Computational Electromagnetics, University of Illinois at Urbana-Champaign. Since 2005, he has been a Postdoctoral Research Fellow and a Research Associate with the Center for Petroleum and Geosystems Engineering of The University of Texas at Austin. In 2001, he was awarded the Second Class Prize of the Award for Technological Innovation by China National Petroleum Corporation. His research interest is in wave propagation in inhomogeneous media, numerical modeling methods, and inverse problems. Hee Jae Lee is a Graduate Research Assistant and currently a Ph.D. candidate in the Department of Petroleum and Geosystems Engineering of The University of Texas at Austin. He is working in the Formation Evaluation Research Group supervised by Dr. Torres-Verdín. Hee-Jae has B.Sc. and M.Sc. degrees in Petroleum Engineering from Hanyang University, Korea. His main research area is in geomechanical-fluid flow coupling, and near wellbore simulation. He is the main code developer of UT Austin’s Formation Evaluation Tool Box (UTFET) and Formation Tester Toolbox (UTFTT). Kamy Sepehrnoori is the Bank of America Centennial Professor in the Department of Petroleum and Geosystems Engineering of The University of Texas at Austin. His teaching and research interests include computational methods, reservoir simulation, parallel computations, applied mathematics, and enhanced oil recovery. Sepehrnoori holds a Ph.D. degree in petroleum engineering from The University of Texas at Austin.