influence of nitrate and sulphate feeding ... - prr.hec.gov.pk
TRANSCRIPT

1
INFLUENCE OF NITRATE AND SULPHATE FEEDING ON ENTERIC
METHANE PRODUCTION IN SHEEP AND GOATS
By
MUHAMMAD ARIF
M.Sc (Hons) Animal Nutrition
A Dissertation submitted in partial fulfillment of the requirements for the
degree of
PhD
In
ANIMAL NUTRITION

2
Institute of Animal Sciences
Faculty of Animal Husbandry
University of Agriculture, Faisalabad
Pakistan
2015
To
The Controller of Examinations
University of Agriculture
Faisalabad
We, the Supervisory Committee, certify that the contents and form of
dissertation submitted by Mr. Muhammad Arif, Regd. No. 89-ag-831, have
been found satisfactory and recommend that it be processed for evaluation by
External Examiner(s) for the award of degree.
SUPERVISORY COMMITTEE
1)
Dr. Muhammad Sarwar
Chairman:
__________________
2)
Dr. Zafar Hayat
Co-Supervisor:
__________________

3
3)
Dr. Mahr un Nisa
Member:
__________________
4)
Dr. Muhammad Younas
Member:
__________________

4
Declaration
I hereby declare that the contents of thesis, title of thesis "Influence of nitrate and sulphate
feeding on enteric methane production in sheep and goats" are product of my own
research and no part has been copied from any published source (except the reference,
standard mathematical or genetic models/formulae/ protocols etc.). I further declare that this
work has not been submitted for award of any other diploma/degree. The University may take
action if information provided is found inaccurate at any stage.
______________
Muhammad Arif
89-ag-831

5
ACKNOWLEDGEMENT
I am thankful to Allah Almighty, the most Gracious and the most Beneficent, who
enabled me to accomplish this work. I am thankful to Muhammad (Peace be upon him) who
spread the message of Allah to enlighten our hearts and brains.
I would like to thank my supervisor, Professor Dr. Muhammad Sarwar (T.I,
Distinguished National Professor) for the patient guidance, encouragement and advice he has
provided throughout my time as his student.
I am also obliged to my supervisory committee for their cooperation during my
Ph.D study. I would like to thank University of Sargodha, Pakistan for awarding me
Scholarship for Ph.D. Studies under Faculty Development Program.
I pay thanks to all other staff and colleagues in the faculty and especially that of
Institute of animal nutrition and feed technology that helped me during my stay at the
campus. I am also thankful to my family that suffered much due to my studies.

6
Contents Page#
ACKNOWLEDGEMENT 6
TABLES OF CONTENTS iv
LIST OF TABLES vi
LIST OF FIGURES ix
ABSTRACT 1
Chapter 1 INTRODUCTION 2
Chapter 2 REVIEW OF LITERATURE 5
Global warming and climate change 5
Role of livestock in Global warming 11
Mitigation of enteric CH4 emission in ruminants 16
Improved feeding practices 16
Animal breeding and management changes 17
Immunisation 17
Bacteriophages and bacteriocins 18
Defaunation 18
Plant secondary compounds 19
Dietary supplements 20
Nitrate feeding 26
Nitrate and Sulphate feeding 28
Dietary Nitrate Adaptations 28
Effect of dietary nitrate on feed intake, growth
performance and rumen ecology
29
Measuring methane production 29
Chapter 3 MATERIAL AND METHODS 33
Experiment 1 33
Experiment 2 33
Experiment 3 34
Chapter 4 Effect of varying levels of potassium nitrate with or without
sulphur on enteric methane production in post weaned Lohi
sheep and Teddy goats
38
Abstract 38
Introduction 38
Materials and Methods 40
Results 42
Discussion 43
Chapter 5 Effect of different levels of calcium ammonium nitrate with or
without sulphur on enteric methane production in Lohi sheep and Teddy goats at growing age
56
Abstract 56
Introduction 57
Materials and Methods 58

7
Results 60
Discussion 61
Chapter 6 Effect of different levels of sodium nitrate with or without
sulphur on enteric methane production in Lohi sheep andTeddy goats at fattening age
72
Abstract 72
Introduction 73
Materials and Methods 74
Results 76
Discussion 77
General Conclusions 88
Chapter 7 Summary 89
Literature Cited 91

8
List of Tables Page#
Table 2.1 Important greenhouse gases: their formulae, lifetimes and
global warming potentials
7
Table 2.2 Summary of climate risks by south Asian countries 10
Table 2.3 Agriculture's contribution to global green house gas and other
emissions
13
Table 2.4 Estimated annual enteric methane emissions from the main
domesticated livestock species
15
Table 2.5 Rumen modifiers that lower enteric methane production per
unit animal product
25
Table 2.6 Methane measuring techniques 31
Table 2.7 Gasmet DX4030 (General Specifications) 36
Table 4.1 Ingredient composition of experimental diets 49
Table 4.2 Effect of different levels of potassium nitrate with or without
sulphur on Nutrient intake and their digestibility in post
weaning Lohi sheep and Teddy goat
50
Table 4.3 Effect of different levels of potassium nitrate with or without
sulphur on blood metabolites in post weaning Lohi sheep and
Teddy goat
51
Table 4.4 Effect of different levels of potassium nitrate with or without
sulphur on hematology in post weaning Lohi sheep and Teddy
goat
52
Table 4.5 Effect of different levels of potassium nitrate with or without
sulphur on nitrogen balance in post weaning Lohi sheep and
Teddy goat
53
Table 4.6 Effect of different levels of potassium nitrate with or without
sulphur on growth performance in post weaning Lohi sheep
and Teddy goat
54
Table 4.7 Effect of different levels of potassium nitrate with or without
sulphur on enteric methane production in post weaning Lohi
sheep and Teddy goat
55
Table 5.1 Ingredient composition of experimental diets 65
Table 5.2 Effect of different levels of calcium ammonium nitrate with or
without sulphur on Nutrient intake and their digestibility in
growing Lohi male sheep and Teddy goat
66
Table 5.3 Effect of different levels of calcium ammonium nitrate with or
without sulphur on blood metabolites in growing Lohi male
sheep and Teddy goat
67
Table 5.4 Effect of different levels of calcium ammonium nitrate with or
without sulphur on hematology in growing Lohi male sheep
and Teddy goat
68
Table 5.5 Effect of different levels of calcium ammonium nitrate with or 69

9
without sulphur on nitrogen balance in growing Lohi male
sheep and Teddy goat
Table 5.6 Effect of different levels of calcium ammonium nitrate with or
without sulphur on growth performance in growing Lohi male
sheep and Teddy goat
70
Table 5.7 Effect of different levels of calcium ammonium nitrate with or
without sulphur on enteric methane production in growing
Lohi male sheep and Teddy goat
71
Table 6.1 Ingredient composition of experimental diets 81
Table 6.2 Effect of different levels of sodium nitrate with or without
sulphur on Nutrient intake and their digestibility in Lohisheep
and Teddy goat
82
Table 6.3 Effect of different levels of sodium nitrate with or without
sulphur on blood metabolites in Lohisheep and Teddy goat
83
Table 6.4 Effect of different levels of sodium nitrate with or without
sulphur on hematology in Lohi sheep and Teddy goat
84
Table 6.5 Effect of different levels of sodium nitrate with or without
sulphur on nitrogen balance in Lohi sheep and Teddy goat
85
Table 6.6 Effect of different levels of sodium nitrate with or without
sulphur on growth performance in Lohi sheep and Teddy goat
86
Table 6.7 Effect of different levels of sodium nitrate with or without
sulphur on enteric methane production in Lohi sheep and
Teddy goat
87

10
List of Figures Page#
Figure 1 Enteric fermentation emission factors in developed countries 8
Figure 2 Enteric fermentation emission factors in developing countries 8
Figure 3 Agriculture growth percentages 9
Figure 4 Livestock population 9
Figure 5 Annual livestock production growth 12
Figure 6 Enteric fermentation (Regional classification) 14
Figure 7 Enteric fermentation (Average global emissions) 14
Figure 8 Break down of global emissions by animal type, averaged over
the period 2000-2010 for enteric fermentation.
15
Figure 9 Pathways for the microbial anaerobic fermentation of glucose
in ruminants (Nolan 1999).
26

11
Abstract
The objective of this study was to examine the effect of different nitrate sources with or
without sulphur (S) in a 2×3×2 factorial arrangement under Randomized Complete Block
Design (RCBD) on growth performance and enteric methane production in Lohi sheep and
Teddy goats. This study had 3 independent experiments. In experiment 1, 48 animals (24
sheep and 24 goats), 3 months old, were randomly divided into 12 groups, 4 animals in each
group. Twelve iso-nitrogenous (crude protein 18%) and iso-caloric (2.0 ME Mcal/Kg) diets
were formulated using 0, 3 and 6% potassium nitrate (PN) with 0.4% S (anhydrous MgSO4)
or without S for both sheep and goats. The experiment lasted for 90 days. Like experiment 1,
experiment 2 and 3 were conducted using ~ 0, 1.5 and 3% calcium ammonium nitrate (CAN)
and ~ 0, 2.5 and 5% sodium nitrate (SN) with 0.4% S (anhydrous MgSO4) or without S,
respectively. The gases were measured by using infra-red biogas analyzer. In experiment 1,
both nutrient intake and digestibility in weaned animals were similar (P> 0.05) across all
diets. Similar results were observed in experiment 2 & 3 on animals at six and nine months of
age respectively. In all three experiments animals fed diet containing 6% PN, 3% CAN and
5% SN with 0.4% S showed better nitrogen balance. Enteric CH4 was 32.6% reduced
(P<0.05) in lambs and 31.9% in goats fed diet containing 6% PN and 0.4% S compared to
those fed control diet (C). Daily live weight gain of of both lambs (146 g/day) and goats (66.0
g/day) fed diet containing 6% PN and 0.4% S was the highest and best values of feed
conversion ratio (FCR) (P<0.05) were also observed in both group of animals. Enteric CH4
was 28.6% reduced (P<0.05) in sheep and 26.9% in goats fed diet containing 3% CAN and
0.4% S compared to those fed C. Each sheep fed diet containing 3% CAN and 0.4% S gained
144 g/day, whereas daily live weight gain by goats fed diet containing 3% CAN with or
without S was 58 g/day. The enteric CH4 was 19.6% reduced (P<0.05) in sheep and 18.2% in
goats fed diet containing 5% SN and 0.4% S compared to those fed C. Daily live weight gain
of both sheep and goats fed diet containing 5% SN and 0.4% S was 143 and 59 g/day,
respectively. The FCR had better values in sheep and goats fed diet containing 5% SN and
0.4% S. In all the three experiments, none of the animal showed any kind of abnormal
behaviour or signs of illness during the whole experimental period. All the nitrate sources
showed similar response with sulphates during various stages of growth in sheep and goats.
In conclusion, animals fed diets containing 6% PN with 0.4% S, 3% CAN with 0.4% S and
5% SN with 0.4% S not only gained more weight but enteric CH4 production was also
reduced in these animals compared to those fed C.

12
Chapter 1
Introduction
Ruminants are considered as one of the major sources of greenhouse gases (GHG)
emission which is partially responsible for global warming (CONAM, 2001). The global
warming is considered one of the real issues of this century (FAO, 2006) because the
atmospheric tempretaure is expected to rise between 0.50C and 2.50C by 2030 (Moss et al.,
2000). The United Nations Framework Convention on Climate Change (UNFCCC, 2008)
reported expected rise between 1.80C and 4.00C by 2100. This increased temperature will
melt ice of Arctic and Antarctic poles and raise 17 to 26 cm sea level by 2030 (Moss et al.,
2000).
Ruminants emit about 80 million tonnes of methane (CH4) annually which accounts
for up to one third of the emitted CH4 worldwide (Beauchemin et al. 2008; IPCC, 2007). It is
predicted that enteric CH4 will increase over 30% from 2000 to 2020 (O’Mara, 2011). As
cattle lose 6% of their gross energy intake as CH4 (Johnson and Johnson, 1995) which lowers
animal productive efficiency. Thus, reduction of enteric CH4 would not only enhance the
animal productive efficiency but it will also mitigate environmental pollution (Beauchemin et
al., 2008). Thus, some efforts are required to develop ways and means to reduce CH4 gas
emission from ruminants.
There are many ways through which enteric CH4 can be minimized. They include
rearing of high yielding animals (Kirchgessner et al., 1995), immunisation (Hegarty, 2001),
biological control strategies (Klieve and Hegarty, 1999), various feed additives (Joblin, 1999;
Moss et al., 2000; Lopez et al., 1999; Asanuma et al., 1999; Wenk, 2003) and nutritional
manipulation (Dohme et al., 2000; Johnson and Johnson, 1995; Moss et al., 2000; Itabashi,
1994). These CH4 mitigating strategies can broadly be categorised into breeding and
management changes, usage of feed additives or specific agents and improved feeding
practices (Smith et al., 2008). Breeding and management changes are long term practices but
nutritional manipulation is short term and seems promising. Ruminants eructate 95% of CH4
through mouth and remaining 5% is removed through anus. Term enteric CH4 production
means total amount of CH4 eructated by animal in unit time. The composition of animal feed
has a potential bearing on the amount of enteric CH4 production (Ellis et al., 2008). Animals
in developed countries produce less methane per unit produced than under developed

13
countries due to feeding high concentrate rations, improved feed efficiency, better breeding
strategies and good health of animals (Smith et al., 2008).
Sheep and goats are important livestock species of animal agricultural in developing
countries and they play a pivotal role in economic uplifting of any country (Devendra, 2005).
Of the world's 1,614 million sheep and 475 million goats, 65% and 95%, respectively, are
located in developing countries. Small-ruminant population is 53% in developing countries of
Asia, particularly in India and Pakistan, 33% in Africa, and 14% in Latin America (FAO,
1984). In Pakistan the livestock accounts for approximately 55.4% of the agriculture value
added and 11.9% to GDP during 2012-13. There are 28.8 million sheep and 64.9 million
goats in Pakistan which constitute almost 55% of total livestock population in the country
(Fifure 4).
Among different thin tailed sheep breeds in Pakistan Lohi sheep is considered
relatively important with approximately 15% share of total sheep population in the region
(FAO, 1997). Khan et al. (2008) reported that teddy and beetal are two most inhabited goat
breeds in Punjab, Pakistan. Enzose, derived from the enzymatic conversion of corn starch, is
a byproduct of corn milling industry. It contains 85% dextrose, with its pH ranged from 3.5-
4.5. It is a rich source of fermentable carbohydrate and is usually in-expensive (Shahzad et
al., 2009; Sarwar et al., 2004).
In developing countries like Pakistan horizontal expansion of ruminants will result in
more enteric CH4 emissions.The enteric CH4 is produced under anaerobic conditions in the
rumen, by methanogenic Archaea that gain energy by reducing CO2 with H2 to form CH4.
Nitrate could potentially replace urea in low protein diets to provide a source of rumen
ammonia and provide a hydrogen sink to reduce enteric CH4 production (Leng, 2008). On
basal diets low in crude protein, the availability of ruminal ammonia is often a primary
deficiency which limits microbial growth and thus, reduces digestibility and feed intake.
Slow and stepwise inclusion of nitrate in the diet allows the rumen micro flora to adjust and
enhance their capacity to reduce both nitrate and nitrite (Alaboudi and Jones, 1985).
The S supplementation in the diet (Leng, 2008) or cystein (Takahashi et al., 1998) inclusion
might reduce nitrite accumulation in the rumen.
Nitrate being dietary nitrogen source can provide a hydrogen sink to reduce enteric CH4
production in ruminants (Leng, 2008). However, use of nitrate as a source of rumen
14
fermentable N and as an alternative hydrogen sink to carbon dioxide had previously
been neglected due to toxic effects of nitrite which is formed as an intermediate during
the reduction of nitrate to ammonia (Leng and Preston, 2010). It has been suggested that
nitrate reduction to ammonia could be suppressed by feed-back inhibition from high ruminal
ammonia (Leng, 2008). Sulphur supplementation in the diet (Leng, 2008) or cysteine
(Takahashi et al., 1998) inclusion reduced nitrite accumulation in the rumen. Sulphate is a
reductant (ΔG 0 = -21.1 kJ/mol of hydrogen; Ungerfeld and Kohn, 2006) and will also
compete for electrons and may lower CH4 production.
In-vitro gas production technique (IVGPT) has been commonly used to measure the
enteric CH4 production in ruminants (Lovett et al., 2004; Rymer et al., 2005; Pellikaan et al.,
2011; Navarro-Villa et al., 2011; Blummel and Orskov, 1993; Bhatta et al., 2006). This
IVGPT only simulates ruminal feed fermentation and does not take into account emissions
and digestibility by the entire animal. The results obtained regarding the usage of nitrate to
mitigate CH4 from IVGPT can not be directly applied in the entire animal. Thus, the scientific
evidence regarding the use of nitrate with or without S to mitigate in-vivo CH4 production is
limited.
Therefore, the present study was planned to examine the influence of different nitrate
sources with or without sulphur (S) on growth performance and enteric CH4 production in
sheep and goats. The hypothesis was that nitrate and S will mitigate the enteric CH4
production in both sheep and goats. Both nitrate and S will give an additive effect on the CH4
reduction.

15
Chapter 2
Review of Literature
Global warming and climate change
There are many factors which affect global warming and climate change and some of
the most important of them include green house gases (GHG), aerosols (liquid or solid
particles suspended in air), land cover and solar radiation. The GHG arise both from
anthropogenic and natural sources. However, according to Intergovernmental Panel on
Climate Change (IPCC, 2001), the increase in GHG concentration due to anthropogenic
sources is the main concern. The CH4, CO2, N2O, hydro fluorocarbons (HF) perfluorocarbons
(PFC) and SF6 are six GHG (UNFCCC, 2008). Each of the above mentioned gas has a
varying global warming potential (GWP) This GWP of various GHG is shown in table 2.1.
The CH4 has 25X higher warming potential than CO2 (Foster et al., 2007; IPCC, 2007).
Higher concentrations of these GHG in troposphere trap more heat resulting in warmer
atmosphere (Solomon et al., 2007; Table 2.1).
Green House Gases
The CO2, being the potential GHG, is liberated by variety of natural and man made
sources. Its concentration in troposphere has elevated from 280 to 379 ppm in 2005 (Solomon
et al., 2007). The combustion of fossil fuels share approximately 66% and land use change
(LUC) contributes 33% CO2 in earth's environment (Solomon et al., 2007; IPCC, 2001).
Land use change is a term used to measure carbon losses from soil and plants due to soil
cultivation or deforestation. The CO2 also has large sinks. Terrestrial biosphere and oceans
remove 50 to 60% of human induced CO2 from atmosphere (Solomon et al., 2007).
The combustion of fossil fuels, ruminants, rice cultivation, landfills, coal mining
gas/oil drilling are the main anthropogenic sources responsible for CH4 emissions. In
temperate regions, plants release insignificant amount of CH4 while emissions from tropical
rain forests are high (Lower, 2006; kirchban et al. 2006).
The N2O is released both by human and natural activities. Oceans, soils of grasslands,
savannas and forests are the natural N2O emission sources. The electricity generated by fossil

16
fuel combustion, nitric acid, nylon products, livestock urine and agricultural soils are human
induced sources responsible for N2O emissions (IPCC, 2001; Forster et al., 2007). The
natural sources contribute approximately 60% N2O emission and 40% is contributed d by
human activities (Solomon et al., 2007). Forster et al. (2007) reported 18% rise of N2O
concentrations in atmosphere since 1750. Indiscriminate use of fertilizers is responsible for
higher N2O emissions (Nevison and Holland, 1997). Various plant species are responsible for
its release in earth's environment (Hakata et al., 2003). Similarly, the HFC have been utilized
as alternative to hydro CFC and CFC in refrigeration and air conditioning industry and
responsible to increase the global warming effect (Forster et al., 2007).
The CF4 is one of the naturally occurring PFC. It is normally present in very low
concentrations in earth's atmosphere (Khalil et al., 2003). Forster et al. (2007) reported
approximately 50% increase in PFC concentrations since 1960 and it is permanently
contributing towards global warming. The aluminium and electronic chip manufacturing
industry are the main anthropogenic sources of PFC (Khalil et al., 2003).
The SF6 is often used as inert tracer in oceanic or atmospheric studies and is also
utilized as an insulating gas in electric equipment (Forster et al., 2007). Lindley and
Mcculloch (2005) reported very small SF6 emission rates. Contrarily, Forster et al. (2007)
reported increasing concentrations of SF6 in atmosphere.
The global warming is one of the burning issues of the twenty first century (FAO,
2006). It is expected to rise between 0.50C and 2.50C by 2030 (Moss et al., 2000) while
United Nations Framework Convention on Climate Change (2008) reported expected rise
between 1.80C and 4.00C by 2100. Melting of ice of Arctic and Antarctic poles and thermal
expansion of ocean water will result in main sea level rise of 17 to 26 cm by 2030 (Moss et
al., 2000). Pakistan geographically is located in region where the average temperature is
higher than global averages.
In Pakistan the livestock accounts for approximately 55.4% of the agriculture value
added and 11.9% to GDP during 2012-13. There are 28.8 million sheep and 64.9 million
goats in Pakistan which constitute almost 55% of total livestock population in the country
(Figure 3 and 4). Pakistan possesses both arid and semi arid conditions and its 24% land area
receive 250-500 mm and 60% receives 250 mm of annual rain fall. Pakistan contributes a
little towards global GHG emission by sharing only 0.8%. Pakistan is ranked 135 th in global

17
GHG per capita emission. However, Pakistan is the most liable to devastated effects of
climate change and is rated 12th most vulnerable country to climate change. The average
temperature in coastal areas of Pakistan rose from 0.6 to 1.00C since 1900S, resulting in 10 to
15% decrease in precipitation. The temperatures are still elevating and it is expected that this
might reach from 1.8 to 4.00C by the end of this century. In Asia, fresh water availability is
cogitated the most serious threat arising from climate change (Table 2.2)
In 2007-08, total CH4 production from manure and enteric fermentation was 3667.4
teragrams (Tg). Buffaloes contribute 55% and both non-dairy and dairy cattle contribute 24%
of total CH4 emission (Figure 2; Table 2.4).
Table 2.1 Important greenhouse gases: their formulae, lifetimes and global
warming potentials
Chemical species Formula Lifetime (yr)1 100-yr GWP2
Carbon dioxide CO2 50-2003 1
Methane CH4 12 25
Nitrous oxide N2O 114 298
Per fluoro methane CF4 50,000 7,390
HFC CHF3 270 14,8000
Sulphur hexafluoride SF6 3,200 22,800
(Solomon et al., 2007)
1 Global mean lifetime is calculated as the total atmospheric burden divided by mean global
sink of gas in steady state
2 Global warming potentials expressed on a weight basis relative to CO2 over a hundred year
time frame
3 Data from IPCC, 2001

18
Figure 1 Enteric fermentation emission factors in developed countries
All estimates + 20%
Source: Default fixed emission factors adopted by IPCC (IPCC, 1996)
Figure 2 Enteric fermentation emission factors in developing countries
All estimates + 20%
Source: Default fixed emission factors adopted by IPCC (IPCC, 1996)

19
Figure 3 Agriculture growth percentages
Source: Adapted from Pakistan economic survey 2012-13
Figure 4 Livestock population
Source: Adapted from Pakistan economic survey 2012-13

20
Table 2.2 Summary of climate risks by south Asian countries
Afghanistan Bangladesh Bhutan India Nepal Pakistan Maldives Sri Lanka
Sea Level rise - High - Modest - Modest High High
Glacier retreat High High High High High High - -
Temperature rise - High High High High High Modest High
Floods more frequent - - Likely High High Likely High -
Drought more frequent Likely High some
areas
- High - Likely - -
Source: Adapted from Symposium on “Changing Environmental Pattern and its impact with Special Focus on Pakistan” by R. K. Anver,
Pakistan Engineering Congress, 2011

21
Role of livestock in Global warming
Ruminants are considered as one of the major sources of GHG emission. They emit
about 80 million tonnes of CH4 annually which accounts for up to one third of the emitted
CH4 worldwide (Beauchemin et al. 2008; IPCC, 2007). Globally, Asia alone contributes 36%
of the enteric CH4 production (Figure 6). It is predicted that enteric CH4 will increase over
30% from 2000 to 2020 (O’Mara, 2011; Figure 7). The cattle generally lose 6% of their gross
energy intake as CH4 (Johnson and Johnson, 1995) and this indicates that CH4 production
makes livestock production inefficient. Thus, reduction in enteric CH4 would not only
mitigate environmental pollution but it will also enhance the animal productive efficiency
(Beauchemin et al., 2008). Efforts are required to develop the means to reduce CH4 emission
from ruminants which are partially responsible for global warming (CONAM, 2001). This is
a real challenge for animal nutritionists who are expected to develop feasible nutritional
strategy to reduce enteric CH4 emissions (Martin et al., 2008).
Smith et al. (2007) reported that share of agriculture in total global anthropogenic
GHG emission is about 10 to 12%. The total human induced global emissions from
agriculture in 2005 were 5.1 to 6.1 GtCO2-eq/yr and CH4‘s share was 3.3 GtCO2-eq/yr. The
concentration of global agricultural CH4 has risen by 17% for the last 15 years since 2005
(US-EPA, 2006). According to FAO (2009), global share of livestock is 36% of the gross
value of agriculture. The enteric CH4 production is considered one of the largest sources
contributing 32% of total non-CO2 emissions in 2005 (US-EPA, 2006).
World food requirement will increase 70% by 2050 and meat requirement will be
double by 2030 (FAO, 2009; Figure 5) because of ever increasing human population. It is
predicted that by year 2030, developing countries may constitute 85% of the world's
population. The population explosion in developing countries will raise the demand for meat
and milk (Figure 8) and their respective annual growth rate will be 2.5 and 2.4% from 2001
to 2030 (FAO, 2006).

22
Figure 5 Annual livestock production growth
Source: Adapted from World agriculture towards 2030/2050: the 2012 revision
(http://www.fao.org/docrep/016/ap106e/ap106e.pdf)

23
Table 2.3 Agriculture's contribution to global green house gas and other emissions
Gas Carbondioxide Methane Nitrous oxide Nitric oxide Ammonia
Main effects Climate change Climate change Climate change Acidification Acidification &
eutrophication
Agricultural source
(estimated %
contribution to total
global emissions)
Land use change
especially
deforestation
Ruminants (15)
Rice production (11)
Biomas burning (7)
Livestock (including
manure applied to
farmland) (17)
Mineral fertilizers (8)
Biomas burning (3)
Biomas burning (13)
Manure &
mineral fertilizers (2)
Livestock (including manure
applied to farmland) (44)
Mineral fertilizers (17)
Biomas burning (11)
Agricultural
emmisions as % of
total
anththropogenic
sources
15
49
66
27
93
Expected changes in
agricultural
emission to 2030
Stable or
declining
From rice:
Stable or Declining
From livestock:
rising by 60 %
35-60% increase From livestock:
rising by 60 %
Source FAO (2002)

24
Figure 6 Enteric fermentation (Regional classification)
Figure 7 Enteric fermentation (Average global emissions)
Percent average contributions to global emissions (MtCO2eq yr-1)
Source of Figure 6 & 7: The FAOSTAT database of greenhouse gas emissions from
agriculture by Francesco N Tubiello et al, 2013 Environ. Res. Lett. 8 (2013) 015009
doi:10.1088/1748-9326/8/1/015009

25
Figure 8 Break down of global emissions by animal type, averaged over the period 2000-
2010 for enteric fermentation.
Source: Adapted from Williams et al., 2008
Table 2.4 Estimated annual enteric methane emissions from the main
domesticated livestock species
Methane emissions
(kg CH4 animal-1 year-1)
Assumed average
body weight (kg)
Methane emission
g Kg BW-1year-1
Ruminants
Dairy cows 90 600 150
Beef cattle 65 400 163
Sheep 8 50 160
Goats 8 50 160
Non-ruminants
Swine 1 80 13
Poultry < 0.1 2 -
Horses 18 600 30
Source: Adapted from Sauvant, 1993

26
Mitigation of enteric CH4 emission in ruminants
There are many ways through which enteric CH4 can be minimized (Table 2.5). These
include rearing of high yielding animals (Kirchgessner et al., 1995), nutritional manipulation
(Dohme et al., 2000; Johnson and Johnson, 1995; Moss et al., 2000; Itabashi, 1994),
immunisation (Hegarty, 2001), biological control strategies (Klieve and Hegarty, 1999) and
various feed additives (Joblin, 1999; Moss et al., 2000; Lopez et al., 1999; Asanuma et al.,
1999; Wenk, 2003). These CH4 mitigating strategies can broadly be categorised into three
groups i.e. improved feeding practices, management changes and breeding, usage of feed
additives or specific agents (Smith et al., 2008; Soliva et al., 2006; Monteny et al., 2006).
Breeding and management changes are long term practices but nutritional manipulation is
short term and seems promising. The composition of animal feed has a potential bearing on
the amount of enteric CH4 production (Ellis et al., 2008). Animals in developed countries
produce less CH4 per unit produced as compared to the underdeveloped countries (Figure 1 &
2) due to feeding high concentrate rations, improved feed efficiency, better breeding
strategies and good health of animals (Smith et al., 2008).
Mitigation of enteric CH4 emission in ruminants by any dietary manipulation follows
same basic principle i.e. direct inhibition of methanogenesis, lowering of the hydrogen
production during ruminal fermentation or providing alternative H2 consuming pathways for
its use in the rumen (Martin et al., 2010). The potential of dietary strategies to reduce
CH4 emission by ruminants has been extensively reviewed (Tamminga et al., 2007;
Leng, 2008; Beauchemin et al., 2008; Martin et al., 2010; Eckard et al., 2011;
Grainger et al., 2011). Many chemicals have been used to mitigate CH4 but nitrates and
sulphates are very effective.
Improved feeding practices
The CH4 production in ruminants is also affected by feed type. In ruminants diet forage:
concentrate (F:C) has an impact on ruminal fermentation. The decreased F:C decreases the
acetate:propionate and feeding high concentrate diets might produce less CH4 production as
propionate might be the major alternative H2 sink after CH4 (Beauchemin and McGinn,
2005; Blaxter and Claperton, 1965; Fahey and Berger, 1988; Johnson and Johnson, 1995;
Lovett et al., 2003). When feeding at maintenance energy was offered, a loss of 6–7% of
gross energy intake was observed with forages and this loss was reduced to 2–3% in case of

27
high grain concentrates due to enteric CH4 emissions (Johnson and Johnson, 1995).
Improving pasture quality does not only enhance animal productivity but it also reduces
enteric CH4 in ruminants (Alcock and Hegarty, 2006; McCrabb et al., 1999; Leng, 1991).
Animal breeding and management changes
Improvement in the productive performance of animals through better management
practices and breeding, such as reduction in the number of animals, often results in the
reduction of CH4 output per unit of animal product (Boadi et al., 2004). Kebreab et al. (2007)
has proposed the direct selection of cattle for reduced CH4 production but still, it appears
impractical, because of difficult accurate measurement of CH4 emissions at a level suitable
for breeding programs. Meat producing animals with improved efficiency reach slaughter
weight at a younger age and thus have lower lifetime emissions (Lovett and O’Mara, 2003).
Adaptation of animals to reduced CH4 production can also be improved by employing
better breeding strategies. Many indigenous breeds are already acclimated to their harsh
conditions. However, in developing countries, lack of livestock production technologies
hinders the process of adaptation of animals. Adaptation strategies not only include tolerance
of animals to extreme weather conditions but also their livability, growth and reproductive
efficiency with poor nutrition, parasitic and disease resistance (Hoffmann, 2008). These
adaptation mechanisms include identification and conservation of indigenous breeds
acclimated to locally available feed resources and climatic conditions and improvement in
genetics of local breeds by cross breeding with disease resistance and heat tolerant breeds. If
climate change is faster than natural selection the risk of survival and adaptation of the new
breed becomes greater (Hoffmann, 2008).
Immunisation
Vaccination against methanogens may be another way for inhibiting methanogenesis
(Wright et al., 2004). This is based on the concept of a regular supply of antibodies to rumen
through saliva. McAllister and Newbold (2008) suggested that preparation of a recombinant
vaccine against cell surface proteins might improve the efficiency of vaccination as a CH4
inhibition method. Wright et al. (2004) observed 7.7% enteric CH4 production in sheep
vaccinated against methanogens. New vaccines against methanogenic bacteria are being
developed but are not yet in-vivo effective (Hristov et al., 2013; Williams et al., 2009; Wright

28
et al., 2004). More in-vivo work is required to develop effective vaccines which could abate
enteric CH4 production.
Bacteriophages and bacteriocins
Acetogenesis is one of the better alternatives to methanogenesis (Joblin, 1999). This
could spare from 4 to 15% energy gain to the animal. The reductive acetogenesis can be
accelerated directly by inhibiting methanogens with expected 13 to 15% energy gain (Nollet
et al., 1997). However, thermodynamically, CO2 reduction to acetate is less favorable than
enteric CH4 production (Joblin, 1999). In order to redirect H2 to acetogens instead of
methanogens in the rumen, bacteriocins may be effective. Lytic property of bacteriophages
and viruses infect both methanogenic bacteria and archaea (McAllister and Newbold, 2008)
and thus can be effective in reducing enteric CH4 production. However, Park et al. (2007)
reported that presently there are no bacteriophage which might be rumen methanogens
specific, but different bacteriophage populations are thought to be located in anaerobic
environment as in methanogenic biodigesters. Siphophages (siphoviridae phages) might
infect Methanobacterium, Methanobrevibacter and Methanococcus spp. which are
methanogens yet to be isolated from the rumen (McAllister and Newbold, 2008). Most of the
work done is still at early stages and requires extensive research for the availability of
commercial vaccines.
Defaunation
Protozoa contribute up to 50% of the fibrolytic activity in ruminants (Coleman, 1986).
Ushida et al. (1997) reported that defaunation was associated with mitigation of CH4
emission in ruminants. Hegarty (1999) associated defaunation with lower methanogenesis
due to the symbiotic interaction between protozoa and methanogens. Various effective
defaunating agents tested in-vivo, include lauric acid, coconut oil (Sutton et al., 1983;
Machmuller and Kreuzer, 1999; Hristov et al., 2004, 2009, 2011, Hollmann and Beede, 2012)
and linseed oil (Doreau and Ferlay, 1995). The defaunation in ruminants often results in
lower ruminal NH3 (Eugène et al., 2004) and higher propionate concentration (Bird et
al., 2008). The efficiency of microbial protein (MP) synthesis and its flow to the duodenum
was also improved by defaunation (Eugène et al., 2004). Therefore, the defaunation would
enhance animal performance when diets are deficient in protein. The role of protozoa in
mitigating CH4 production was reinvestigated by McAllister and Newbold (2008) who orally
administered ruminal fluid from faunated adult sheep to lambs and other group was given

29
defaunated ruminal fluid. They reported that lambs receiving defaunated ruminal fluid
emitted 26% less CH4 per kg DM intake than those receiving faunated ruminal fluid. Morgavi
et al. (2010) reported up to 10% CH4 reduction with defaunation while Hristov et al. (2013)
reported no effect of defaunation on methanogens in dairy cows treated with lauric acid. In-
vitro and in-vivo data and short and long-term defaunation experiments present contradictory
results (Ranilla et al., 2003) and the extent of defaunation in reducing methanogenesis is still
ambiguous. Variable responses of defaunation do not make this as a feasible CH4 mitigating
option.
Plant secondary compounds
Many compounds extracted from plants have been screened and utilized for
abatement of CH4 emission from the rumen by altering rumen fermentation. Most studied
compounds include saponins, tannins, essential oils and their active ingredients (Hristov et
al., 2013). Protozoa numbers were affected by use of plant extracts (Broudiscou et al., 2000).
Rhubarb (Rheum palmatum) probably restricts ruminal methanogens (García-González et al.,
2006). Ferme et al. (2007) reported that garlic oil, allyl mercaptan and diallyl disulfide
reduced CH4 production after 17 h of incubation. The in-vitro experiments indicated that
garlic oil decreased CH4 production due to its antimicrobial properties (García-González
et al., 2008, Chaves et al., 2008). Moreover in-vitro studies revealed that Diallyl disulfide
(DADS), the chief constituent of garlic oil, decreased CH4 emissions but it still requires in-
vivo authentication. The ruminal volatile fatty acid (VFA) concentration increased in lactating
cows fed diets containing 5 g garlic essential oil daily but it did not affect animal
performance (Yang et al., 2007). The allicin might have directly inhibited rumen
methanogens (McAllister and Newbold, 2008). In-vitro data indicated that tannins, essential
oils and saponins had the ability to hinder methanogenesis (Calsamiglia et al., 2007, García-
González et al., 2008). The dietary tannins reduced both voluntary feed intake & digestibility
(Grainger et al., 2009; Beauchemin et al., 2008; Min et al., 2003) and because of being toxic
to methanogens, they mitigated enteric CH4 by 13 to 16% on DMI basis (Grainger et al.,
2009; Carulla et al., 2005; Woodward et al., 2004). Lila et al. (2003) in one of the in-vitro
studies observed downward trend of CH4 production when yucca saponins were added to the
incubation medium. Cheeke (2000) reported that saopnin's strong detergent properties
reduced the number of rumen protozoa by disrupting their cell membrane (Cheeke, 2000).
Elimination of protozoa diminished CH4 production by 9 to 25% in-vitro (Newbold et
al.,1995). Significant diminution in the number of protozoa was observed in response to

30
yucca extract (Lovett et al., 2006). Beauchemin et al. (2008) highlighted the fact that
mitigating ability of plant saponins was source dependent. Some are more effective than
others and their use is still not cost effective. These compounds might have reduced the
growth of rumen methanogens and thus reduced CH4 emission in-vitro (Miller and Wolin,
2001). It can be concluded that plant extracts are expensive in mitigating CH4 but their effect
is not consistent and is source dependent.
Dietary supplements
Different compounds have been supplemented in the feed as additives specifically to
reduce CH4 emission from the rumen. The routinely used compounds include ionophores,
probiotics, organic acids, enzymes, halogenated compounds, hormones, fatty acids and other
chemical substances. The response of these dietary supplements is briefly described in Table
2.5.
Ionophores
In modern beef industry, monensin is the most studied and routinely used ionophore.
These have been extensively studied as a CH4 mitigating agent which can provide alternate
hydrogen sink in rumen environment. Ionophores when added to ruminant diets decreased
CH4 production and improved efficiency of feed utilization (Mathison et al. 1998). Guan et
al. (2006) reported that this reduction apparently correlated to an inhibition of ciliate
protozoa numbers in rumen fluid. Hino et al. (1993) reported that monensin depressed the
population of protozoa and cellulolytic bacteria resulting in lower CH4 production. Monensin
is a polyether ionophore which diverts the VFA-pattern in the rumen towards propionate.
This changed VFA pattern provides an alternative hydrogen sink. However, CH4 emission is
not persistent and after 2nd week no reduction in CH4 per unit of intake was observed
(Carmean et al., 1991). Similarly, Odongo et al. (2007), McCaughey et al. (1997) and Sauer
et al. (1998) reported that CH4 mitigation with repeated or prolonged use of ionophores was
not clear. The enteric CH4 can be abated up to 10% if higher doses (24-35 ppm) of
ionophores were used (Van Vugt et al., 2005; McGinn et al., 2004; Sauer et al., 1998).
Hristov et al. (2013) reported that effects of monensin could be enhanced by dietary
modifications and increasing monensin dose. It can be concluded that the overall effect of
ionophore is inconsistent and is dose and energy dependent. Although they have low CH4
mitigating potential, but are still effective.

31
Probiotics
Probiotics are frequently used as feed additive in animal production. Yeast-based
products are more common probiotics used in ruminant nutrition. The use of probiotics for
enteric CH4 abatement in ruminants have not shown significant results (McGinn et al., 2004)
but if specific strains were selected they might have given better results (Newbold et al.,
1996; Newbold and Rode, 2006). Cheng et al. (1988) observed that NH3 was generated
during nitrite reduction by Megasphaera elsdenii. Quantitative increase in microbes capable
of reducing nitrite, reduce both CH4 production and nitrite toxicity (Morgavi et al., 2010).The
Wolinella succinogenes has the ability to reduce nitrate into NH3 with little accumulation of
nitrites (Simon, 2002).The Saccharomyces cerevisiae inclusion in ruminant's diet reduced
CH4 by 10% in-vitro, but long term studies show that CH4 reduction is not consistent
(Mutsvangwa et al., 1992; Martin et al., 1989). Several other studies reported inconsistent
effects of Megasphaera elsdenii on ruminal pH and fermentation (Klieve et al., 2003;
Henning et al., 2010). The use of Candida Kefyr and Lactococcus lactis along with nitrate
supplementation was not effective to control methanogens (Takahashi, 2011). Still more
work is required to identify specific strains which may be effective in reducing enteric CH4
production. The cost effective availability of such products can be a good solution.
Organic acids
Use of organic acids as electron receptors has recently received attention. Among these,
fumarate and malate have been the most studied. In ruminants, these organic acids can
increase propionate production, consuming hydrogen in the process. Reduction of fumaric
acid may provide an alternative electron sink for hydrogen (Boadi et al., 2004). Contradictory
results have been observed in many in-vivo experiments regarding use of these compounds on
CH4 production (Bayaru et al., 2001, Wallace et al., 2006, Kolver and Aspin, 2006, Wood et
al., 2009). The role of fumarate in lowering CH4 production has been investigated both in-
vivo and in-vitro (Asanuma et al., 1999, García Martínez et al., 2005). A lot of variability has
been observed in in-vivo experiments. A few of them (Bayaru et al., 2001, Wallace et al.,
2006) showed decrease in CH4 production while others (McGinn et al., 2004, Kolver and
Aspin, 2006, Beauchemin and McGinn, 2006, McCourt et al., 2008) showed no effects.
Ungerfeld et al. (2007) did meta-analysis of in-vitro studies. They reported that fumarate is

32
often partially converted to propionate, but is also converted to acetate, liberating H2. In batch
culture, fumarate and acrylate produced the most consistent reductions in CH4 emissions. It
was also reported that fumarate was more efficient than acrylate in artificial rumens.
According to their results both fumarate and malate have lower mitigating effect than
nitrates. Kolver et al. (2004) reported that in continuous fermenters with forage as substrate,
fumarate mitigated CH4 production by 38%. Contrarily feeding fumarate (1% of DM intake)
did not reduce CH4 production in growing beef cattle (McGinn et al., 2004; Beauchemin and
McGinn, 2006). O’Mara (2004) showed non-significant reduction in CH4 when 3% malate
was added to the diet of dairy cattle. It appears that it would be uneconomical even if organic
acids are supplemented in diet (Newbold et al., 2005; McAllister and Newbold, 2008). In
contrary to fumarate, malate, acrylate and dicarboxylic acids are not cost effective as a
mitigation agents and show response only at high doses (McAllister and Newbold, 2008). It
can be concluded that long term effect of these compounds is yet to be established. Moreover,
these compounds are expensive to be used as CH4 mitigant.
Enzymes
Enzymes, like cellulases and hemicellulases can be considered as an abatement
strategy. They enhance fiber digestion in ruminants and reduce enteric CH4 production by
28% in-vitro and 9% in-vivo (Beauchemin et al., 2003; Beauchemin et al., 2008). Recently,
Hristov et al. (2013) reported that enzymes may improve digestibility and animal production,
resulting in decreased fermentable organic matter, thus lowering enteric CH4 production in
ruminants. Contrarily, Chung et al. (2012) reported increased CH4 production per unit of
DMI, in lactating cows using exogenous enzymes endoglucanase and xylanase. The use of
enzymes in paper, textile and food processing in large quantities ensures its bulk availability
at cost effective (Beauchemin et al., 2008). It can be concluded that use of enzymes as CH4
mitigating option is not feasible because of their lower affectivity.
Halogenated compounds
These are some chemical compounds with specific inhibitory effect on rumen
microbes. These are halogenated compounds which include bromochloromethane,
chloroform, 2-bromoethane sulfonate and cyclodextrin. These compounds inhibit
methanogenesis by reacting with coenzyme B (cobamine), which functions at the last step of
the methanogenic pathway (Shima et al., 2002; McCrabb et al., 1997; Chalupa, 1977).

33
Bromochloromethane and chloroform are potent halogenated compounds used as enteric CH4
inhibitors. Higher doses can reduce 91% CH4 on DMI basis (Tomkins and Hunter, 2004).
Other researchers (Immig et al. 1996; Lila et al., 2004; Mitsumori et al., 2011; Knight et al.,
2011) reported up to 50% CH4 reductions with these compounds in ruminants. Immig et al.
(1996) suggested that animals should be pre-adapted to these compounds for long term
efficacy. Reduced intake, side effects & transitory effects limit their use as better CH4
mitigant (Van Nevel and Demeyer, 1995; Wolin et al., 1960). There was sudden drop in CH4
production in cows administered chloroform but enteric CH4 production gradually increased
at later stages (Knight et al., 2011). A 60% CH4 reduction was observed in cows (Haisan et
al., 2013) supplemented with 3-nitro oxypropanol whereas 24% was observed in sheep fed
diets with similar compounds (Martinez-Fernandez et al., 2013). Bromochloromethane is a
banned compound therefore cannot be suggested as CH4 mitigant. Moreover, compounds like
chloroform are known carcinogens therefore cannot be adopted. These are effective CH4
mitigants but because of hazards regarding their use, they cannot be recommended.
Bovine somatotropin (bST)
Bovine somatotropin (bST) and hormonal growth implants are genetically engineered
metabolic modifiers approved for use in some countries. They do not specifically suppress
CH4 formation, but by improving animal performance (Bauman, 1992; Schmidely, 1993),
they can reduce emissions per-kg of animal product (Johnson et al., 1992; McCrabb, 1997).
Their use is controversial, consumer acceptability is a major issue.
Fatty acids
Dietary fats include tallow, prilled fat, various calcium salts of fatty acid and oil
seeds. Supplementation of these compounds may reduce DMI which in combination with
increased productive performance results in better feed efficiency and, consequently, lower
CH4 emissions. Many studies have shown that the inclusion of dietary fat can mitigate CH4
production in ruminants (Machmüller, 2006, Jordan et al., 2006b, Martin et al., 2008).
Eugene et al. (2008) reported that reduced ruminal CH4 production in cows fed diets
containing fat was because of reduced DMI by cows. Quantitatively less amount of hydrogen
is produced per unit of feed when higher levels of fat are added in ruminant's diet which
consequently decreased CH4 emissions. When sunflower oil was fed approximately 5% of
DMI, it reduced enteric CH4 production by 22% (McGinn et al., 2004). Feeding canola oil
lowers feed intake and fibre digestibility consequently reducing animal productivity

34
(Beauchemin and McGinn, 2006). Martin et al. (2008) found that dietary inclusion of linseed
in ruminant's diet lowered enteric CH4 production and animal productivity. In order to prove
the sustainability of these products more research is required. Odongo et al. (2007b) found
that when myristic acid was supplemented at 5% of diet DM, lactating dairy cows decreased
36% of daily CH4 emissions. Eugene et al. (2008) and Martin et al. (2010) proposed
increasing fat in ruminant’s diet as a promising strategy to mitigate enteric CH4 production.
Types of fatty acids affects methanogenesis in ruminants (Czerkawski et al., 1966b, Prins et
al., 1972). Czerkawski et al. (1966a) reported that the addition of C18 fatty acids reduced
enteric CH4 emissions to the degree of unsaturation. In-vitro studies revealed that specific
medium chain fatty acids lowered methanogenesis (Dohme et al., 2001). During in-vitro
studies when cyclodextrin complexes of capric (C10:0) or caprylic (C8:0) acid were
incubated with rumen fluid, significant CH4 reductions were observed (Ajisaka et al.,
2002). Inclusion of 40 mg of capric acid with the β-cyclodextrin carrier to 60 mL
medium resulted in 60% while the inclusion of 20 mg of capric acid resulted in 40%
reduction in CH4 production. Similar observations were provided by Goel et al. (2009) who
observed 45 and 88% reduction in CH4 production when 20 and 30 mg of capric acid were
added to 50 mL incubation medium, respectively. According to Beauchemin et al. (2008), 5
to 6% enteric CH4 was reduced in animals fed diets containing 1% fat on DM basis. Martin et
al. (2010) reported that 37 to 52% enteric CH4 could be abated if animals were fed fat
supplemented diets. Thus, it can be concluded that lipids cannot be considered as better CH4
mitigating option as they may cause significant drop in feed intake in ruminants.

35
Table 2.5 Rumen modifiers that lower enteric methane production per unit
animal product
Strategy Mode of action comments
Defaunation Decreases: Protozoa; H2;
archaea
Microbial adaptation
Saponins e.g yucca schidigera Decreases: Protozoa; H2;
archaea
Microbial adaptation
Tannins e.g sainfoin Decreases:Protozoa;
archaea
Microbial adaptation
More concentrate & starch ( or
Algae) in diet
Increases propionate;
H2 sink
Competes with monogastrics
PUFA, e.g Linseed C 18:3 fish
oil, EPA, DHA
Decreases celluololysis;
small H2 sink
Dose dependent; DMI may
drop
Saturated fatty acids e.g C12:0;
C14:0
Archaea inhibition Decreases DMI
Organic acids e.g Fumaric,
malic
H2 sink Small effect; expensive
Reduction of nitrate and
sulphate
H2 sink Persistent;
toxic intermediates
Ionophores e.g Monensin Increases propionate;
H2 sink
Microbial adaptation
Enzymes, yeast and probiotics Increases propionate;
H2 sink,pH
Varying results
Other plant extracts e.g garlic
,eucalyptus
Archaea inhibition Microbial adaptation
Immunization against archaea Archaea inhibition More research required
Bacteriocins & archael viruses Archaea inhibition More research required
Short chain nitrocompounds Archaea inhibition; H2
sink
More research required
Source: Adapted from Boadi et al., 2004, Beauchemin et al., 2008 and Martin et al., 2010

36
Nitrate feeding
Nitrate can replace CO2 as an electron acceptor. This reduces nitrate to nitrite and then
to NH3. Nitrate is reduced to nitrite due to NADH reduction and assimilatory nitrite
ammonification results in reduction of nitrite to NH3 coupled with ATP formation (Simon,
2002; Figure 9). One mol nitrate reduces CH4 in equivalent amount which in turn produces 1
mol of NH3 (Leng, 2008).
NO3 +4H2 +2H+ → NH4+ +3H2O
4H2+CO2 →CH4+2H2O
Figure 9: Pathways for the microbial anaerobic fermentation of glucose in ruminants
(Nolan 1999).
Dissimilatory nitrate reduction to NH3 (DNRA) and assimilatory nitrate reduction to
NH3 (ANRA) are two distinct pathways responsible for nitrate reduction in anaerobic systems
(Leng, 2008).
4H+
Glucose
Glucose
Glucose-6-P
2 Pyruvate
2 Acetyl CoA
2 Acetyl-P
2 AcetateAcetate
Butryl-CoA
Butryl-P
ButyrateButyrate
2 Lactate
2 Lactyl-CoA
2 Acrylyl-CoA
2 Propionyl-CoA
2 PropionatePropionate
2 Oxaloacetate
2 Malate
2 Fumarate
2 Succinate
2 Succinyl-CoA
2 Methylmalonyl-CoA
2 Propionyl-CoA
2 PropionatePropionateNAD +
NAD+
H2 MethaneMethane
ATP
2 ATP
ATP
NADH
NADH
NADH NADH
H+
2 NADH
H+
NADH
ATP
NADH
CO2 CO2

37
NO3-+2H+ → H2O+NO2
-
NO2-+6H+ → H2O+ NH3
Organisms capable of DNRA and ANRA use formate and hydrogen as the common
electron donors
3HCO-2+NO2
-+5H+=3 CO2+NH+4+2H2O
3H2+NO2-+2H+ = NH4
+ +2H2O
In most of the experiments, the animals were not adapted to nitrate (Sar et al., 2004; Sar
et al., 2006), instead the nitrate was injected intraruminally. The nitrate and nitrite reduction
in rumen fluid increased by 3-10 X as sheep become accustomed to increasing dietary nitrate
intake (Allison and Reddy, 1984) and this resulted in increase number of nitrate reducing
bacteria (NRB). Carver and Pfander (1974) reported that period of 21 days was required by
the sheep to adapt to diet with 3.2% KNO3. The nitrate addition to ruminant diet inhibits CH4
production and the effect is more pronounced in animals adapted to nitrate (Allison et al.,
1981; Allison and Reddy, 1984). Considerable amount of work has been done under in-vitro
conditions (Leng, 2008; Leng and Preston, 2010). If scientists working with in-vitro
techniques had worked in close association with those working with in-vivo techniques
(Flachowsky and Lebzien, 2009), this could have enhanced the practicability of this
technique. Therefore some in-vivo work is required to determine the efficacy of nitrates and
sulphates in the mitigation of enteric CH4 production in ruminants. The goal is not to stop
CH4 emissions, but rather, redirecting hydrogen into more beneficial pathways (Hegarty et
al., 2007).
Morgavi et al. (2010) reported that the thermodynamic conversion of nitrate into NH3
was more favourable than the formation of CH4 if nitrate was present in ruminant diet.
Methanogenesis can strongly be inhibited by use of nitrates in all systems of fermentation in
rumen or bio digestors (Hungate 1965; Allison et al., 1981; Akunna et al., 1994). However,
prior to its practical application, methods must be explored to reduce toxicity risks induced
by intermediates of sulphate and nitrate metabolism (Perdok and Newbold, 2010).
Denitribacterium detoxificans and Wolinella succinogenes, (sulphate-reducing bacteria) make
use of sulphate, as electron acceptor (Weimer, 1998; Anderson et al., 2000; Simon, 2002)
other than CO2 to oxidise hydrogen (Morgavi et al., 2010).

38
Nitrate and Sulphate feeding
In anaerobic environments nitrate-sulphate interrelationship is complex. Sulphate is
reduced to hydrogen sulphide (H2S) which does not accumulate appreciably in rumen fluid
and is converted to CH4. High nitrate load reduces sulphate to H2S but may cause nitrate
toxicity in ruminants (Leng, 2008).
Approximately 8% of nitrate load, suddenly introduced directly into the rumen was
recovered in urine (Leng, 2008). Thermodynamically, sulphate reduction is more favourable
than methanogenesis (Ungerfeld and Kohn, 2006). Sulphate concentration in the medium and
the residence time within the digestor are the factors which determine the extent of decrease
in CH4 production from sulphate addition (Isa et al.,1986).
Dietary Nitrate Adaptations
The methemoglobinemia can be caused by high doses of nitrate in ruminant diets
resulting in the decrease of the blood capacity to transport oxygen to animal tissues (Bradley
et al., 1939, Lewis, 1951 as cited in Leng, 2008). In the past, many scientists (O’Hara and
Fraser, 1975; Crawford et al., 1966; Deeb and Sloan, 1975; Ruhr and Osweiler, 1986;
Setchell and Williams 1962 as cited in Leng, 2008) highlighted the toxic role of nitrate in
ruminants and they mainly focused on the variability of lethal doses. Methemoglobin
(MetHb) levels of 30 to 40% of haemoglobin (Hb) and higher results in clinical toxicity signs
(Bruning-Fann and Kaneene, 1993). Intraruminal administration of 0.9 g of nitrate/Kg of
body weight (0.75 BW) per day to a sheep in a single load caused MetHb levels of 18.4% of
Hb (Sar et al., 2004). The MetHb levels of over 30% of Hb was also observed when sodium
nitrate (SN) was pulse-dosed into the rumen of sheep at a rate of 1.1 g nitrate/Kg 0.75 BW
per day (Takahashi et al., 1998). Feeding nitrate (0.47 g of nitrate/kg of BW per day) to
sheep increased nitrite reduction rates from 25 to 62 nmol/min per mL of rumen fluid,
whereas nitrate reduction rates increased 26-times (from 4.5 to 117 nmol/min per mL)
compared with sheep fed no additional nitrate in their diets (Allison and Reddy ,1984).
Slow introduction of high nitrate diets in sheep (1.5 g of nitrate/Kg of BW per day)
also showed similar results (Alaboudi and Jones,1985). For unadapted ruminants, nitrate
concentrations more than 0.5% of DM in forages can be detrimental (Bruning-Fann and
Kaneene, 1993), but it appears that adaptation increases rumen microbial population or
improves their nitrite-reducing capacity. Fukui et al. (1980) observed that after 24 h storage
in a refrigerator 36.1% of the original amount of MetHb recovered while in another study

39
Sleight and Sinha (1968) showed that 24-h refrigeration of guinea pig blood resulted in
reductions of over 50% in MetHb. The MetHb values might not, therefore, represent the
actual values at the time of sampling. However, clinical signs of methemoglobinemia
must be observed during the experiment. There are also some reports indicating no clinical
signs of methemoglobinemia even when sheep were fed high doses of nitrate in their diets
(Carver and Pfander, 1974; Alaboudi and Jones, 1985 cited in Leng, 2008).
Effect of dietary nitrate on feed intake, growth performance and rumen ecology
Reduced dry matter intake in animals fed diets containing nitrates was reported by
Leng (2008). Negative effects on feed intake by sheep were observed when dietary
nitrate exceeded 3% of feed DM (Bruning-Fann and Kaneene,1993) . In-vitro studies by
Marais et al. (1988) demonstrated that reduction in feed intake might be co-related to a
nitrite-induced depression of forage cell wall digestion. The accumulation of nitrite in rumen
fluid reduces cell wall fermentation and therefore potentially subsides energy digestibility. As
cited in Leng (2008), Sokolowski et al. (1969) found that addition of 3.2% KNO3 with or
without added S to a concentrate based diet of lambs reduced their growth rates.
Dairy cows fed high nitrate diets shifted the VFA profile from propionate to acetate
with significant reduction in butyrate concentration (Farra and Satter, 1971). Allison and
Reddy (1984) also reported similar results when sheep were fed nitrates. Alaboudi and Jones
(1985) reported shift of VFA profile from butyrate to acetate when nitrates were added in
sheep diet. Sheep fed nitrate revealed quantitative decrease of methanogens in rumen fluid
(Allison et al., 1981).
Measuring methane production
It is very complex to measure CH4 from individual animals, because of its gaseous
properties. Different techniques developed to measure CH4 emissions (Table 2.6) from
ruminants include respiration chambers (Frankenfield, 2010), CH4 estimations from the
VFA production (Hegarty and Nolan, 2007), ventilated hood techniques (Odongo et al.,
2007), isotopic (Hegarty et al., 2007), non-isotopic tracer techniques (Johnson et al.,
1994), tunnel technique (Murray et al., 2007), SF6 technique (Grainger et al., 2007) and
IVGPT (Navarro-Villa et al., 2011). Respiration chambers have been used for the last 100
years to study the energy metabolism of animals (Johnson et al., 2003).

40
The SF6 tracer gas technique and respiration chambers are the two most prevalent or
established methodologies to estimate CH4 production ruminants. Although use of respiration
chambers can be considered as standard method but it is very expensive and cannot be
applied on large number of animals. The SF6 method is easy and is mostly used in range
cattle. However, it gives more variable results of CH4 emission than chamber measurements.
Johnson et al. (1994) observed 7% lower CH4 emission with the SF6 technique than with
chambers with cattle. However, others have shown slightly higher values with the SF6
technique than chambers (Grainger et al., 2007; Boadi et al., 2002) and yet other studies have
found much higher values with the SF6 technique than chambers (Pinares-Patino et al., 2011;
Ulyatt et al., 1999; Pinares- Patino et al., 2008; Fredeen et al., 2004). Moreover, SF6 is a very
potent GHG (23,800 X the Global Warming Potential of CO2; Table 2.1). Its use is also
banned in many countries. Among newly developed CH4 measuring techniques,
commercially developed Open respiratory device is based on the use of tracer gas with lower
GWP as compared to SF6 (Zimmerman et al., 2011).
Micrometeorlogical method is another technique of CH4 estimation which is based on
measuring CH4 from animals in isolated pens where there is no restriction on animal activity.
Pens are equipped with open-path lasers to estimate CH4 concentrations (Harper et al., 1999).
The IVGPT simulates fermentation of feed in rumen, not emissions and digestibility by the
animal. In ruminants, knowledge regarding VFA concentrations is not considered sufficient
to predict the amount of CH4 generated or energy availability to animal as it can be
influenced by anabolic usage of VFA for microbial growth.
Recently, a new method for estimating enteric CH4 production from ruminants has
been developed. It is based on the use of naturally emitted CO2 as a tracer gas instead of SF6
(Storm et al., 2012; Madsen et al., 2010). This technique is easy, fast, cost effective and less
labour intensive. By this technique, data from more number of animals can be collected in
limited period of time. Also the results from animals are in their natural environment.
However, this technique is yet to be tested against standard respiration calorimetry chamber
technique. In conclusion, the respiration chamber technique is the best however, technique
based on the use of naturally emitted CO2 as a tracer gas is more feasible in developing
countries.
41
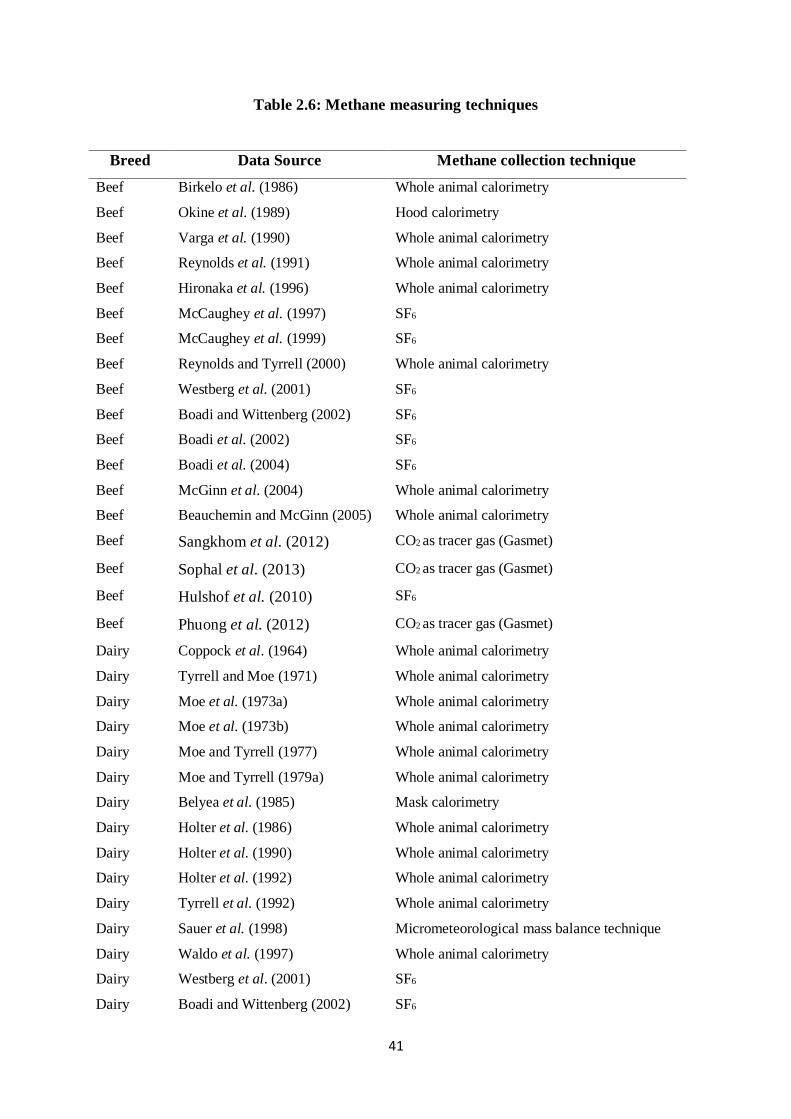
Table 2.6: Methane measuring techniques
Breed Data Source Methane collection technique
Beef Birkelo et al. (1986) Whole animal calorimetry
Beef Okine et al. (1989) Hood calorimetry
Beef Varga et al. (1990) Whole animal calorimetry
Beef Reynolds et al. (1991) Whole animal calorimetry
Beef Hironaka et al. (1996) Whole animal calorimetry
Beef McCaughey et al. (1997) SF6
Beef McCaughey et al. (1999) SF6
Beef Reynolds and Tyrrell (2000) Whole animal calorimetry
Beef Westberg et al. (2001) SF6
Beef Boadi and Wittenberg (2002) SF6
Beef Boadi et al. (2002) SF6
Beef Boadi et al. (2004) SF6
Beef McGinn et al. (2004) Whole animal calorimetry
Beef Beauchemin and McGinn (2005) Whole animal calorimetry
Beef Sangkhom et al. (2012) CO2 as tracer gas (Gasmet)
Beef Sophal et al. (2013) CO2 as tracer gas (Gasmet)
Beef Hulshof et al. (2010) SF6
Beef Phuong et al. (2012) CO2 as tracer gas (Gasmet)
Dairy Coppock et al. (1964) Whole animal calorimetry
Dairy Tyrrell and Moe (1971) Whole animal calorimetry
Dairy Moe et al. (1973a) Whole animal calorimetry
Dairy Moe et al. (1973b) Whole animal calorimetry
Dairy Moe and Tyrrell (1977) Whole animal calorimetry
Dairy Moe and Tyrrell (1979a) Whole animal calorimetry
Dairy Belyea et al. (1985) Mask calorimetry
Dairy Holter et al. (1986) Whole animal calorimetry
Dairy Holter et al. (1990) Whole animal calorimetry
Dairy Holter et al. (1992) Whole animal calorimetry
Dairy Tyrrell et al. (1992) Whole animal calorimetry
Dairy Sauer et al. (1998) Micrometeorological mass balance technique
Dairy Waldo et al. (1997) Whole animal calorimetry
Dairy Westberg et al. (2001) SF6
Dairy Boadi and Wittenberg (2002) SF6
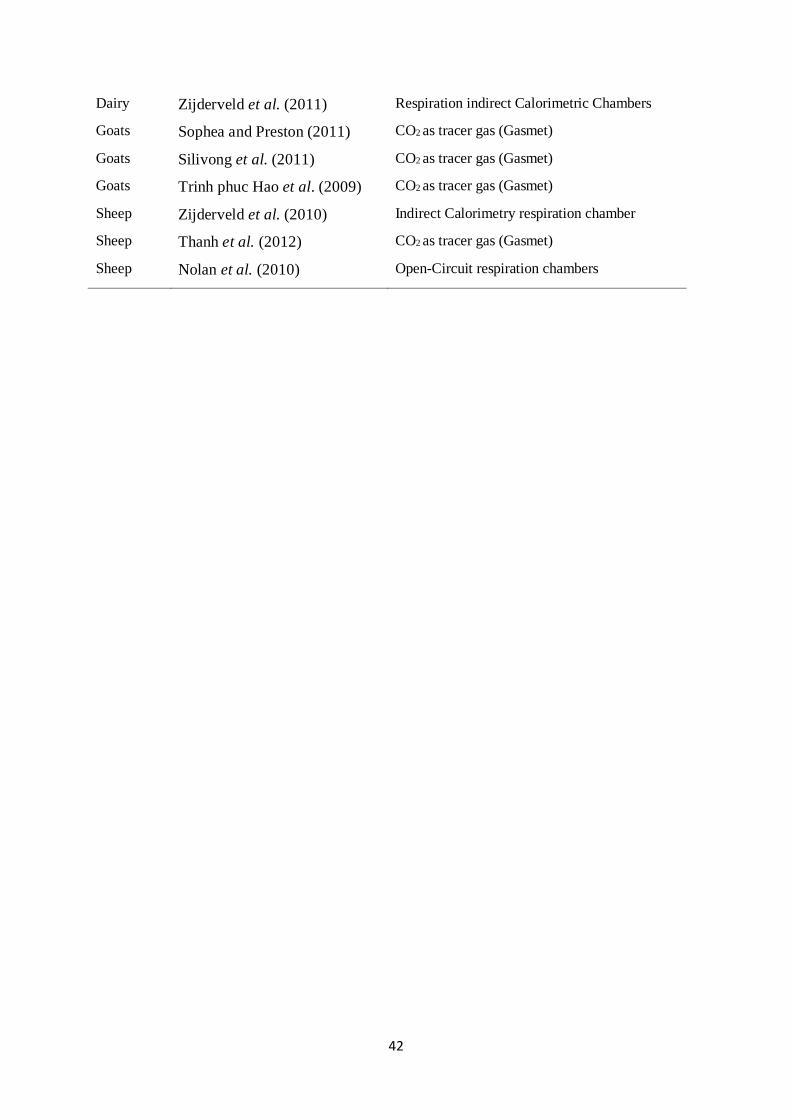
42
Dairy Zijderveld et al. (2011) Respiration indirect Calorimetric Chambers
Goats Sophea and Preston (2011) CO2 as tracer gas (Gasmet)
Goats Silivong et al. (2011) CO2 as tracer gas (Gasmet)
Goats Trinh phuc Hao et al. (2009) CO2 as tracer gas (Gasmet)
Sheep Zijderveld et al. (2010) Indirect Calorimetry respiration chamber
Sheep Thanh et al. (2012) CO2 as tracer gas (Gasmet)
Sheep Nolan et al. (2010) Open-Circuit respiration chambers

43
Chapter 3
Materials and Methods
The study was conducted at University College of Agriculture, University of
Sargodha, Pakistan. Sargodha is located at latitude 32.0836° North, longitude 72.6711° east
with altitude 194 meters. This study had 3 independent experiments of 90 days each.
Experiment No. 1
In this experiment, 48 male animals at post weaned age (24 Lohi lambs and 24 Teddy
goats), were randomly divided into 12 groups having in each 4 animals. Each group was
maintained in a separate pen measuring 0.30m x 0.30m. Twelve iso-nitrogenous (crude
protein 18%) and iso-caloric (2.0 ME Mcal/Kg) diets were formulated using 0, 3 and 6% PN
with or without 0.4% S (anhydrous MgSO4). Nonprotein nitrogen was same across all diets
(Table 4.1). The total mixed rations were offered twice a day and fresh clean water was made
available round the clock during experimental period. This experiment lasted for three
months including 15 days of adaptation. Animals were gradually acclimated to the diets with
nitrate and S. Animals were fed separately. The animals were weighed fortnightly.
Experiment No. 2
In this experiment, 48 male animals at growing age (24 Lohi sheep and 24 Teddy
goats of approximately six months of age), were randomly divided into 12 groups having in
each 4 animals. Each group was maintained in a separate pen measuring 0.30m x 0.30m.
Animals were fed separately. Twelve iso-nitrogenous (crude protein 18%) and iso-caloric
(2.0 ME Mcal/Kg) diets were formulated using ~0, 1.5 and 3% CAN with or without 0.4% S
(anhydrous MgSO4). Nonprotein nitrogen was same across all diets. The control diet CAN0-
S0 contained neither CAN nor S. Whereas CAN0-S4, CAN1.5-S0, CAN1.5-S4, CAN3-S0
and CAN3-S4 diets had 0% CAN and 0.4% S, 1.5% CAN and 0% S, 1.5% CAN and 0.4% S,
3% CAN and 0% S and 3% CAN and 0.4% S, respectively (Table 5.1). The total mixed
rations were offered twice a day and fresh clean water was made available round the clock
during experimental period. This experiment lasted for three months including 15 days of
adaptation. Animals were gradually acclimated to the diets with nitrate and S. Animals were
fed separately. The animals were weighed fortnightly.

44
Experiment No. 3
In this experiment, 48 male animals (24 Lohi sheep and 24 Teddy goats of
approximately nine months of age), were randomly divided into 12 groups, 4 animals in each
group. Each group was maintained in a separate pen measuring 0.30m x 0.30m. Animals
were fed separately. Twelve iso-nitrogenous (crude protein 18%) and iso-caloric (2.0 ME
Mcal/Kg) diets were formulated using ~0, 2.5 and 5% SN with or without 0.4% S (anhydrous
MgSO4). Nonprotein nitrogen was same across all diets. The control diet SN0-S0 contained
neither SN nor S. Whereas SN0-S4, SN2.5-S0, SN2.5-S4, SN5-S0 and SN5-S4 diets had 0%
SN and 0.4% S, 2.5% SN and 0% S, 2.5% SN and 0.4% S, 5% SN and 0% S and 5% SN and
0.4% S, respectively (Table 6.1). The total mixed rations were offered twice a day and fresh
clean water was made available round the clock during experimental period. This experiment
lasted for three months including 15 days of adaptation. Animals were gradually acclimated
to the diets with nitrate and S. Animals were fed separately. The animals were weighed
fortnightly.
Weight gain of each animal was determined by the difference between weights at 90
days minus weight at 0 day. In order to increase the versatility and accuracy of experiment
different nitrate sources were supplemented in the animal diet with or without S. It was also
observed whether chemical nature of nitrates affects animal health when supplemented with
or without S or not.
Data Collection
The daily feed intake was recorded and representative samples were taken and
analyzed for DM and CP using the procedures described by AOAC (1990). The Neutral
detergent fiber (NDF) and acid detergent fiber (ADF) were determined by the methods
described by Van Soest et al. (1991).
Digestibility and nitrogen balance trials were conducted during the last week of
experiment. For digestibility and nitrogen balance trials, all animals were shifted to
metabolic crates for 7 days to ensure complete collection of feces and urine. Locally made
metabolic collection crates, each measuring 1.5m x 1.2m x 1.5m, were used to collect the
urine and feces of individual animal and then urine and feces were mixed by animal.
Metabolic collection crates consisted of a collection tray and two plastic urine collection
bowls. Removable trays were fitted on floor of metabolic collection crates and animals stood
45
on these trays. Removable urine collection bowls were set beneath the floor of metabolic
collection crates. During total collection method, urine was collected in urine collection
bowls through the small hole at the bottom of the collection tray. These bowls had measured
amount of solution acidified with 50% H2SO4 to avoid N losses during collection (Nisa et al.,
2004). Feces and urine were collected, weighed and representative samples were stored at -
20oC for further analysis. At the end of collection period, urine and feces samples from
individual pens were thawed, composited and homogenized. Composite samples were dried
at 55oC and ground through 1-mm screen. Feed and fecal samples were analyzed for NDF
and ADF by the methods described by Van Soest et al. (1991) and DM and CP were
determined by methods described by AOAC (1990). At the end of experiment, one hour after
morning feed, blood samples (10 mL/animal) were collected by jugular vein punctured into
vacutainer tube containing 81 µL of 15% EDTA solution and analyzed in local pathological
laboratory for blood urea nitrogen, glucose, creatinine using cobas c 111 analyzer (Roche),
hematology was determined using Sysmex pocH-100i and methemoglobin (MetHb; Evelyn
and Malloy, 1938).
The enteric CH4 was analyzed at the end of the experiment using method described
by Madsen et al. (2010) in which naturally emitted CO2 was used as tracer gas (Storm et al.,
2012). Data of enteric methane production was recorded one hour after each feeding.
Methane production gradually increases and reaches peak values during first hour of feeding
and then decreases gradually (Sar et al., 2004). Each animal was kept in an especially
designed closed enclosure (each measuring 1.5 m x 1.2 m x 1.5 m) for 15 minutes and
enteric methane production was measured during the last 5 minutes with the help of infra red
CH4 analyzer (Gasmet Dx-4030, Finland Table 2.7). The enclosure was made airtight.
Arrangements were made for gases measurement with the help of probe. The probe, for
measurement of gases was inserted from the side of closed chamber. For Zero point
calibration nitrogen gas was used. Efforts were made to maintain no change in temperature
or air pressure during data collection. Moreover, In order to minimize stress factor all
animals were made accustomed to enclosure 15 days prior to data collection.
The CO2 and CH4 in background air were measured at the same time. Measuring the
CH4 to CO2 ratio combined with the measuring of total CO2 produced, the amount of CH4
was calculated as under:
CH4:CO2 = (a-b)/(c-d)

46
Where a is CH4 concentration in mixed eructed gas plus air, c is CO2 concentration in
mixed eructed gas plus air, b is CH4 in background air and d the CO2 in background air.
As feed intake did not differ among the treatments it was assumed that CO2
production was also similar and could be used as internal marker as described by Madsen et
al. (2010).
Methane reduction was derived from the equation proposed by Leng and Preston
(2010) in which it was assumed that:
If the CH4 production rate is A, the CO2 entry rate B is same on all diets, and the ratio
of CH4 to CO2 is R, then the following equations apply:
For urea-fed animal…………………..…. AU (Urea) = B * R1
For the nitrate-fed animal……………..….AN (nitrate) = B * R2
The % CH4 reduction rate is then…………B(R1-R2) / BR1*100
Table 2.7: Gasmet DX4030 (General Specifications)
Measurement Principle: FTIR (Fourier Transform InfraRed) spectroscopy
Measuring Parameters:
Zero point calibration 24 hours, calibration with nitrogen gas
Zero point drift 2% of smallest measuring range per zero-point calibration interval
Sensitivity drift None
Linear derivation 2% of smallest measuring range
Temperature drift 2% of smallest measuring range per 100 C change, temperature
measured and compensated
Pressure influence 1% change of measuring value for 1% sample pressure change,
ambient pressure changes measured and compensated
Response time Typically < 120s, depending on the gas flow and measurement time
Gas Inlet and Outlet
conditions:
Gas temperature Ambient temperature (0-500C) non-condensing
Flow rate 120-360 l per hour
Gas filteration Filteration of particulates included in the sample probe
Sample gas pressure Ambient
Sample pump Flow 2 l/min for ambient air only

47
Statistical analysis
The data collected were analyzed using 2×3×2 factorial arrangement under
Randomized Complete Block Design (RCBD). The data were analyzed by methods described
by Steel et al. (1996). Treatments were compared by Tukey’s test using statistical software
Statistix 8.1.

48
Chapter 4
Effect of varying levels of potassium nitrate with or without sulphur on
enteric methane production in post weaned Lohi sheep and Teddy goats
Abstract
Ruminants are considered as one of the major sources of greenhouse gases emission.
The study was conducted to evaluate the influence of varying levels of potassium nitrate (PN)
with or without S on the growth performance and enteric CH4 production in weaned Lohi
lambs and Teddy goats in a 2×3×2 factorial arrangement under Randomized Complete Block
Design. In the experiment, 48 male animals at post weaned age (24 Lohi lambs and 24 Teddy
goats), were randomly divided into 12 groups, 4 animals in each group. Twelve iso-
nitogenous and iso-caloric diets were formulated. Nonprotein nitrogen was same across all
diets. The control diet PN0-S0 contained neither PN nor S whereas PN0-S4, PN3-S0, PN3-
S4, PN6-S0 and PN6-S4 diets had 0% PN and 0.4% S, 3% PN and 0% S, 3% PN and 0.4% S,
6% PN and 0% S and 6% PN and 0.4% S, respectively. The Gases were measured by using
infra-red biogas analyzer. The nutrient intake and digestibility in both weaned lambs and
goats were similar (P> 0.05) across all diets. The animals fed diet containing 6% PN with
0.4% S showed better nitrogen balance. Daily live weight gain of of both lambs (146 g/day)
and goats (66.0 g/day) fed diet containing 6% PN and 0.4% S was the highest and best values
of FCR (P<0.05) were also observed in both group of animals. Both in lambs and goats non-
significant differences (P> 0.05) were observed in blood metabolites including blood urea
nitrogen, glucose and Creatinine. Similar trend (P> 0.05) was observed in hematology. None
of the animals suffered from methemoglobinemia or polioencephalomalacia. Enteric CH4 was
32.6% reduced (P<0.05) in lambs and 31.9% in goats fed diet containing 6% PN and 0.4% S
compared to those fed C.
Introduction
Ruminants are considered as one of the major sources of GHG emission. They emit
about 80 million tonnes of methane (CH4) annually which is one third of the emitted CH4
worldwide (Beauchemin et al., 2008; IPCC, 2007). The CH4 does not only cause
environmental problems, but it also makes animal production inefficient. Beauchemin et al.

49
(2008) reported enhanced animal productive efficiency when enteric CH4 was reduced. Thus,
enteric CH4 production in ruminants was reduced through nutritional manipulation (Dohme et
al., 2000; Johnson and Johnson, 1995; Moss et al., 2000; Itabashi, 1994) or use of various
feed additives (Joblin, 1999; Moss et al., 2000; Lopez et al., 1999; Asanuma et al., 1999;
Wenk, 2003). Nitrate being dietary N source can provide a hydrogen sink to reduce enteric
CH4 production in ruminants (Leng, 2008). However, use of nitrate as a source of rumen
fermentable N and as an alternative hydrogen sink to CO2 had previously been neglected due
to its toxicity. Nitrate is converted into nitrite as an intermediate during its reduction in the
rumen (Leng and Preston, 2010). It has been suggested that nitrate reduction to NH3 could be
suppressed by feed-back inhibition from high NH3 levels in rumen fluid (Leng, 2008).
Sulphur supplementation in the diet (Leng, 2008) or cysteine (Takahashi et al., 1998)
inclusion reduced nitrite accumulation in the rumen. Sulphate is a reductant (ΔG 0 = -21.1
kJ/mol of hydrogen; Ungerfeld and Kohn, 2006) and will also compete for electrons and
may lower CH4 production.
The SF6 and in-vitro gas production techniques are the most commonly used techniques
to measure enteric CH4 production in ruminants. The SF6 method is the most commonly used
technique in most of experiments but its results of measuring CH4 emission are more variable
than that of chamber measurement (Pinares-Patino et al., 2011; Johnson et al., 1994;
Grainger et al., 2007; Boadi et al., 2002). That is why the most of the studies used to reduce
enteric CH4 were conducted in-vitro (Lovett et al., 2004; Rymer et al., 2005; Pellikaan et al.,
2011; Navarro-Villa et al., 2011; Blummel and Orskov, 1993; Bhatta et al., 2006). However,
the in-vitro technique simulates ruminal fermentation of feed only and it does not take into
consideration other factors including CH4 formation, its emission and digestibility by the
entire animal.
Thus, there is a dire need to measure the CH4 reduction directly from ruminants and a
method, which is based on the use of naturally emitted CO2 as a tracer gas (Storm et al.,
2012; Madsen et al., 2010) to estimate CH4 emission directly from ruminants seems
promising. However, the scientific evidence regarding the use of nitrate to mitigate CH4
emission directly from ruminants is limited. Therefore, the present study was planed to
determine the effect of varying levels of PN with or without S on growth performance and
enteric CH4 production in weaned Lohi sheep and Teddy goats fed roughage based diet. The
50
hypothesis was that nitrate and S will mitigate the enteric CH4 production in both sheep and
goats. Both nitrate and S will give an additive effect on the CH4 reduction.
Materials and Methods
Experimental site
The study was conducted at University College of Agriculture, University of
Sargodha, Pakistan.
Experimental animals and feeding
In this experiment, 48 male animals at post weaned age (24 Lohi lambs and 24 Teddy
goats), were randomly divided into 12 groups having in each 4 animals. Each group was
maintained in a separate pen measuring 0.30m x 0.30m. Animals were fed separately. Twelve
iso-nitrogenous (crude protein 18%) and iso-caloric (2.0 ME Mcal/Kg) diets were formulated
using 0, 3 and 6% PN with or without 0.4% S (anhydrous MgSO4). Nonprotein nitrogen was
same across all diets (Table 4.1). The total mixed rations were offered twice a day and fresh
clean water was made available round the clock during experimental period. The animals
were weighed fortnightly. This experiment lasted for three months including 15 days of
adaptation. Animals were gradually acclimated to the diets with nitrate and S. The daily feed
intake was recorded and representative samples were taken and analyzed for DM and CP
using the procedures described by AOAC (1990). The NDF and ADF were determined by the
methods described by Van Soest et al. (1991).
Digestibility and nitrogen balance trials were conducted during the last week of
experiment by using total collection method. For this purpose, all animals were shifted to
metabolic crates for 7 days to ensure complete collection of feces and urine. Locally made
metabolic collection crates, each measuring 1.5 m x 1.2 m x 1.5 m, were used to collect the
urine and feces of individual animal. Metabolic collection crates consisted of a collection
tray and two plastic urine collection bowls. Removable trays were fitted on floor of
metabolic collection crates and animals stood on these trays. Removable urine collection
bowls were set beneath the floor of metabolic collection crates. Urine was collected in urine
collection bowls through the small hole at the bottom of the collection tray. These bowls had

51
measured amount of solution acidified with 50% H2SO4 to avoid N losses during collection
(Nisa et al., 2004). Feces and urine were collected, weighed and representative samples were
stored at -20oC for further analysis. At the end of collection period, urine and feces samples
from individual pens were thawed, composited and homogenized. Composite samples were
dried at 55oC and ground through 1-mm screen. Feed and fecal samples were analyzed for
NDF and ADF by the methods as described by Van Soest et al. (1991) and DM and CP were
determined by the methods as described by AOAC (1990). At the end of experiment blood
samples (10 mL/animal) were collected by jugular vein punctured into vacutainer tube
containing 81 µL of 15% EDTA solution and analyzed in local pathological laboratory for
blood urea nitrogen, glucose, creatinine using cobas c 111 analyzer (Roche) and
methemoglobin (MetHb; Evelyn and Malloy, 1938).
The enteric CH4 was analyzed at the end of the experiment by using method as
described by Madsen et al. (2010) in which naturally emitted CO2 was used as tracer gas
(Storm et al., 2012). Data of enteric methane production was recorded one hour after each
feeding. Methane production gradually increases and reaches peak values during first hour of
feeding and then decreases gradually (Sar et al., 2004). Each animal was kept in an
especially designed closed enclosure (each measuring 1.5 m x 1.2 m x 1.5 m) for 15 minutes
and enteric methane production was measured during the last 5 minutes with the help of infra
red CH4 analyzer (Gasmet Dx-4030, Finland Table 2.7). For Zero point calibration nitrogen
gas was used. In order to minimize stress factor all animals were made accustomed to
enclosure 15 days prior to data collection. The CO2 and CH4 in background air were
measured at the same time. Measuring the CH4 to CO2 ratio combined with the measuring of
total CO2 produced, the amount of CH4 was calculated as under:
CH4:CO2 = (a-b)/(c-d)
Where a is CH4 concentration in mixed eructed gas plus air, c is CO2 concentration in
mixed eructed gas plus air, b is CH4 in background air and d the CO2 in background air.
As feed intake did not differ among the treatments it was assumed that CO2
production was also similar and could be used as internal marker as described by Madsen et
al. (2010).
Methane reduction was derived from the equation proposed by Leng and Preston
(2010) in which it was assumed that:

52
If the CH4 production rate is A, the CO2 entry rate B is same on all diets, and the ratio
of CH4 to CO2 is R, then the following equations apply:
For urea-fed animal…………………..…. AU (Urea) = B * R1
For the nitrate-fed animal……………..….AN (nitrate) = B * R2
The % CH4 reduction rate is then…………B(R1-R2) / BR1*100
The hypothesis was that nitrate and S will have mitigating effect on the enteric CH4
production. Both nitrate and S will give an additive effect on the CH4 reduction.
Statistical analysis
The data collected were analyzed using 2×3×2 factorial arrangement under RCBD.
The data were analyzed by methods described by Steel et al. (1996). Treatments were
compared by Tukey’s test using statistical software Statistix 8.1.
Results
The nutrient intake and digestibility in both weaned lambs and goats were similar (P>
0.05) across all diets (Table 4.2). The animals fed diet containing 6% PN with 0.4% S
showed better nitrogen balance (Table 4.5). Daily live weight gain was 138, 138, 142, 142,
142 and 146 g/day in Lohi lambs and was 62, 62, 61, 62, 65 and 66 g/d in Teddy goats fed
PN0-S0, PN0-S4, PN3-S0, PN3-S4, PN6-S0 and PN6-S4 diets, respectively (Table 4.6).
The FCR in lambs fed PN0-S0, PN0-S4, PN3-S0, PN3-S4, PN6-S0 and PN6-S4 diets were
5.3, 5.3, 5.2, 5.2, 5.2 and 5.0, respectively. Moreover, the FCR were 7.4, 7.4, 7.4, 7.3, 7.0 and
6.9 in goats fed PN0-S0, PN0-S4, PN3-S0, PN3-S4, PN6-S0 and PN6-S4 diets, respectively
(Table 4.6). The best feed conversion values (P<0.05) were observed in animals fed PN6-S4
diet. Both in lambs and goats non-significant differences (P> 0.05) were observed in blood
metabolites including blood urea nitrogen, glucose and Creatinine (Table 4.3). Similar trend
(P> 0.05) was observed in hematology (Table 4.4). None of the animals suffered from
methemoglobinemia or polioencephalomalacia. The difference in enteric CH4 reduction was
0, 1.99, 18.98, 20.41, 27.21 and 32.65% in Lohi lambs and 0, 3.95, 15.77, 24.18, 25.81 and
31.91% in Teddy goats fed PN0-S0, PN0-S4, PN3-S0, PN3-S4, PN6-S0 and PN6-S4 diets,
respectively (Table 4.7). Both lambs and goats fed diet containing 6% PN and 0.4% S
showed better enteric CH4 reduction as compared to other diets (Table 4.7).

53
Discussion
In this study all the diets were supplemented with either nitrate or urea at iso-
nitrogenous concentrations as the main fermentable nitrogen source. Feed intake did not
differ among the treatments but better weight gains with higher levels of nitrate indicated that
PN was slightly better fermentable N source than urea in the diet. Nitrogen retention was
slightly better both in sheep and goats when nitrate was non-protein N source rather than
urea. Trinh phuc Hao et al. (2009) used highest level of PN upto 5.33% in ruminant diet.
Other researchers (Thanh et al., 2012) in a sheep experiment used maximum 4% PN against
1.8% urea (% DM basis) in ruminant diets. The present study was conducted to evaluate
whether PN at 6% with 0.4%S could safely be supplemented in ruminant diet without any
toxicity.
Nutrient Intake and Nutrient digestibility
Our findings were consistent with Zijderveld et al. (2010) and Sophea and Preston
(2011) who reported that dietary nitrate did not affect feed intake by sheep and goats.
Similarly, Sangkhom et al. (2012) and Phuong et al. (2012) reported that animals fed diets
containing nitrate (or) urea ate the same amount of DM. The lack of difference in DMI in this
study could be ascribed to slow conversion of nitrates into nitrites which did not accumulated
in the rumen, consequently there was no nitrite-induced depression of forage cell wall
digestion. As mentioned earlier, in ruminants, nitrate is reduced to NH3 by certain rumen
microbes, with nitrite as an intermediate product but under some circumstances the rate of
nitrite formation may exceed the rate of nitrite reduction to NH3, resulting in elevated nitrite
levels thus causing methemoglobinemia. Slow adaptation of dietary nitrates might have
resulted in the development of rumen microflora that possibly had higher capacity to reduce
nitrite. Non-significant changes in hematology and blood metabolites indicated same health
status of all animals. In this experiment, none of the animal showed any kind of abnormal
behaviour or signs of illness during the whole experimental period. This indicated that none
of the animals suffered from nitrate or S toxicity.
The nutrient digestibility in the present study is consistent with the findings of Thanh
et al. (2012) who reported that nitrate (or) urea as NPN source did not affect nutrient
digestibility in sheep. Nolan et al. (2010) also reported non-significant results of dry matter
digestibility (DMD) when nitrates were used as feed additive. There are many factors which

54
affect feed digestibility but feed intake is one of the most important. The digestibility in the
present study did not change simply because feed consumption remained unaltered across all
diets.
Nitrates are also known to affect the digestibility of forages in-vitro (Marais, 1980).
Nitrite is a well recognized antimicrobial agent but the mechanism of bacterial inhibition has
not been satisfactorily elucidated (Yarbrough et al. 1980). In this study, similar digestibility
across all the treatments in both trials might be attributed to the absence of nitrite
accumulation in the rumen. Nitrite accumulation inhibits the growth of some bacterial species
which decreases feed digestibility. This reduced digestibility reduces VFA production and
this in turn reduces microbial biomass which then reduces intake by the animal. During
digestion process, the concentrations of branched chain acids decreases which is essential for
the growth of cellulolytic rumen bacteria. According to the findings of Marais et al. (1988),
nitrite is the prime factor responsible for reducing digestibility in ruminants, fed high nitrate
diets. This reduces the solubility of the structural components, such as hemicellulose and
cellulose. The nitrite negatively affects the xylanolytic and cellulolytic microbial population
with a concomitant reduction in xylanase and cellulase activity. Values for xylanase and
cellulase activity could each be due to the action of more than one enzyme. The nitrite affects
cellulolytic microbes possibly by altering the energy metabolism. It inhibits microbes which
produce ATP via electron transport systems but has no effect on bacteria which lack
cytochromes and rely on glycolysis for ATP generation (Marais et al., 1988)
However, Hulshof et al. (2010) reported reduced DMI by animals fed diets containing
nitrates. This reduced DMI by animals might be due to ruminal nitrite accumulation in beef
cattle fed sugarcane-based diets. Similar results were reported by other researchers (Bruning-
Fann and Kaneene, 1993; Weichenthal et al., 1963).
Statistically non-significant results were observed in DMI with 0.4% S
supplementation in the diets of sheep and goats. Possibly the animals on sulphate treatments
were fed a considerable amount of S in the diet (4 g of S/kg of DM). Silivong et al. (2011)
reported reduced intake by goats fed diets containing 0.8% S. In another study, Phuong et al.
(2012) reported DMI decreased when 0.8% S was supplemented in cattle diets. Higher
concentrations of S supplementation than NRC recommendations i.e 4 g of S/kg of DM
might have increased its bitterness in taste , which reduced intake. The toxic production of
H2S also affects the feed intake. High levels of H2S in the rumen and the subsequent
inhalation of hydrogen sulfide increases the risk of polioencephalomalacia (Gould, 1998).

55
In this study we did not observe even a single case of polioencephalomalacia. Thus 4 g of
S/kg of DM indicates optimal amount of S required for microbial growth.
Abatement of enteric methane
Diets containing PN in combination with S reduced ~32% enteric CH4 production
from both Lohi sheep and Teddy goats. The results of this study supported the findings of
Binh Phuong et al. (2011), Thanh et al. (2011), Sangkhom et al. (2011), Jeong et al. (2005)
Bozic et al. (2009), Kluber Conrad (1998), Guo et al. (2009), Guangming et al. (2010) and
Mohanakrishnan et al. (2008) who reported reduced CH4 production in animals fed diets
containing nitrates. Our results are also in agreement with Leng and Preston (2010) who
observed that nitrate supplementation in ruminant diet reduced enteric methane production.
Similar results were reported by Leng (2008) who reported10% enteric CH4 reduction in
animals fed diets containing 1% PN.
Dissimilatory nitrate reduction to NH3 (DNRA) and assimilatory nitrate reduction to
NH3 (ANRA) are two distinct pathways responsible for nitrate reduction in anaerobic system.
Nitrate and nitrite reduction in rumen fluid increases number of nitrate reducing bacteria.
Nitrate-reducing bacteria uptake hydrogen, resulting in a lower electron pool which is
necessary for population density of methanogens. This reduced methanogenic activity might
be an alternative explanation for the reduced methane production. The thermodynamic
conversion of nitrate into NH3 is more favourable than the formation of CH4 if nitrate is
included in ruminant diet (Morgavi et al., 2010). One mol nitrate reduces CH4 in equivalent
amount which in turn produces 1 mol NH3 (Leng, 2008). Reduction of nitrate also draws
hydrogen away from other processes such as propionogenesis. Theoretically, 1 mole of
nitrate reduces 1mole of CH4 as 4 moles of hydrogen are redirected towards nitrate reduction,
which is equivalent to a reduction of methane emission by 25.8 g for each 100 g of nitrate
fed.
In this study sulphate inclusion rate was according to the maximum
recommendations as indicated by NRC (4 g of S/kg of DM; NRC, 2001). Results of
the study show that sulphate is effective in decreasing CH4 production. None of the animals
showed clinical signs of polioencephalomalacia during the trial.Thus it can be assumed that
there was no H2S toxicity. Sulphate reduction to H2S consumes 8 electrons and thus
offers the same potential per mole to reduce CH4 emissions as nitrate. Stoichiometrically, the
full reduction of 100 g sulphate to H2S would reduce CH4 production by 16.7 g. Methane

56
generated from sulphate supplementation is dependent on two important factors i.e sulphate
concentration in the medium and the residence time within the digester (Isa et al., 1986). At
low sulphate concentration relatively more electrons were directed toward sulphate reduction
compared with a high sulphate concentration. Increased residence time increases the flow of
electrons from methanogenesis toward sulphate reduction. High rumen liquid passage rate in
both sheep and goat might explain the lower than expected use of hydrogen for sulphate
reduction. The sulphate reduction is thermodynamically more favourable than
methanogenesis (Ungerfeld and Kohn, 2006) and the additive effect of both nitrate and
sulphate in the present study reduced CH4 production in both sheep and goats fed PN6-S4
diet. It appeared that adaptation improved the nitrite-reducing capacity of rumen microbes.
Non-significant changes in hematology and blood metabolites indicated same health status of
all animals. In this experiment, none of the animal showed any kind of abnormal behaviour or
signs of illness during the whole experimental period. This indicated that none of the animals
suffered from nitrate or S toxicity.
Sangkhom et al. (2012) reported that dietary nitrates reduced 27% enteric CH4
emission. Similarly, Zijderveld et al. (2010) reported 32% CH4 reduction and Nolan et al.
(2010) showed 23% CH4 reduction in sheep fed diets containing nitrate when compared to
those fed diets containing urea. Hulshof et al. (2010) also observed 32% CH4 reduction in
cattle fed diets containing nitrate when compared to those fed diets containing urea. Sophal et
al. (2013) reported 43% enteric CH4 reduction in cattle while Sophea and Preston (2011)
observed 60% reductions in goats. However, Zijderveld et al. (2011) reported 16% CH4
reduction in dairy cows fed diets containing nitrates and they also noticed some ill effect on
the health of those cows.
Inconsistent results in CH4 mitigation might be due to various CH4 measuring techniques.
Various researchers (Hulshof et al., 2010) used SF6 technique and Zijderveld et al. (2011)
used calorimetric chambers. Nolan et al. (2010) measured CH4 via VFAs. Sophal et al.
(2013), Sophea and Preston (2011) and Sangkhom et al. (2012) determined CH4 reduction by
the use of naturally emitted CO2 as a tracer gas. Moreover, Hulshof et al. (2010) used
sugarcane-based diets which might have initiated nitrite production which affected CH4
reduction. The SF6 method is the most commonly used technique in most of the experiments
but it gives more variable results of CH4 emission than chamber measurements (Pinares-
Patino et al., 2011; Johnson et al., 1994; Grainger et al., 2007; Boadi et al., 2002).

57
Growth performance
Daily live weight gain and better feed efficiency of both sheep or goats in this study are in
accordance with Trinh phuc Hao et al. (2009) who reported higher weight gain in goats when
nitrates replaced urea as the source of fermentable N. Dietary nitrate supplementation
resulted in better reduction of enteric CH4 as compared to urea, which might have increased
weight gains. Sangkhom et al. (2012) also reported higher growth and better feed efficiency
by cattle fed diets containing nitrate than those fed diets containing urea. In both trials
animals were fed similar amounts of feed. Nitrate fed sheep and goats might have resulted in
reduced heat production possibly due to reduced metabolizability of the ingested gross
energy, from a reduced conversion of metabolizable energy into heat, potentially resulting in
an increase in energy retention, or from a combining effect of the two. As in this study we did
not measure metabolizable energy intake the distinction cannot be made. However,
arguments for both options can be made.
Blaxter and clapperton (1965) mentioned that enteric CH4 mitigation improved the feed
nutritive value resulting into better animal performance. Beauchemin et al. (2008) also
reported that ruminant productive efficiency could be improved by reducing enteric CH4
production. If nitrite does not accumulate in the rumen, it will produce ruminal NH3
production at a rate equal to assimilatory growth rate of microbial mass.The electron transfer
of NH3 during microbial cell synthesis conserves more energy in the rumen end products than
when electrons are donated to CH4 which is excreted out. This additional energy stored
during microbial synthesis might have increased microbial growth efficiency which resulted
into higher feed efficiency of diets containing nitrate than those containing urea (Leng, 2008).
However, in contrast to the present study, some workers (Zijderveld et al., 2010; Thanh et
al., 2012) reported reduced enteric CH4 emission in sheep fed diets containing nitrates but
this CH4 abatement did not affect growth performance of sheep. Similar results were reported
by Zijderveld et al. (2011) in dairy cows. Sophea and Preston (2011); Nguyen Ngoc Anh et
al. (2010) and Trinh phuc Hao et al. (2009) also repoterd reduction in CH4 production but
they did not report any increase in growth rates in goats. Sophal et al. (2013), Phuong et al.
(2012), Ngoc Huyen Le Thi, (2010) and Do Thi Than Van et al. (2010) also showed lack of
growth in cattle fed diets containing nitrates. Tillman et al. (1965) reported that nitrate
reduced growth rates without toxicity symptoms.

58
Blood Chemistry
None of the sheep or goat showed any kind of abnormal behaviour or signs of illness
during the whole experiment. In present study, blood metabolites and haematology showed
non-significant difference among treatments. The animals did not show any symptom of
nitrate or nitrite toxicity because either they were slowly acclimated or adjusted to nitrate
feeding or the nitrate to S ratios in the feed were possibly balanced in such a manner that they
maintained the activity of S reducing bacteria (SRB) which in turn reduced nitrite to NH3
(Leng, 2008). Carver and Pfander (1974) and Alaboudi and Jones (1985) reported that
supplementation of elevated doses of nitrate did not affect the health of the animal and had no
symptoms of nitrate toxicity. No ill effects were observed in most of the feeding trials with
young animals when nitrates were supplemented in their diets (Trinh phuc Hao et al., 2009;
Nguyen Ngoc Anh et al., 2010; Ngoc Huyen Le Thi, 2010). Zijderveld et al. (2010) reported
minor signs of methemoglobinemia when only nitrate was supplemented in the sheep diet
while no signs were observed when nitrate and sulphate were used together. Nolan et al.
(2010) also reported similar trend. Nitrate feeding to non-acclimated animals may lead to
nitrite accumulation in the rumen. Nitrite when diffused into the blood oxidizes ferrous ions
in haemoglobin (Hb) to ferric ions to form MetHb (Zijderveld et al., 2011) which decreases
its oxygen carrying capacity and in acute cases may be fatal (Zijderveld et al., 2010).
Elevated nitrate doses in the diet of ruminants caused the signs of methemoglobinemia
(Bradley et al., 1939; Lewis, 1951) but clinical toxicity symptoms appear only when MetHb
level is 30 to 40% of Hb (Bruning-Fann and Kaneene, 1993). Blood urea nitrogen
concentrations are very high for goats possibly due to breed difference. Moreover, its
numbers can vary greatly between different locations and different laboratories.
Conclusion
Diets containing PN in combination with S did not only reduce ~32% enteric CH4
production from both Lohi sheep and Teddy goats but it also improved their growth
performance

59
Table 4.1 Ingredient composition of experimental diets
1PN0, PN3 and PN6 stand for potassium nitrate at 0, 3 and 6%, respectively. S0 and S4 stand for 0
and 0.4% sulphur, respectively.
Ingredients
Diets1
PN0 PN3 PN6
S0 S4 S0 S4 S0 S4 Wheat Straw 35.00 35.00 35.00 35.00 35.00 35.00
Cotton seed meal 10.00 10.00 10.00 10.00 10.00 10.00
Rice bran 10.00 10.00 10.00 10.00 10.00 10.00
Maize gluten Meal 30% 5.00 5.00 5.00 5.00 5.00 5.00
Hay (Lucerne) 21.00 21.00 21.00 21.00 21.00 21.00
Enzose 14.00 14.00 14.00 14.00 14.00 14.00
Anhydrous Mag. Sulphate 0.00 1.50 0.00 1.50 0.00 1.50
Sodium Chloride 1.00 1.00 1.00 1.00 1.00 1.00
Di-Calcium Phosphate 2.00 2.00 2.00 2.00 2.00 2.00
Potassium nitrate 0.00 0.00 3.00 3.00 6.00 6.00
Urea 1.70 1.70 0.85 0.85 0.00 0.00
Chemical composition (%)
Dry Matter 88.08 89.58 90.23 91.73 92.38 92.38
Crude Protein 18.00 18.00 17.99 17.99 17.98 17.98
Neutral Detergent Fiber 44.36 44.36 44.36 44.36 44.36 44.36
Acid Detergent Fiber 31.38 31.38 31.38 31.38 31.38 31.38
Metabolizable Energy (Mcal/kg) 2.06 2.06 2.06 2.06 2.06 2.06

60
Table 4.2 Effect of different levels of potassium nitrate with or without sulphur on Nutrient intake and their
digestibility in post weaning Lohi sheep and Teddy goat
Items
Lohi lambs Teddy Goat
SEM2
Significance3 Diets1
PN0 PN3 PN6 PN0 PN3 PN6
S0 S4 S0 S4 S0 S4 S0 S4 S0 S4 S0 S4 A B AB ABC
Nutrient Intake, g/d
DM 741a 742a 742a 742a 741a 735a 455b 457b 456b 458b 456b 456b 2.13 NS NS NS *
CP 134a 133a 133a 134a 133a 132a 82b 82b 82b 82b 82b 82b 0.44 NS NS NS *
NDF 329a 329a 329a 329a 329a 326a 202b 203b 202b 203b 203b 202b 0.99 NS NS NS *
ADF 233a 233a 233a 233a 232a 231a 143b 143b 143b 144b 143b 143b 0.64 NS NS NS *
Digestibility,%
DM 55.0de 56.0bcde 54.7e 55.5cde 55.2cde 56.7abcde 59.5abc 60.0ab 58.0abcde 59.0abcde 59.2abcd 60.5a 0.89 NS NS NS *
CP 65.5c 65.8c 64.8c 64.8c 64.5c 63.0d 72.5a 72.8a 71.8a 71.8a 71.5a 70.0b 0.27 * * * *
NDF 53.0ab 52.0ab 52.5ab 53.3a 51.0ab 52.8ab 50.5ab 49.8ab 50.0ab 52.0ab 49.8b 51.3ab 0.85 NS NS NS *
ADF 41.0 40.0 40.5 41.3 39.5 40.8 41.5 41.8 42.0 44.0 41.0 43.3 0.92 NS NS NS NS
1PN0, PN3 and PN6 stand for potassium nitrate at 0, 3 and 6%, respectively. S0 and S4 stand for 0 and 0.4% sulphur, respectively. 2SEM stand for Standard error mean. 3A, B, C and ABC stand for Nitrate levels, Sulfur levels, Species and their Interaction, respectively while AB stand for Interaction of nitrate levels
with sulphur levels. NS stand for Non significant (P>0.05) and * stand for Significant (P<0.05). a,b,c Means in a row with different superscripts differ significantly (p<0.05). DM, CP, NDF and ADF stand for Dry matter, Crude Protein, Neutral detergent fibre and Acid detergent fibre respectively.

61
Table 4.3 Effect of different levels of potassium nitrate with or without sulphur on blood metabolites in post weaning
Lohi sheep and Teddy goat
Items
(mg/dL)
Lohi lambs Teddy Goat
SEM2
Significance3
Diets1
PN0 PN3 PN6 PN0 PN3 PN6
S0 S4 S0 S4 S0 S4 S0 S4 S0 S4 S0 S4 A B AB ABC
BUN 19.3a 18.5a 18.3a 19.0a 18.5a 19.0a 26.5b 26.5b 26.5b 26.5b 26.0b 26.5 b 0.57 NS NS NS *
Blood Glucose 73.0a 73.5a 74.5a 73.8a 73.3a 72.3a 94.0b 96.3b 95.5b 96.5b 96.5b 96.0b 0.86 NS NS NS *
Creatinine 2.4a 2.5a 2.4a 2.4a 2.5a 2.4a 1.6b 1.7b 1.5b 1.6b 1.5b 1.6b 0.09 NS NS NS *
1PN0, PN3 and PN6 stand for potassium nitrate at 0, 3 and 6%, respectively. S0 and S4 stand for 0 and 0.4% sulphur, respectively. 2SEM stand for Standard error mean. 3A, B, C and ABC stand for Nitrate levels, Sulfur levels, Species and their Interaction, respectively while AB stand for Interaction of nitrate levels
with sulphur levels. NS stand for Non significant (P>0.05) and * stand for Significant (P<0.05). a,b,c Means in a row with different superscripts differ significantly (p<0.05). BUN stand for Blood urea nitrogen.

62
Table 4.4 Effect of different levels of potassium nitrate with or without sulphur on hematology in post weaning Lohi
sheep and Teddy goat
Items
Lohi lambs Teddy Goat
SEM2
Significance3 Diets1
PN0 PN3 PN6 PN0 PN3 PN6
S0 S4 S0 S4 S0 S4 S0 S4 S0 S4 S0 S4 A B AB ABC
Haemoglobin (g/dL) 14.0a 13.5abc 14.0a 14.3a 13.5abc 13.8ab 11.3cd 11.3cd 11.0d 11.5bcd 11.0d 11.0d 0.48 NS NS NS *
Methemoglobin (%) 1.7 1.8 2.0 2.0 2.0 2.2 2.2 2.0 2.0 2.0 1.8 1.7 0.14 NS NS NS NS
Neutrophils (%) 45.3a 43.8a 45.0a 44.3a 44.5a 44.0a 38.5b 39.0b 37.5b 37.5b 39.5b 39.3b 0.96 NS NS NS *
Lymphocytes (%) 43.3a 47.5a 46.8a 46.3a 46.5a 44.5a 54.0b 53.5b 56.3b 56.3b 53.0b 54.0b 0.92 * NS * *
Monocytes (%) 3.8 3.3 2.8 3.5 2.8 3.8 2.8 2.5 2.3 2.0 3.0 2.5 0.50 NS NS NS NS
Eosinophils (%) 6.5 4.3 4.8 4.5 4.8 6.3 4.3 4.5 3.8 4.0 4.0 3.8 0.82 NS NS NS NS
Basophils (%) 1.3 1.3 0.8 1.5 1.5 1.5 0.5 0.5 0.3 0.3 0.5 0.5 0.38 NS NS NS NS
Platelets (k/µL) 576.3 558.8 561.3 567.5 577.5 563.8 547.5 558.8 551.3 548.8 561.3 541.3 10.58 NS NS NS NS
1PN0, PN3 and PN6 stand for potassium nitrate at 0, 3 and 6%, respectively. S0 and S4 stand for 0 and 0.4% sulphur, respectively. 2SEM stand for Standard error mean. 3A, B, C and ABC stand for Nitrate levels, Sulfur levels, Species and their Interaction, respectively while AB stand for Interaction of nitrate levels
with sulphur levels. NS stand for Non significant (P>0.05) and * stand for Significant (P<0.05). a,b,c Means in a row with different superscripts differ significantly (p<0.05).

63
Table 4.5 Effect of different levels of potassium nitrate with or without sulphur on nitrogen balance in post weaning
Lohi sheep and Teddy goat
Items
(g/day)
Lohi lambs Teddy Goat
SEM2
Significance3
Diets1
PN0 PN3 PN6 PN0 PN3 PN6
S0 S4 S0 S4 S0 S4 S0 S4 S0 S4 S0 S4 A B AB ABC
Nitrogen Intake 21.3a 21.4a 21.4a 21.4a 21.3a 21.2a 13.1b 13.2b 13.1b 13.2b 13.1b 13.1b 0.06 NS NS NS *
Faecal Nitrogen 7.4c 7.4c 7.6b 7.6b 7.6b 7.8a 3.7 e 3.6e 3.7e 3.8e 3.8e 3.9d 0.03 * * * *
Urinary Nitrogen 6.6ab 6.7a 6.2bc 6.3abc 6.2bc 5.6d 6.2 bc 6.3abc 6.1c 6.1c 5.9cd 5.7d 0.08 * * * *
Nitrogen Balance 7.3b 7.3b 7.6ab 7.5ab 7.5ab 7.8b 3.2 cd 3.3cd 3.3cd 3.3cd 3.4cd 3.5c 0.05 * * * *
1PN0, PN3 and PN6 stand for potassium nitrate at 0, 3 and 6%, respectively. S0 and S4 stand for 0 and 0.4% sulphur, respectively. 2SEM stand for Standard error mean. 3A, B, C and ABC stand for Nitrate levels, Sulfur levels, Species and their Interaction, respectively while AB stand for Interaction of nitrate levels
with sulphur levels. NS stand for Non significant (P>0.05) and * stand for Significant (P<0.05). a,b,c Means in a row with different superscripts differ significantly (p<0.05).
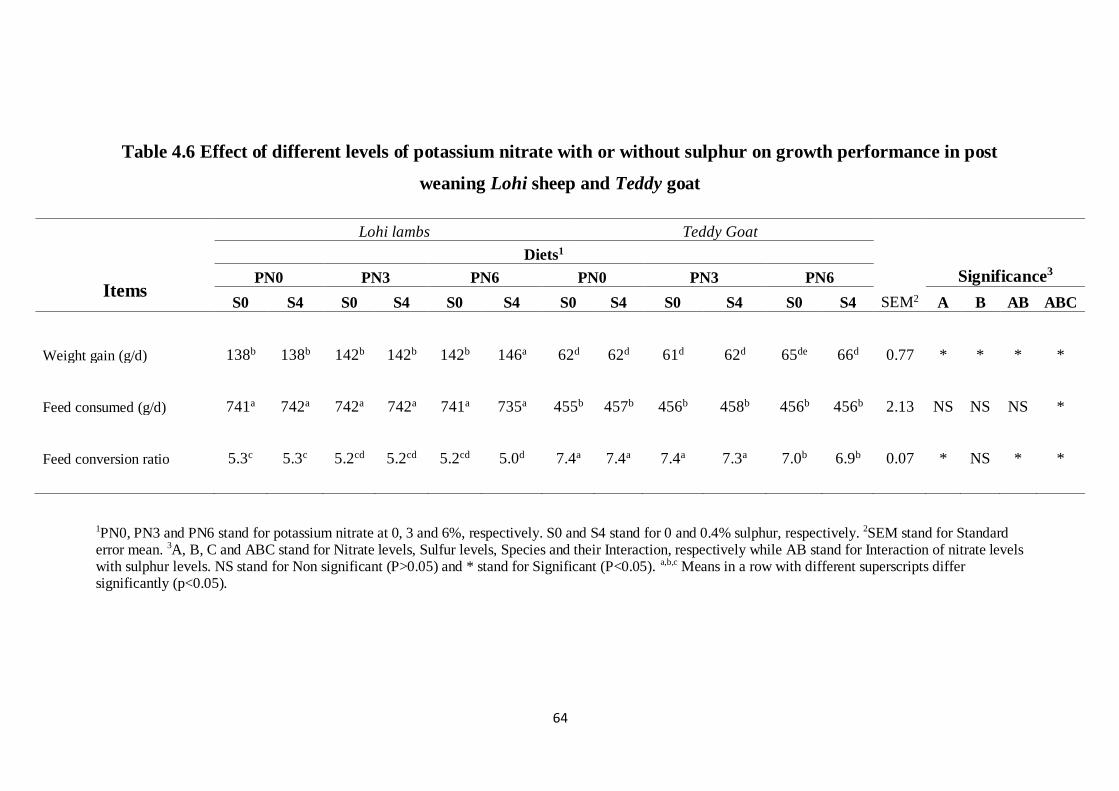
64
Table 4.6 Effect of different levels of potassium nitrate with or without sulphur on growth performance in post
weaning Lohi sheep and Teddy goat
Items
Lohi lambs Teddy Goat
SEM2
Significance3
Diets1
PN0 PN3 PN6 PN0 PN3 PN6
S0 S4 S0 S4 S0 S4 S0 S4 S0 S4 S0 S4 A B AB ABC
Weight gain (g/d) 138b 138b 142b 142b 142b 146a 62d 62d 61d 62d 65de 66d 0.77 * * * *
Feed consumed (g/d) 741a 742a 742a 742a 741a 735a 455b 457b 456b 458b 456b 456b 2.13 NS NS NS *
Feed conversion ratio 5.3c 5.3c 5.2cd 5.2cd 5.2cd 5.0d 7.4a 7.4a 7.4a 7.3a 7.0b 6.9b 0.07 * NS * *
1PN0, PN3 and PN6 stand for potassium nitrate at 0, 3 and 6%, respectively. S0 and S4 stand for 0 and 0.4% sulphur, respectively. 2SEM stand for Standard error mean. 3A, B, C and ABC stand for Nitrate levels, Sulfur levels, Species and their Interaction, respectively while AB stand for Interaction of nitrate levels with sulphur levels. NS stand for Non significant (P>0.05) and * stand for Significant (P<0.05). a,b,c Means in a row with different superscripts differ significantly (p<0.05).

65
Table 4.7 Effect of different levels of potassium nitrate with or without sulphur on enteric methane production in
post weaning Lohi sheep and Teddy goat
Items
Lohi lambs Teddy Goat
SEM2
Significance3 Diets1
PN0 PN3 PN6 PN0 PN3 PN6
S0 S4 S0 S4 S0 S4 S0 S4 S0 S4 S0 S4 A B AB ABC
Animal
(CH4 in ppm) 3.3a 3.3a 3.1abc 3.1abc 3.0bc 2.9c 3.3a 3.3a 3.1abc 3.0 bc 3.0 bc 2.9c 0.07 * NS * *
Animal (CO2 in ppm)
543.8a 543.8a 545.0a 545.0a 543.8a 547.5a 503.8b 503.8b 505.0b 506.3b 503.8b 507.5b 2.96 NS NS NS *
CH4 (Animal
- Air) : CO2
(Animal -
Air) 0.010cde 0.010cde 0.008def 0.008def 0.007ef 0.006f 0.014a 0.013ab 0.012abc 0.011bcd 0.010cd 0.009cdef 0.001 * NS NS NS
CH4
Reduction
(%) 0 1.99 18.98 20.41 27.21 32.65 0 3.95 15.77 24.18 25.81 31.91
Air (Methane gas in ppm) = 1.95; Air (carbon dioxide gas in ppm) = 405 1PN0, PN3 and PN6 stand for potassium nitrate at 0, 3 and 6%, respectively. S0 and S4 stand for 0 and 0.4% sulphur, respectively. 2SEM stand for Standard error mean. 3A, B, C and ABC stand for Nitrate levels, Sulfur levels, Species and their Interaction, respectively while AB stand for Interaction of nitrate levels with sulphur levels.NS stand for Non significant (P>0.05) and * stand for Significant (P<0.05). a,b,c Means in a row with different superscripts differ significantly (p<0.05).

66
Chapter 5
Effect of different levels of calcium ammonium nitrate with or without
sulphur on enteric methane production in Lohi sheep and Teddy goats at
growing age
Abstract
Mitigating enteric methane production from ruminants is an important issue of this era.
Feeding diets containing nitrates with or without sulphates could be used to lower enteric
CH4 production. This study was conducted to evaluate the influence of varying levels of
calcium ammonium nitrate (CAN) with or without S on the growth performance and
enteric CH4 production in growing Lohi sheep and Teddy goats in a 2×3×2 factorial
arrangement under Randomized Complete Block Design. In this experiment, 48 male
animals (24 Lohi sheep and 24 Teddy goats of approximately six months of age), were
randomly divided into 12 groups, 4 animals in each group. Twelve iso-nitogenous and iso-
caloric diets were formulated. The control diet CAN0-S0 contained neither CAN nor S.
Whereas CAN0-S4, CAN1.5-S0, CAN1.5-S4, CAN3-S0 and CAN3-S4 diets had 0%
CAN and 0.4% S, 1.5% CAN and 0% S, 1.5% CAN and 0.4% S, 3% CAN and 0% S and
3% CAN and 0.4% S, respectively. The Gases were measured by using infra-red biogas
analyzer. The nutrient intake and digestibility in both sheep and goats were similar (P>
0.05) across all diets. The animals fed diet containing 3% CAN with 0.4% S showed better
nitrogen balance. Enteric CH4 was 28.6% reduced (P<0.05) in sheep and 26.9% in goats
fed diet containing 3% CAN and 0.4% S compared to those fed C. Each sheep fed diet
containing 3% CAN and 0.4% S gained 144 g/day, whereas daily live weight gain by goats
fed diet containing 3% CAN with or without S was 58 g/day. Both in sheep and goats non-
significant differences (P> 0.05) were observed in blood metabolites including blood urea
nitrogen, glucose and Creatinine. Similar trend (P> 0.05) was observed in hematology.
None of the animals suffered from methemoglobinemia or polioencephalomalacia.

67
Introduction
In ruminants, the excess hydrogen is generated as a result of rumen fermentation
which is normally required to be removed for efficient and continuing microbial growth
(Immig, 1996). Methanogenic Archaea is generally active to eradicate hydrogen from
rumen by reducing CO2 to CH4 and H2O. Beauchemin et al. (2008) reported that for most
of the feeds utilized by ruminants, methanogenesis is ultimate route of the disposal of
hydrogen during anaerobic fermentation in the rumen. Enteric CH4 production inflicts a
dietary energy loss to the animal (Johnson and Johnson, 1995). Methane is also a potent
greenhouse gas responsible for global warming (Steinfeld et al., 2006). These realities
have compelled animal nutritionists to explore new aspects for strategic supplementation
in animal feed to abate CH4 production from ruminants.
One of the better options is to redirect rumen hydrogen into such a process that
produces useful products for the ruminants. Nitrate can be used as feed additive to lower
enteric CH4 production. They are converted into NH3 after using ruminal hydrogen, thus
reduce CH4 production. Various in-vitro (Guo et al., 2009, Allison and Reddy, 1984) and
in-vivo (Takahashi et al., 1998, Sar et al., 2004) studies have shown reduced CH4 yields.
Still it appears that more in-vivo work is required to evaluate the effect of nitrate as a
source to mitigate CH4 (Leng, 2008). However, use of nitrates as possible hydrogen sink to
CO2 has always been discouraged due to expected toxic effects of nitrite, which is
generated as an intermediate during the nitrate reduction to NH3 (Lewis, 1951). Leng
(2008) also suggested that S supplementation in ruminants diet might reduce the
accumulation of nitrate in the rumen. Sulphate as a reductant may also depress enteric CH4
production (Ungerfeld and Kohn, 2006).So the application of nitrates with Sulphate may
reduce the enteric CH4 production in ruminant animals.
Various commonly used in-vivo techniques to determine CH4 production include
measurements in confined respiration chambers (Frankenfield, 2010), CH4 estimations
from the VFA production (Hegarty and Nolan, 2007), ventilated hood techniques
(Odongo et al., 2007), isotopic (Hegarty et al., 2007) and naturally emitted CO2 as a
tracer gas in animals instead of SF6 (Madsen et al., 2010). According to Storm et al.
(2012), use of naturally emitted CO2 as a tracer gas to determine CH4 production is most
promising and economical method in developing countries.
68
Therefore, the present study was planed to determine the effect of varying levels of
CAN with or without S on growth performance and enteric CH4 production in growing
Lohi sheep and Teddy goats fed roughage based diet. The hypothesis was that nitrate and S
will mitigate the enteric CH4 production in both sheep and goats. Both nitrate and S will
give an additive effect on the CH4 reduction.
Materials and Methods
Experimental site
The study was conducted at University College of Agriculture, University of
Sargodha, Pakistan.
Experimental animals and feeding
In this experiment, 48 male animals at growing age (24 Lohi sheep and 24 Teddy goats of
approximately six months of age), were randomly divided into 12 groups having in each 4
animals. Each group was maintained in a separate pen measuring 0.30m x 0.30m. Animals
were fed separately. Twelve iso-nitrogenous (crude protein 18%) and iso-caloric (2.0 ME
Mcal/Kg) diets were formulated using 0, 1.5 and 3% CAN with or without 0.4% S
(anhydrous MgSO4). Calcium ammonium nitrate is made by adding calcium carbonate to a
slurry of ammonium nitrate resulting in a mixture of calcium nitrate and residual
ammonium nitrate. It crystallizes as a hydrated double salt: 5Ca (NO3)2•NH4NO3•10H2O.
In the experiment fertilizer grade CAN was used, it contained 8% calcium and 25%
nitrogen. Nonprotein nitrogen was same across all diets. The control diet CAN0-S0
contained neither CAN nor S. Whereas CAN0-S4, CAN1.5-S0, CAN1.5-S4, CAN3-S0
and CAN3-S4 diets had 0% CAN and 0.4% S, 1.5% CAN and 0% S, 1.5% CAN and 0.4%
S, 3% CAN and 0% S and 3% CAN and 0.4% S, respectively (Table 5.1). The total mixed
rations were offered twice a day and fresh clean water was made available round the clock
during experimental period. The animals were weighed fortnightly. This experiment lasted
for three months including 15 days of adaptation. Animals were gradually acclimated to
the diets with nitrate and S.
The daily feed intake was recorded and representative samples were taken and
analyzed for DM and CP by using the procedures described by AOAC (1990). The NDF
and ADF were determined by the methods described by Van Soest et al. (1991).

69
Digestibility and nitrogen balance trials were conducted during the last week of
experiment by using total collection method. For this purpose, all animals were shifted to
metabolic crates for 7 days to ensure complete collection of feces and urine. Locally made
metabolic collection crates, each measuring 1.5 m x 1.2 m x 1.5 m, were used to collect
the urine and feces of individual animal. Metabolic collection crates consisted of a
collection tray and two plastic urine collection bowls. Removable trays were fitted on
floor of metabolic collection crates and animals stood on these trays. Removable urine
collection bowls were set beneath the floor of metabolic collection crates. Urine was
collected in urine collection bowls through the small hole at the bottom of the collection
tray. These bowls had measured amount of solution acidified with 50% H2SO4 to avoid N
losses during collection (Nisa et al., 2004). Feces and urine were collected, weighed and
representative samples were stored at -20 oC for further analysis. At the end of collection
period, urine and feces samples were thawed, composited and homogenized. Composite
samples were dried at 55 oC and ground through 1-mm screen. Feed and fecal samples
were analyzed for NDF and ADF by the methods as described by Van Soest et al. (1991)
and DM and CP were determined by the methods as described by AOAC (1990). At the
end of experiment blood samples (10 mL/animal) were collected by jugular vein
punctured into vacutainer tube containing 81 µL of 15% EDTA solution and analyzed in
local pathological laboratory for blood urea nitrogen, glucose, creatinine using cobas c
111 analyzer (Roche) and methemoglobin (MetHb; Evelyn and Malloy, 1938).
The enteric CH4 was analyzed at the end of the experiment by using method as
described by Madsen et al. (2010) in which naturally emitted CO2 was used as tracer gas
(Storm et al., 2012). Data of enteric methane production was recorded one hour after each
feeding. Methane production gradually increases and reaches peak values during first hour
of feeding and then decreases gradually (Sar et al., 2004). Each animal was kept in an
especially designed closed enclosure (each measuring 1.5 m x 1.2 m x 1.5 m) for 15
minutes and enteric methane production was measured during the last 5 minutes with the
help of infra red CH4 analyzer (Gasmet Dx-4030, Finland Table 2.7). For Zero point
calibration nitrogen gas was used. In order to minimize stress factor all animals were
made accustomed to enclosure 15 days prior to data collection.
The CO2 and CH4 in background air were measured at the same time. Measuring
the CH4 to CO2 ratio combined with the measuring of total CO2 produced, the amount of
CH4 was calculated as under:
70
CH4:CO2 = (a-b)/(c-d)
Where a is CH4 concentration in mixed eructed gas plus air, c is CO2 concentration
in mixed eructed gas plus air, b is CH4 in background air and d the CO2 in background air.
As feed intake did not differ among the treatments it was assumed that CO2
production was also similar and could be used as internal marker as described by Madsen
et al. (2010).
Methane reduction was derived from the equation proposed by Leng and Preston
(2010) in which it was assumed that:
If the CH4 production rate is A, the CO2 entry rate B is same on all diets, and the
ratio of CH4 to CO2 is R, then the following equations apply:
For urea-fed animal…………………..…. AU (Urea) = B * R1
For the nitrate-fed animal……………..….AN (nitrate) = B * R2
The % CH4 reduction rate is then…………B (R1-R2) / BR1*100
The hypothesis was that nitrate and S will have mitigating effect on the enteric CH4
production. Both nitrate and S will give an additive effect on the CH4 reduction.
Statistical analysis
The data collected were analyzed using 2×3×2 factorial arrangement under RCBD.
The data were analyzed by methods described by Steel et al. (1996). Treatments were
compared by Tukey’s test using statistical software Statistix 8.1.
Results
The nutrient intake and digestibility in both sheep and goats were similar (P> 0.05)
across all diets (Table 5.2). The animals fed diet containing 3% CAN with 0.4% S showed
better nitrogen balance (Table 5.5). Daily live weight gain was 138, 139, 139, 141, 141 and
144 g/day in Lohi sheep and was 54, 55, 57, 56, 58 and 58 g/d in Teddy goats fed CAN0-
S0, CAN0-S4, CAN1.5-S0, CAN1.5-S4, CAN3-S0 and CAN3-S4 diets, respectively
(Table 5.6). The FCR in sheep fed CAN0-S0, CAN0-S4, CAN1.5-S0, CAN1.5-S4, CAN3-
S0 and CAN3-S4 diets were 9.0, 8.9, 9.0, 8.8, 8.9 and 8.7, respectively. Moreover, the
FCR were 11.4, 11.3, 10.8, 10.9, 10.6 and 10.7 in goats fed CAN0-S0, CAN0-S4,

71
CAN1.5-S0, CAN1.5-S4, CAN3-S0 and CAN3-S4 diets, respectively (Table 5.6). The best
feed conversion values (P<0.05) were observed in sheep fed CAN3-S4 diet. However, best
FCR was observed in goats fed CAN3-S0 diet. Both in sheep and goats non-significant
differences (P> 0.05) were observed in blood metabolites including blood urea nitrogen,
glucose and Creatinine (Table 5.3). Similar trend (P> 0.05) was observed in hematology
(Table 5.4). None of the animals suffered from methemoglobinemia or
polioencephalomalacia. The difference in enteric CH4 reduction was 0, 2.31, 2.61, 11.80,
11.22 and 28.68% in Lohi sheep and 0, 1.88, 2.65, 10.89, 16.33 and 26.95% in Teddy goats
fed CAN0-S0, CAN0-S4, CAN1.5-S0, CAN1.5-S4, CAN3-S0 and CAN3-S4 diets,
respectively (Table 5.7).
Discussion
In this study CAN was fed in diet upto 3.14% of DM which is high as compared to
Zijderveld et al. (2010) who in a sheep experiment fed both CAN and sulphate @ 2.6% of
DM.
Nutrient Intake and Nutrient digestibility
The results of Sophea and Preston (2011) and Zijderveld et al. (2010) are in
accordance with the results of this study. They observed that nitrate supplemented diets did
not affect the feed intake in goats and sheep. Similar trend was also reported by Sangkhom
et al. (2012) who observed no difference in DMI in cattle fed diets supplemented with
nitrate or urea as NPN source.In a study with dietary nitrates Phuong et al. (2012)
observed reduced intake with sulphate supplemented diets when included at the rate of
0.8% S. Similar results were also reported by Silivong et al. (2011) who in their
experiment on goats observed lower intake by animals fed diets with 0.8% S. Similar DMI
in this study might be due to lower accumulation of nitrite in the rumen, which is produced
as an intermediate product from dietary nitrates. Nitrite accumulation in the rumen is
generally considered responsible for lower DMI.
However, higher DMI by animals fed urea rather than nitrates was also observed
by same workers. They suggested that lower intake of feed might be due to the palatability.
Our results were not in agreement with those of Hulshof et al. (2010) who reported that
nitrate supplemented diets reduced the feed intake. In their experiment, beef cattle were

72
fed sugarcane-based diets which might favoured Ruminal nitrite accumulation, resulting in
lower feed intake. Bruning-Fann and Kaneene (1993) also reported similar results.
Ruminal nitrite accumulation lowers feed digestibility as it inhibits some of the bacterial
colonies. This reduced digestibility lowers VFA production which in turn negatively
affects microbial biomass resulting in reduced intake by the animal.
Our nutrient digestibility results are in concordance with those of Thanh et al. (2012) who
in a sheep trial observed similar digestibility with either urea or nitrate as NPN source. In
another experiment, Nolan et al. (2010) also observed no differences in DMD when
nitrates were supplemented in diets. Feed intake is one of the important factors which
affect nutrient digestibility. In this study we observed similar intake across all the diets.
This might resulted in unaltered digestibility among all the diets.
Abatement of enteric methane
The results of present study agreed with the findings of Phuong et al. (2011),
Sangkhom et al. (2011), Guo et al. (2009) and Guangming et al. (2010) who observed CH4
reduction in animals fed nitrate supplemented diets. Leng and Preston (2010) who reported
that nitrates rather than urea resulted in better enteric CH4 reductions also supported our
findings. Our results were in consistent with the findings of Leng (2008) who observed
that dietary inclusion of 1% PN in ruminant diet could result in 10% enteric CH4
reduction. If animals are slowly acclimated to nitrate supplemented diets, it favours
quantitative increase of nitrate reducing bacteria in the rumen. According to Morgavi et al.
(2010) dietary nitrate in ruminant's diet favours NH3 production rather than CH4 formation.
One mol nitrate could reduce similar amount of CH4, thus producing one mol of NH3
(Leng, 2008). Non-significant changes in hematology and blood metabolites indicated
same health status of all animals. In this experiment, none of the animal showed any kind
of abnormal behaviour or signs of illness during the whole experimental period. This
indicated that none of the animals suffered from nitrate or S toxicity. This indicated that
animals became adapted to nitrates thus resulting in improved nitrate reducing capacity of
ruminal microbes.
Variable results in enteric CH4 reduction were reported by various researchers.
Zijderveld et al. (2010) and Nolan et al. (2010) reported 32 and 23% CH4 reductions
respectively in sheep fed nitrate supplemented diets. Sangkhom et al. (2012) reported 27%
enteric CH4 reductions. Sixty percent reductions were observed by Sophea and Preston

73
(2011) in goats. Zijderveld et al. (2011) observed only 16% CH4 reductions in dairy.
However, Hulshof et al. (2010) and Sophal et al. (2013) noticed 32 and 43% enteric CH4
abatement respectively in cattle fed nitrate supplemented diets.
The variability among the results of enteric CH4 production might be attributed to
various CH4 estimating techniques. Hulshof et al. (2010) and Zijderveld et al. (2010)
measured CH4 production by SF6 technique. However Zijderveld et al. (2011) used
calorimetric chambers to estimate CH4 emissions. Nolan et al. (2010) observed CH4 by
measuring VFAs. Sangkhom et al. (2012) determined enteric CH4 production using CO2 as
a tracer gas. Among various techniques SF6 is mostly used in-vivo technique but it gives
variable results than calorimetric chambers (Pinares-Patino et al., 2011; Grainger et al.,
2007; Johnson et al., 1994).
Growth performance
In this study we observed better daily live weight gains and feed conversion ratios in
animals fed diets containing higher levels of nitrate as compared to those fed urea
supplemented diets. Similar results were reported by Sangkhom et al. (2012) and Trinh
phuc Hao et al. (2009). Nitrates as compared to urea resulted in better enteric CH4
reduction, which might improved the average daily weight gain of animals. Contrary
results were reported by Zijderveldet al. (2010) and Thanh et al. (2012) who observed no
differences in growth performance in sheep fed nitrate supplemented diets. Zijderveld et
al. (2011) in their study on dairy cows also reported similar results. In a goat trial Sophea
and Preston (2011) also observed no increase in growth rates. Sophal et al. (2013) and
Phuong et al. (2012) reported enteric CH4 reductions with nitrate supplemented diets but
did not observe any improvement in growth rates. Tillman et al. (1965) in their study
found that nitrates negatively affect the growth rates without any toxicity signs.
Enteric CH4 reduction improves the nutritive value of the feed resulting into better
animal growth performance (Blaxter and clapperton, 1965).Similar findings were also
observed by Beauchemin et al. (2008) in their study. If there is no nitrite accumulation in
the rumen it favours the emission of ruminal NH3, at the rate which is equivalent to
assimilatory growth rate of ruminal microbes. As compared to CH4 formation, electron
transfer of NH3 conserves more energy in ruminal end products, during microbial cell

74
synthesis. This stored additional energy might favoured microbial growth resulting into
better feed efficiency with nitrate supplemented diets (Leng, 2008).
Blood Chemistry
In this study we did not observe any abnormal animal behaviour or symptoms of
illness. We found no difference in blood metabolites or haematology among nitrate or urea
supplemented diets. No nitrite toxicity observed during the experiment was possibly either
because animals were slowly adapted to nitrate feeding or the nitrate:S ratio in the diet
might be balanced in a way that the activity of S reducing bacteria was maintained it
promoted reduction of nitrite to NH3 (Leng, 2008). Our observations were in concordance
with findings of other researchers (Carver and Pfander, 1974; Alaboudi and Jones, 1985).
Minor signs of methemoglobinemia were reported by Zijderveld et al. (2010) when sheep
were fed nitrate supplemented diets. Similar findings were also reported by Nolan et al.
(2010). Feeding dietary nitrates abruptly without acclimation may lead to nitrite
accumulation in the rumen which may result in nitrate toxicity. Nitrite in blood oxidizes
ferrous ions in haemoglobin (Hb) to ferric ions to form MetHb (Zijderveld et al., 2011).
This condition in acute cases might be lethal (Zijderveld et al., 2010). Higher inclusion
levels of nitrate can develop symptoms of methemoglobinemia (Bradley et al., 1939).
Blood urea nitrogen concentrations are very high for goats possibly due to breed
difference. Moreover, its numbers can vary greatly between different locations and
different laboratories.
Conclusion
Diets containing CAN in combination with S did not only reduce enteric CH4
production from Lohi sheep but it also improved their growth performance. As compared
to Teddy goats, Lohi Sheep showed better enteric CH4 reductions by using the diets
containing CAN in combination with S.

75
Table 5.1 Ingredient composition of experimental diets
1CAN0, CAN1.5 and CAN3 stand for calcium ammonium nitrate at ~ 0, 1.5 and 3%, respectively.
S0 and S4 stand for 0 and 0.4% sulphur, respectively.
Ingredients
Diets1
CAN0 CAN1.5 CAN3
S0 S4 S0 S4 S0 S4 Wheat Straw 35.00 35.00 35.00 35.00 35.00 35.00
Cotton seed meal 10.00 10.00 10.00 10.00 10.00 10.00
Rice bran 10.00 10.00 10.00 10.00 10.00 10.00
Maize gluten Meal 30% 5.00 5.00 5.00 5.00 5.00 5.00
Hay (Lucerne) 21.00 21.00 21.00 21.00 21.00 21.00
Enzose 14.00 14.00 14.00 14.00 14.00 14.00
Anhydrous Mag. Sulphate 0.00 1.50 0.00 1.50 0.00 1.50
Sodium Chloride 1.00 1.00 1.00 1.00 1.00 1.00
Di-Calcium Phosphate 2.00 2.00 2.00 2.00 2.00 2.00
Calcium ammonium nitrate 0.00 0.00 1.57 1.57 3.14 3.14
Urea 1.70 1.70 0.85 0.85 0.00 0.00
Chemical composition (%)
Dry Matter 88.08 89.58 88.80 90.30 89.52 91.08
Crude Protein 18.00 18.00 17.99 17.99 17.98 17.98
Neutral Detergent Fiber 44.36 44.36 44.36 44.36 44.36 44.36
Acid Detergent Fiber 31.38 31.38 31.38 31.38 31.38 31.38
Metabolizable Energy (Mcal/kg) 2.06 2.06 2.06 2.06 2.06 2.06

76
Table 5.2 Effect of different levels of calcium ammonium nitrate with or without sulphur on Nutrient intake and
their digestibility in growing Lohi male sheep and Teddy goat
Items
Lohi Sheep Teddy Goat
SEM2
Significance3
Diets1
CAN0 CAN1.5 CAN3 CAN0 CAN1.5 CAN3
S0 S4 S0 S4 S0 S4 S0 S4 S0 S4 S0 S4 A B AB ABC
Nutrient Intake,g/d
DM 1242a 1243a 1246a 1241a 1243a 1243a 618 b 616 b 618 b 617 b 618 b 616 b 1.73 NS NS NS *
CP 224 a 224 a 224 a 223 a 224 a 224 a 111 b 110 b 111 b 110 b 111 b 110 b 0.33 NS NS NS *
NDF 551 a 551 a 553 a 550 a 552 a 552 a 274 b 273 b 274 b 274 b 274 b 273 b 0.78 NS NS NS *
ADF 390 a 390 a 391 a 389 a 390 a 390 a 194 b 193 b 194 b 194 b 194 b 193 b 0.60 NS NS NS *
Digestibility,%
DM 53.0de 54.0bcde 52.8e 53.5cde 53.3cde 54.8abcde 57.5abc 58.0ab 56.0abcde 57.0abcde 57.3abcd 58.5 a 0.89 NS NS NS *
CP 65.5c 64.5cd 64.5cd 64.5cd 64.5cd 63.0d 72.5a 72.5a 72.0a 72.3a 71.3ab 70.0b 0.31 * * * *
NDF 51.0ab 50.0ab 50.5ab 51.3a 49.5ab 50.8ab 48.5ab 47.8ab 48.0ab 50.0ab 47.0b 49.3ab 0.85 NS NS NS *
ADF 43.0 42.0 42.5 43.3 41.5 42.8 43.5 43.8 44.0 46.0 43.0 45.3 0.92 NS NS NS NS
1CAN0, CAN1.5 and CAN3 stand for calcium ammonium nitrate at ~ 0, 1.5 and 3% respectively. S0 and S4 stand for 0 and 0.4% sulphur, respectively. 2SEM stand for Standard error mean. 3A, B, C and ABC stand for Nitrate levels, Sulfur levels, Species and their Interaction, respectively while AB stand for Interaction of nitrate levels with sulphur levels. NS stand for Non significant (P>0.05) and * stand for Significant (P<0.05).a,b,c,d,e,f Means in a row with different superscripts differ significantly (p<0.05). DM, CP, NDF and ADF stand for Dry matter, Crude Protein, Neutral detergent fibre and Acid detergent fibre respectively.
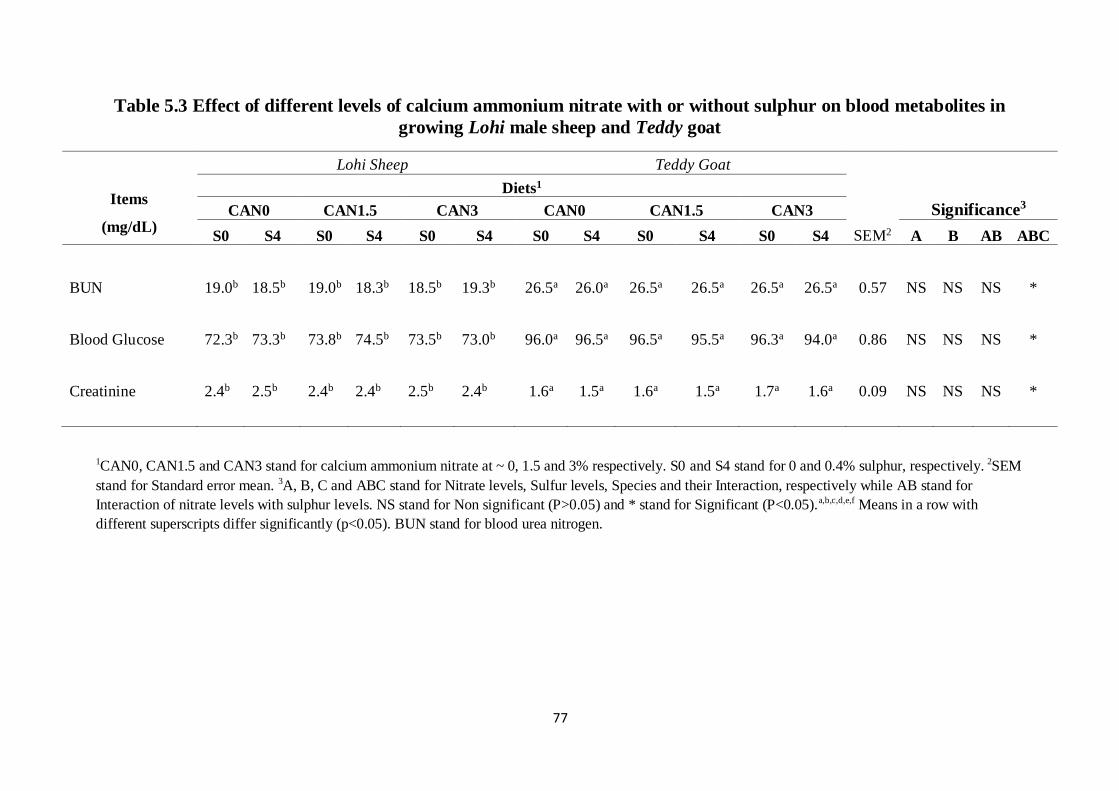
77
Table 5.3 Effect of different levels of calcium ammonium nitrate with or without sulphur on blood metabolites in
growing Lohi male sheep and Teddy goat
Items
(mg/dL)
Lohi Sheep Teddy Goat
SEM2
Significance3
Diets1
CAN0 CAN1.5 CAN3 CAN0 CAN1.5 CAN3
S0 S4 S0 S4 S0 S4 S0 S4 S0 S4 S0 S4 A B AB ABC
BUN 19.0b 18.5b 19.0b 18.3b 18.5b 19.3b 26.5a 26.0a 26.5a 26.5a 26.5a 26.5a 0.57 NS NS NS *
Blood Glucose 72.3b 73.3b 73.8b 74.5b 73.5b 73.0b 96.0a 96.5a 96.5a 95.5a 96.3a 94.0a 0.86 NS NS NS *
Creatinine 2.4b 2.5b 2.4b 2.4b 2.5b 2.4b 1.6a 1.5a 1.6a 1.5a 1.7a 1.6a 0.09 NS NS NS *
1CAN0, CAN1.5 and CAN3 stand for calcium ammonium nitrate at ~ 0, 1.5 and 3% respectively. S0 and S4 stand for 0 and 0.4% sulphur, respectively. 2SEM
stand for Standard error mean. 3A, B, C and ABC stand for Nitrate levels, Sulfur levels, Species and their Interaction, respectively while AB stand for
Interaction of nitrate levels with sulphur levels. NS stand for Non significant (P>0.05) and * stand for Significant (P<0.05).a,b,c,d,e,f Means in a row with
different superscripts differ significantly (p<0.05). BUN stand for blood urea nitrogen.

78
Table 5.4 Effect of different levels of calcium ammonium nitrate with or without sulphur on hematology in growing
Lohi male sheep and Teddy goat
Items
Lohi Sheep Teddy Goat
SEM2
Significance3
Diets1
CAN0 CAN1.5 CAN3 CAN0 CAN1.5 CAN3
S0 S4 S0 S4 S0 S4 S0 S4 S0 S4 S0 S4 A B AB ABC
Haemoglobin (g/dL) 13.7ab 13.5abc 14.2a 14.0a 13.5abc 14.0a 11.0d 11.0d 11.5bcd 11.0d 11.3cd 11.3cd 0.47 NS NS NS *
Methemoglobin (%) 2.2 1.9 1.9 2.0 1.8 1.7 1.7 1.8 2.0 1.9 1.9 2.2 0.14 NS NS NS NS
Neutrophils (%) 44.0abc 44.5a 44.3ab 45.0a 43.8abcd 45.3a 39.3cde 39.5bcde 37.5e 37.5e 39.0de 38.5e 0.96 NS NS NS *
Lymphocytes (%) 44.5a 46.5a 46.3a 46.8a 47.5a 43.3a 54.0b 53.0b 56.3b 56.3b 53.5b 54.0b 0.92 * NS * *
Monocytes (%) 3.8 2.8 3.5 2.8 3.3 3.8 2.5 3.0 2.0 2.3 2.5 2.8 0.50 NS NS NS NS
Eosinophils (%) 6.3 4.8 4.5 4.8 4.3 6.5 3.8 4.0 4.0 3.8 4.5 4.3 0.82 NS NS NS NS
Basophils (%) 1.5 1.5 1.5 0.8 1.3 1.3 0.5 0.5 0.3 0.3 0.5 0.5 0.38 NS NS NS NS
Platelets (k/µL) 563.8 577.5 567.5 561.3 558.8 576.3 541.3 561.3 548.8 551.3 558.8 547.5 10.58 NS NS NS NS
1CAN0, CAN1.5 and CAN3 stand for calcium ammonium nitrate at ~ 0, 1.5 and 3% respectively. S0 and S4 stand for 0 and 0.4% sulphur, respectively. 2SEM
stand for Standard error mean. 3A, B, C and ABC stand for Nitrate levels, Sulfur levels, Species and their Interaction, respectively while AB stand for Interaction of nitrate levels with sulphur levels. NS stand for Non significant (P>0.05) and * stand for Significant (P<0.05).a,b,c,d,e,f Means in a row with different superscripts differ significantly (p<0.05).

79
Table 5.5 Effect of different levels of calcium ammonium nitrate with or without sulphur on nitrogen balance in
growing Lohi male sheep and Teddy goat
Items
(g/day)
Lohi Sheep Teddy Goat
SEM2
Significance3
Diets1
CAN0 CAN1.5 CAN3 CAN0 CAN1.5 CAN3
S0 S4 S0 S4 S0 S4 S0 S4 S0 S4 S0 S4 A B AB ABC
Nitrogen Intake 35.8a 35.8a 35.9a 35.7a 35.8a 35.8a 17.8b 17.7b 17.8b 17.8b 17.7b 17.8b 0.05 NS NS NS *
Faecal Nitrogen 12.4b 12.7b 12.7b 12.7b 12.7b 13.3a 4.9d 4.9d 5.0cd 5.0cd 5.1cd 5.4c 0.09 * * * *
Urinary Nitrogen 16.1a 15.7a 15.7a 15.5a 15.6a 14.9b 10.0c 9.9cd 9.7cd 9.8cd 9.6cd 9.9d 0.11 * * * *
Nitrogen Balance 7.4b 7.4b 7.4b 7.5ab 7.5ab 7.7a 2.9c 2.9c 3.1c 3.0c 3.1c 3.1c 0.05 * * * *
1CAN0, CAN1.5 and CAN3 stand for calcium ammonium nitrate at ~ 0, 1.5 and 3% respectively. S0 and S4 stand for 0 and 0.4% sulphur, respectively. 2SEM
stand for Standard error mean. 3A, B, C and ABC stand for Nitrate levels, Sulfur levels, Species and their Interaction, respectively while AB stand for
Interaction of nitrate levels with sulphur levels. NS stand for Non significant (P>0.05) and * stand for Significant (P<0.05).a,b,c,d,e,f Means in a row with
different superscripts differ significantly (p<0.05).

80
Table 5.6 Effect of different levels of calcium ammonium nitrate with or without sulphur on growth performance in
growing Lohi male sheep and Teddy goat
Items
Lohi Sheep Teddy Goat
SEM2
Significance3
Diets1
CAN0 CAN1.5 CAN3 CAN0 CAN1.5 CAN3
S0 S4 S0 S4 S0 S4 S0 S4 S0 S4 S0 S4 A B AB ABC
Weight gain (g/d) 138b 139b 139b 141ab 141ab 144a 54c 55c 57c 56c 58c 58c 0.95 * NS * *
Feed consumed (g/d) 1242a 1243a 1246a 1241a 1243a 1243a 618 b 616 b 618 b 617 b 618 b 616 b 1.73 NS NS NS *
Feed conversion ratio 9.0d 8.9d 9.0d 8.8d 8.9d 8.7d 11.4 a 11.3ab 10.8bc 10.9abc 10.6c 10.7c 0.10 * NS * *
1CAN0, CAN1.5 and CAN3 stand for calcium ammonium nitrate at ~ 0, 1.5 and 3% respectively. S0 and S4 stand for 0 and 0.4% sulphur, respectively. 2SEM stand for Standard error mean. 3A, B, C and ABC stand for Nitrate levels, Sulfur levels, Species and their Interaction, respectively while AB stand for Interaction of nitrate levels with sulphur levels. NS stand for Non significant (P>0.05) and * stand for Significant (P<0.05).a,b,c,d,e,f Means in a row with different superscripts differ significantly (p<0.05).

81
Table 5.7 Effect of different levels of calcium ammonium nitrate with or without sulphur on enteric methane
production in growing Lohi male sheep and Teddy goat
Items
Lohi Sheep Teddy Goat
SEM2
Significance3 Diets1
CAN0 CAN1.5 CAN3 CAN0 CAN1.5 CAN3
S0 S4 S0 S4 S0 S4 S0 S4 S0 S4 S0 S4 A B AB ABC
Animal
(CH4 in ppm) 45.2b 44.2bc 44.2bc 40.2de 37.3f 33.1g 50.2a 49.3a 49.1a 45.2b 42.3cd 37.6ef 0.57 * * * *
Animal (CO2 in ppm) 865.8a 865.8a 867.0a 867.0a 865.8a 869.5a 865.8a 825.8b 827.0b 828.3b 825.8b 829.8b 2.93 NS NS NS *
CH4 (Animal
- Air) : CO2
(Animal -
Air) 0.094c 0.092c 0.092c 0.083de 0.077e 0.067f 0.115a 0.113a 0.112a 0.103b 0.097bc 0.085d 0.0014 * * * *
CH4
Reduction
(%) 0 2.31 2.61 11.80 18.22 28.68 0 1.88 2.65 10.89 16.33 26.95
Air (Methane gas in ppm) = 1.97; Air (carbon dioxide gas in ppm) = 408,
1CAN0, CAN1.5 and CAN3 stand for calcium ammonium nitrate at ~ 0, 1.5 and 3% respectively. S0 and S4 stand for 0 and 0.4% sulphur, respectively. 2SEM stand for Standard error mean. 3A, B, C and ABC stand for Nitrate levels, Sulfur levels, Species and their Interaction, respectively while AB stand for Interaction of nitrate levels with sulphur levels. NS stand for Non significant (P>0.05) and * stand for Significant (P<0.05).a,b,c,d,e,f Means in a row with different superscripts differ significantly (p<0.05).

82
Chapter 6
Effect of different levels of sodium nitrate with or without sulphur on
enteric methane production in Lohi sheep and Teddy goats at fattening
age
Abstract
Ruminants are major contributorsof methane (CH4) production. Serious global efforts are
required to reduce CH4 produced through their digestive tract, which is generally termed as
enteric methane production. Feeding diets containing nitrates and/or sulphates could be
used to reduce enteric methane production. The study was conducted to evaluate the
influence of varying levels of sodium nitrate (SN) with or without S on the growth
performance and enteric methane production in Lohi sheep and Teddy goats in a 2×3×2
factorial arrangement under Randomized Complete Block Design. In the experiment, 48
male animals (24 Lohi sheep and 24 Teddy goats of approximately nine months of age),
were randomly divided into 12 groups, 4 animals in each group. Twelve iso-nitogenous
and iso-caloric diets were formulated. The control diet SN0-S0 contained neither SN nor S.
Whereas SN0-S4, SN2.5-S0, SN2.5-S4, SN5-S0 and SN5-S4 diets had 0% SN and 0.4%
S, 2.5% SN and 0% S, 2.5% SN and 0.4% S, 5% SN and 0% S and 5% SN and 0.4% S,
respectively. Nonprotein nitrogen was same across all diets. The Gases were measured by
using infra-red biogas analyzer. The nutrient intake and digestibility in both sheep and
goats were similar (P> 0.05) across all diets. The animals fed diet containing 5% SN with
0.4% S showed better nitrogen balance. The enteric CH4 was 19.6% reduced (P<0.05) in
sheep and 18.2% in goats fed diet containing 5% SN and 0.4% S compared to those fed C.
Daily live weight gain of both sheep and goats fed diet containing 5% SN and 0.4% S was
143 and 59 g/day, respectively. The best feed conversion values (P<0.05) were observed in
sheep fed both SN2.5-S4 and SN5-S4 diets. However, best FCR was observed in goats fed
SN5-S0 and SN5-S4 diets. Both in sheep and goats non-significant differences (P> 0.05)
were observed in blood metabolites including blood urea nitrogen, glucose and Creatinine.
Similar trend (P> 0.05) was observed in hematology. None of the animals suffered from
methemoglobinemia or polioencephalomalacia.

83
Introduction
Among various challenges of XXI century, continuous enteric CH4 emission from
ruminants is a serious threat to climate change. Forster et al. (2007) pointed out that CH4
has 25 times more global warming potential than CO2. It is predicted that growing demand
of livestock will boost up enteric methane production resulting in its 30% growth by year
2020 (O’Mara, 2010). O’Mara (2010) highlighted the importance to develop new means to
abate enteric CH4 in ruminants. In ruminants, the excess hydrogen which is generated as a
result of rumen fermentation is normally required to be removed for efficient and
continuous microbial growth (Beaucheminet al., 2008). This hydrogen is removed by
reducing CO2 into CH4 which is eventually emitted by eructation. Methane emission is also
an energy loss (Johnson and Johnson, 1995). This CH4 emission can be reduced by
substituting the CO2 with another electron acceptor. Nitrates can replace CO2 as an
electron acceptor. They are reduced to nitrite and then to NH3. One mol nitrate reduces
CH4 in equivalent amount which in turn produces one mol of NH3 (Leng, 2008).
So, the supplementation of nitrates in diet may reduce the CH4 emission by
ruminants. However, in past their use was limited because of possible risk of nitrate/nitrite
toxicity. While, Leng (2008) proposed the addition of nitrates to roughage based diet may
significantly reduce enteric methane production without causing nitrate toxicity, in slowly
acclimatized animals. Furthermore, he also stated that supplementation of S in nitrate
containing diets may also be effective in reducing nitrite accumulation in rumen. He urged
the need of more in-vivo work to evaluate the efficiency of nitrates and sulphates to abate
CH4 production in various ruminant animals.
It is very complex to measure CH4 production from individual animals because of its
gaseous properties. One of the important considerations while attempting these
experiments is the precision and accuracy of CH4 measuring methods or techniques.
Various methods used to determine CH4 production from animals include respiration
chambers (Frankenfield, 2010), CH4 estimations from the VFA production (Hegarty
and Nolan, 2007), ventilated hood techniques (Odongoet al., 2007), isotopic (Hegarty
et al., 2007), non-isotopic tracer techniques (Johnson et al., 1994) and tunnel
technique (Murray et al., 2007). Recently a new method for estimating CH4 emissions
from ruminants was found to be more effective. It is based on the use of naturally emitted
CO2 as a tracer gas (Storm et al., 2012; Madsen et al., 2010).

84
Therefore, the present study was planed to determine the effect of varying levels of
SN with or without S on growth performance and enteric methane production in fattening
Lohi sheep and Teddy goats fed roughage based diet. The hypothesis was that nitrate and S
will mitigate the enteric CH4 production in both sheep and goats. Both nitrate and S will
give an additive effect on the CH4 reduction.
Materials and Methods
Experimental site
The study was conducted at University College of Agriculture, University of
Sargodha, Pakistan.
Experimental animals and feeding
In this experiment, 48 male animals (24 Lohi sheep and 24 Teddy goats of
approximately nine months of age), were randomly divided into 12 groups, 4 animals in
each group. Each group was maintained in a separate pen measuring 0.30m x 0.30m.
Animals were fed separately. Twelve iso-nitrogenous (crude protein 18%) and iso-caloric
(2.0 ME Mcal/Kg) diets were formulated using 0, 2.5 and 5% SN with or without 0.4% S
(anhydrous MgSO4). Nonprotein nitrogen was same across all diets. The control diet SN0-
S0 contained neither SN nor S. Whereas SN0-S4, SN2.5-S0, SN2.5-S4, SN5-S0 and SN5-
S4 diets had 0% SN and 0.4% S, 2.5% SN and 0% S, 2.5% SN and 0.4% S, 5% SN and
0% S and 5% SN and 0.4% S, respectively (Table 6.1). The total mixed rations were
offered twice a day and fresh clean water was made available round the clock during
experimental period. The animals were weighed fortnightly. The total experimental period
was 90 days including 15 days of adaptation. Animals were gradually acclimated to the
diets with nitrate and S.
The daily feed intake was recorded and representative samples were taken and
analyzed for DM and CP using the procedures described by AOAC (1990). The NDF and
ADF were determined by the methods described by Van Soest et al. (1991).
Digestibility and nitrogen balance trials were conducted during the last week of
experiment. For digestibility and nitrogen balance trials, all animals were shifted to

85
metabolic crates for 7 days to ensure complete collection of feces and urine. Locally made
metabolic collection crates, each measuring 1.5 m x 1.2 m x 1.5 m, were used to collect
the urine and feces of individual animal and then urine and feces were mixed by animal.
Metabolic collection crates consisted of a collection tray and two plastic urine collection
bowls. Removable trays were fitted on floor of metabolic collection crates and animals
stood on these trays. Removable urine collection bowls were set beneath the floor of
metabolic collection crates. During total collection method, urine was collected in urine
collection bowls through the small hole at the bottom of the collection tray. These bowls
had measured amount of solution acidified with 50% H2SO4 to avoid N losses during
collection (Nisa et al., 2004). Feces and urine were collected, weighed and representative
samples were stored at -20oC for further analysis. At the end of collection period, urine
and feces samples from individual pens were thawed, composited and homogenized.
Composite samples were dried at 55oC and ground through 1-mm screen. Feed and fecal
samples were analyzed for NDF and ADF by the methods described by Van Soest et al.
(1991) and DM and CP were determined by methods described by AOAC (1990). At the
end of experiment blood samples (10 mL/animal) were collected by jugular vein
punctured into vacutainer tube containing 81 µL of 15% EDTA solution and analyzed in
local pathological laboratory for blood urea nitrogen, glucose, creatinine using cobas c
111 analyzer (Roche) and methemoglobin (MetHb; Evelyn and Malloy, 1938).
The enteric CH4 was analyzed at the end of the experiment using method described
by Madsen et al. (2010) in which naturally emitted CO2 was used as tracer gas (Storm et
al., 2012). Data of enteric methane production was recorded one hour after each feeding.
Methane production gradually increased and reached peak values during first hour of
feeding and then decreased gradually (Sar et al., 2004). Each animal was kept in an
especially designed closed enclosure (each measuring 1.5 m x 1.2 m x 1.5 m) for 15
minutes and enteric methane production was measured during the last 5 minutes with the
help of infra red CH4 analyzer (Gasmet Dx-4030, Finland Table 2.7). For Zero point
calibration nitrogen gas was used. In order to minimize stress factor all animals were
made accustomed to enclosure 15 days prior to data collection.
The CO2 and CH4 in background air were measured at the same time. Measuring
the CH4 to CO2 ratio combined with the measuring of total CO2 produced, the amount of
CH4 was calculated as under:
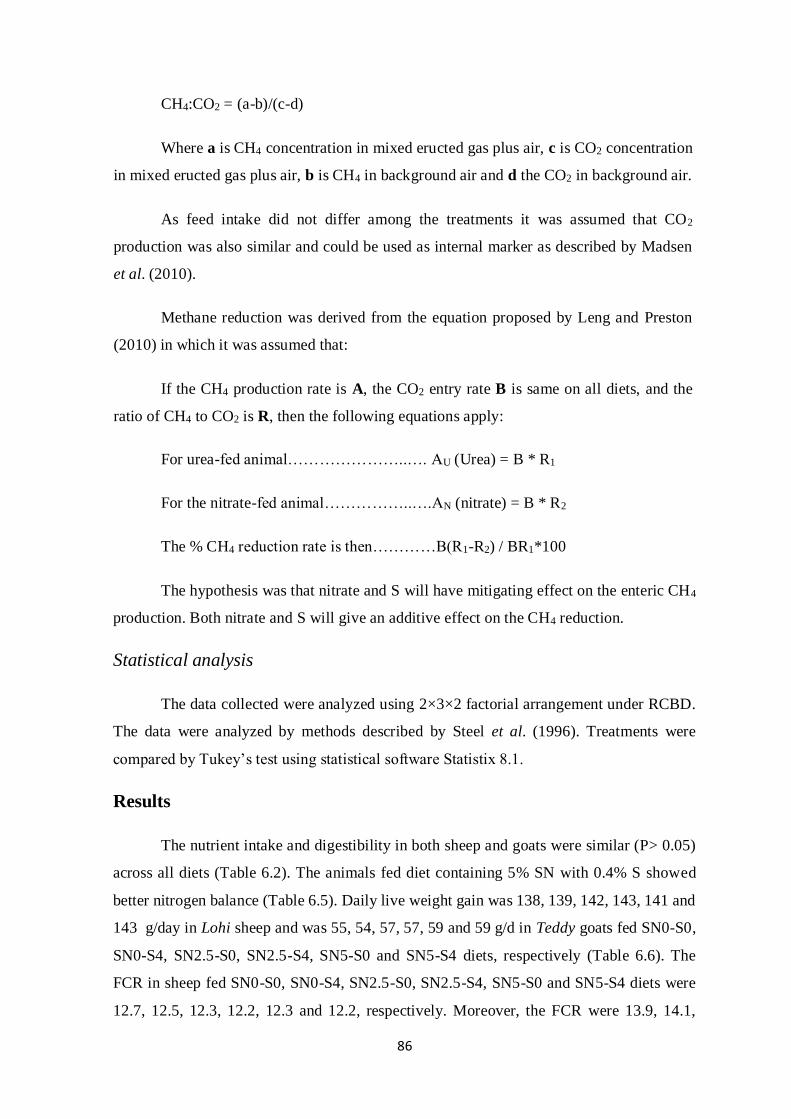
86
CH4:CO2 = (a-b)/(c-d)
Where a is CH4 concentration in mixed eructed gas plus air, c is CO2 concentration
in mixed eructed gas plus air, b is CH4 in background air and d the CO2 in background air.
As feed intake did not differ among the treatments it was assumed that CO2
production was also similar and could be used as internal marker as described by Madsen
et al. (2010).
Methane reduction was derived from the equation proposed by Leng and Preston
(2010) in which it was assumed that:
If the CH4 production rate is A, the CO2 entry rate B is same on all diets, and the
ratio of CH4 to CO2 is R, then the following equations apply:
For urea-fed animal…………………..…. AU (Urea) = B * R1
For the nitrate-fed animal……………..….AN (nitrate) = B * R2
The % CH4 reduction rate is then…………B(R1-R2) / BR1*100
The hypothesis was that nitrate and S will have mitigating effect on the enteric CH4
production. Both nitrate and S will give an additive effect on the CH4 reduction.
Statistical analysis
The data collected were analyzed using 2×3×2 factorial arrangement under RCBD.
The data were analyzed by methods described by Steel et al. (1996). Treatments were
compared by Tukey’s test using statistical software Statistix 8.1.
Results
The nutrient intake and digestibility in both sheep and goats were similar (P> 0.05)
across all diets (Table 6.2). The animals fed diet containing 5% SN with 0.4% S showed
better nitrogen balance (Table 6.5). Daily live weight gain was 138, 139, 142, 143, 141 and
143 g/day in Lohi sheep and was 55, 54, 57, 57, 59 and 59 g/d in Teddy goats fed SN0-S0,
SN0-S4, SN2.5-S0, SN2.5-S4, SN5-S0 and SN5-S4 diets, respectively (Table 6.6). The
FCR in sheep fed SN0-S0, SN0-S4, SN2.5-S0, SN2.5-S4, SN5-S0 and SN5-S4 diets were
12.7, 12.5, 12.3, 12.2, 12.3 and 12.2, respectively. Moreover, the FCR were 13.9, 14.1,

87
13.5, 13.5, 13.0 and 13.0 in goats fed SN0-S0, SN0-S4, SN2.5-S0, SN2.5-S4, SN5-S0 and
SN5-S4 diets, respectively (Table 6.6). The best feed conversion values (P<0.05) were
observed in sheep fed both SN2.5-S4 and SN5-S4 diets. However, best FCR was observed
in goats fed SN5-S0 and SN5-S4 diets. Both in sheep and goats non-significant differences
(P> 0.05) were observed in blood metabolites including blood urea nitrogen, glucose and
Creatinine (Table 6.3). Similar trend (P> 0.05) was observed in hematology (Table 6.4).
None of the animals suffered from methemoglobinemia or polioencephalomalacia. The
difference in enteric CH4 reduction was 0, 2.20, 3.09, 8.06, 12.46 and 19.62% in Lohi
sheep and 0, 3.12, 3.94, 7.66, 11.55 and 18.27% in Teddy goats fed SN0-S0, SN0-S4,
SN2.5-S0, SN2.5-S4, SN5-S0 and SN5-S4 diets, respectively (Table 6.7).
Discussion
Ngoc Huyen Le Thi, (2010) compared SN, ammonium nitrate and urea as sources
of fermentable nitrogen in a basal diet of NaOH treated rice straw and cotton seed meal.
Amount of SN, ammonium nitrate and urea used were 6.6%, 3% and 2.2% of DM
respectively. In this study lower levels of SN (~ 5% SN) were evaluated with 0.4S.
Previously Phuong et al. (2012) and Silivong et al. (2011) in their studies used higher
levels nitrate and sulphate which affected feed intake.
Nutrient Intake and Nutrient digestibility
In present study we observed that nitrate fed animals ate the same amount of DM
as those fed urea in their diets. These observations are similar to those reported by
Sangkhom et al. (2012) who observed similar DMI in cattle fed nitrates or urea as NPN
source in their diets. Consistent findings of Zijderveld et al. (2010) in sheep trial and
Sophea and Preston (2011) in goat trial also supported the findings of present study. The
probable reason to this might be the slow conversion of nitrates to nitrite which as a result
did not accumulate in the rumen. Generally nitrite accumulation in the rumen is considered
responsible for reduced DMI. Phuong et al. (2012) observed non-significant difference in
DMI by animals fed nitrate or urea in their diet but reported decreased intake with sulphate
supplemented diet. Similar finding was also reported by Silivong et al. (2011) who
observed reduced molasses intake when supplemented by sulphates at the rate of 0.8% in
the diet. In our present study sulphate was included at a rate of 0.4% S which was lower as
compared to that of diets used by Phuong et al. (2012) or Silivong et al. (2011) in their

88
studies on cattle or goats respectively. Sulphur addition at higher doses might have caused
bitterness in taste of the diets, which could have resulted in reduced intakes. Other findings
(Hulshof et al., 2010; Bruning-Fann and Kaneene, 1993; Weichenthal et al., 1963) did not
agree with our present results who reported that nitrate supplemented diets negatively
affect DMI. Nitrite accumulation depresses the colonies of some bacterial species growth,
which could lower the feed digestibility. It negatively affects VFA production, reduced
microbial biomass thus lowering intake by the animal. Results by Thanh et al. (2012)
supported our findings on nutrient digestibility. They reported similar digestibility with
nitrate or urea supplemented diets. Our results were also supported by the findings of
Nolan et al. (2010) who used nitrates as feed additive in diets. Feed intake can be
categorized as important factors among many others which influence digestibility. In this
study feed consumption remained unchanged which might have resulted in similar
digestibility.
Abatement of enteric methane
In this study we observed significant enteric CH4 reductions with nitrate supplemented
diets. Various studies (Phuong et al., 2011: Sangkhom et al., 2011; Guo et al., 2009)
supported our findings. Our observations are also consistent with reports of Leng (2008)
who inferred that 1% inclusion of PN could reduce enteric methane production up to 10%
in ruminants. Findings of Leng and Preston (2010) also supported our observations who
reported nitrates as better option to abate enteric methane production rather than urea.
Generally dissimilatory nitrate reduction to NH3 and assimilatory nitrate reduction to NH3
are two pathways considered responsible for nitrate reduction in anaerobic system. Nitrate
reduction in ruminal fluid encourages the growth of nitrate reducing bacteria.
Thermodynamically nitrate conversion to NH3 is more favourable than CH4 formation, if
ruminants were fed nitrate containing diets (Morgavi et al., 2010). According to Leng
(2008) one mol nitrate can produce one mol of NH3 by reducing CH4 in equivalent
amounts. As reported by Ungerfeld and Kohn (2006) thermodynamic conversion sulphate
to hydrogen sulphide gas is more favourable than methanogenesis. We therefore concluded
in this study that both nitrate and sulphate supplementation in diets gave an additive effect
resulting in better enteric methane production. Nitrate adaptation in this study improved
nitrite-reducing capacity of ruminal microbes. This is evident from our present study
findings that we did not observe even a single incidence of nitrite toxicity, even at higher

89
levels of nitrate inclusion. Inconsistent results in CH4 abatement with dietary nitrates were
reported by many researchers. In sheep trial Zijderveld et al. (2010) observed 32% enteric
CH4 reduction. Contrarily Nolan et al. (2010) observed 23% CH4 reduction in the same
specie fed nitrate containing diets as compared to those fed urea as NPN. In cattle fed diets
with nitrate as feed additive Hulshof et al. (2010) observed 32% CH4 reduction. Maximum
60% CH4 reduction were observed in goats by Sophea and Preston (2011) while minimum
16% CH4 reduction were observed in dairy cows fed nitrate supplemented diets. The
possible reason for variable results might be attributed to CH4 measuring technique in
animals. Calorimetric chambers (Zijderveld et al., 2011) and SF6 technique (Hulshof et al.,
2010) is mostly applied techniques for CH4 estimation from animals. Enteric CH4
production can also be estimated via VFAs (Nolan et al., 2010). Sophal et al. (2013) and
Sangkhom et al. (2012) estimated enteric methane production using technique proposed by
Madsen et al. (2010) in which CO2 is used as tracer gas. Diet composition might also
affect rumen nitrite accumulation. This is evident from the work of some researchers
(Hulshof et al., 2010; leng, 2008). Hulshof et al. (2010) observed that sugarcane based
favoured nitrite accumulation in the ruminal fluid. Other researchers (Johnson et al., 1994;
Grainger et al., 2007) found variable results of CH4 estimation from SF6 method as
compared to chamber measurements.
Growth performance
In this study we observed better daily live weight gains and feed conversion ratios
with diets supplemented with 5% SN with 0.4% S. These results are similar as mentioned
by Sangkhom et al. (2012) who reported better weight gains in cattle fed nitrate
supplemented diets as compared to urea as NPN source. In a goat trial Trinh phuc Hao et
al. (2009) also observed similar trend in weight gains when nitrate rather than urea was a
part of the diet. Our results did not agree with the reports of Thanh et al. (2012) who
observed enteric CH4 reductions in sheep fed nitrate supplemented diets but did not find
any weight gains. Trinh phuc Hao et al. (2009) also reported similar weight gains in goats
fed nitrate containing diets. Results were further supported by Zijderveld et al. (2011)
working on dairy cows. According to Tillman et al. (1965) nitrate might be responsible for
reduced growth rates. Methane mitigation improves nutritive value of feed, which in turns
resulted into better animal performance (Blaxter and clapperton, 1965). Similar findings
were also reported by Beauchemin et al. (2008).

90
These findings suggest that, if nitrite accumulation did not occur in the rumen, it might
have resulted in NH3 production at a rate equal to assimilatory microbial growth rate.
During this process the electron transfer of NH3 preserves more energy in ruminal end
products as compared to CH4 emission. This conserved energy might have resulted in
increased growth efficiency of ruminal microbes. Thus improving the feed efficiency of
the nitrate supplemented diets (Leng, 2008).
Blood Chemistry
The non-significant results of blood metabolites and haematology during the study
interpreted that none of the animals had nitrate or nitrite toxicity throughout the study.
During the whole study animal remained healthy without any abnormal behaviour. Present
study data made it possible to predict that either slow nitrate acclimation of animal or
balance between nitrate to S ratios tended to maintain the activity of both nitrate reducing
bacteria and S reducing bacteria (Leng, 2008). The present results close by related to the
observations of Alaboudi and Jones (1985) and Ngoc Huyen Le Thi (2010) who reported
no evidence of nitrate or nitrite toxicity even at higher levels of inclusion in the diet. Minor
incidence of nitrate toxicity was reported by Zijderveld et al. (2010). Methemoglobinemia
condition develops only when MetHb level is 30 to 40% of Hb (Bruning-Fann and
Kaneene, 1993). Blood urea nitrogen concentrations are very high for goats possibly due to
breed difference. Moreover, its numbers can vary greatly between different locations and
different laboratories.
Conclusion
Diets containing SN in combination with S did not only reduce enteric CH4
production from Lohi sheep but it also improved their growth performance. As compared
to Teddy goats, Lohi Sheep showed better enteric CH4 reductions using the diets
containing SN in combination with S.

91
Table 6.1 Ingredient composition of experimental diets
1SN0, SN2.5 and SN5 stand for sodium nitrate at ~ 0, 2.5 and 5% respectively. S0 and S4 stand for
0 and 0.4% sulphur, respectively.
Ingredients
Diets1
SN0 SN2.5 SN5 S0 S4 S0 S4 S0 S4
Wheat Straw 35.0 35.0 35.0 35.0 35.0 35.0
Cotton seed meal 10.00 10.00 10.00 10.00 10.00 10.00
Rice bran 10.00 10.00 10.00 10.00 10.00 10.00
Maize gluten Meal 30% 5.00 5.00 5.00 5.00 5.00 5.00
Hay (Lucerne) 21.00 21.00 21.00 21.00 21.00 21.00
Enzose 14.00 14.00 14.00 14.00 14.00 14.00
Anhydrous Mag. Sulphate 0.00 1.50 0.00 1.50 0.00 1.50
Sodium Chloride 1.00 1.00 1.00 1.00 1.00 1.00
Di-Calcium Phosphate 2.00 2.00 2.00 2.00 2.00 2.00
Sodium Nitrate 0.00 0.00 2.45 2.45 4.90 4.90
Urea 1.70 1.70 0.85 0.85 0.00 0.00
Chemical composition (%)
Dry Matter 88.08 89.58 89.68 91.18 91.28 92.78
Crude Protein 18.0 18.0 18.0 18.0 18.0 18.0
Neutral Detergent Fiber 44.36 44.36 44.36 44.36 44.36 44.36
Acid Detergent Fiber 31.38 31.38 31.38 31.38 31.38 31.38
Metabolizable Energy (Mcal/kg) 2.06 2.06 2.06 2.06 2.06 2.06

92
Table 6.2 Effect of different levels of sodium nitrate with or without sulphur on Nutrient intake and their
digestibility in Lohi sheep and Teddy goat
Items
Lohi Sheep Teddy Goat
SEM2
Significance3
Diets1
SN0 SN2.5 SN5 SN0 SN2.5 SN5
S0 S4 S0 S4 S0 S4 S0 S4 S0 S4 S0 S4 A B AB ABC
Nutrient Intake,g/d
DM 1740a 1738a 1736a 1736a 1735a 1738a 766b 768b 767b 766b 765b 769b 2.85 NS NS NS *
CP 313a 313a 313a 312a 312a 313a 138b 138b 138b 138b 138b 138b 0.57 NS NS NS *
NDF 772a 771a 771a 770a 770a 771a 340b 341b 340b 340b 339b 341b 1.32 NS NS NS *
ADF 546a 545a 546a 545a 545a 546a 241b 241b 241b 240b 240b 241b 0.89 NS NS NS *
Digestibility,%
DM 58.5abc 59.0ab 57.0abcde 58.0abcd 58.3abcd 59.5a 54.0de 55.0bcde 53.8e 54.5cde 54.3cde 55.8abcd 0.63 NS NS NS *
CP 63.5c 62.5cd 62.5cd 62.5cd 62.5cd 61.0d 70.5a 70.5a 70.0a 70.3a 69.3ab 68.0b 0.31 * * * *
NDF 52.0ab 51.0ab 51.5ab 52.3a 50.5ab 51.8ab 49.5ab 48.8ab 49.0ab 51.0ab 48.0b 50.3ab 0.85 NS NS NS *
ADF 43.5 41.8 42.8 44.0 44.8 43.8 41.8 42.0 41.0 43.8 41.5 42.3 0.92 NS NS NS NS
1 SN0, SN2.5 and SN5 stand for sodium nitrate at ~ 0, 2.5 and 5% respectively. S0 and S4 stand for 0 and 0.4% sulphur, respectively. 2SEM stand for Standard error mean. 3A, B, C and ABC stand for Nitrate levels, Sulfur levels, Species and their Interaction, respectively while AB stand for Interaction of nitrate levels with sulphur levels. NS stand for Non significant (P>0.05) and * stand for Significant (P<0.05). a,b,c Means in a row with different superscripts differ significantly (p<0.05). DM, CP, NDF and ADF stand for Dry matter, Crude Protein, Neutral detergent fibre and Acid detergent fibre respectively.

93
Table 6.3 Effect of different levels of sodium nitrate with or without sulphur on blood metabolites in Lohi sheep and
Teddy goat
Items
(mg/dL)
Lohi Sheep Teddy Goat
SEM2
Significance3
Diets1
SN0 SN2.5 SN5 SN0 SN2.5 SN5
S0 S4 S0 S4 S0 S4 S0 S4 S0 S4 S0 S4 A B AB ABC
BUN 18.3a 18.5a 19.3a 19.0 a 18.5 a 19.0 a 26.5b 26.5b 26.5b 26.0b 26.5b 26.5b 0.57 NS NS NS *
Blood Glucose 74.5a 73.3a 73.0a 72.3 a 73.5a 73.8a 96.0b 95.5b 94.0b 96.5b 96.5b 96.3b 0.86 NS NS NS *
Creatinine 2.4a 2.5a 2.4a 2.4a 2.5a 2.4a 1.6b 1.5b 1.6b 1.5b 1.6b 1.7b 0.09 NS NS NS *
1 SN0, SN2.5 and SN5 stand for sodium nitrate at ~ 0, 2.5 and 5% respectively. S0 and S4 stand for 0 and 0.4% sulphur, respectively. 2SEM stand for Standard error mean. 3A, B, C and ABC stand for Nitrate levels, Sulfur levels, Species and their Interaction, respectively while AB stand for Interaction of nitrate levels with sulphur levels. NS stand for Non significant (P>0.05) and * stand for Significant (P<0.05).a,b,c Means in a row with different superscripts differ significantly (p<0.05). BUN stand for blood urea nitrogen.
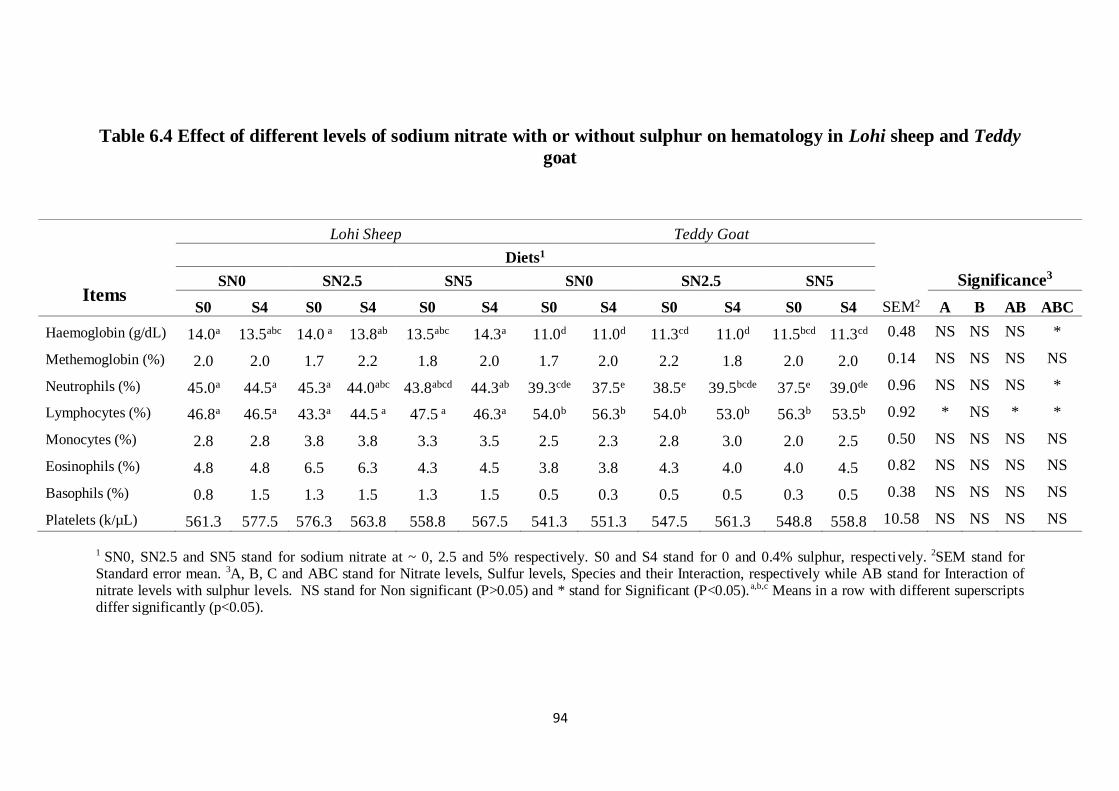
94
Table 6.4 Effect of different levels of sodium nitrate with or without sulphur on hematology in Lohi sheep and Teddy
goat
Items
Lohi Sheep Teddy Goat
SEM2
Significance3
Diets1
SN0 SN2.5 SN5 SN0 SN2.5 SN5
S0 S4 S0 S4 S0 S4 S0 S4 S0 S4 S0 S4 A B AB ABC
Haemoglobin (g/dL) 14.0a 13.5abc 14.0 a 13.8ab 13.5abc 14.3a 11.0d 11.0d 11.3cd 11.0d 11.5bcd 11.3cd 0.48 NS NS NS *
Methemoglobin (%) 2.0 2.0 1.7 2.2 1.8 2.0 1.7 2.0 2.2 1.8 2.0 2.0 0.14 NS NS NS NS
Neutrophils (%) 45.0a 44.5a 45.3a 44.0abc 43.8abcd 44.3ab 39.3cde 37.5e 38.5e 39.5bcde 37.5e 39.0de 0.96 NS NS NS *
Lymphocytes (%) 46.8a 46.5a 43.3a 44.5 a 47.5 a 46.3a 54.0b 56.3b 54.0b 53.0b 56.3b 53.5b 0.92 * NS * *
Monocytes (%) 2.8 2.8 3.8 3.8 3.3 3.5 2.5 2.3 2.8 3.0 2.0 2.5 0.50 NS NS NS NS
Eosinophils (%) 4.8 4.8 6.5 6.3 4.3 4.5 3.8 3.8 4.3 4.0 4.0 4.5 0.82 NS NS NS NS
Basophils (%) 0.8 1.5 1.3 1.5 1.3 1.5 0.5 0.3 0.5 0.5 0.3 0.5 0.38 NS NS NS NS
Platelets (k/µL) 561.3 577.5 576.3 563.8 558.8 567.5 541.3 551.3 547.5 561.3 548.8 558.8 10.58 NS NS NS NS
1 SN0, SN2.5 and SN5 stand for sodium nitrate at ~ 0, 2.5 and 5% respectively. S0 and S4 stand for 0 and 0.4% sulphur, respectively. 2SEM stand for Standard error mean. 3A, B, C and ABC stand for Nitrate levels, Sulfur levels, Species and their Interaction, respectively while AB stand for Interaction of nitrate levels with sulphur levels. NS stand for Non significant (P>0.05) and * stand for Significant (P<0.05). a,b,c Means in a row with different superscripts differ significantly (p<0.05).

95
Table 6.5 Effect of different levels of sodium nitrate with or without sulphur on nitrogen balance in Lohi sheep and
Teddy goat
Items
(g/day)
Lohi Sheep Teddy Goat
SEM2
Significance3
Diets1
SN0 SN2.5 SN5 SN0 SN2.5 SN5
S0 S4 S0 S4 S0 S4 S0 S4 S0 S4 S0 S4 A B AB ABC
Nitrogen Intake 50.1a 50.1a 50.0a 50.0a 49.9a 50.1a 22.0b 22.1b 22.0b 22.0b 22.0b 22.1b 0.08 NS NS NS *
Faecal Nitrogen 18.1b 18.6b 18.6b 18.6b 18.6b 19.3a 6.6c 6.6c 6.7c 6.6c 6.9c 7.1c 0.12 * * * *
Urinary Nitrogen 24.7a 24.1ab 23.9b 23.8b 23.9b 23.1c 12.5de 12.6d 12.3de 12.4de 12.1de 11.9e 0.14 * * * *
Nitrogen Balance 7.3 c 7.4ac 7.5ab 7.6a 7.4ac 7.7a 2.9e 2.9e 3.0de 3.0de 3.0de 3.1d 0.04 * * * *
1 SN0, SN2.5 and SN5 stand for sodium nitrate at ~ 0, 2.5 and 5% respectively. S0 and S4 stand for 0 and 0.4% sulphur, respectively. 2SEM stand for
Standard error mean. 3A, B, C and ABC stand for Nitrate levels, Sulfur levels, Species and their Interaction, respectively while AB stand for Interaction of
nitrate levels with sulphur levels. NS stand for Non significant (P>0.05) and * stand for Significant (P<0.05).a,b,c Means in a row with different superscripts
differ significantly (p<0.05).
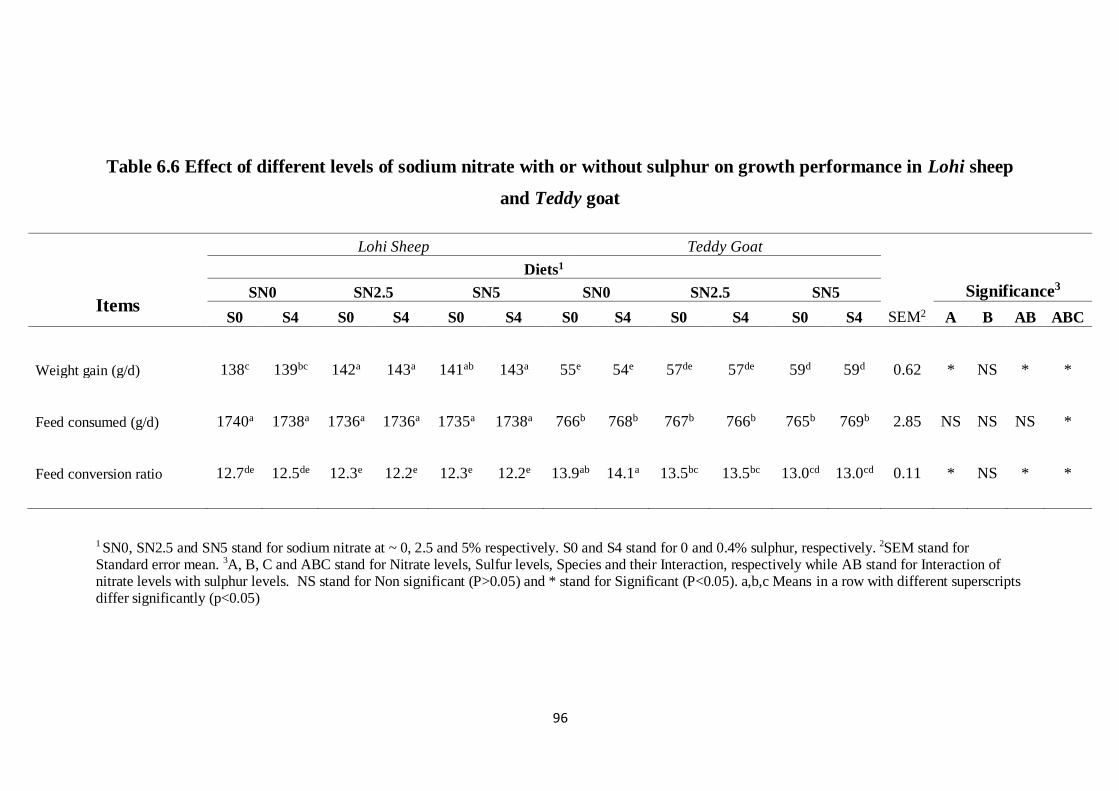
96
Table 6.6 Effect of different levels of sodium nitrate with or without sulphur on growth performance in Lohi sheep
and Teddy goat
Items
Lohi Sheep Teddy Goat
SEM2
Significance3
Diets1
SN0 SN2.5 SN5 SN0 SN2.5 SN5
S0 S4 S0 S4 S0 S4 S0 S4 S0 S4 S0 S4 A B AB ABC
Weight gain (g/d) 138c 139bc 142a 143a 141ab 143a 55e 54e 57de 57de 59d 59d 0.62 * NS * *
Feed consumed (g/d) 1740a 1738a 1736a 1736a 1735a 1738a 766b 768b 767b 766b 765b 769b 2.85 NS NS NS *
Feed conversion ratio 12.7de 12.5de 12.3e 12.2e 12.3e 12.2e 13.9ab 14.1a 13.5bc 13.5bc 13.0cd 13.0cd 0.11 * NS * *
1 SN0, SN2.5 and SN5 stand for sodium nitrate at ~ 0, 2.5 and 5% respectively. S0 and S4 stand for 0 and 0.4% sulphur, respectively. 2SEM stand for Standard error mean. 3A, B, C and ABC stand for Nitrate levels, Sulfur levels, Species and their Interaction, respectively while AB stand for Interaction of nitrate levels with sulphur levels. NS stand for Non significant (P>0.05) and * stand for Significant (P<0.05). a,b,c Means in a row with different superscripts differ significantly (p<0.05)

97
Table 6.7 Effect of different levels of sodium nitrate with or without sulphur on enteric methane production in Lohi
sheep and Teddy goat
Items
Lohi Sheep Teddy Goat
SEM2
Significance3
Diets1
SN0 SN2.5 SN5 SN0 SN2.5 SN5
S0 S4 S0 S4 S0 S4 S0 S4 S0 S4 S0 S4 A B AB ABC
Animal
(CH4 in ppm) 65.2bc 63.8c 63.4cd 60.2de 57.3e 53.1f 70.2a 68.1ab 67.6ab 65.2bc 62.3cd 58.0e 0.64 * * * *
Animal (CO2 in ppm)
1134.8a 1134.8a 1136.0a 1136.0a 1134.8a 1138.5a 1094.8b 1094.8b 1096.0b 1097.3b 1094.8b 1098.8b 2.93 NS NS NS *
CH4 (Animal - Air) : CO2
(Animal - Air)
0.087d 0.085de 0.0845de 0.080ef 0.076f 0.070g 0.0998a 0.0965ab 0.0955ab 0.0920bc 0.0880cd 0.0813e 0.0010 * * * *
CH4
Reduction (%)
0 2.22 3.09 8.06 12.46 19.62 0 3.12 3.94 7.66 11.55 18.27
Air (Methane gas in ppm) = 1.98; Air (carbon dioxide gas in ppm) = 410
1 SN0, SN2.5 and SN5 stand for sodium nitrate at ~ 0, 2.5 and 5% respectively. S0 and S4 stand for 0 and 0.4% sulphur, respectively. 2SEM stand for Standard error mean. 3A, B, C and ABC stand for Nitrate levels, Sulfur levels, Species and their Interaction, respectively while AB stand for Interaction of
nitrate levels with sulphur levels. NS stand for Non significant (P>0.05) and * stand for Significant (P<0.05).a,b,c Means in a row with different superscripts differ significantly (p<0.05).

98
General Conclusion
Comapared with urea, nitrate reduced enteric methane production in both species.
There were no differences among the three nitrate salts (Potassium nitrate, Calcium
ammonium nitrate and Sodium nitrate). Diets containing nitrate in combination with sulphur
did not only reduce enteric CH4 production from both Lohi sheep and Teddy goats at different
growing stages but it also improved their growth performance. Enteric CH4 reductions were
better in Lohi sheep as compared to Teddy goats fed diet containing nitrate in combination
with sulphur. It appeared that adaptation improved the nitrite-reducing capacity of rumen
microbes. Non-significant changes in hematology and blood metabolites indicated that same
health status of all animals. In all the three experiments, none of the animal showed any kind
of abnormal behaviour or signs of illness during the whole experimental period. This
indicated that none of the animals suffered from nitrate or S toxicity.

99
Chapter 7
Summary
The present study, comprising of three independent experiments, was designed to
evaluate the the effect of different nitrate sources with or without sulphate on enteric CH4
production and growth performance of sheep and goats at different growing stages. In first
weaning experiment impact of varying levels of PN with or without S on nutrient intake,
digestibility, growth performance, blood metabolites, hematology, nitrogen balance and
enteric CH4 reduction were examined in forty eight, male, weaned animals (Twenty four
each, Lohi Lambs and Teddy goats). In the second trial same experiment was repeated by
using varying levels of CAN at growing age. Animals in this experiment were of
approximately six months of age. Similarly, in the third trial animals of approximately nine
months of age were selected and the study was conducted by using different levels of SN
with and without sulphate.
In experiment 1, the nutrient intake and digestibility in both weaned lambs and goats
were similar (P> 0.05) across all diets. The animals fed diet containing 6% PN with 0.4% S
showed better nitrogen balance. Daily live weight gain of of both lambs (146 g/day) and
goats (66.0 g/day) fed diet containing 6% PN and 0.4% S was the highest and best values of
FCR (P<0.05) were also observed in both group of animals. Enteric CH4 was 32.6% reduced
(P<0.05) in lambs and 31.9% in goats fed diet containing 6% PN and 0.4% S compared to
those fed C.
In experiment 2, The nutrient intake and digestibility in both sheep and goats were
similar (P> 0.05) across all diets. The animals fed diet containing 3% CAN with 0.4% S
showed better nitrogen balance. Enteric CH4 was 28.6% reduced (P<0.05) in sheep and
26.9% in goats fed diet containing 3% CAN and 0.4% S compared to those fed C. Each sheep
fed diet containing 3% CAN and 0.4% S gained 144 g/day, whereas daily live weight gain by
goats fed diet containing 3% CAN with or without S was 58 g/day.
In experiment 3, The nutrient intake and digestibility in both sheep and goats were
similar across all diets. The animals fed diet containing 5% SN with 0.4% S showed better
nitrogen balance. The enteric CH4 was 19.6% reduced in sheep and 18.2% in goats fed diet
containing 5% SN and 0.4% S compared to those fed C. Daily live weight gain of both sheep
and goats fed diet containing 5% SN and 0.4% S was 143 and 59 g/day, respectively. The

100
best feed conversion values (P<0.05) were observed in sheep fed both SN2.5-S4 and SN5-S4
diets. However, best FCR was observed in goats fed SN5-S0 and SN5-S4 diets.
Non-significant changes in hematology and blood metabolites indicated same health
status of all animals. In all the three experiments, none of the animal showed any kind of
abnormal behaviour or signs of illness during the whole experimental period. This indicated
that none of the animals suffered from nitrate or S toxicity. All the fed nitrate sources showed
similar response with sulphates during various stages of growth in sheep and goats. In
conclusion the roughage based diets with nitrates and sulphate reduced enteric CH4
production, both in sheep and goats.

101
Literature Cited
Ajisaka, N., N. Mohammed, K. Hara, K. Mikuni, K. Hara, H. Hashimoto, T. Kumata,
S. Kanda, and H. Itabashi. 2002. Effects of medium-chain fatty acid-
cyclodextrin complexes on ruminal methane production in-vitro. Anim. Sci. J.
73:479-484.
Akunna, J. C., C. Bizeau and R. Moletta. 1993. Nitrate and nitrite reductions with
anaerobic sludge using various carbon sources: glucose, glycerol, acetic acid,
lactic acid and methanol. Water Res. 27:1303-12.
Alaboudi, A. R. and G. A. Jones. 1985. Effect of acclimation to high nitrate intakes on
some rumen fermentation parameters in sheep. Can. J. Anim. Sci. 65: 841-849.
Alcock, D. and R. S. Hegarty. 2006. Effects of pasture improvement on productivity,
gross margin and methane emissions of a grazing sheep enterprise. In
‘Proceedings of the 2nd international conference on greenhouse gases and
animal agriculture’. (Eds CR Soliva, J Takahashi, MKreuzer) pp. 103–106.
(Elsevier: Zurich).
Allison M. J., C. A. Reddy and H. M. Cook. 1981. The effects of nitrate and nitrite on
VFA and CH4 production by rumen microbes. J. Anim. Sci. 53(Suppl): 283.
Allison, M. J. and C. A. Reddy. 1984. Adaptations of gastrointestinal bacteria in
response to changes in dietary oxlalate and nitrate. Pages 248–256 In: Third
International Symposium on Microbial Ecology, Washington DC.
Anderson, R. C., M. A. Rasmussen, N. S. Jensen and M. J. Allison. 2000.
Denitrobacterium detoxificans gen. nov., sp. nov., a ruminal bacterium that
respires on nitrocompounds. Int. J. Syst. Evol. Microbiol.50: 633–638.
Anver, R. K. 2011. Symposium on "Changing Environmental Pattern and its impact
with special focus on Pakistan". Vol. 33 of Pakistan Engineering Congress
ISBN, 9696030037, 9789696030034.
AOAC, 1990. Official Methods of Analysis. Association of Official Analytical
Chemists. 15th Edition (K Helrick editor). Arlington Virginia, USA. pp 1230.

102
Asanuma, N., M. Iwamoto and T. Hino. 1999. Effect of the addition of fumarate on
methane production by ruminal microorganisms in-vitro. J. Dairy Sci. 82: 780-
787.
Babar, M. E. 1994. Genetic and phenotypic parameters of some performance
characteristics of Lohi Sheep. PhD. Dissertation. University of Agriculture,
Faisalabad. Pakistan.
Bauman, D. E. 1992. Bovine somatotropin: Review on an emerging animal
technology. J. Dairy Sci. 75:3432-3451.
Bayaru, E., S. Kanda, T. Kamada, H. Itabashi, N. Andoh, T. Nishida, M. Ishida, T.
Itoii, K. Nagara and Y. Isobe. 2001. Effect of fumaric acid on methane
production, rumen fermentation and digestibility of cattle fed roughage alone.
Anim. Sci. J. 72, 139-146.
Beauchemin, K. A. and S. M. McGinn. 2005. Methane emissions from feedlot cattle
fed barley or corn diets. J. Anim. Sci. 83: 653-661.
Beauchemin, K. A. and S. M. McGinn. 2006. Methane emissions from beef cattle:
effects of fumaric acid, essential oil and canola oil. J. Anim. Sci. 84: 1489–
1496.
Beauchemin, K. A., M. Kreuzer, F. O'Mara and T. A. McAllister. 2008. Nutritional
management for enteric methane abatement: a review. Aust. J. Exp. Agr. 48:
21-27.
Belyea, R. L., P. J. Marin, and H. T. Sedgwick. 1985. Utilization of chopped and long
alfalfa by dairy heifers. J. Dairy Sci. 68:1297–1301.
Bhatta, R., K. Tajima, N. Takusari, K. Higuchi, O. Enishi and M. Kurihara. 2006.
Comparison of sulfur hexafluoride tracer technique, rumen simulation
technique and in-vitro gas production techniques for methane production from
ruminant feeds. Int. Congr. Ser. 1293: 58-61.
Binh Phuong, L. T., T. R Preston and R. A. Leng, 2011. Mitigating methane
production from ruminants; effect of supplementary sulphate and nitrate on
methane production in an in vitro incubation using sugar cane stalk and cassava

103
leaf meal as substrate. Livest Res Rural Dev. Volume 23, Article #22.
http://www.lrrd.org/lrrd23/2/phuo23022.htm
Bird, S. H., R. S. Hegarty and R. Woodgate. 2008. Persistence of defaunation effects
on digestion and methane production in ewes. Aust. J. Exp. Agric. 48: 152-155.
Birkelo, C. P., D. E. Johnson, and G. M. Ward. 1986. Net energy value of ammoniated
wheat straw. J. Anim. Sci. 63:2044–2052.
Blaxter, K. L. and J. L. Clapperton. 1965. Prediction of the amount of methane
produced by ruminants. Br. J. Nutr. 19: 511–522.
Blummel, M. and E. R. Orskov. 1993. Comparison of in-vitro gas production and
nylon bag degradability of roughages in predicting feed intake in cattle. Anim.
Feed Sci. Technol. 40: 109-119.
Blummel, M., H. P. S. Makkar, and K. Becker. 1997. In-vitro gas production: A
technique revisited. J. Anim. Physiol. 77:24–34.
Boadi, D. A., and K. M. Wittenberg. 2002. Methane production from dairy and beef
heifers fed forages differing in nutrient density using the sulphur hexafluoride
(SF6) tracer gas technique. Can. J. Anim. Sci. 82:201–206.
Boadi, D. A., K. M. Wittenberg and A. D. Kennedy. 2002. Validation of the sulphur
hexafluoride (SF6) tracer gas technique for measurement of methane and carbon
dioxide production by cattle. Can. J. Anim. Sci. 82: 125–131.
Boadi, D., C. Benchaar, J. Chiquette and D. Massé. 2004. Mitigation strategies to
reduce enteric methane emissions from dairy cows: Update review. Can. J.
Anim. Sci. 84: 319–335.
Bozic, A. K., R. C. Anderson, S. C. Carstens, , T. R. Callaway, M. T. Yokoyama, J. K.
Wang and D. J. Nisbet, 2009. Effects of the methane-inhibitors nitrate,
nitroethane, lauric acid, lauricidin and the Hawaiian marine algae chaetoceros
on Ruminal fermentation in-vitro. Bioresource technology 100 (17): 4017-
40259.
Bradley, W. B., O. A. Beath and H. F. Eppson. 1939. Nitrate as the cause of oat hay
poisoning. J. Am. Vet. Med. Assn. 94: 541-546.

104
Broudiscou, L. P., Y. Papon and A. F. Broudiscou. 2000. Effects of dry plant extracts
on fermentation and methanogenesis in continuous culture of rumen microbes.
Anim. Feed Sci. Technol. 87: 263–277.
Bruning-Fann, C. S. and J. B. Kaneene. 1993. The effects of nitrate, nitrite, and n-
nitroso compounds on animal health. Vet. Hum. Toxicol. 35: 237-253.
Bull, R. C., D. O. Everson, D. P. Olson, K. W. Kelly, S. Curtis and G. zou. 1991.
Concentration of serum constituents in cold stressed calves from heifers and
inadequate protein and (or) energy. J. Anim. Sci. 69: 853-863.
Calsamiglia, S., M. Busquet, P. W. Cardozo, L. Castillejos and A. Ferret. 2007. Invited
review: Essential oils as modifiers of rumen microbial fermentation. J. Dairy
Sci. 90: 2580-2595.
Carmean, B. R. and D. E. Johnson. 1991. Persitence of monensin induced changes in
methane emissions and ruminal Protozoa numbers in catlle. J. Anim. Sci..
65:517.
Carulla, J. E., M. Kreuzer, A. Machmuller and H.D. Hess. 2005. Supplementation of
Acacia mearnsii tannins decreases methanogenesis and urinary nitrogen in
forage-fed sheep. Aust. J. Agric. Res. 56: 961-970.
Carver, L. A. and W. H. Pfander. 1974. Some metabolic aspects of urea and/or
potassium nitrate utilization by sheep. J. Anim. Sci. 38: 410-416.
Chalupa, W. 1977. Manipulating rumen fermentation. J. Anim. Sci. 46:585-599.
Chaves, A. V., M. L. He, W. Z. Yang, A. N. Hristov, T. A. McAllister, and C.
Benchaar. 2008. Effects of essential oils on proteolytic, deaminative and
methanogenic activities of mixed ruminal bacteria. Can. J. Anim. Sci. 88:117-
122.
Cheeke, P. R. 2000. Actual and potential applications of yucca schidigera and quillaja
saponaria saponins in human and animal nutrition. J. Anim. Sci. 77:1-10.
Cheng, K. J., R. C. Phillippe and W. Majak. 1988. Identification of rumen bacteria that
anaerobically degrade nitrite. Can. J. Microbiol. 34(9): 1099-102.

105
Chung, Y. H., M. Zhou, L. Holtshausen, T. W. Alexander, T. A. McAllister, L. L.
Guan, M. Oba, and K. A. Beauchemin. 2012. A fibrolytic enzyme additive for
lactating Holstein cow diets: Ruminal fermentation, rumen microbial
populations, and enteric methane emissions. J. Dairy Sci. 95:1419–1427.
Coleman, G. S. 1986. The distribution of carboxymethylcellulase between fractions
taken from the rumen of sheep containing no protozoa or one of five different
protozoal populations. J. Agric. Sci. Camb.106: 121–127.
CONAM (Consejo Nacional del Ambiente). 2001. Communication Nacinal del Peru a
la Convencion de las Nacions Unida sobre Cambio Climatico. Primera
Communication. Consejo Nacional del Ambiente, Lima, Peru.
Coppock, C. E., W. P. Flatt, and L. A. Moore. 1964. Effect of hay to grain ratio on
utilization of metabolizable energy for milk production by dairy cows. J. Dairy
Sci. 47:1330–1338.
Crawford, R. F., W. K. Kennedy and K. L. Davison. 1966. Factors influencing the
toxicity of forages that contain nitrate when fed to cattle. Cornell Vet. 56: 3-17.
Czerkawski, J. W., K. L. Blaxter and F. W. Wainman. 1966a. The effect of linseed oil
and of linseed oil fatty acids incorporated in the diet on the metabolism of
sheep. Br. J. Nutr. 20:485-494.
Czerkawski, J. W., K. L. Blaxter and F. W. Wainman. 1966b. The metabolism of oleic,
linoleic and linolenic acids by sheep with reference to their effects on methane
production. Br. J. Nutr. 20:349-362.
Davies, H. L., T. F. Robinson, B. L. Roeder, M. E. Sharp, N. P. Johnston, A. C.
Christensen and G. B. Schaalje. 2007. Digestibility, nitrogen balance, and blood
metabolites in Llama (Lama glama) and alpaca (lama pacos) fed barley or
barley alfalfa diets. Small Rumin. Res. 73: 1-7.
Deeb, B. S. and K. W. Sloan. 1975. Nitrates, nitrites and health. University of Illinois,
Urbana Champaign, Bull. #750.
Devendra, C. 1985. Food production from goats. Paper presented at the XIII
International Nutrition Congress, August 18- 23, 1985, Brighton, England.

106
Do Thi Thanh Van, Duong Nguyen Khang and T.R. Preston. 2010. Methane emission
in yellow cattle fed diets based on NaOH treated rice straw, cassava root and
leaf meal, supplemented with sodium nitrate or urea as sources of non-protein
nitrogen. http://www.mekarn.org/workshops/pakse/abstracts/van.NIAS.htm
Dohme, F., A. Machmuller, A. Wasserfallen and M. Kreuzer. 2000. Comparative
efficiency of various fats rich in medium chain fatty acids to suppress ruminal
methanogenesis as measured with RUSITEC. Can. J. Anim. Sci. 80: 473-482.
Dohme, F., A. Machmuller, A. Wasserfallen, M. Kreuzer. 2001. Ruminal
methanogenesis as influenced by individual fatty acids supplemented to
complete ruminant diets. Lett. Appl. Microbiol. 32: 47-51.
Doreau, M., and A. Ferlay. 1995. Effect of dietary lipids on nitrogen metabolism in the
lumen: A review. Livest. Prod. Sci. 43:97–110.
Du Thuy Thanh, T.R. Preston and R.A. Leng. 2011. Effect on methane production of
supplementing a basal substrate of molasses and cassava leaf meal with
mangosteen peel (Garciniamangostana) and urea or nitrate in an in-vitro
incubation. Livest Res Rural Dev. 23 (4).
http://www.lrrd.org/lrrd23/4/than23098.htm
Eckard, R. J., C. Grainger, C. A. M. de Klein. 2011. Options for the abatement of
methane and nitrous oxide from ruminant production: A review. Livest. Sci.
130: 47-56.
Eckard, R. J., D. Dalley, M. Crawford. 2000. Impacts of potential management
changes on greenhouse gas emissions and sequestration from dairy production
systems in Australia. Management options for carbon sequestration in forest,
agricultural and rangeland ecosystems. In: Keenan, R., Bugg, A.L., Ainslie, H.
(Eds.), Workshop Proceedings. CRC for Greenhouse Accounting, Canberra.
ISBN: 0646404318, pp. 58–72.
Economic Survey of Pakistan. 2012-13. Economic Advisors Wing, Ministry of
Finance. Govt. of Pakistan, Islamabad.

107
Ellis, J. L., J. Dijkstra, E. Kebreab, A. Bannink, N. E. Odongo, B. W. McBride
and J. France. 2008. Aspects of rumen microbiology central to mechanistic
modelling of methane production in cattle. J. Agric. Sci. 146:213-33.
EPA, 2006. Inventory of US Greenhouse Gas Emissions and Sinks: 1990–2004. United
States Environmental Protection Agency, Washington, DC. USEPA #430- R-
06-002.
Eugene, M., D. Masse , J. Chiquette, and C. Benchaar. 2008. Short communication:
Meta-analysis on the effects of lipid supplementation on methane production in
lactating dairy cows. Can. J. Anim. Sci. 88:331-334.
Eugene, M., H. Archimede, D. Sauvant. 2004. Quantitative meta-analysis on the
effects of defaunation of the rumen on growth, intake and digestion in
ruminants. Livest. Prod. Sci. 85: 81-97.
Evelyn, K. A. and H. T. Malloy. 1938. Microdetermination of oxy-hemoglobin,
methemoglobin, and sulfhemoglobin in a single sample of blood. J. Biol. Chem.
126: 655–663.
Fahey, G. C. and L. L. Berger. 1988. Carbohydrate nutrition in ruminants. In: D.C.
Church (ed.). The Ruminant Animal: Digestive Physiology and Nutrition.
Prentice-Hall, Englewood Cliffs, New Jersey. p. 269-297.
FAO (Food and Agriculture Organization) 2002. Greenhouse gas emissions from
ruminant supply chains. FAO. Rome.
FAO (Food and Agriculture Organization) 2006. Livestock’s long shadow.
Environmental issues and options. Chapter 3.5.2, 119. FAO. Rome.
FAO (Food and Agriculture Organization). 1984. Land, Food and People. Based on the
FAO/UNFPA/IIASA report "Potential population supporting capacities of lands
in the developing world". Food and Agriculture Organization of the United
Nations, Rome.
FAO (Food and Agriculture Organization). 1997. Report of the FAO / ADB
Cooperative Programme entitled as Pakistan Livestock study (55/87 AS-PAK
39), Phase I, Vol. I. Rome, Italy.

108
FAO (Food and Agriculture Organization). 2009. The State of Food and Agriculture.
Livestock in the Balance. Rome, Italy.
FAOSTAT (Food and Agriculture Organization of the United Nations) 2007.
FAOSTAT Database. Available at: http://faostat.fao.org/site/291/default.aspx
(accessed 24 February 2012).
FAOSTAT (Food and Agriculture Organization of the United Nations) 2008.
http://faostat.fao.org/default.aspx
FAOSTAT (Food and Agriculture Organization of the United Nations) 2006.
FAOSTAT Agricultural Data. Available at: <http:// faostat.fao.org/> accessed
26 March 2007.
Ferme, D., C. Kamel and G. Avgustin 2007. Effect of garlic and garlic extracts on
rumen archaea. Proceedings of the 5th International Symposium on Anaerobic
Microbiology, Domzale, Slovenija, 16. The Federation of European
Microbiological Societies.
Flachowsky, G., P. Lebzien. 2009. Comments on in-vitro studies with methane
inhibitors. Anim. Feed Sci. Technol. 151: 337-39.
Forster, P., V. Ramaswamy, P. Artaxo, T. Berntsen, R. Betts, D. W. Fahey, J.
Haywood, J. Lean, D. C. Lowe, G. Myhre, J. Nganga, R. Prinn, G. Raga, M.
Schulz and R. Van Dorland. 2007: Changes in Atmospheric Constituents and in
Radiative Forcing. In: Climate Change 2007: The Physical Science Basis.
Contribution of Working Group I to the Fourth Assessment Report of the
Intergovernmental Panel on Climate Change [Solomon, S., D. Qin, M.
Manning, Z. Chen, M. Marquis, K. B. Averyt, M. Tignor and H. L. Miller
(eds.)]. Cambridge University Press, Cambridge, United Kingdom and New
York, USA.
Frankenfield, D. C. 2010. On heat, respiration and calorimetry. Nutrition 26: 939-50.
Fredeen, A. H., S. Cooper, M. Tate, M. Main, M. and J. Yuill. 2004. Comparison of
whole body and breath- sampling methods of measuring methane emission in
dairy cows. Can. J. Anim. Sci. 84: 774.

109
Fukui, Y., Y. Yamamoto and K. Matsubara. 1980. Reduction with the lapse of time of
methemoglobin in blood sample. Jpn. J. Legal Med. 31:536-68.
García-González R., S. López, M. Fernández and J. S. González 2006. Effects of the
addition of some medicinal plants on methane production in a rumen simulating
fermenter (RUSITEC). Int. Congr. Ser. 1293: 172–175.
Garcia-Gonzalez, R., S. Lopez, M. Fernandez, R. Bodas, and J. S. Gonzalez. 2008.
Screening the activity of plants and spices for decreasing ruminal methane
production in-vitro. Anim. Feed Sci. Technol. 147:36-52.
Garcia-Martinez, R., M. J. Ranilla, M. L. Tejido, and M. D. Carro. 2005. Effects of
disodium fumarate on in-vitro rumen microbial growth, methane production and
fermentation of diets differing in their forage:concentrate ratio. Br. J. Nutr.
94:71-77.
Gasmet: http://www.gasmet.fi/products/ftir_gas_analyzers/on - site (portable) /
gasmet_ dx4030.
Gebhardt, R. and H. Beck. 1996. Differential inhibitory effects of garlic-derived
organosulfur compounds on cholesterol biosynthesis in primary rat hepatocyte
cultures. Lipids. 31:1269-1276.
Goel, G., K. Arvidsson, B. Vlaeminck, G. Bruggeman, K. Deschepper, and V. Fievez.
2009. Effects of capric acid on rumen methanogenesis and biohydrogenation of
linoleic and α-linolenic acid. Animal. 3:810-816.
Grainger C., R. Williams, T. Clarke, A.D.G.Wright, and R. J. Eckard. 2010.
Supplementation with whole cottonseed causes long-term reduction of methane
emissions from lactating dairy cows offered a forage and cereal grain diet. J.
Dairy Sci. 93: 2612–2619.
Grainger, C. and K. A. Beauchemin 2011. ‘Can enteric methane emissions from
ruminants be lowered without lowering their production’. Anim. Feed Sci.
Technol. 166–167: 308–320.
Grainger, C., T. Clarke, S. M. Mcginn, M. J. Auldist, K. A. Beauchemin, M. C.
Hannah, G. C. Waghorn, H. Clark and R. J. Eckard. 2007. Methane emissions

110
from dairy cows measured using sulfur hexafluoride (SF6) and chamber
techniques. J. Dairy Sci. 90: 2755–2766.
Grainger, C., T. Clarke, M. J. Auldist, K.A. Beauchemin, S.M. McGinn, G. C.
Waghorn and R. J. Eckard. 2009. Mitigation of greenhouse gas emissions from
dairy cows fed pasture and grain through supplementation with Acacia mearnsii
tannins. Can. J. Anim. Sci. 89 (2) 241–251. doi:10.4141/ CJAS08110.
Guan, H., K. M. Wittenberg, K. H. Ominski and D. O. Krause. 2006. Efficacy of
ionophores in cattle diets for mitigation of enteric methane. J. Anim. Sci. 84:
1896-1906.
Guangming, J., G. Oriol, R.S. Keshab and Y. Zhiguo. 2010. Effects of nitrite
concentration and exposure time on sulfide and methane production in sewer
systems . Journal of waters. 44: 4241-4251.
Guo, W. S., D. M. Schaefer, X. X. Guo, L. P. Ren and Q. X. Meng. 2009. Use of
nitrate-nitrogen as a sole dietary nitrogen source to inhibit ruminant
methanogenesis and improve microbial nitrogen synthesis In-vitro, Asian
Australas. J. Anim. Sci. 22: 542-549.
Haisan, J., Y. Sun, K. Beauchemin, L. Guan, S. Duval, D. R. Barreda, and M. Oba.
2013. Effect of feeding 3-nitrooxypropanol on methane emissions and
productivity of lactating dairy cows. Adv. Anim. Biosci. 4(2):260.
Hakata, M., M. Takahashi, W. Zumft, A. Sakamoto, H. Morikawa. 2003. Conversion
of the nitrate nitrogen and nitrogen dioxide to nitrous oxides in plants. Acta
Biotechnologica. 23 (2-3): 249-257.
Hao, T. P., D. H. Quang, T.R. Preston and R. A. Leng. 2009. Nitrate as a fermentable
nitrogen supplement for goats fed forage based diets low in true protein. Livest
Res Rural Dev. 21 (10). http://www.lrrd.org/lrrd21/1/trin21010.htm
Harper, L. A., O.T. Denmead, J. R. Freney and F. M. Byers. 1999. Direct measurement
of methane emissions from grazing and feedlot cattle. J. Anim. Sci. 77: 1392-
1401.

111
Hegarty, R. S. 2001. Strategies for mitigating methane emissions from livestock-
Australian options and opportunities. In: Proceedings of Ist International
Conference on Greenhouse Gases and Animal Agriculture. Obihiro, Hokkaido,
Japan. pp 31-34.
Hegarty, R. S., J. P. Goopy, R. M. Herd and B. McCorkell. 2007. Cattle selected for
lower residual feed intake have reduced daily methane production. J.
Anim. Sci. 85: 1479-86.
Hegarty, J. and J. Nolan. 2007. Estimation of ruminal methane production from
measurement of volatile fatty acid production. In: Measuring Methane
Production from Ruminants. (eds. H. P. S. Makkar and P. E. Vercoe)
Springer, Dordrecht, the Netherlands. pp 15-13.
Hegarty, J., R. A. Leng and J. Nolan. 2007. Measurement of methane production rate
in the rumen using isotopic tracers. In: Measuring Methane Production
from Ruminants. (eds. H. P. S. Makkar and P. E. Vercoe) Springer,
Dordrecht, the Netherlands.
Hegarty, R. S. 1999. Reducing rumen methane emissions through elimination of rumen
protozoa. Aust. J. Agric. Res. 50: 1321-1328.
Henning, P. H., C. H. Horn, K. J. Leeuw, H. H. Meissner, and F. M. Hagg. 2010.
Effect of ruminal administration of the lactateutilizing strain Megasphaera
elsdenii (Me) NCIMB 41125 on abrupt or gradual transition from forage to
concentrate diets. Anim. Feed Sci. Technol. 157:20–29.
Hino, T., K. Takeshi, and M. Kanda. 1993. Effect of aibellin, a novel peptide antibiotic
on rumen fermentation in-vitro. J. Dairy Sci. 76: 2213-2221, 14.
Hironaka, R., G. W. Mathison, B. K. Kerrigan, and I. Vlach. 1996. The effect of
pelleting of alfalfa hay on methane production and digestibility by steers. Sci.
Total Environ. 180:221–227.
Hoffmann, I. 2008. Livestock Genetic Diversity and Climate Change Adaptation.
Livestock and Global Change conference proceeding. May 2008, Tunisia.
http://www.fao.org/docrep/018/i3461e/i3461e.pdf

112
Hollmann, M., and D. K. Beede. 2012. Comparison of effects of dietary coconut oil
and animal fat blend on lactational performance of Holstein cows fed a high
starch diet. J. Dairy Sci. 95:1484–1499.
Holter, J. B., H. H. Hayes, W. E. Urban, and A. H. Duthie. 1992. Energy balance and
lactation response in Holstein cows supplemented with cottonseed with or
without calcium soap. J. Dairy Sci. 75:1480–1494.
Holter, J. B., J. A. Bullis, and H. H. Hayes. 1986. Predicting maternal protein and fat
balances of growing and mature dry cows. J. Dairy Sci. 69:2622–2635.
Holter, J. B., M. J. Slotnick, H. H. Hayes, and C. K. Bozak. 1990. Effect of prepartum
dietary energy on condition score, postpartum energy, nitrogen partitions, and
lactation production responses. J. Dairy Sci. 73:3501–3511.
Hristov, A. N., C. Lee, T. Cassidy, M. Long, K. Heyler, B. Corl, and R. Forster. 2011.
Effects of lauric and myristic acids on ruminal fermentation, production, and
milk fatty acid composition in lactating dairy cows. J. Dairy Sci. 94:382–395.
Hristov, A. N., J. Oh, J. Firkins, J. Dijkstra, E. Kebreab, G. Waghorn, A. Adesogan, W.
Yang, J. Tricarico, C. Lee, P. J. Gerber, B. Henderson, and H. P. S. Makkar.
2013. Mitigation of methane and nitrous oxide emissions from animal
operations: I. A review of enteric methane mitigation options. J. Anim. Sci.
91:5045–5069.
Hristov, A. N., K. L. Grandeen, J. K. Ropp, and M. A. McGuire. 2004. Effect of
sodium laurate on ruminal fermentation and utilization of ruminal ammonia
nitrogen for milk protein synthesis in dairy cows. J. Dairy Sci. 87:1820–1831.
Hristov, A. N., M. Vander Pol, M. Agle, S. Zaman, C. Schneider, P. Ndegwa, V. K.
Vaddella, K. Johnson, K. J. Shingfield, and S. K. R. Karnati. 2009. Effect of
lauric acid and coconut oil on ruminal fermentation, digestion, ammonia losses
from manure, and milk fatty acid composition in lactating cows. J. Dairy Sci.
92:5561–5582.
Hulshof, R. B. A. A., J. J. Berndt, A. Demarchi, W. J. J. Gerrits and H. B. Perdok.
2010. Dietary nitrate supplementation reduces methane emission in beef cattle

113
fed sugarcane-based diets. Greenhouse gas conference Banff Canada, pp 81.
http://www.ggaa2010.org/pdfs/proceedings_abstracts.pdf
Hungate, R. E .1965. The rumen and its microbes. Academic Press, New York.
Immig, I. 1996. The rumen and hindgut as source of ruminant methanogenesis.
Environ. Monit. Assess. 42: 57-72.
IPCC (Intergovernmental Panel on Climate Change) 1997. IPCC Guidelines for
national greenhouse gas inventories. Vol. 3. Chapter 4. In: Houghton, J. T.;
Meira Filho, L. G.; Lim, B.; Tréanton, K.; Mamatry, I.; Bonduki, Y.; Griggs, D.
J.; Callender, B. A. ed. IPCC, Bracknell, United Kingdom.
IPCC (Intergovernmental Panel on Climate Change) 2007. United Nations
Environment Programme. Assessment Report 4: Contribution of Working
Groups I, II and III to the Fourth Assessment Report of the
Intergovernmental Panel on Climate Change. Geneva.
IPCC (Intergovernmental Panel on Climate Change). 2001. United Nations
Environment Programme. Assessment Report 3: Contribution of Working
Groups I to the Third Assessment Report of the Intergovernmental Panel
on Climate Change. Geneva.
Isa, Z., S. Grusenmeyer, and W. Verstraete. 1986. Sulphate reduction relative to
methane production in high-rate anaerobic digestion: Microbiological aspects.
Appl. Environ. Microbiol. 51:580-87.
Isani, G. B. and M. N. Baloch. 1986. Sheep and Goat Breeds of Pakistan. Press
Corporation of Pakistan, Karachi.
Itabashi, H., Y. Washio, A. Takenaka, S. Oda and J. Ishibashi. 1994. Effects of a
controlled fauna on methanogenesis, fibre digestion and rate of growth in
calves. Proc. Soc. Nutr. Physiol. 3: 179-184.
Jeong, O. K., Y. H. Kim, S. H. Yeom, B. K. Song and I. H. Kim. 2005. Enhancing
continuous hydrogen gas production by the addition of nitrate into an anaerobic
reactor. Process biochemistry 41: 1208-1221.

114
Joblin, K. N., 1999. Ruminal acetogens and their potential to lower ruminant methane
emmisions. Aust. J. Agric. Res. 50: 1307-1313.
Johnson D. E., T. M. Hill, G. M. Ward, K. A. Johnson, M. E. Branine, B. R. Carmean
and D. W. Lodman. 1993. Ruminants and other animals. In ‘Atmospheric
methane: sources, sinks and role in global change’. (Ed. MAK Khalil) pp. 219–
229. NATO ASI Series 1: Global Environmental Change, Vol. 13. (Springer-
Verlag: Berlin)
Johnson, D. E., C. L. Ferrell and T. G. Jenkins. 2003. The history of energetic
efficiency research: Where have we been and where are we going? J. Anim. Sci.
81: 27-38.
Johnson, D. E., G. M. Ward and J. Torrent. 1992. The environmental impact of bovine
somatotropin use in dairy cattle. J. Environ. Qual. 21: 157–162.
Johnson, D. E., G. M. Ward, and J. Torrent, 1991: The environmental impact of bovine
somatotropin (bST) use in dairy cattle. J. Dairy Sci., 74S, 209 pp
Johnson, D. E., T. M. Hill, B. R. Carmean, D. W. Lodman and G. M. Ward. 1991. New
perspectives on ruminant methane emissons. In:Wenk, C. and Bessinger,M.
(Eds.) Energy Metabolism of Farm Animals. ETH, Zurich, Switzerland.
Johnson, K. A. and D. E. Johnson. 1995. Methane emissions from cattle. J. Anim. Sci.
73: 2483–2492.
Johnson, K., M. Huyler, H. Westberg, B. Lamb and P. Zimmerman. 1994.
Measurement of methane emissions from ruminant livestock using a SF6 tracer
technique. Environ. Sci. Technol. 28: 359–362.
Jordan, E., D. K. Lovett, F. J. Monahan, J. Callan, B. Flynn and F. P. O’Mara. 2006b.
Effect of refined coconut oil or copra meal on methane output and on intake and
performance of beef heifers. J Anim Sci. 84: 162-170.
Jordan, E., D. K. Lovett, M. Hawkins, J. J. Callan and F. P. O’Mara. 2006a. The effect
of varying levels of coconut oil on intake, digestibility and methane output from
continental cross beef heifers. Anim. Sci. 82: 859-865.

115
Kebreab E, J. France and B.W. McBride. 2007. Long-term effects of feeding monensin
on methane production in lactating dairy cows. J. Dairy Sci.. 90: 1781–1788.
Kebreab, E. and J. France 2001. A mechanistic model of whole tract digestion and
methanogenesis in the lactating dairy cow: model development, evaluation and
application. J. Anim. Sci. 79: 1584–1597.
Khalil, M. A. K., R. A. Rasmussen, J. A. Culbertson, J. M. Prins, E. P. Grimsrud, M. J.
Shearer. 2003. Atmospheric perfluorocarbons. Environ. Sci. Technol. 37: 4358-
4361.
Khan, B. B., M. Younas, M. Riaz and M. Yaqoob. 2005. Breeds of Livestock in
Pakistan, University of Agriculture, Faisalabad.
Khan, M. S., M. A. Khan and S. Mahmood. 2008. Genetic resources and diversity in
Pakistani goats. Int. J. Agri. Biol. 10:227-231.
Khanum, S., M. Nisa, M. Mushtaq, M. Sarwar and M. Hassan. 2007. Influence of
replacement of concentrate with enzose (corn dextrose) and corn steep liquor on
nutrient intake in Nili Ravi buffalo bulls. Italian J. Anim. Sci. 6:567-570.
Kirchgessner; W. Windisch and H. L. Müller. 1994. Nutritional Factors for the
Quantification of Methane Production. In: Proceedings of the 8th International
Symposium on Ruminant Physiology, Willingen, Hesse, Germany, 25-30 pp.
333–48.
Kirschbaum, M. U. F., D. Bruhn, D. M. Etherridge, J. R. Evans, G. D. Farquhar, R. M.
Gifford, K. I. Paul, A. J. Winters. 2006. A comment on the quantitative
significance of aerobic methane release by plants. Functional Plant Biology 33:
521-530.
Klieve, A. V. and R. S. Hegarty. 1999. Opportunities for biological control of
methanogenesis. Aust. J. Agric. Res. 50: 1315-19.
Klieve, A. V., D. Hennessy, D. Ouwerkerk, R. J. Forster, R. I. Mackie, and G. T.
Attwood. 2003. Establishing populations of Megasphaera elsdenii YE 34 and
Butyrivibrio fibrisolvens YE 44 in the rumen of cattle fed high grain diets. J.
Appl. Microbiol. 95:621–630.

116
Klopfenstein, T. J., L. Roth, S. Fernandez-Rivera and M. Lewis. 1987. Corn residues in
beef production systems. J. Anim. Sci. 65:1139-1148.
Kluber, H. and R. Conrad. 1998. Inhibitory effects of nitrate, nitrite, NO and N2O on
methanogens is by Methanosarcina barkeri and Methanobacterium bryantii.
FEMS Microbiology Ecology 25: 331-339.
Knight, T., R. S. Ronimus, D. Dey, C. Tootill, G. Naylor, P. Evans, G. Molano, A.
Smith, M. Tavendale, C. S. Pinares-Patino, and H. Clark. 2011. Chloroform
decreases rumen methanogenesis and methanogen populations without altering
rumen function in cattle. Anim. Feed Sci. Technol. 166:101–112.
Kolver, A. S. and P. W. Aspin. 2006. Supplemental fumarate did not influence
milksolids or methane production from dairy cows fed high quality pasture.
Proc. N. Z. Soc. Anim. Prod. 66: 409-415.
Kolver, E. S., P. W. Aspin, G. N. Jarvis, K. M. Elborough and J. R. Roche. 2004.
Fumarate reduces methane production fro pasture fermented in continuous
culture. Proc. N. Z. Soc. Anim. Prod. 64: 155-159.
Leng, R. A. 1990. Factors affecting the utilization of ‘poor quality’ forages by
ruminants particularly under tropical conditions. Nutrition Research Reviews 3:
277-303.
Leng, R. A. and T. R. Preston. 2010. Further considerations of the potential of nitrate
as a high affinity electron acceptor to lower enteric methane production in
ruminants. Livest Res Rural Dev. 22 (12).
http://www.lrrd.org/lrrd22/12/leng22221.htm
Leng, R. A., 2008. The potential of feeding nitrate to reduce enteric methane
production in ruminants. A Report: The Department of Climate Change,
Commonwealth Government of Australia, Canberra ACT, Australia.
Leng, R. A., 1991: Improving Ruminant Production and Reducing Methane Emissions
from Ruminants by Strategic Supplementation. EPA Report no. 400/1-91/004,
Environmental Protection Agency, Washington, D.C.

117
Lewis, D. 1951. The metabolism of nitrate and nitrite by the sheep. 1. Reduction of
nitrate in the rumen of the sheep. Biochem J. 48: 175-79.
Lila, Z. A., N. Mohammed, S. Kanda, T. Kamada, and H. Itabashi. 2003. Effect of
sarsaponin on ruminal fermentation with particular reference to methane
production in-vitro. J Dairy Sci 86:3330-3336.
Lila, Z. A., N. Mohammed, N. Tatsuoka, S. Kanda, Y. Kurokawa, and H. Itabashi.
2004. Effect of cyclodextrin diallyl maleate on methane production, ruminal
fermentation and microbes in-vitro and in-vivo. Anim. Sci. J. 75:15–22.
Lindley, A. and A. McCulloch. 2005. Regulating to reduce emissions of fluorinated
greenhouse gases, J. Fluorine Chem. 126 (11-12):1457-1462.
Lopez, S., C. Valdes, C.J. Newbold and R.J. Wallace. 1999. Influence of sodium
fumarate on rumen fermentation in-vitro. Br. J. Nutr. 81: 59-64.
Lovett, D. K. and F. P. O'Mara. 2002. Estimation of enteric methane emissions
originating from the national livestock beef herd: a review of IPCC default
emission factors. Tearmann 2: 77-83.
Lovett, D. K., A. Bortolozzo, P. Conaghan, P. O. O’Kiely and F. P. O’Mara. 2004. In-
vitro total and methane gas production as influenced by rate of nitrogen
application, season of harvest and perennial rye grass cultivar. In Grass and
Forage Science. 59: 227-232.
Lovett, D. K., L. Stack, S. Lovell, J. Callan, B. Flynn, M. Hawkins, and F. P. O’Mara.
2006. Effect of feeding yucca schidigera extract on performance of lactating
dairy cows and ruminal fermentation parameters in steers. Livest. Sci. 102:23-
32.
Lovett, D., S. Lovell, L. Stack, J. Callan, M. Finlay, J. Conolly, F. P. O’Mara. 2003.
Effect of forage/concentrate ratio and dietary coconut oil level on methane
output and performance of finishing beef heifers. Livest. Prod. Sci. 84,:135-146.
Lowe, D. C. 2006. A green source of surprise. Nature 439: 148-149.
Machmuller, A. 2006. Medium-chain fatty acids and their potential to reduce
methanogenesis in domestic ruminants. Agric. Ecosyst. Environ. 112: 107-114.

118
Machmüller, A., and M. Kreuzer. 1999. Methane suppression by coconut oil and
associated effects on nutrient and energy balance in sheep. Can. J. Anim. Sci.
79:65–72.
Madsen, J., B. S. Bjerg, T. M. Hvelplund, R. Weisbjerg and P. Lund. 2010. Methane
and carbon dioxide ratio in excreted air for quantification of the methane
production from ruminants. Livest. Sci. 129: 223-227.
Marais, J. P., J. J. Therion, R. I. Mackie, A. Kistner and C. Dennison. 1988. Effect of
nitrate and its reduction products on the growth and activity of the rumen
microbial population. Br. J. Nutr. 59:301-13.
Martin, C., M. Doreau and D.P. Morgavi. 2008. Methane mitigation in ruminants: from
rumen microbes to the animal. Proceedings of Livestock & Global Climate
Change Conference. Hammamet. Tunisia
Martin, S. A., D. J Nisbet and R. G. Dean 1989. Influence of a commercial yeast
supplement on the in-vitro ruminal fermentation. Nutr. Rep. Int. 40: 395.
Martinez-Fernandez, G., A. Arco, L. Abecia, G. Cantalapiedra-Hijar, E. Molina-
Alcaide, A. I. Martin-Garcia, M. Kindermann, S. Duval, and D. R. Yanez-Ruiz.
2013. The addition of ethyl-3-nitrooxy propionate and 3-nitrooxypropanol in
the diet of sheep sustainably reduces methane emissions and the effect persists
over a month. Adv. Anim. Biosci. 4(part 2):368.
Mathison, G. W., E. K. Okine, T. A. McAllister, Y. Dong, J. Galbraith and O. I. N.
Dmytruk. 1998. Reducing methane emissions from ruminant animals. J. Appl.
Anim Res. 14: 1–28.
McAllister, T. A. and C. J. Newbold. 2008. Redirecting rumen fermentation to reduce
methanogenesis. Aust. J. Exp. Agr. 48: 7–13.
McCaughey, W. P., K. Wittenberg and D. Corrigan. 1997. Methane production by
steers on pasture. Can. J. Anim. Sci.77: 519–524.
McCaughey, W. P., K. Wittenberg, and D. Corrigan. 1999. Impact of pasture type on
methane production by lactating beef cows. Can. J. Anim. Sci. 79:221–226.

119
McCourt, A. R. Y. T., S. Mayne, and R. J. Wallace. 2008. Effect of dietary inclusion of
encapsulated fumaric acid on methane production from grazing dairy cows.
Page 64 in Proc. Br. Soc. Anim. Sci. British Society of Animal Science,
Scarborough, UK.
McCrabb, G. J. and R. A. Hunter. 1999. Prediction of methane emissions fom beef
cattle in tropical production systems, Aust. J. Agric. Res. 50: 1335-1339.
McCrabb, G. J., K. T. Berger, T. Magner, C. May and R. A. Hunter. 1997. Inhibiting
methane production in brahman cattle by dietary supplementation with a novel
compound and the effects on growth. Aust. J. Agric. Res. 48: 323-329.
McGinn, S. M., K. A. Beauchemin, T. Coates and D. Colombatto 2004. Methane
emissions from beef cattle: effects of monensin, sunflower oil, enzymes, yeast
and fumaric acid. J. Anim. Sci. 82: 3346–3356.
Miller, T. L. and M. J. Wolin. 2001. Inhibition of growth of methane-producing
bacteria of the ruminant fore stomach by hydroxyl methyl glutary-simscoa
reductase inhibitors. J. Dairy Sci. 84:1445-1448.
Min, B. R., T. N. Barry, G. T. Attwood, W. C. McNabb. 2003. The effect of condensed
tannins on the nutrition and health of ruminants fed fresh temperate forages: a
review. Anim. Feed Sci. technol. 106: 3–19.doi:10.1016/S0377-8401
(03)00041-5.
Mitsumori, M., T. Shinkai, A. Takenaka, O. Enishi, K. Higuchi, Y. Kobayashi, I.
Nonaka, N. Asanuma, S. E. Denman, and C. S. McSweeney. 2011. Responses
in digestion, rumen fermentation and microbial populations to inhibition of
methane formation by a halogenated methane analogue. Br. J. Nutr. 8:1–10.
Moe, P. W., and H. F. Tyrrell. 1977. Effects of feed intake and physical form on
energy value of corn in timothy hay diets for lactating cows. J. Dairy Sci.
60:752–758.
Moe, P. W., and H. F. Tyrrell. 1979a. Effect of endosperm type on incremental energy
value of corn grain for dairy cows. J. Dairy Sci. 62:447–454.

120
Moe, P. W., and H. F. Tyrrell. 1979b. Methane production in dairy cows. J. Dairy Sci.
62:1583–1586.
Moe, P. W., H. F. Tyrrell, and N. W. Hooven. 1973a. Energy balance measurements
with corn meal and ground oats for lactating cows. J. Dairy Sci. 56:1149–1153.
Moe, P. W., H. F. Tyrrell, and N. W. Hooven. 1973b. Physical form and energy value
of corn grain. J. Dairy Sci. 56:1298–130
Mohanakrishnan, J., O. Gutierrez, R. L. Meyer and Z. Yuan. 2008. Nitrate effectively
inhibits sulfide and methane production in a laboratory scale sewer reactor.
Journal of waters. 42: 3961-3971.
Monteny, G. J., A. Bannink, D. Chadwick. 2006. Greenhouse gas abatement strategies
for animal husbandry. Agric. Ecosyst. Environ. 112: 163-170.
Morgavi, D. P., E. Forano, C. Martin and C. J. Newbold. 2010. Microbial ecosystem
and methanogenesis in ruminants. Animal 4(7): 1024–1036.
Moss, A. R., J. P. Jouany and C. J. Newbold. 2000. Methane production by ruminants:
its contribution to global warming. Ann. Zootech. 49: 231-53.
Murray, P., D. C. Chadwick, C. J. Newbold and D. R. Lockyer. 2007. Measurement of
methane from grazing animals - the tunnel method. In: Measuring Methane
Production from Ruminants.(eds. H. P. S. Makkar and P. E. Vercoe) Springer,
Dordrecht, The Netherlands.
Mutsvangwa, T., I. E. Edwards, J. H. Topps and G. F. M. Paterson. 1992. The effects
of dietary inclusion of yeast culture (Yea-Sacc) on patterns of rumen
fermentation, food intake and growth of intensive fed bulls. Anim. Prod. 55:
35–40.
Navarro-Villa, A., M. O’Brien, S. Lopez, T.M. Boland and P. O’Kiely. 2011.
Modifications of a gas production technique for assessing in-vitro rumen
methane production from feedstuffs. Anim. Feed Sci. Technol. 166–167: 163-
174.

121
Nevison, C. D., and E. A. Holland. 1997. A re-examination of the impact of
anthropogenetically fixed nitrogen on the atmospheric N2O and the
stratospheric O3 layer. J. Geophys. Res. 102: 25519-25536.
Newbold C. J., B. Lassalas and J. P. Jouany 1995. Theimportance of methanogenesis
associated with ciliate protozoa in ruminal methane production in-vitro. Lett.
Appl. microbiol. 21: 230–234. doi:10.1111/j.1472- 765X.1995.tb01048.x
Newbold, C. J. and L. M. Rode. 2006. Dietary additives to control methanogenesis in
the rumen. The 2nd International Conference on Greenhouse Gases and Animal
Agriculture GGAA2005-Working papers. pp. 60-70.
Newbold, C. J., B. Lassalas, and J. P. Jouany. 1995. The importance of methanogens
associated with ciliate protozoa in ruminal methane production in-vitro. Lett.
Appl. Microbiol. 21:230-234.
Newbold, C. J., R. J. Wallace and F. M. McIntosh, 1996. Mode of action of the yeast
Sacchararomyces cerevisiae as a feed additive for ruminants. Br. J. Nutr.76:
249–261.
Newbold, C.J., S. López, N. Nelson, J.O. Ouda, R.J. Wallace and A.R. Moss 2005.
Propionate precursors and other metabolic intermediates as possible alternative
electron acceptors to methanogenesis in ruminal fermentation in-vitro. Br. J.
Nutr. 94: 27–35.
Ngoc Huyen L.T., H.Q. Do, T.R. Preston and R.A. Leng. 2010. Nitrate as fermentable
nitrogen supplemented to reduce rumen methane production. Livest Res Rural
Dev. Volume 22, Article #146. http://www.lrrd.org/lrrd22/8/huye22146.htm
Nguyen Ngoc Anh, Khuc Thi Hue, Duong Nguyen Khang and T.R. Preston. 2010.
Effect of calcium nitrate as NPN source on growth performance and methane
emissions of goats fed sugarcane supplemented with cassava foliage.
Proceedings MEKARN Conference 2010 Livestock production, climate change
and resource depletion.
http://www.mekarn.org/workshops/pakse/abstracts/anh_grrc.htm
Nisa, M., M. Sarwar and M. A. Khan. 2004. Influence of ad libitum feeding of urea
treated wheat straw with or without corn steep liquor on intake, in situ digestion
122
kinetics, nitrogen metabolism and nutrient digestion in Nili-Ravi buffalo bulls.
Aust. J. Agric. Res. 55: 235-239.
Nolan, J. V., R. S. Hegarty, J. Hegarty, I. R. Godwin and R. Woodgate. 2010. Effects
of dietary nitrate on fermentation, methane production and digesta kinetics in
sheep. Anim. Prod. 50: 801-806.
Nollet, L., D. Demeyer, W. Verstraete. 1997. Effect of 2-Bromoethanesulfonic acid
and Peptostreptococcus products ATCC 35244 addition on stimulation of
reductive acetogenesis in ruminal ecosystem by selective inhibition of
methanogenesis. Appl. Environ. Microbiol. 63: 194-200.
O’Hara, P. J. and A. J. Fraser. 1975. Nitrate poisoning in cattle grazing crops. N. Z.
Vet. J. 23:45-53.
O’Mara, F. P. 2004. Greenhouse gas production from dairying: Reducing methane
production. Advances in Dairy Technology 16: 295-309.
O’Mara, F. P. 2010. The significance of livestock as a contributor to global greenhouse
gas emissions today and in the near future. Proceedings of Greenhouse Gases
and Animals Agriculture Conference. Canada.
O’Mara, F. P. 2011. The significance of livestock as a contributor to global greenhouse
gas emissions today and in the near future. Anim. Feed Sci. Technol. 166-67:
7-15.
Odongo, N. E., R. Bagg, G. Vessie, P. Dick, M. M. Or-Rashid, S. E. Hook, J. T. Gray,
E. Kebreab, J. France and B. W. McBride. 2007. Long-term effects of feeding
monensin on methane production in lactating dairy cows. J. Dairy Sci. 90:
1781-88.
Okine, E. K., G. W. Mathison, and R. T. Hardin. 1989. Effects of changes in frequency
of reticular contractions on fluid and particulate passage rates in cattle. J. Anim.
Sci. 67:3388–3396.
Park, M. O., H. Ikenaga, and K. Watanabe. 2007. Phage diversity in a methanogenic
digester. Microbial Ecology 53: 98–103.

123
Pellikaan, W. F., W. H. Hendriks, G. Uwimana, L. J. G. M. Bongers, P. M. Becker and
J.W. Cone. 2011. A novel method to determine simultaneously methane
production during in-vitro gas production using fully automated equipment.
Anim. Feed Sci. Technol. 168: 196-205.
Perdok, H. and C.J. Newbold 2010. Reducing the carbon footprint of beef production,
part 2. Provimi Research and Innovation Centre, Brussels. Belgium.
Phuong, L. T. B., D. N. Khang and T. R. Preston. 2012. Effect of NPN source, level of
added sulphur and source of cassava leaves on growth performance and
methane emissions in cattle fed a basal diet of molasses. Livest Res Rural Dev.
Volume 24, Article #70. http://www.lrrd.org/lrrd24/4/phuong24070.htm
Pinares-Patino, C. S. and H. Clark. 2008. Reliability of the sulfur hexafluoride tracer
technique for methane emission measurement from individual animals: An
overview. Aust. J. Exp. Agric. 48: 223–29.
Pinares-Patino, C. S., K. R. Lassey, R. J. Martin, G. Molano, M. Fernandez, S.
MacLean, E. Sandoval, D. Luo and H. Clark. 2011. Assessment of the sulphur
hexafluoride (SF6) tracer technique using respiration chambers for estimation of
methane emissions from sheep. Anim. Feed Sci. Technol. 166–167: 201–209.
Prins, R., C. Van Nevel, and D. Demeyer. 1972. Pure culture studies of inhibitors for
methanogenic bacteria. Antonie Leeuwenhoek 38:281-287.
Rafiq, M., S. Mumtaz, N. Akhtara and M. F. Khana. 2007. Effect of strategic
supplementation with multi-nutrient urea molasses blocks on body weight and
body condition score of Lohi sheep owned by tenants of Pakistan Small Rumin.
Res. 70: 200-208.
Ranilla, M. J., D. P. Morgavi and J. P. Jouany 2003. Effect of time after defaunation on
methane production in-vitro. Reprod. Nutr. Dev. 44 (Suppemenntl 1), 60.
Reynolds, C. K., and H. F. Tyrrell. 2000. Energy metabolism in lactating beef heifers.
J. Anim. Sci. 78:2696–2705.
Reynolds, C. K., H. F. Tyrrell, and P. J. Reynolds. 1991. Effects of diet forage-to-
concentrate ratio and intake on energy metabolism in growing beef heifers:

124
Whole body energy and nitrogen balance and visceral heat production. J. Nutr.
121:994–1003.
Ruhr, L. P. and G. D. Osweiler. 1986. Nitrate Accumulators. In: Current Veterinary
Therapy Food Animal Practice. J. L. Howard (ed) W. B. Saunders Co,
Philedelphia.
Rymer, C., J. A. Huntington, B. A. Williams and D. I. Givens. 2005. In-vitro
cumulative gas production techniques: History, methodological considerations
and challenges. Anim. Feed Sci. Technol. 123–124: 9-30.
Sangkhom, I., T. R. Preston and R. A. Leng, 2011. Mitigating methane production
from ruminants; effect of calcium nitrate as modifier of the fermentation in
an in vitro incubation using cassava root as the energy source and leaves of
cassava or Mimosa pigra as source of protein. Livest Res Rural Dev. Volume
23, Article #21. http://www.lrrd.org/lrrd23/2/sang23021.htm
Sangkhom, I., T. R. Preston, D. N. Khang and R. A. Leng. 2012. Effect of potassium
nitrate and urea as fermentable nitrogen sources on growth performance and
methane emissions in local “Yellow” cattle fed lime (Ca (OH) 2) treated rice
straw supplemented with fresh cassava foliage. Livest Res Rural Dev. Volume
24, Article #27. http://www.lrrd.org/lrrd24/2/sang24027.htm
Sar, C., B. Mwenya, B. Pen, K. Takaura, R. Morikawa, A. Tsujimoto, N. Isogai, Y.
Asakura, I. Shinzato, Y. Toride and J. Takahashi. 2006. Effect of wild type
Escherichia coli W3110 or Escherichia coli nir-Ptac on methane emission and
nitrate toxicity in nitrate-treated sheep. In “Greenhouse Gases and Animal
Agriculture: An Update”. Proceedings of the 2nd International Conference on
Greenhouse Gases and Animal Agriculture, Zurich, Switzerland 20-24
September 2005, International Congress Series 1293:193-96.
Sar, C., B. Santoso, B. Mwenya, Y. Gamo, T. Kobayashi, R. Morikawa, K.
Kimura, H. Mizukoshi and J. Takahashi. 2004. Manipulation of rumen
methanogenesis by the combination of nitrate with β-1-4 galacto-
oligosaccharides or nisin in sheep. Anim. Feed Sci. Technol. 115:129-42.

125
Sarwar, M., M. A. Khan and Z. Iqbal. 2002. Feed resources for livestock in Pakistan.
Status Paper. Int. J. Agric. Biol. 4:186-192.
Sauer, F. D., V. Fellner, R. Kinsman, J. K. G. Kramer, H. A. Jackson, A. J. Lee and S.
Chen 1998. Methane output and lactation response in Holstein cattle with
monensin or unsaturated fat added to the diet. J. Anim. Sci. 76: 906–914.
Sauvant, D. 1993. La production de methane dans la biosphere: Le role des animaux
d’elevage. Courrier de la Cellule Environnement 18: 67-70.
Schmidely, P., 1993: Quantitative review on the use of anabolic hormones in ruminants
for meat production. I. Animal performance.Annales de Zootechie, 42, pp. 333-
359.
Setchell, B. R. and A. J. Williams. 1962. Plasma nitrate and nitrite concentrations in
chronic and acute nitrate poisoning in sheep. Aust. Vet. J. 38:58-62.
Shahzad, M. A., M. Sarwar, M. Nisa and M. Sharif. 2010. Corn steep liquor: A
potential substitute of urea for growing lambs. Egyptian J. Sheep & Goat Sci.
5:177-190.
Shahzad, M. A., M. Sarwar, M. Nisa, A. Iqbal and M. Riaz. 2009. Feed consumption
and weight gain of growing buffalo calves as influenced by feeding fermentable
energy source in corncobs based diet. Pak. J. Zool. 9:707-710.
Shima, S., E. Warkentin, R. K. Thauer and U. Ermler. 2002. Structure and function of
enzymes involved in the methanogenic pathway utilizing carbon dioxide and
molecular hydrogen. J. Biosci. Bioeng. 93:519-530.
Silivong, P., T. R. Preston and R. A. Leng. 2011. Effect of sulphur and calcium nitrate
on methane production by goats fed a basal diet of molasses supplemented with
Mimosa (Mimosa pigra) foliage. Livest Res Rural Dev. Volume 23, Article
#58. http://www.lrrd.org/lrrd23/3/sili23058.htm
Simon, J. 2002. Enzymology and bioenergetics of respiratory nitrite ammonification.
FEMS Microb. Reviews 26:285-309.
Sleight, S. D. and D. P. Sinha. 1968. Prevention of methemoglobin reduction in
blood samples. J. Am. Vet. Med. Assoc. 152:1521-25.

126
Smith, P., D. Martino, Z. Cai, D. Gwary, H. Janze, P. Kumar, B. McCarl, S. Ogle, F.
O'Mara, C. Rice, B. Scholes, O. Sirotenko, M. Howden, T. McAllister, G. Pan,
V. Romanenkov, U. Schneider, S. Towprayoon, M. Wattenbach and J. Smith.
2008. Greenhouse gas mitigation in agriculture. The Royal Society. 363: 789-
813.
Smith, P., D. Martino, Z. Cai, D. Gwary, H.H. Janzen, P. Kumar, B. McCarl, S. Ogle,
F. O’Mara, C. Rice, R.J. Scholes, O. Sirotenko, M. Howden, T. McAllister, G.
Pan, V. Romanenkov, U. Schneider, S. Towprayoon, M. Wattenbach, and J.U.
Smith, 2007a: Greenhouse gas mitigation in agriculture. Philosophical
Transactions of the Royal Society, B., 363. doi:10.1098/rstb.2007.2184.
Smith, P., D. Martino, Z. Cai, D. Gwary, H.H. Janzen, P. Kumar, B.A. McCarl, S.M.
Ogle, F. O’Mara, C. Rice, R.J. Scholes, O. Sirotenko, M. Howden, T.
McAllister, G. Pan, V. Romanenkov, U.A. Schneider, and S. Towprayoon,
2007b: Policy and technological constraints to implementation of greenhouse
gas mitigation options in agriculture. Agriculture, Ecosystems and
Environment, 118, pp. 6-28.
Smith, S. J. and T. M. L. Wigley, 2006: Multi-Gas Forcing Stabilization with the
MiniCAM. Multi-Greenhouse Gas Mitigation and Climate Policy, Energy
Journal, Special Issue #3. Available at:
<http://www.iaee.org/en/publications/journal.aspx> accessed 26 March 2007.
Sokolowski, J. H., E. E. Hatfield, U. S. Garrigus. 1969. Effects of inorganic sulphur
on KNO3 utilization by lambs. J. Anim. Sci. 28: 391-396.
Soliva, C. R., J. Takahashi, and M. Kreuzer (eds.), 2006: Greenhouse Gases and
Animal Agriculture: An Update. International Congress Series No. 1293,
Elsevier, The Netherlands, 377 pp.
Solomon, S., D. Qin, M. Manning, R.B. Alley, T. Berntsen, N.L., Bindoff, Z. Chen, A.
Chidthaisong, J.M. Gregory, G.C. Hegerl, M. Heimann, B. Hewitson, B.J.
Hoskins, F. Joos, J. Jouzel, V. Kattsov, U. Lohmann, T. Matsuno, M. Molina,
N. Nicholls, J. Overpeck, G. Raga, V. Ramaswamy, J. Ren, M. Rusticucci, R.
Somerville, T. F. Stocker, P. Whetton, R.A. Wood and D. Wratt 2007.
Technical Summary. In Climate Change 2007: The Physical Science Basis.

127
Contribution of Working Group I to the Fourth Assessment Report of the
Intergovernmental Panel on Climate Change [ Solomon, S. D. Qin, M.
Manning, Z. Chen, M. Marquis, K.B. Averyt, M. Tignor and H.L. Miller
(eds.)]. Cambridge University Press, Cambridge, United Kingdom and New
York, NY, USA.
Sophal, C., D. N. Khang, T. R. Preston and R. A. Leng. 2013. Nitrate replacing urea as
afermentable N source decreases enteric methane production and increases the
efficiency of feed utilization in Yellow cattle. Livest Res Rural Dev. Volume
23, Article #71. http://www.lrrd.org/lrrd25/7/soph25113.htm
Sophea, Iv. and T. R. Preston. 2011. Effect of different levels of supplementary
potassium nitrate replacing urea on growth rates and methane production in
goats fed rise straw, mimosa foliage and water spinach. Livest Res Rural Dev.
23 (4). http://www.lrrd.org/lrrd23/4/soph23071.htm
Steel, R. G., J. H. Torrie and D. A. Dickey. 1996. Principles and Procedures of
Statistics. A Biometrical Approach. 3rd Edition. McGraw-Hill Book, Co. Inc.
New York, USA.
Steinfeld, H., P. Gerber, T. Wassenaar, V. Castel, M. Rosales and C. De Haan. 2006.
Livestock's long shadow: environmental issues and options. Rome, Italy: FAO.
Storm, I. M. L. D., A. L. F. Hellwing, N. I. Nielsen and J. Madsen. 2012. Methods for
measuring and estimating methane emission from ruminants. Animal 2: 160-
183.
Sutton, J. D., R. Knight, A. B. McAllan, and R. H. Smith. 1983. Digestion and
synthesis in the rumen of sheep given diets supplemented with free and
protected oils. Br. J. Nutr. 49:419–432.
Takahashi, J. 2011. Some prophylactic options to mitigate methane emission from
animal agriculture in Japan. Asian-Aust. J. Anim. Sci. 24:285–294.
Takahashi, J., M. Ikeda, S. Matsuoka and H. Fujita. 1998. Prophylactic effect of L-
cysteine to acute and subclinical nitrate toxicity in sheep. Anim. Feed Sci.
Technol. 74: 273-280.

128
Tamminga, S., A. Bannink, J. Dijkstra and R. Zom. 2007. In: Feeding Strategies to
Reduce Methane Loss in Cattle. Report 34: Animal Sciences Group, van
Wageningen University and Research Center, Lelystad, The Netherlands. pp.
46.
Thanh Vo Duy, Nguyen Van Thu and T.R. Preston. 2012. Effect of potassium nitrate
or urea as NPN sources associated with Mangosteen peel (Garcinia
mangostana) on methane production, rumen parameters and growth
performance of Phan Rang sheep in the Mekong Delta of Vietnam. Livest Res
Rural Dev. 24 (4). http://www.lrrd.org/lrrd24/4/thanh24073.htm
Tillman, A. D., G. M. Sheriha and R. J. Sirny. 1965. Nitrate reduction studies with
sheep. Asian Australas. J. Anim. Sci. 24: 1140-1146.
Tomkins, N. W., Hunter, R. A., 2004. Methane mitigation in beef cattle using a
patented anti-methanogen. In: Eckard, R.J., Slattery, W. (Eds.), Proceedings of
the 2nd Joint Australia and New Zealand Forum on Non-CO2 Greenhouse Gas
Emissions from Agriculture. CRC for Greenhouse Accounting, Lancemore Hill,
Canberra, pp. 2–9. 0-9579597, October 2003.
Trinh Phuc Hao, Ho Quang Do, T.R. Preston and R.A. Leng. 2009. Nitrate as
fermentable nitrogen supplemented for goats fed forage based diets low in true
protein. Livest Res Rural Dev. 21(1).
http://www.lrrd.org/lrrd21/1/trin21010.htm
Tyrrell, H. F., and P. W. Moe. 1971. Net energy value for lactation of a high and low
concentrate ration containing corn silage. J. Dairy Sci. 55:1106–1112.
Tyrrell, H. F., D. J. Thomson, D. R. Waldo, H. K. Goering, and G. L. Haaland. 1992.
Utilization of energy and nitrogen by yearling Holstein cattle fed direct-cut
alfalfa or orchard grass ensiled with formic acid plus formaldehyde. J. Anim.
Sci. 70:3163–3177.
Ulyatt, M. J., S. K. Baker, G. J. McCrabb and K. R. Lassey. 1999. Accuracy of SF6
tracer technology and alternatives for field measurements. Aust. J. Agric. Res.
50: 1329-34.

129
UNFCCC (United Nations Framework Convention on Climate Change). 2008.
Available: http://unfccc.int [ 1 February 2008].
Ungerfeld, E. M. and R. A. Kohn. 2006. The role of thermodynamics in the control of
ruminal fermentation. In: Ruminant Physiology: Digestion, Metabolism and
Impact of nutrition on Gene Expression, Immunology and Stress. K. Sejrsen, T.
Hvelplund, and M. O. Nielsen, ed. Wageningen Academic Publishers,
Wageningen, The Netherlands. pp. 55-85
Ungerfeld, E. M., R. A. Kohn, R. J. Wallace, and C. J. Newbold. 2007. A meta-
analysis of fumarate effects on methane production in ruminal batch cultures. J.
Anim Sci. 85:2556-2563.
US-EPA (United States Environmental Protection Agency). 2006. Inventory of U.S.
Greenhouse Gas Emissions and Sinks: 1990-2004. (April 2006) USEPA #430-
R-06-002. Office of Policy, Planning and Evaluation. Washington DC.
http://www.epa.gov/climatechange/Downloads/ghgemissions/06ES.pdf
Ushida, K., M. Tokura, A. Takenaka, and H. Itabashi. 1997. Ciliate protozoa and
ruminal methanogenesis. Rumen microbes and digestive physiology in
ruminants, 209–220. Japan Scientific Society Press. Tokyo.
Van Nevel, C. and Demeyer, D. 1995. Feed additive and other interventions for
decreasing methane emissions. Biotechnology in Animal Feeds and Feeding
17:329-349.
Van Nevel, C. J. and D. I. Demeyer, 1995. Feed additives and other interventions for
deceasing methane emissions. Pages 329–349 in R. J. Wallace and A. Chesson,
eds. Biotechnology in animal feeds and animal feeding. VCM, Weinheim.
Van Nevel, C. J. and D. I. Demeyer. 1996. Control of rumen methanogenesis, Environ.
Monit. assess, 42: 73.
Van Soest, P. J., J. B. Robertson and B. A. Lewis. 1991. Methods for dietary fiber,
neutral detergent fiber, and nonstarch polysaccharides in relation to
animal nutrition. J. Dairy Sci. 74: 3583-3597.

130
Van Vugt, S. J., W. C. Waghorn, D. A. Clark and S. L. Woodward. 2005. Impact of
monensin on methane production and performance of cows fed forage diets.
Proc. N. Z. Soc. Anim. Prod. 65:362-366.
Van Zijderveld, S. M., W. J. J. Gerrits, J. A. Apajalahti, J. R. Newbold, J. Dijkstra, ,R.
A. Leng and H. B. Perdok. 2010. Nitrate and sulphate: Effective alternative
hydrogen sinks for mitigation of ruminal methane production in sheep. J. Dairy
Sci. 93: 5856-5866.
van Zijderveld, S. M., W. J. J. Gerrits, J. Dijkstra, J. R. Newbold, R. B. A. Hulshof and
H.B. Perdok. 2011. Persistency of methane mitigation by dietary nitrate
supplementation in dairy cows. J. Dairy Sci. 94: 4028-4038.
Varga, G. A., H. F. Tyrrell, G. B. Huntington, D. R. Waldo, and B. P. Glenn. 1990.
Utilization of nitrogen and energy by Holstein steers fed formaldehyde- and
formic acid-treated alfalfa or orchard grass silage at two intakes. J. Anim. Sci.
68:3780–3791.
Waheed, A. 1994. Characterization of goats for linear type traits in Pakistan. PhD.
Dissertation. University of Agriculture, Faisalabad. Pakistan.
Waldo, D. R., H. F. Tyrrell, A. V. Capuco, and C. E. Rexroad. 1997. Components of
growth in Holstein heifers fed either alfalfa or corn silage diets to produce two
daily gains. J. Dairy Sci. 80:1674–1684.
Wallace, R. J., T. A. Wood, A. Rowe, J. Price, D. R. Yanez, S. P. Williams and C. J.
Newbold. 2006. Encapsulated fumaric acid as a means of decreasing ruminal
methane emissions. Int. Congr. Ser. 1293: 148-151.
Weichenthal, B. A., L. B. Embry, R. J. Emerick and F. W. Whetzal. 1963. Influence of
sodium nitrate, vitamin A and protein level on feedlot performance and vitamin
A status of fattening cattle. J. Anim. Sci. 22: 979–984.
Weimer, P. J. 1998. Manipulating ruminal fermentation: A microbial ecological
perspective. J. Anim. Sci. 76: 3114–22.
Wenk, C., 2003. Herbs and botanicals as feed additives in mono-gastric animals. Asian
Australas. J. Anim. Sci. 16: 282-289.

131
Westberg, H., and B. Lamb. 2001. Inventory of methane emissions from US cattle. J.
Geophys. Res. 106:633–642.
Williams, A. G., E. Audsley, and D. L. Sandars. 2008. Environmental burdens of
livestock production systems derived from life cycle assessment (lca). Pages
171-200 in Recent advances in animal nutrition 2007. P. C. Garnsworthy and J.
Wiseman, ed. Nottingham University Press, Thrumpton, Nottingham, UK.
Williams, Y. J., S. Popovski, S. M. Rea, L. C. Skillman, A. F. Toovey, K. S.
Northwood, and A. D. G. Wright. 2009. A vaccine against rumen methanogens
can alter the composition of archaeal populations. Appl. Environ. Microbiol.
75:1860–1866.
Wolin, M. J. 1960. A theoretical rumen fermentation balance. J. Dairy Sci. 43:1452–
1459.
Wood, T. A., R. J. Wallace, A. Rowe, J. Price, D. R. Yanez-Ruiz, P. Murray and C. J.
Newbold. 2009. Encapsulated fumaric acid as a feed ingredient to decrease
ruminal methane emissions. Anim. Feed Sci. Technol. 152: 62-71.
Woodward, S. L., G. C. Waghorn and N. A. Thomson. 2006. Supplementing dairy
cows with oils to improve performance and reduce methane – does it work?
Proc. N. Z. Soc. Anim. Prod. 66: 176-181.
Woodward, S. L., G. C. Waghorn and P. Laboyrie. 2004. Condensed tannins in
birdsfoot trefoil (Lotus corniculatus) reduced methane emissions from dairy
cows. Proc. N.Z. Soc. Anim. Prod. 64: 160–164.
World agriculture: towards 2030/2050: Interim report, Global Perspective studies unit
Food and Agriculture Organisation of United Nations, Rome, June 2006.
Wright, A. D. G., P. Kennedy, C. J. O’Neill, A. F. Toovey, S. Popovski, S. M. Rea, C.
L. Pimm, and L. Klein. 2004. Reducing methane emission in sheep by
immunization against rumen methanogens. Vaccine 22: 3976–3985.
Yang, W. Z., C. Benchaar, B. N. Ametaj, A. V. Chaves, M. L. He, and T. A.
McAllister. 2007. Effects of garlic and juniper berry essential oils on ruminal

132
fermentation and on the site and extent of digestion in lactating cows. J Dairy
Sci. 90:5671-5681.
Zimmerman, P., S. Zimmerman, S. Utsumi and D. Beede. 2011. Development of a user
friendly online system to quantitatively measure metabolic gas fluxes from
ruminants. J Dairy Sci. 94: 760