influence of neuroarchitecture on infusate...
TRANSCRIPT

1
INFLUENCE OF NEUROARCHITECTURE ON INFUSATE DISTRIBUTION: APPLICATIONS FOR A NOVEL EPILEPSY THERAPY
By
SVETLANA KANTOROVICH
A DISSERTATION PRESENTED TO THE GRADUATE SCHOOL OF THE UNIVERSITY OF FLORIDA IN PARTIAL FULFILLMENT
OF THE REQUIREMENTS FOR THE DEGREE OF DOCTOR OF PHILOSOPHY
UNIVERSITY OF FLORIDA
2012

2
© 2012 Svetlana Kantorovich

3
To my parents, James and Adele; sister, Yelana; and brother, Vladimir

4
ACKNOWLEDGMENTS
I have many people to thank for who and where I am today. First and foremost, I
would like to thank the chair and members of my committee who have shaped the
scientist I have become. My advisor, Dr. Paul Carney, generously provided me with
scientific freedom to pursue my interests and concomitantly bestowed incredible
opportunities for translational research. I would also like to express my gratitude to Drs.
Malisa Sarntinoranont, William Ogle, Jake Streit, and Michael King for serving on my
committee and being exceptional mentors. Special thanks to Dr. King for being a
consistent source of reliable information, patience, and advice, and to Dr. Thomas
Mareci for meticulous analysis and critique of my experiments and publications.
I am very thankful for all the wonderful members of my laboratory, past and
present. Thank you Rabia for teaching me everything I know in the world, especially the
serious things. Thank you Mansi for laying down smooth tracks to follow and staying for
the next generation. Thank you Stephen for being my recording guru and a source of
great wisdom. Thank you eMalick for your intellectual curiosity, without which we would
have never become collaborators and good friends. Thank you Garrett for becoming a
MRI genius so that our experiments were completed without a hitch. I am grateful I had
the opportunity to work with and learn from you. Thank you Phil and Aaron for your
friendship and support, and many thanks to Frank, Shiva, Eric, Matt, Dave, and Junli for
providing an exciting and encouraging lab environment.
Finally, I wish to thank my family and friends. I have been blessed with the best
parents, James and Adele Kantorovich, who have never wavered in their support or
confidence in my abilities. Without the sacrifices they have made, I would never be
where I am today. I’d like to thank my brother, Vladimir, a role model whose footsteps I

5
have been following, and my twin sister, Yelana, an interactive designer who is the
reason my presentation slides always look professionally amazing. Last but not least,
thank you Jeannette for being the best friend I could ask for, and Wade for sticking with
me from day one. I could never have done it without you.

6
TABLE OF CONTENTS page
ACKNOWLEDGMENTS .................................................................................................. 4
LIST OF TABLES ............................................................................................................ 9
LIST OF FIGURES ........................................................................................................ 10
LIST OF ABBREVIATIONS ........................................................................................... 12
ABSTRACT ................................................................................................................... 14
CHAPTER
1 BACKGROUND ...................................................................................................... 16
Motivation ............................................................................................................... 16
Epilepsy .................................................................................................................. 17 Classification of the Epilepsies ......................................................................... 17 Temporal Lobe Epilepsy ................................................................................... 18
Limbic system circuitry ............................................................................... 19 Etiology and pathophysiology of TLE ......................................................... 21
Current Treatments for Epilepsy ....................................................................... 23 Animal Models of Epilepsy ............................................................................... 25 Comparative Neuroanatomy of the Rat and Human Hippocampal Formation .. 26
Drug Delivery .......................................................................................................... 28 Disruption of the BBB ....................................................................................... 29
Passage Through the BBB ............................................................................... 30 Drug design ................................................................................................ 30
Mediated transport ..................................................................................... 31 Passage Behind the BBB ................................................................................. 33
Extracellular space ..................................................................................... 33
Intracerebroventricular/intrathecal delivery ................................................ 36 Intracerebral delivery ................................................................................. 37
2 CONVECTION-ENHANCED DELIVERY IN THE NORMAL RAT HIPPOCAMPUS ..................................................................................................... 45
Introduction ............................................................................................................. 45 Methods .................................................................................................................. 48
Animal Preparation and Surgical Procedures ................................................... 48 MR Imaging and Image Segmentation ............................................................. 50 Histology ........................................................................................................... 51
Microscopy ....................................................................................................... 51 Results .................................................................................................................... 52
Infusion Site ...................................................................................................... 52

7
Gd-albumin Distribution in the Septal Hippocampus ........................................ 52
Gd-albumin Distribution in the Temporal Hippocampus ................................... 53 Backflow ........................................................................................................... 54
Image Segmentation ........................................................................................ 54 Histological Analysis ......................................................................................... 55
Discussion .............................................................................................................. 56 Distribution Profile and Shape .......................................................................... 56 Analysis of Shape and Volume ......................................................................... 60
Conclusions ............................................................................................................ 63
3 INFLUENCE OF LIMBIC SYSTEM INJURY ON INFUSATE DISTRIBUTIONS IN THE RODENT HIPPOCAMPUS......................................................................... 68
Introduction ............................................................................................................. 68
Methods .................................................................................................................. 70 Animals............................................................................................................. 70
Surgical Procedures ......................................................................................... 70 Induction of Self-Sustaining Limbic Status Epilepticus (SE) by Hippocampal
Electrical Stimulation ..................................................................................... 71 MR Imaging ...................................................................................................... 72 Infusion of Gd-albumin ..................................................................................... 73
Immunohistochemistry...................................................................................... 74 Image Segmentation and Statistical Analysis ................................................... 75
Results .................................................................................................................... 76 SE-Induced Injury ............................................................................................. 76 Volumes of Distribution of Gd-albumin and Changes in Hippocampal
Volume .......................................................................................................... 77 Characteristics of Gd-albumin Distribution ....................................................... 78
Histology 24 Hours Post-SE ............................................................................. 79 Histology 60 Days Post-SE .............................................................................. 80
Discussion .............................................................................................................. 81 Acute SE-Induced injury ................................................................................... 82 Injury and Final Infusate Distribution Volume ................................................... 83
Injury and Pattern of Infusate Distribution......................................................... 85 Other Factors Affecting Final Infusate Distribution ........................................... 86
Conclusions ............................................................................................................ 88
4 CONVECTION-ENHANCED DELIVERY OF THERAPEUTIC AGENT CARRIERS ............................................................................................................. 99
Introduction ............................................................................................................. 99 Gene Therapy for Epilepsy ............................................................................. 100 Stem Cell Therapy for Temporal Lobe Epilepsy ............................................. 102 Proof-of-Principle Studies for Viral Vector and Stem Cell CED Delivery ........ 103
Methods ................................................................................................................ 104 Animals........................................................................................................... 104
Vector Construction ........................................................................................ 104
8
Transduction and Isolation of NSCs ............................................................... 105
Surgical Procedures and CED Infusions for NSC Experiments ...................... 105 Surgical Procedures and CED Infusions for Viral Vector Experiments ........... 106
Perfusion and Immunochemistry .................................................................... 106 Quantification of NSC Transplant Dimensions ............................................... 107 Image Segmentation and 3D Reconstruction of NSC Engraftments .............. 108
Results .................................................................................................................. 108 Distribution of Viral Vectors in the Hippocampus ............................................ 108
Distribution of Transplanted NSCs in the Hippocampus ................................. 110 Distribution of Transplanted NSCs in the Thalamus and Striatum .................. 111
Discussion ............................................................................................................ 111 Viral Vector Distribution .................................................................................. 111 NSC Distribution ............................................................................................. 113
Conclusions .......................................................................................................... 114
5 CONCLUSIONS AND FUTURE WORK ............................................................... 121
Conclusions .......................................................................................................... 121
Identifying Approaches to Prevent Epilepsy or Its Progression ...................... 121 Developing and Optimizing New Strategies for Targeted Therapies .............. 122 Developing Animal Models for the Progression of Epilepsy ........................... 124
Future Work .......................................................................................................... 125
LIST OF REFERENCES ............................................................................................. 127
BIOGRAPHICAL SKETCH .......................................................................................... 150

9
LIST OF TABLES
Table page 3-1 Index of injury classification 24 hours post-SE epilepticus.. ............................... 91
4-1 Features of gene expression vectors ................................................................ 116
4-2 Results from viral vector infusions .................................................................... 116

10
LIST OF FIGURES
Figure page 1-1 The epilepsies are classified based on etiology, semiology, origin of seizures,
and epilepsy syndromes.. ................................................................................... 42
1-2 Schematic of the various routes of molecular transport across the BBB. ........... 43
1-3 Final CED distribution with and without backflow of an MR contrast agent tagged with a fluorescent tracer in the rodent septal hippocampus. ................... 44
1-4 Lentivirus and neural stem cells targeted to the septal hippocampus via CED .. 44
2-1 Damage induced by the infusion cannula in the septal hippocampus.. .............. 64
2-2 Sagittal images of a single rat demonstrating the apparent disconnect between the septal and temporal hippocampus. ................................................ 64
2-3 High-resolution T1-weighted MR images of septal hippocampus infusions. ....... 65
2-4 High-resolution T1-weighted MR images of temporal hippocampus infusions.... 65
2-5 Histological images following infusate CED into the septal hippocampus showing Evans blue dye spreading throughout the septal hippocampus. .......... 66
2-6 Histological images following infusate CED into the temporal hippocampus showing Evans blue dye spreading thoughout the temporal hippocampus. ....... 67
3-1 Experimental protocol flow chart ......................................................................... 89
3-2 T2-weighted coronal images of 19 different rodent brains acquired post induction of SE reveal injury within regions of the limbic circuitry. ...................... 90
3-3 Increasing classifications of injury were correlated with volumes of distribution in 24-hour animals ............................................................................ 91
3-4 High resolution T1-weighted images of Gd-albumin infusions into the septal hippocampus of 19 different rodent brains post-SE. ........................................... 92
3-5 Characterization of hippocampal damage 24 hours post-SE. ............................. 93
3-6 Characterization of parahippocampal damage 24 hours post-SE....................... 94
3-7 Damage to the ventral subiculum was seen in 6/17 rats 24 hours post-SE. ....... 95
3-8 Characterization of thalamic injury 24 hours post-SE. ........................................ 96

11
3-9 T2-weighted MR image with corresponding histology of a spontaneously seizing animal 60 days post-SE. ......................................................................... 97
3-10 T2-weighted MR image and corresponding histology of another spontaneously seizing animal 60 days post-SE. ................................................. 98
4-2 Infusions of viral vectors into the left rat septal hippocampus. .......................... 117
4-3 Infusions of four AAV serotypes exhibit specific distribution patterns throughout the hippocampal septo-temporal axis. ............................................ 118
4-4 Short-term engraftments of NSCs expressing GFP demonstrate the hippocampus specifically features anisotropic transport. .................................. 119
4-5 Geometric analyses of NSC infusions. ............................................................. 120

12
LIST OF ABBREVIATIONS
AAV Adeno-associated virus
AED Anti-epileptic drug
AP Anterior-posterior anatomical direction
BBB Blood-brain-barrier
CA Cornu ammonis subfield of the hippocampus
CC Corpus callosum
CD-68 Cluster of Differentiation 68
CED Convection-enhanced delivery
CNS Central nervous system
CSF Cerebrospinal fluid
DAB 3,3'-diaminobenzidine
DG Dentate gyrus
DV Dorsal-ventral anatomical direction
ECS Extracellular space
EEG Electroencephalography
FJC Flouro Jade C
GABA γ-aminobutyric acid
Gd-albumin human serum albumin labeled with gadolinium chelated by diethylene triamine pentaacetic acid, macromolecular magnetic resonance imaging contrast agent
Gd-DTPA gadolinium chelated by diethylene triamine pentacetic acid, low molecular weight magnetic resonance imaging contrast agent
GFP Green fluorescent protein
GFAP Glial fibrillary acidic protein
HF Hippocampal fissure

13
ICV Intracerebroventricular
ILAE International League Against Epilepsy
IP Intraperitoneal
mTLE mesial temporal lobe epilepsy
ML Medial-lateral anatomical direction
MR Magnetic Resonance
MRI Magnetic Resonance Imaging
PEEK Polyaryletheretherketone
SE Status epilepticus
SNR Signal-to-noise ratio
SSLSE Self-sustained limbic status epilepticus
T Tesla
T1 Longitudinal-relaxation time constant
T2 Transverse-relaxation time constant
TLE Temporal lobe epilepsy
VI Velum interpositum

14
Abstract of Dissertation Presented to the Graduate School of the University of Florida in Partial Fulfillment of the Requirements for the Degree of Doctor of Philosophy
INFLUENCE OF NEUROARCHITECTURE ON INFUSATE DISTRIBUTION:
APPLICATIONS FOR A NOVEL EPILEPSY THERAPY
By
Svetlana Kantorovich
May 2012
Chair: Paul R. Carney Major: Medical Sciences - Neuroscience
Temporal Lobe Epilepsy (TLE) is the most common partial-onset epilepsy and
often refractory to antiepileptic drugs. Despite pharmacological advances in epilepsy
treatment, seizures cannot be controlled in many patients because current drugs do not
target causes of the disorder. Convection-enhanced delivery (CED), a local drug
delivery technique, has the potential to deliver novel therapeutics while avoiding
systemic toxicity and blood-brain-barrier limitations. However, the efficacy of CED
depends on appropriate tissue targeting, which requires a deeper understanding of the
effect of neuroarchitecture on interstitial transport. To investigate the influence of
microanatomy on CED, the volume and pattern of infusate distribution was examined
after varying the site of infusion, integrity of structure, and compound infused. Gd-
albumin, a magnetic resonance (MR) contrast agent, was infused into two sites in
normal rat hippocampi. Infusions were repeated in animals injured by an episode of
status epilepticus (SE), a prolonged seizure known to cause neuronal damage and
edema in the hippocampus and associated structures. Infusions in injured animals were
implemented 24 hours post-SE, as prophylactic treatment has the potential to reduce
structural damage, diminish associated cognitive impairment, or prevent

15
epileptogenesis. Infusions were also implemented at 60 days post-SE, during chronic
TLE. High-resolution T1- and T2-relaxation-weighted MR images were acquired at 11.1
Tesla in vivo to visualize Gd-albumin distribution and morphological changes,
respectively. Histological analysis was performed to validate infusions and characterize
injury at higher resolution. Finally, information gained from infusion studies with Gd-
albumin was used to guide proof-of-principle studies with neural stem cells and viral
vectors. Infusions in normal hippocampi spread along preferential paths parallel to fiber
directions and within fissures, with limited penetration across densely-packed cell
layers. Infusions in injured hippocampi followed similar patterns, but resulted in
significantly larger distribution volumes that correlated with increased injury severity.
Therapeutic carrier systems exhibited comparable spatial characteristics to Gd-albumin
infusions, but were also influenced by cell interactions. These studies show anisotropic
hippocampal architecture plays a leading role in the distribution of infusate by CED. This
information can be applied to improve targeting guidelines, incorporated into injury-
specific computation models, and considered in treatment strategies involving novel
therapeutic agents.

16
CHAPTER 1 BACKGROUND
Motivation
Epilepsy is a chronic neurological disorder that affects about 1% of people in the
United States, with approximately 50 million people affected worldwide (Browne and
Holmes, 2001). There are over 40 types of epilepsies, diverse in etiology but similarly
characterized by the recurrence of spontaneous seizures. Seizures are transient
episodes of abnormal, excessive, or synchronous neuronal activity in a focal area or
throughout the brain (Sander, 1993). Unfortunately, despite being one of the world’s
oldest recognized conditions, treatments for epilepsy lag behind developments of other
neurological disorders. This is especially true for temporal lobe epilepsy (TLE), in which
one-third of patients are resistant to available antiepileptic drugs (AEDs). As temporal
lobe epilepsy is the most common form of epilepsy in the adult population, this leaves
hundreds of thousands of patients with uncontrolled seizures. Therefore, the objective
of the research presented in this dissertation was to develop and optimize a novel
therapeutic strategy for the prevention and treatment of focal epilepsy using convention-
enhanced delivery (CED). CED is a local drug-delivery technique that uses positive
pressure to deliver infusate directly into parenchymal interstitial space. This mechanism
of delivery is applicable to a wide variety of potential treatments because it does not
require passage through the blood-brain-barrier (BBB). The introduction of inhibitory
neuropeptides, viral agents, or stem cell therapy is impossible using currently available
delivery options. Using CED, these agents can be delivered in a targeted manner over
clinically relevant volumes.

17
CED has the potential to overcome many obstacles in drug delivery, but detailed
knowledge about the influence of biophysical properties of the brain on delivery into
complex regions is lacking. In addition to the extensive work being done to understand
the influence of infusion parameters and cannula design, a thorough understanding of
interstitial flow in both normal and injured areas is necessary to provide direction for
safe and effective delivery. This body of work addresses these concerns through the
characterization of direct intracranial delivery in normal animals (Chapter 2) and in an
animal model of epilepsy (Chapter 3). Chapter 4 discusses applications of this strategy
in specific therapeutic modalities. Finally, Chapter 5 summarizes findings and proposes
future conduits for the progression of this work.
Epilepsy
Epilepsy is one of the world’s oldest recognized neurological disorders. The term
is reserved for “a condition characterized by two of more recurrent epileptic seizures
over a period longer than 24 hours, unprovoked by any immediate identified cause”
(Commission on Epidemiology and Prognosis of the International League Against
Epilepsy, 1993). It has also been referred to as “the epilepsies”, due to the many
manifestations of the disorder across geographical, racial, or social boundaries. This
section will introduce the various syndromes, describe the etiology, pathophysiology,
common treatments, and discuss animal models used to study the disorder.
Classification of the Epilepsies
The epilepsies are classified based on etiology, semiology, origin of seizures, and
epilepsy syndromes. Two systems of classification of epilepsies are in use today. The
first, developed by the International League Against Epilepsy (ILAE) , is based on
seizure semiology (Commission on Classification and Terminology of the International

18
League Against Epilepsy, 1981). This scheme divides seizures into three broad types
based on EEG observations: 1) partial (focal) seizures that involve one area of the
brain, 2) generalized seizures that involve the whole brain, and 3) unclassifiable
seizures, which may be generalized and partial, continuous, multifocal, or generalized to
only one hemisphere. These broad types are further subdivided by the appearance of
additional clinical observations, such as specific motor signs or loss of consciousness.
This classification scheme is detailed in Figure1-1A. The ILEA 1981 system is easy to
implement, but doesn’t provide information about the severity, cause, or prognosis of
the disease. Thus, another system of classification based on epilepsy syndromes was
developed by the ILAE eight years later (Commission on Classification and Terminology
of the International League Against Epilepsy, 1989). Similar to the first system, the
epilepsies are divided broadly into four groups: 1) localization-related seizures that
involve distinct parts of the brain, 2) generalized seizures that involve both sides of the
brain, 3) undetermined seizures that may be localized or generalized, and 4) special
syndromes. These groups are then further divided by etiology, i.e. whether the cause is
unknown (idiopathic), identifiable (symptomatic) or hidden (cryptogenic). This
classification is shown in Figure 1-1B. The ILEA 1989 system is helpful for diagnostic
purposes and is used as a complement to the 1981 system. For example, TLE is
classified as a symptomatic localization-related syndrome. People suffering from TLE
may experience simple partial seizures, complex partial seizures, or secondarily
generalized tonic-clonic seizures.
Temporal Lobe Epilepsy
The focus of this dissertation is on TLE, the most common form of epilepsy in
adults (Engel, 2001a), and among the most frequent types of intractable epilepsy

19
(Engel, 2001b). TLE refers to spontaneous recurrent seizures originating in the limbic
system. There are two main types of TLE: 1) mesial TLE (mTLE), in which seizures
begin in the hippocampus, parahippocampal gyrus, or amygdala, and 2) lateral TLE, in
which seizures arise from the neocortex. mTLE, the more common form, is poorly
controlled with pharmacological intervention and hence most likely to benefit from
alternative therapeutic strategies.
Limbic system circuitry
Given that TLE affects the limbic system, it is necessary to introduce the limbic
system circuitry (Amaral and Lavenex, 2007) that underlies pathological features of the
disorder. Limbic areas commonly affected in TLE include the hippocampal formation,
parahippocampal gyrus, thalamus, and septum. The hippocampal formation consists of
the dentate gyrus, Cornu Ammonis (CA) fields CA1, CA2, and CA3, subiculum,
presubiculum, parasubiculum, and entorhinal cortex. These regions are
cytoarchitectonically distinct, but linked by largely unidirectional neuronal pathways to
form functional circuits.
The dentate gyrus (DG) is a trilaminate region that receives direct input from the
entorhinal cortex via the perforant path. It has a relatively cell-free molecular layer, a
granule cell layer, and a polymorphic cell layer (hilus) containing mossy cells and
interneurons. The molecular and granule cell layers form a sideways U shape in which
the blade superior to the CA3 cell layer is referred to as the suprapyramidal blade and
the blade inferior to the CA3 cell layer is referred to as the infrapyramidal blade. Granule
cells, the principal excitatory cells of the DG, synapse bilaterally on mossy cells in the
polymorphic layer and ipsilaterally on CA3 pyramidal cells.

20
The CA1, CA2, and CA3 regions are known specifically as the hippocampus
proper. Inputs and outputs to the hippocampal proper are organized within distinct
layers, or strata.
The pyramidal cell layer contains principle cells.
Stratum oriens contains basal dendrites, interneurons, and some CA3 axons.
Stratum radiatum contains apical dendrites, some CA3 axons, and several classes of interneurons.
Stratum lacunosum-moleculare contains entorhinal cortex fibers, afferents from subcortical regions, and interneurons. This layer abuts the hippocampal fissure, a cell-free region continuous with ventricular space that is lined by pia mater and filled with cerebrospinal fluid (CSF) and blood vessels (Humphrey, 1967)
Stratum lucidum is a thin acellular layer in the CA3 containing mossy fibers.
The alveus is a fiber-containing layer composed of axons from the pyramidal cells in the subiculum and hippocampus. It eventually merges with the fimbria, which goes on to become the fornix.
Information from mossy fibers in the DG advances to the CA3, and is then carried from
the CA3 to the apical and basal dendrites of the CA1 via Shaffer collaterals. The CA3
also has a massive associational network which includes projections to the CA3 and
CA2, and commissural connections to the contralateral CA3, CA2, and CA1. The CA1
has very limited associational projections and only weak commissural projections.
The CA1 projects axons to the deep layers of the entorhinal cortex and to the deep
portion of the subicular molecular layer. The subiculum is a main output of the
hippocampus; it sends projections to the deep layers of entorhinal cortex, perirhinal
cortex, amygdaloid complex, endopiriform nucleus, diencephalon (nucleus reuniens,
paraventricular nucleus, paratenial nucleus), neocortex (prelimbic cortex, infralimbic
cortex, retrosplenial cortex, orbitofrontal cortex), basal forebrain (septal nucleus,
nucleus accumbens), mammillary nuclei, and brain stem. It does not give rise to

21
commissural connections, but has a substantial association projection that extends
temporally from the cells of origin. The subiculum also projects to the presubiculum and
parasubiculum, which distributes processed information to a series of cortical and
subcortical structures.
There many extrinsic connections with the hippocampus and other limbic regions.
Most external input comes from the entorhinal cortex and is known as the perforant
path. Neurons of layer II of the entorhinal cortex project axons to the DG and CA3, while
layer III of the entorhinal cortex projects to the CA1 and the subiculum. CA1 also
receives input from the amygdaloid complex, perirhinal and postrhinal cortices, nucleus
reunions of the thalamus, and the septum. The CA3 receives connections from the
amygdaloid complex as well, and has reciprocal bilateral connections with the lateral
septum.
Etiology and pathophysiology of TLE
The precise cause of TLE is unknown in most cases, but it is typically seen after
an initial precipitating injury such as status epilepticus (SE), brain injury, tumors,
meningitis, encephalitis, and febrile seizures during childhood (French et al., 1993;
Mathern et al., 1996; Pitkanen and Sutula, 2002; Lewis, 2005).
The hallmark pathology of TLE is hippocampal sclerosis (Blumcke et al., 2002; de
Lanerolle and Lee, 2005), although cases without those changes exist as well.
Histological evaluation of biopsy specimens from chronic epilepsy reveal hippocampal
atrophy and scarring with varying degrees of regional neuronal loss and gliosis. Classic
hippocampal sclerosis consists of selective loss of pyramidal cells in the CA1 and hilus
(de Lanerolle et al., 2003), but neurodegeneration has also been described in the CA2
and CA3 as well (Bruton, 1988). Recurrent connectivity within the dentate gyrus has

22
been proposed as a major epileptogenic mechanism (Mathern et al., 1995a) due to
several observations in hippocampal sclerosis. Loss of interneuronal subtypes (Mathern
et al., 1995b) and excitatory mossy cells (Blumcke et al., 2000) have been noted, with
abnormal hippocampal neurogenesis, dispersion of the dentate granule cell layer, and
mossy fiber sprouting (Thom et al., 2005). Cytological alterations, including enlargement
of neurofilaments, abnormal dendritic nodular swellings, ramification of end folial
neurons, have also been reported, though these features may represent adaptive rather
than primary abnormalities (Blumcke et al., 1999). In addition to the hippocampus and
dentate gyrus, pathological changes have commonly been reported in the human
amygdala (Hudson et al., 1993), entorhinal cortex (Du et al., 1993), and thalamus
(Margerison and Corsellis, 1966; Bruton, 1988).
It remains uncertain whether neuropathological findings represent a substrate for
TLE development or are a consequence of repeated seizures. In other words, the
question of whether “seizures beget seizures” has been a point of contention for over a
century (Gowers, 1881). Animal models have been used to address this issue and have
shown that recurrent seizures can produce hippocampal damage (for review, see (Ben-
Ari et al., 2008)). Clinical evidence is inconclusive (Hauser and Lee, 2002) because
there are epilepsy syndromes that are progressive, and there are syndromes that remit
regardless of the number of seizures experienced. However, in human TLE, the
remission of seizures after the surgical removal of a damaged focus (Wiebe et al., 2001)
suggests this damage is only one feature of a disease process that includes other
predispositions.

23
Current Treatments for Epilepsy
The most common treatment of epilepsy is pharmacotherapy. There are a number
of anti-epileptic drugs (AEDs) available for the management of epileptic seizures that
are delivered through the use of pills or intravenous injections. These may function by
decreasing the excitation of neurons by blocking sodium or calcium channels, or by
enhancing their inhibition with the potentiation of inhibitory neurotransmitters, like γ-
aminobutyric acid (GABA). The most commonly used older AEDs for TLE are
phenytoin, carbamazepine, primidone, valproate, and phenobarbital. Newer drugs, such
as gabapentin, topiramate, lamotrigine, levetiracetam, pregabalin, tiagabine,
lacosamide, and zonisamide have also been incorporated into the clinic. Unfortunately,
these medications are only effective for about two-thirds of patients (Brodie and Dichter,
1996) and often come with a number of side effects (Baker et al., 1997).
Some intractable epilepsy cases are remediable with surgical resection of the
epileptic focus. Not all individuals are candidates for surgery however, and among those
who are, nearly 20% will refuse to accept the risks of a major surgical procedure (Berg
et al., 2003). Moreover, although epilepsy surgery is often considered the only causal
treatment of epilepsy, in most patients anti-epileptic drug treatment must be continued
after surgery to achieve seizure control (Loscher and Schmidt, 2002). In fact, the
probability of achieving a one year remission from surgery is only about 57%. This
suggests that in many patients undergoing epilepsy surgery, the focal tissue
contributing to intractability is removed, rather than the complex epileptogenic network
underlying the epileptic process.

24
The ketogenic diet is a less common treatment that was advocated after 1921,
when it was noted that ketosis and acidosis induced by a high fat/low carbohydrate diet
had anticonvulsant effects (Geyelin, 1921). This diet consists of very large amounts of
fat (minimum 1g per kg per day of protein) with a typical fat-to-carbohydrate ration of 4:1
or 3:1. While those who respond to the diet show dramatic improvement, its use is
primarily for generalized epilepsies associated with diffuse brain abnormalities. Less
success is seen in patients with complex partial seizures or epileptiform discharges in
the temporal region (Beniczky et al., 2010). Ketone bodies appear throughout the brain,
so this treatment is not considered targeted and is difficult to maintain. Furthermore,
there are some potential concerns regarding its effects on growth in children
(Rubenstein, 2008) and the effect of an almost all fat diet on cardiac status.
Patients may also have the option of receiving electrical stimulation as a potential
treatment for intractable epilepsy. The most common form of stimulation treatment is the
vagus nerve stimulator, although there is increasing interest in deep brain stimulation
and direct regional stimulation of epileptic regions (Theodore and Fisher, 2004). The
stimulation of the vagus nerve causes an increase in inhibition and a decrease in
excitability, therefore raising the threshold for seizure (Vonck et al., 2001). The
mechanism of action is unclear, but it does not require craniotomy, and efficacy is
comparable to adjunctive antiepileptic drugs (DeGiorgio et al., 2000; Sirven et al.,
2000). Similarly, stimulation of the anterior thalamic nucleus has been shown to be
important in generalized seizures (Mirski and Ferrendelli, 1986). Mirski et al. showed
they could inhibit the anterior thalamic nucleus with high frequency (100 Hz) stimulation.
Timed electrical stimulation in response to measured preictal brain dynamical changes

25
has also shown to prevent seizures (Nair S, 2005). Despite these encouraging results,
difficulties and risks persist. The vagus nerve stimulator could result in complications
such as left-vocal-cord paralysis, lower facial weakness, sternocleidomastoid spasm,
and transient bradycardia or asystole (Charous et al., 2001).
The above-mentioned limited therapeutic options leave a large number of patients
untreated. Despite pharmacological, surgical, and electrical advances in the treatment
of epilepsy, seizures cannot be controlled in many patients because current therapies
target the symptoms of the disease (seizures) once it is already fully developed. It is
important to note that there are currently no protocols for preventative treatments,
although mounting evidence suggests prophylactic treatment after an initial insult may
result in a positive modifying effect on the development of epilepsy (for review see [4,
5]). Early treatment has the potential to reduce structural damage, diminish associated
behavioral and cognitive impairment, or prevent epileptogenesis. This subject is
addressed in more detail in Chapter 3.
Animal Models of Epilepsy
Many different animal models of epilepsy have been described for various
purposes. In general, there are genetic animal models and models in which seizures are
induced in normal animals. Induced seizures may be created with electrical or chemical
application, and can result in the development of spontaneous (chronic) or on-demand
(acute) seizures. Both electrical and chemical acute seizure models, such as the
maximal electroshock seizure (MES) and pentylenetetrazole (PTZ) models (White et al.,
1995), and are commonly used for AED discovery because they are easy to use and
time-efficient. MES and PTZ models induce seizures in healthy rodents. Alternatively,
electrical kindling is an on-demand seizure model in which the repeated application of

26
electrical stimuli induces permanent susceptibility to seizures. Kindling models are
generally used to characterize the anticonvulsant potential of a compound screened
with the initial screening tests (Loscher, 2011).
Chronic, or post-SE, animal models are typically used to evaluate epilepsy
prevention or disease-modification because the epileptic condition results as a
consequence of injury followed by a latent period. Chemical SE models, such as kainate
(Hellier et al., 1998) and pilocarpine (Cavalheiro, 1995), are routinely used, but have
high mortality rates and considerable inter-animal variability. The self-sustaining limbic
SE model (Nitsch and Klatzo, 1983; van Vliet et al., 2007), on the other hand, is often
considered to have the greatest parallels with human TLE (Schmidt and Loscher, 2009).
This is an electrically-induced SE model that replicates essential characteristics of
epilepsy as it occurs in humans (Lothman et al., 1990), including comparable
electrophysiological correlates, pathological changes in the limbic system, and
histological changes in the hippocampus (Falconer, 1974; Babb, 1987; Bertram et al.,
1990; Goodman, 1998; Marchi et al., 2010). This animal model is used in the studies
described within this work because it most closely approximates structural changes.
Importantly, a fraction of these animals also exhibit pharmacoresistance to current
AEDs (Loscher, 1997). Although more labor intensive, appropriate models of refractory
epilepsy should also be incorporated into the development of novel epilepsy therapies.
Comparative Neuroanatomy of the Rat and Human Hippocampal Formation
The description of the limbic system circuitry in this chapter has dealt primarily with
the rat hippocampal formation because much of the neuroanatomical information
available has been gained from studies of the rat, and the work described in this
dissertation involves the rat hippocampus. There are, however, a number of differences

27
in morphologic variations from species to species (Amaral and Lavenex, 2007). For
example, the CA1 and entorhinal cortex are disproportionately larger in primates than
rodents. The volume of the dentate gyrus and hippocampus is 100 times larger in
humans than in rats (3300 mm3 versus 32 mm3). There are 15 times more dentate
granule cells in humans compared to rats, and the human CA1 has 35 times more
pyramidal cells than the rat CA1. Additionally, although a common topography in the
entorhinal-hippocampal projection seems to be present in rat and human, there is also
more extensive interchange of information between the hippocampal formation and the
neocortex. The full extent of the differences between these species cannot yet be
accurately gauged; there very well may be substantial variation in the cellular
morphology, connectivity, and chemical neuroanatomy across species. Fortunately, the
characteristic architecture of the hippocampal formation presents little variation with
phylogenetic development. Both the rat and human hippocampus have a basic
morphology of an elongated, curved, and rod-like structure. Densely-packed cell layers
are obvious in rats and humans, with progressive lamination from dentate gyrus to
entorhinal cortex. Many models for temporal lobe epilepsy have been advanced based
on cell degeneration and fiber sprouting in the rat hippocampus that have been verified
in humans as well. The hippocampal formation is also in a similar location, close to
olfactory structures, in all mammals. Due to the similarities in dense cell layers,
hippocampal fissures, and hippocampal lamination, the rat hippocampus still presents a
good model for spread of infusate within the human hippocampus, especially if these
features are capable of significantly influencing distribution.

28
Drug Delivery
As mentioned in “Current Treatments for Epilepsy”, AEDs prescribed today must
enter the brain by crossing over from the blood. Theoretically, the transvacular route,
composed of 100 billion capillaries separated by only 40 µm2 (Pardridge, 2003b), has
the potential to distribute drugs throughout the brain. In reality, this method is limited by
the proclivity for systemic toxicity and notably, the blood-brain-barrier (BBB).
The BBB is a specialized interface between circulating blood and the brain
responsible for maintaining CNS homeostasis and limiting entry of substances that can
alter neuronal function (Bradbury, 1985; Goldstein and Betz, 1986). It consists of tight
junctions between endothelial cells that are supported and reinforced with the glia
limitans. The tight junctions result in a very high resistance between cells that limits
para-cellular transport (Figure 1-2A), while enzymes present inside the endothelial cells
degrade most solutes travelling trans-cellularly (Figure 1-2B). With the exception of
small (<1000 Daltons) hydrophobic molecules that can freely diffuse through the
membrane, the BBB is extremely efficient at restricting passage of substances from the
bloodstream. Treatment responsiveness of pharmacoresistant partial (focal) epilepsy is
dependent on clinically-relevant drug concentrations at the focus. Hence, this
neuroprotective role of the BBB presents a major challenge for the delivery of
medication, especially non-lipophilic therapeutic agents that have been shown to be
effective in experimental systems. The challenge to circumvent the BBB for drug
delivery has been met with methods developed to disrupt the BBB, pass through the
BBB, or deliver substances behind the BBB. These drug delivery strategies are
described in the rest of this section.

29
Disruption of the BBB
Systemic administration of drugs with concomitant BBB disruption has been a
strategy pursued to increase parenchymal drug concentrations. These include infusion
of solvents (dimethyl sulfoxide or ethanol) and metals, X-irradiation, induction of
pathological conditions, or administration of antineoplastic agents. These techniques
are usually toxic and not clinically useful. Intracarotid injection of an inert hypertonic
solution such as mannitol or arabinose has been employed to increase the permeability
of the BBB temporarily. Osmotic dehydration of the endothelial cells enlarges pore size
between tight junctions to allow drugs to enter the brain (Rapoport, 2000), and it is
short-lasting and spontaneously reversible (Siegal et al., 2000). This method has been
used to deliver chemotherapeutic drugs for treating brain tumors (Doolittle et al., 2002;
Haluska and Anthony, 2004). Other factors have also been transported into the CNS
with the use of mannitol: manganese for neuroimaging (Fa et al., 2011), neurotrophic
factors for experimental stroke treatment (Yasuhara et al., 2010), and a rabies virus
glycoprotein-labeled nanocarrier (Hwang et al., 2011). Despite favorable results
obtained in some patients with brain tumors, this method is probably not the right
treatment for epilepsy. One study found seizures occurred 7% of the time during
hyperosmotic BBB opening in cancer patients who were previously seizure-free
(Haluska and Anthony, 2004). Another study documented seizures began directly
following BBB opening in 25% of the procedures delivering mannitol with chemotherapy
(Marchi et al., 2007). The increase of seizure risk is most likely because this procedure
indiscriminately opens the BBB to any circulating toxins or endogenous serum
components that can disturb the homeostasis of extracellular ions (Friedman, 2011).

30
Therefore, there is considerable risk of infection or passage of unwanted
molecules/proteins in addition to the targeted drug.
Passage Through the BBB
Drug design
Another strategy for drug delivery is to sneak drugs into the brain through the BBB.
BBB penetration is favored by low molecular weight, lack of ionization at physiological
pH, and lipophilicity (Pardridge, 1988). Small lipophilic molecules can diffuse passively
across the BBB (Figure 1-2B). Creating hydrophobic analogues of small hydrophilic
drugs is a strategy employed to transport compounds into the brain. However, this
strategy has been met with disappointment. The price of increasing lipophilicity for
better permeability is decreased plasma solubility, leading to increased binding to
plasma proteins and lower concentrations of drug available (Misra et al., 2003). A
potential solution to this problem is to create prodrugs, pharmacologically inactive
compounds that are converted to their active form with a chemical modification once
inside the BBB. Esterification or amidation of hydroxyl-, amino-, or carboxylic acid-
containing drugs are added to enhance lipid solubility, then hydrolysis of the modifying
group will releases the active compound once in the CNS (Huttunen et al., 2011).
Prodrugs have been created for valproic acid (Trojnar et al., 2004; Peura et al., 2011),
phenytoin (Fechner et al., 2008; Rautio et al., 2008), and gabapentin (Cundy et al.,
2004; Rautio et al., 2008). Although a clever solution, this strategy, too, suffers from
important limitations. Increased lipophilicity increases uptake into other tissues, which
may exacerbate toxicity at non-target sites. Additionally, increased lipophilicity
enhances efflux processes, resulting in poor tissue retention and short biological action.
Finally, hydrolysis of the prodrug may lead to unwanted metabolites that contribute to

31
the toxicity of the compound. (Bodor and Kaminski, 1987; Lambert, 2000). Recently,
prodrugs have been developed to include multi-step activation and other moieties to
enhance target specificity and prevent unwanted metabolic conversions (Huttunen et
al., 2011). With improvement, the prodrug approach may prove to be a feasible way to
transport drugs into the CNS.
Mediated transport
There are several transport systems involved in the movement of macromolecules
across the BBB that may be exploited for drug delivery. For example, the brain requires
essential small and large hydrophilic molecules for normal functioning and survival that
cannot passively diffuse across the BBB. These substances are recognized by specific
transporters on endothelial cells and transported into the brain (Figure 1-2). Carrier-
mediated transport pathways (Figure 1-2C) consist of membrane transporter proteins
expressed at the luminal and basolateral endothelial membrane that allow certain small,
hydrophilic circulating nutrients or peptides to pass through the endothelial cell. These
pathways include:
Hexose transport system for glucose and mannose
Neutral amino acid transport system
Acidic amino acid transport system for glutamate and aspartate
Basic amino acid transport system for arginine and lysine
b-amino acid transport system for b-alanine and taurine
Monocarboxilic acid transport system for lactate and short-chain fatty acids
Choline transport system for choline and thiamine
Amine transport system for mepyramine
Nucleoside transport system for purine bases such as adenine and guanine
Peptide transport system for small peptides such as enkephalins
Drugs can be modified to increase their affinity for a specific carrier system to increase
their BBB penetration through an endogenous approach. The drug Levodopa, an
exogenous precursor of dopamine, is transported this way. Levadopa has a high affinity

32
for the large neutral amino acids system, and is decarboxylated to dopamine once
inside the BBB.
Another mediated transport system, receptor-mediated transcytosis (Figure 1-2D),
allows the transfer of other essential molecules, such as hormones and lipoproteins,
into the brain. A protein or antibody that is transported this way under normal conditions
may be conjugated to the drug of interest to facilitate its transport through the BBB.
Various enzymes, growth factors and neurotrophic factors have been delivered to the
brain by targeting the transferrin receptor (Zhang and Pardridge, 2005), a transporter for
an essential protein needed for iron delivery to cells, the human insulin receptor
(Coloma et al., 2000; Pardridge, 2003a), and the low-density lipoprotein receptor related
proteins (Spencer and Verma, 2007; Demeule et al., 2008; Karkan et al., 2008).
Alternatively, drugs can also be encapsulated by a delivery system recognized by
specific receptor involved in membrane transport. Polymer nanoparticles and liposomes
have been the delivery system most studied, but dendrimers, micelles, carbon
nanotubes, emulsions, solid lipid nanoparticles, and nanostructured lipid carriers have
are also being developed (Hughes, 2005). These carriers can be targeted to a specific
receptor or delivered to the brain via adsorptive mediated transcytosis (Fig 1-2E), the
vesicular endocytosis of charged substances (Agyare et al., 2008).
It is important to note that the kinetics, structural binding requirements, and in-vivo
activity post modification must be considered when using BBB transporter proteins.
Certain drugs do not retain their pharmaceutical function following transformations, and
dissociation from receptors may be challenging if there is high binding affinity
(Gabathuler, 2010). Furthermore, an essential point to note is that peripheral organs

33
express these proteins as well; therefore, systemic toxicity remains a concern for all of
these strategies.
Passage Behind the BBB
As described so far in this section, there have been many advances in drug design
that show potential in treating CNS diseases. However, the risk factors associated with
the successes to date have prompted researchers to pursue another class of strategies
that do not rely on the cardiovascular system. Drug manipulation is not necessary
because the following methods are geared toward circumventing the BBB altogether.
The result is higher concentrations within the CNS without the risk of systemic side
effects. However, any type of intracerebral drug delivery involves navigation through the
extracellular space (ECS), which makes up 15-25% of the CNS tissue volume (Sykova,
1997a). The ECS can slow or facilitate the movement of various substances in the CNS,
and is thus an important factor in drug distribution. The next section describes the ECS
in more detail and is followed by a description of several approaches for drug delivery
directly into the CNS.
Extracellular space
The ECS is a system of interconnected channels that is occupied by interstitial
fluid and extracellular matrix components. Extracellular matrix components include
glycosaminoglycans (e.g. hyaluronate), glycoproteins, and proteoglycans, which provide
structural support, regulate intercellular communication, and bind proteins. Various
extracellular matrix adhesion molecules have also been described, such as fibronectin,
tanescin, and laminin (Thomas and Steindler, 1995). Interstitial fluid is essentially the
same as CSF, but local ionic changes occur as a result of neuronal activity. Interstitial
fluid also contains metabolites (glucose, O2, CO2, HCO3-), free radical scavengers,

34
amino acids, catecholamines, neurotransmitters, DNA, RNA, peptides, lipids, hormones,
growth factors, cytokines, chemokines, and various enzymes. The membranes,
macromolecules, and charged particles in the ECS, together with neuronal and glial cell
processes, all affect the size and shape of ECS channels. Irregular geometry of these
channels can slow or facilitate the movement of various substances in the CNS,
including the transport of exogenous drugs.
The macroscopic properties of the ECS are described by volume fraction and
tortuosity. The volume fraction is the quotient of the volume of the ECS and the total
tissue volume. The volume fraction in a normal isotropic region of the brain is estimated
to be 0.2, i.e., the ECS makes up approximately 20% of brain tissue (Van Harreveld,
1972; Fenstermacher and Kaye, 1988). Tortuosity is another ECS parameter that
quantifies how much the diffusion of molecules is hindered in tissue compared to free
medium. Tortuosity in homogenous and isotropic brain regions is about 1.6, but larger
molecules (with relative molecular mass above 10kDa) generally exhibit larger tortuosity
(Nicholson and Sykova, 1998). Heterogeneity in tortuosity is often tested by measuring
diffusion along three orthogonal axes. A difference in tortuosity along different axes
indicates anisotropy.
Within the hippocampus, both volume fraction and tortuosity have shown
considerable regional variation, implying the ECS is not a fixed volume, but varies
among the hippocampal subfields. These parameters exhibit lower values in CA1 as
compared to CA3 and dentate gyrus, specifically in stratum pyramidale as compared to
other strata (McBain et al., 1990; Perez-Pinzon et al., 1995). Within stratum radiatum,
isotropic tortuosity is present along medio-lateral and antero-posterior directions, but is

35
increased along the dorso-ventral axis depending on the distance from stratum
pyramidale (Mazel et al., 1998; Hrabetova, 2005). Local differences in ECS parameters
may be a result of varying distances between cellular membranes, diffusion barriers in
the extracellular matrix, or differential sizes of cell bodies or processes in each region
(McBain et al., 1990). For instance, the pyramidal cell layer is more tightly packed in
CA1 than CA3; CA3 cells (300-700 µm2) are larger than those in CA1 (~193 µm2); and
the massive associational network which is so apparent in CA3 is largely missing in
CA1 (Amaral and Lavenex, 2007). The decrease in CA1 volume fraction may be due to
overall homogenously smaller intercellular channels or it may reflect heterogenous
channels that are on average smaller. The latter is supported by measurements taken
of gaps between cells, which range from 38-64 nm in width, with uneven distentions in
some regions as compared to others (Brightman, 1965; Van Harreveld et al., 1965;
Bondareff and Pysh, 1968; Cragg, 1979). However, histological fixation in older
morphological studies may have resulted in artificial narrowing in some regions
(Hrabetova and Nicholson, 2007).
While the shape and size of cells and their processes create obstacles that
diffusing molecules have to circumnavigate, it is not clear how these and other elements
in the brain increase or decrease ECS parameters. Changes in volume fraction and
extracellular tortuosity are often independent. Osmotic or ischemic insults result in
reduction of the volume fraction and a rise in tortuosity, presumably due to cellular
swelling (Sykova et al., 1994; Perez-Pinzon et al., 1995; Hrabetova and Nicholson,
2000). Inflammatory and demyelinating diseases result in an increase in volume fraction
and a decrease in tortuosity, perhaps due to an increase in blood-brain barrier

36
permeability (Simonova et al., 1996). However, during astrogliosis, a persistant increase
in tortuosity without a decrease in volume fraction has been found (Sykova et al.,
1999a). The converse has also been observed. Seizure activity, which induces large
increases in extracellular potassium (Dietzel et al., 1980; Dietzel et al., 1989), results in
subsequent water movement into surrounding cells and thus a reduction in extracellular
volume fraction, but not necessarily a change in tortuosity (McBain et al., 1990).
There remain many unknowns regarding what elements change ECS parameter
and how these parameters affect spread and clearance mechanisms of the brain.
Moreover, although pathological insults have been associated with changes in ECS and
extracellular matrix, the ability of ECS to bind, slow, or facilitate the migration of
substances remains an open question. However, the heterogeneity of ECS architecture
does affect intercellular communication, nutrient and metabolite trafficking (McBain et
al., 1990; Sykova, 1997b; Nicholson and Sykova, 1998; Sykova and Nicholson, 2008),
and potentially, as is described in the rest of Chapter 1, drug delivery in the brain.
Intracerebroventricular/intrathecal delivery
In intracerebroventricular (ICV) administration, drug is introduced directly into the
cerebrospinal fluid (CSF). Theoretically, when drugs are infused directly into the CSF,
not only is systemic toxicity reduced, but the drugs have longer half-lives due to
decreased protein binding and enzymatic activity relative to drugs in plasma. High local
concentrations of drug have been administered into the CSF with the Ommaya
reservoir, a plastic reservoir implanted subcutaneously in the scalp and connected to
the ventricles within the brain via an outlet catheter (Ommaya, 1963). Pumps have
similarly been used to elevate drug concentrations in the CSF (Bakhshi and North,
1995). In 2006, continuous ICV infusions of valproic acid were compared to bolus ICV

37
injections and intraperitoneal (IP) injections in a rat kindling model of epilepsy (Serralta
et al., 2006). The ICV bolus injection resulted in the highest concentrations of VPA in
the brain, but all three methods were able to control generalized and focal seizures. The
ICV infusion was the only one to achieve anticonvulsant effects with minimal toxicity. In
2007, Oommen et al. researched the effectiveness on a osmotic pump delivering
gabapentin on flurothyl induced seizures in rats and found delivery delayed onset of
generalized tonic-clonic seizures (Oommen et al., 2007). Despite these favorable
results, ICV delivery is still plagued by diffusion. Solutes within CSF must diffuse into
brain parenchyma, a slow process in which concentration decreases logarithmically with
each millimeter of brain tissue (Blasberg et al., 1975). The ECS of the brain is extremely
tortuous, so drug diffusing from ventricles into this space is very slow and inversely
proportional to the molecular weight of the drug (Pardridge, 1997). Although some
molecules have been effectively distributed through intracerebroventricular (ICV)
injection (Barcia and Gallego, 2009), in general, drug distribution from CSF into
parenchyma is log orders slower than CSF clearance (and clearance of drugs infused
into CSF) from the brain (Pardridge, 2005, 2007). ICV injection has been useful in cases
where high drug concentrations in the CSF or immediately adjacent parenchyma are
desired (Harbaugh et al., 1988).
Intracerebral delivery
The most direct way of administering drug to a specific area in the brain is to
deliver it directly to the brain interstitium. Like ICV injections, this method can yield high
concentrations and minimal systemic exposure without the limitation the BBB poses to
size or chemical properties of therapeutic agents. Additionally, direct targeting of the
38
seizure focus is more desirable due to the drop of drug concentration from the distance
of the implant or injection site (Saltzman and Olbricht, 2002).
Implantable polymers. Implantation of biocompatible sustained-release polymers
is a strategy employed to bypass the BBB. A drug can be loaded into these polymers
and diffuse into the surrounding tissue at a controllable rate. For non biodegradable
polymers such as ethylene vinyl acetate copolymer (EVAc), the rate of drug diffusion
into surrounding tissue is dependent on the loaded agent. For biodegradable polymers,
such as the polylactic-co-glycolicacid (PLGA) family, the release of drug is dependent
on the diffusivity of the macromolecule and the degradation rate of the polymer (Luo et
al., 1999). This method has been shown to release drugs successfully, but it still relies
on diffusive transport, which yields a concentration profile drop-off and is dependent on
molecular size.
Convection-enhanced delivery. Convection-enhanced delivery (CED) is an
approach developed to overcome the obstacles in diffusion-dependent central nervous
system (CNS) delivery methods. CED was first described by Bobo et al. (1994) as a
local drug-delivery technique that uses a small hydrostatic positive-pressure gradient to
deliver infusate directly into parenchymal interstitial space. Because CED relies on bulk
flow, it can overcome slow diffusivity and result in a more widespread distribution
volume as compared with diffusion-based approaches. When transport is dominated by
diffusion, a large concentration gradient develops from the site of infusion to the
margins of the distribution volume as drug molecules move passively from regions of
high to low concentration. In contrast, CED provides a uniform concentration throughout
the region with a sharp drop-off in concentration at the borders (Rogawski, 2009).

39
Dispersion of agents is powered by gradients of pressure in addition to gradients of
concentration. As a result, convection-driven flow overcomes slow diffusivity and can
result in a larger volume of distribution as compared with other diffusion-based drug
delivery methods (for review, see (Raghavan et al., 2006)). Furthermore, CED is
generally independent of molecular size (Bobo et al., 1994; Sampson et al., 2011) as
long as macromolecules are within the ECS width of CNS tissues (38-64 nm, (Thorne
and Nicholson, 2006)). Previous studies have demonstrated intracranial CED into either
white or gray matter can be used to distribute small or large molecular weight molecules
in a homogenous, targeted, and safe manner (Bobo et al., 1994; Chen et al., 1999).
Underlying the success of CED as a therapeutic drug delivery system is a good
understanding of the principles governing delivery and flow of macromolecules within
the CNS. There are several known factors affecting the final distribution of infusate in
the brain. Firstly, infusion pump parameters, such as flow rate and duration of infusion,
will affect the inflow of the solution. Because infusate is delivered into the ECS,
transport is dominated by convection and controlled through the flow rate, duration, and
pressure of the infusion (Raghavan et al., 2006). Secondly, certain infusate properties
have a significant impact on distribution. These properties include viscosity
(Jagannathan et al., 2008), surface properties, (Chen et al., 2005), particle charge
(Saito et al., 2006), and particle coating (MacKay et al., 2005). Backflow of the infusate
along the infusion cannula can also affect distribution. Backflow may be a result of
tissue disruption along the catheter track, allowing the infusate to flow into low-
resistance spaces (Guarnieri et al., 2005), or the pressure from the infusion may push
the tissues away from the catheter, defined as intrinsic backflow (Morrison et al., 1999).

40
Backflow is an important issue to take into account because it can result in the spread
of infusate into unintended regions and diminish the dose needed within the target
tissues (Figure 1-3). This problem is addressed by using thinner catheters (Lonser et
al., 2002), step-design catheters (Krauze et al., 2005), and guidelines for catheter
placement in humans (Raghavan et al., 2006) and animals (Kim et al., 2009; Astary et
al., 2010). These guidelines will be further addressed in Chapter 2.
CED for epilepsy. CED has already been proposed as a novel therapeutic
therapy to treat epilepsy (Rogawski, 2009) and continues to show promise. AEDs
currently prescribed and developed are limited to orally-active or BBB-permeable
agents. CED is applicable to a wide variety of potential anti-epileptic drugs since it does
not require passage through the BBB. CED can be used deliver anticonvulsant or
neuroprotective peptides and other high molecular weight molecules that have already
shown promise as epilepsy treatments experimentally (McLaughlin et al., 2000;
Haberman et al., 2003; Richichi et al., 2004). An example of CED delivery of novel
therapeutic agents can be seen in Figure 1-4.
While CED for epilepsy remains experimental, several studies have already shown
the feasibility of undertaking it for epilepsy treatment (Stein et al., 2000; Heiss et al.,
2005; Gasior et al., 2007). CED has also been used clinically in malignant glioma
(Voges et al., 2003), growth factor (Gill et al., 2003), and gene therapy vector (Marks et
al., 2008) delivery studies. With the high drug concentrations that can be achieved at
specific sites, CED has a wide range of applications in the field and treatment of
epilepsy. However, the efficacy of the procedure at this stage remains poorly
determined partly due to the heterogeneity of drug distribution and the effect of edema

41
on interstitial transport. More detailed knowledge about the anatomical and biophysical
features of the brain is necessary for optimization of delivery into complex or injured
brain regions. This topic is the focus of Chapter 2 and Chapter 3.

42
Figure 1-1. The epilepsies are classified based on etiology, semiology, origin of seizures, and epilepsy syndromes. Two systems of classification of epilepsies are in use today. A) The International League Against Epilepsy (ILAE) developed the first system based on seizure semiology in 1981. B) ILAE developed the second system based on epilepsy syndromes in 1989.

43
Figure 1-2. Schematic of the various routes of molecular transport across the BBB. These pathways can be exploited to transport biochemically-altered drugs from the systemic circulation into the brain. A) Small water-soluble agents travel through tight junctions connecting endothelial cells. B) Small, lipophilic molecules diffuse through endothelial cell membranes. C) Carrier-mediated transport systems are available for specific molecules such as amino acids, peptides, nucelosides, glucose, etc. D) Receptors are expressed for the transport of transferrin, insulin, lipoproteins, and other molecules that are actively transported across the BBB. E) Adsorptive transcytosis involves nonspecific binding of charged ligands, such as albumin, to membrane surface charges followed by endocytosis.

44
Figure 1-3. Final CED distribution with and without backflow of an MR contrast agent tagged with a fluorescent tracer in the rodent septal hippocampus. A,C) During successful CED, the tracer (A, red fluorescence) and contrast agent (C) travel along the contours of the hippocampal laminar structure. B,D) When backflow occurs, much of the infusate travels away from the targeted site into white matter tracks, or other low resistance pathways. EB = Evans blue dye; DAPI = 4',6-diamidino-2-phenylindole nuclear counterstain; DG = dentate granule cells; CA3 = Cornu Ammonis hippocampal subfield 3; CA1 = Cornu Ammonis hippocampal subfield 1; CC = corpus callosum.
Figure 1-4. Lentivirus and neural stem cells targeted to the septal hippocampus via CED. A) Lentiviral transduction of CAMKII-ChR2/YFP in CA1 pyramidal cells and dentate granule cells. B) Engraftment of neural stem cells expressing GFP in the CA1 subfield of the septal hippocampus. Counterstained with DAPI, 4',6-diamidino-2-phenylindole nuclear counterstain.

45
CHAPTER 2
CONVECTION-ENHANCED DELIVERY IN THE NORMAL RAT HIPPOCAMPUS
Introduction
Current CED research focuses on evaluating the efficacy of drug carriers,
optimizing infusion parameters and infusion hardware (e.g. flow rate and duration,
cannula design), and understanding the influence of the underlying tissue structure on
the final distribution of the infused agent in the CNS (Raghavan et al., 2006; Sampson
et al., 2007b; Jagannathan et al., 2008; Song and Lonser, 2008). With sufficient
understanding of the controlling influences, CED might be used to target local delivery
of therapeutics into complex regions of the brain with heterogeneous and intricate
neuroanatomy. One such structure is the hippocampus, which is comprised of densely
packed layers of neurons (gray matter), and their axonal projections (white matter) in a
tightly-rolled, banana-shaped structure. In addition, the hippocampus includes
perivascular spaces and pial surfaces that line the ventricular compartments continuous
with hippocampal fissures. The hippocampus is vulnerable to damage as a result of
trauma (Tate and Bigler, 2000) and is the central component of rare conditions such as
limbic encephalitis (Corsellis et al., 1968) and dementia with isolated hippocampal
sclerosis (Dickson et al., 1994). Hippocampal involvement is critical to the manifestation
of TLE (Bertram, 2009), and has been recognized in co-morbidities of epilepsy, such as
schizophrenia (Maier et al., 1995; Nelson et al., 1998) and Alzheimer’s disease
Parts of this chapter are reprinted with permission from Elsevier from Astary GW, Kantorovich S, Carney PR, Mareci TH, Sarntinoranont M (2010) Regional convection-enhanced delivery of gadolinium-labeled albumin in the rat hippocampus in vivo. J Neurosci Methods 187:129-137.
This work was made possible by the collaboration with Dr. Garrett Astary. Dr. Astary helped with the infusions and distribution analysis, and performed the MR imaging and image segmentation described in this chapter.

46
(deToledo-Morrell et al., 2007; Ohm, 2007; Duyckaerts et al., 2009). If the CED
distribution of a therapeutic agent within the hippocampus can be predicted, this may
enable the application of CED to the treatment of TLE and other hippocampal disorders.
However, accurate prediction of distribution profiles in the hippocampus requires an
understanding of how the underlying tissue architecture influences transport of a
delivered agent.
With the use of contrast agents, magnetic resonance (MR) imaging provides a
means of non-invasively monitoring distribution profiles of agents delivered by CED and
can provide insight into the influence of anatomy on tracer distributions. Typically,
gadolinium-based contrast agents are used, which contain a paramagnetic center that
interacts with surrounding water to reduce the longitudinal and transverse relaxation
times (Lauffer et al., 1987). In a relaxation-weighted image, the reduced longitudinal
relaxation times (T1) result in a higher signal in regions of tissue exposed to the contrast
agent, provided transverse relaxation times (T2) are not substantially reduced. MR can
also be used to monitor CED by observing an increase in water signal seen in T2-
weighted images (Heiss et al., 2005). Gadolinium-based contrast agents have been co-
infused with therapeutic agents to track their distribution in real-time. Co-infusion of
glucocerebrosidase and diethylene triamene penta-acetic acid chelated gadolinium (Gd-
DTPA) into the region of the right facial and abducens nuclei was used to treat a patient
with Gaucher’s disease and allowed researchers to monitor the distribution of the agent
as well as observe the agent cross a pial surface to enter the third ventricle (Song and
Lonser, 2008). Other studies have also been performed to investigate the effect of pial
surfaces on final distribution volumes of small molecular weight (Gd-DTPA) and large

47
molecular weight (Gd-DTPA-bound albumin (Gd-albumin)) tracers infused into the
primate brainstem (Jagannathan et al., 2008). As a free ion, gadolinium is highly toxic
but is regarded as safe when administered as a chelated compound. Gd-DTPA has
been used in animal and human CNS studies, without showing signs of toxicity (Song
and Lonser, 2008; Ding et al., 2009); however, it has been shown to have an adverse
affect on patients with pre-existing kidney disease (Abujudeh et al., 2009). Liposomal
drug carriers containing Gd have also been synthesized to provide a more direct
method of monitoring the distribution of these therapeutic agent carriers (Krauze et al.,
2008; Fiandaca et al., 2009). MR has been used to monitor the distribution of these
delivery vehicles as well as evaluate the performance of backflow-resistant cannulae
(Fiandaca et al., 2009). MR has also been used to evaluate the effect of infusate
viscosity on final distribution volumes in rat brain striatal tumors (Mardor et al., 2009).
However, no previous studies have implemented high-resolution MR to investigate CED
for delivering an agent into a structure as complex as the hippocampus.
In addition to MR, histology has also been used to evaluate tracer distribution of
agents infused into the CNS. Light microscopy was used to detect the presence of
Evans blue dye infused into the striatum of a mouse brain via an implantable
microfluidic device designed for chronic CED (Foley et al., 2009). Fluorescence
microscopy has been used to observe the distribution of polyethylene glycol-coated
liposomal doxorubicin infused into the rat brain parenchyma with an intracranial tumor
(Kikuchi et al., 2008). Not only can histology provide higher-resolution visualization of
distribution at the cellular level, but histological staining protocols can verify particular
structural details that may influence distribution.

48
This chapter describes the effect of tissue structure on infusate distributions after
CED and limited diffusion in the hippocampus of normal animals. Final distribution
patterns of the MR contrast agent, Gd-albumin, labeled with Evans blue dye, infused
into the left-side septal and right-side temporal hippocampus of a rat were evaluated
with two currently available imaging modalities: (1) in vivo imaging of contrast agent
distribution using high resolution MR imaging and (2) fluorescence microscopy of the
distribution of Evans blue in histological slices. Gd-albumin is an ideal model for
macromolecular flow through the interstitial space due to low reactivity, convection-
dominated transport, and ease of labeling with contrast agent. MR provided a means of
non-invasively monitoring distribution profiles of contrast agents delivered by CED in
vivo, while optical microscopy yielded higher resolution of finer structural detail. Black-
gold staining was used to label myelinated white matter structures, and Cresyl violet
staining was used to visualize cell bodies. The results of this study demonstrate the
influence of infusion site and normal hippocampal structure on CED delivery.
Methods
Animal Preparation and Surgical Procedures
Experiments were performed on 2.5-month old male Sprague-Dawley rats (n = 7)
using protocols and procedures approved by the University of Florida Institutional
Animal Care and Use Committee. Anesthesia was initiated with xylazine (10 mg/kg, SQ)
and isoflurane (4%) in 1 L/min oxygen, then animals were placed in a stereotaxic Kopf
apparatus, and inhalation anesthesia (1.5% in 1.5 L/min oxygen) was delivered via a
nose mask. The skull was exposed by a mid-sagittal incision that began between the
eyes and extended caudally to the level of the ears to expose bregma and lambdoidal
sutures. One hole was drilled into the skull above the left-side septal hippocampus and

49
a second hole was drilled above the right-side temporal hippocampus. Then 5.0 µL of
Gd-DTPA-albumin (10 mg/mL in PBS solution; MW ~ 87 kDa,; ~35 Gd-DTPA molecules
per albumin molecule; R. Brasch Laboratory, University of California, San Francisco,
CA), tagged with Evans Blue dye was infused into the septal dentate gyrus of the
hippocampus [-3.7mm AP, -2.2mm ML, -3.4mm DV] and another 5 µL into the temporal
CA1 subregion of the hippocampus [-5.0mm AP, 4.9mm ML, - 5.0mm DV] at a rate of
0.3 µL/min. Over concerns that the Gd-albumin may be aggregating, high performance
liquid chromatography (HPLC) was used to evaluate the macromolecular constituents of
the infusate solution. HPLC resulted in a single elutant peak suggesting the Gd-albumin
was not aggregating and the covalent bonds attaching the Gd-DTPA molecules to
albumin were intact.
The infusion system consisted of a 100 μL gas-tight syringe (Hamilton, Reno, NV)
driven by a syringe pump (Cole-Parmer, Vernon Hills, IL) connected to
polyaryletheretherketone (PEEK) tubing (ID = 0.381 mm, OD = 0.794 mm, length ~ 0.5
m, Upchurch Scientific, Oak Harbor, WA). The PEEK tubing was coupled to a silica
cannula (ID = 50 µm, OD = 147 µm, Polymicro Technologies, Phoenix, AZ) via a
microfluidic connector. Immediately following the infusion surgery (~30 min), animals
were transported to the 11.1 Tesla (T) magnet for MR imaging.
At the end of the experiment, animals under inhalation anesthesia (1.5% in 1.5
L/min oxygen) were given xylazine (10 mg/kg, SQ) and ketamine (80 mg/kg, IP). Upon
ensuring deep anesthesia, the chest activity was opened to expose the heart, and a
needle connected to an infusion pump was inserted into the left ventricle. 200-300 mL of
0.9% saline solution was circulated by the heart, followed by 200-300 mL of 4%

50
formaldehyde solution. The brain was then extracted from the skull following
decapitation and stored in 4% formaldehyde solution overnight.
MR Imaging and Image Segmentation
MR experiments were performed using a Bruker Avance imaging console (Bruker
NMR Instruments, Billeria, MA) connected to a Magnex Scientific 11.1 T horizontal bore
magnet system (Varian, Inc., Magnex Scientific Products, Walnut Creek California). A
custom-made 130 degree arc, 3.5 cm rectangular linear-field surface coil constructed on
a 4 cm diameter half-cylinder was used for linear transmission and detection of MR
signal. Two sets of high-resolution T1-weighted images, with slices oriented in the
coronal and sagittal directions, were acquired using a spin-echo sequence with a 2 cm ×
2 cm field-of-view in a matrix of 160 × 160, recovery time of 1000 ms, echo time of 10
ms and 20 slices, slice thickness 500 μm. Coronally-oriented and sagittally-oriented
data were acquired with 8 averages and 6 averages respectively.
Final distribution volumes of Gd-albumin were calculated by performing semi-
automatic image segmentation on the high-resolution T1-weighted coronal images
using the ITK-SNAP open-source medical image segmentation tool ((Yushkevich et al.,
2006); http://www.itksnap.org/). Septal and temporal hippocampus infusion volumes
were segmented separately with the following specific threshold criteria. Voxels were
included in the infusion volume if their signal intensity was at least 6 standard deviations
higher than the signal intensity in the corresponding region contralateral to the site of
infusion. Final distribution volumes in the septal and temporal hippocampus were
calculated by counting the number of voxels included in each segmented region and
multiplying by the volume of a single voxel.

51
Histology
Black Gold was used to stain myelin in mounted sections. Black-Gold II powder
(Histo-Chem Inc., Jefferson, AR) was resuspended in saline solution (0.9% NaCl) to a
final concentration of 0.3%. The solution was heated to 60°C, and rehydrated tissue
sections were incubated for 12-18 minutes, until desired intensity was achieved. The
sections were then rinsed in double distilled water for 2 minutes, followed by sodium
thiosulfate solution (1%) for 3 minutes. Finally, sections were rinsed three times with
double distilled water for 5 minutes per rinse.
Cresyl violet staining was performed to stain cell bodies in mounted sections.
Slides were incubated in Cresyl violet solution for 2-3 minutes until desired intensity was
achieved. Slides were then dehydrated using a series of gradated alcohols (75%, 95%,
100%) for 5 minutes each. The dehydrated sections were then cleared in xylene for 2
minutes and cover-slipped with mounting media.
Microscopy
Following mounting and staining, slides were examined on an Olympus BH-2
brightfield and epifluorescence microscope (Olympus America Inc., Center Valley, PA)
with a Hitachi KP-D581 color digital video camera (Hitachi Medical Systems America,
Inc., Twinsburg, OH) interfaced with an Integral Technologies frame grabber (Pelco,
Clovis, Ca) in a desktop computer. Motorized stage and focus (Prior Scientific,
Rockland, MA), and image acquisition were controlled through ImagePro Plus (Media
Cybernetics, Silver Springs, MD). Anatomical structures were mapped to coronal
sections of the Paxinos and Watson rat brain atlas (Paxinos, 1998).

52
Results
Infusion Site
Infusions (n=14) were targeted into the dentate gyrus of the left-side septal
hippocampus (n=7) and into the right-side CA1 of the temporal hippocampus (n=7).
Actual infusion sites were confirmed with MR and histology. Damage due to insertion of
the cannula was minimal with some bleeding at the site of the cannula tip (Figure 2-1A)
and at the interface between the corpus callosum and alveus of the hippocampus
(Figure 2-1B), as visualized with histology. Contrast agent infused into the septal
hippocampus was observed to have only limited penetration into the ipsilateral temporal
hippocampus (Figure 2-2A,C). Similarly, contrast agent infused into the temporal
hippocampus showed severely limited penetration into the ipsilateral septal
hippocampus (Figure 2-2B,D) with small amounts observed in the fimbria.
Infusion sites were clearly identifiable in all subjects in the septal hippocampus
and 6 of the 7 subjects in the temporal hippocampus. In the septal hippocampus
infusions, 6 of 7 infusion sites were located in stratum radiatum of the CA1 subfield of
the hippocampus. One infusion site was located in the polymorphic layer of the dentate
gyrus. In 4 of 7 temporal hippocampus infusion subjects, the infusion site was located in
stratum radiatum of the CA1 subfield of the hippocampus. In 2 of the subjects, the
infusion site was determined to be in stratum oriens of the CA1 subfield of the
hippocampus.
Gd-albumin Distribution in the Septal Hippocampus
The profile of the contrast agent distribution into the septal hippocampus was
easily distinguishable from surrounding tissue. Exposed regions displayed a
hyperintense signal with respect to surrounding regions in T1-weighted images (Figure

53
2-3). MR images showed that the contrast agent entered the CA1, CA3 and dentate
gyrus subfields of the hippocampus in all animals (Figure 2-3) and suggest that contrast
agent penetrated poorly into the dense dentate gyrus granule cell layer and CA1
pyramidal cell layer. These regions remain hypointense with respect to the surrounding
subfields and are clearly distinguishable in coronal images (arrowheads in Figure 2- 3).
The contrast agent was seen to cross the midline of the brain in 3 of the 7 subjects. In
two of these subjects, the contrast agent crossed the midline of the brain by entering the
corpus callosum and traveling medially to the side of the brain contralateral to the
infusion site. In one subject, the contrast agent also entered the septal hippocampal
commissure and was visible in a small portion of the CA1 subfield of the contralateral
hippocampus. Contrast agent penetration into the fimbria subfield of the hippocampus
was not seen in any of the subjects suggesting the densely packed cell layer CA1 and
CA3 subfields served as a barrier to transport into this region (Figure 2- 3).
Gd-albumin Distribution in the Temporal Hippocampus
The contrast agent penetrated the CA1 and CA2 subfields of the temporal
hippocampus in all subjects. In 5 of 7 subjects, contrast agent was seen in the dentate
gyrus, CA1, CA2, and CA3 subfields of the hippocampus (Figure 2-4B,C,E-F). However
in two of the subjects, penetration of the contrast agent into CA1 and CA2 was limited
and primarily located in the alveus of the hippocampus (Figure 2-4G,H), most likely due
to the lateral location of the infusion site (see above “Infusion Site” results section). The
contrast agent did not appear to enter the granule cell layer and hippocampal fissure,
since these regions were hypointense relative to the neighboring dentate gyrus.
Contrast agent was also observed at the interface between the corpus callosum and the
cortex in these subjects.

54
Backflow
Severe backflow, resulting in a significant amount of contrast agent entering the
cortex, was seen in 3 of the 7 septal infusions (Figure 2-3C,E,F). Mild backflow resulted
in minor exposure of the cortex to contrast agent in 2 of the 7 subjects (Figure 2-3D,H).
In 3 of the 7 subjects, backflow allowed the contrast agent to enter the corpus callosum
and travel in both the medial and lateral directions along this white matter fibrous
structure (Figure 2-3B,C,F).
Severe backflow in temporal infusions resulted in significant amounts of the
contrast agent entering the cortex in 3 of the 7 subjects (Figure 2-4B,C,E). Minor
backflow was observed in 3 of the 7 subjects (Figure 2-4D,F,G) and no backflow was
seen in 1 subject (Figure 2-4H). In cases of minor backflow, contrast agent did not enter
the cortex and remained in the hippocampus, usually penetrating the alveus of the
hippocampus.
Image Segmentation
The three dimensional contrast agent distributions were visualized with a semi-
automated segmentation of the contrast agent enhanced regions. Because MR imaging
was conducted approximately 30 minutes after CED, the observed distribution profiles
include the effects of CED as well as post-CED diffusion. Distribution volumes, including
the effects of CED and diffusion, were calculated from the segmentations for each data
set and included back flow volumes. For the septal hippocampus infusion, the mean
and standard deviation of the calculated distribution volume was 23.4 ± 1.8 μL. For the
temporal hippocampus infusion, the mean and standard deviation of the calculated
distribution volume was 36.4 ± 5.1 μL. The temporal hippocampus distribution volume
was greater than the septal hippocampus distribution volume (p ≤ 0.0003, power of test

55
= 0.99). The contribution of diffusion after the end of CED to the measured distribution
volumes was estimated using an analytical solution of one-dimensional diffusion from a
sphere. The radius of the sphere was determined such that the volume of the sphere
would be equal to distribution volumes of the contrast agent in the septal and temporal
hippocampus. The diffusion coefficient of albumin in rat cortical slices, D = 1.63 × 10⁻⁷
cm2/s (Tao and Nicholson, 1996), was used in this estimation. Based on these results
we estimate that diffusion after the end of CED may increase distribution volumes up to
40%. This diffusional spread is equivalent to the contrast agent traveling 2-3 voxels
(0.250-0.375 mm) during the time-delay between CED and MR imaging (for
comparison, the average anterior-posterior spread of the tracer was measured to be 5.4
mm for septal infusions and 4.75 mm for temporal infusions).
Histological Analysis
Evans blue fluorescence confirmed the distributions seen in MR imaging. Dense
cell layers that appeared hypointense in MR images likewise did not fluoresce in
histological images (arrowheads, Figure 2-5 and 2-6), indicating little or no penetration
of the infusate. However, infusate was seen to distribute around the dense cell layers
then penetrate the dentate gyrus and CA1-CA3 subregions in all septal infusions and 5
of 7 temporal infusions, which is consistent with MR results. Preferential distribution was
dependent upon location of the cannula tip. When the cannula tip was located in the
interface between the CA1 and hippocampal fissure (asterisks, Figures 2-5 and 2-6),
fluorescence was greatest in the molecular layer of the dentate gyrus and CA1
immediately adjacent to the hippocampal fissure. In one subject (Figure 2-3D), the
cannula tip was in the polymorphic layer of the dentate gyrus, which resulted in a larger
volume of contrast agent accumulated internal to the dentate gyrus granule cell layer.
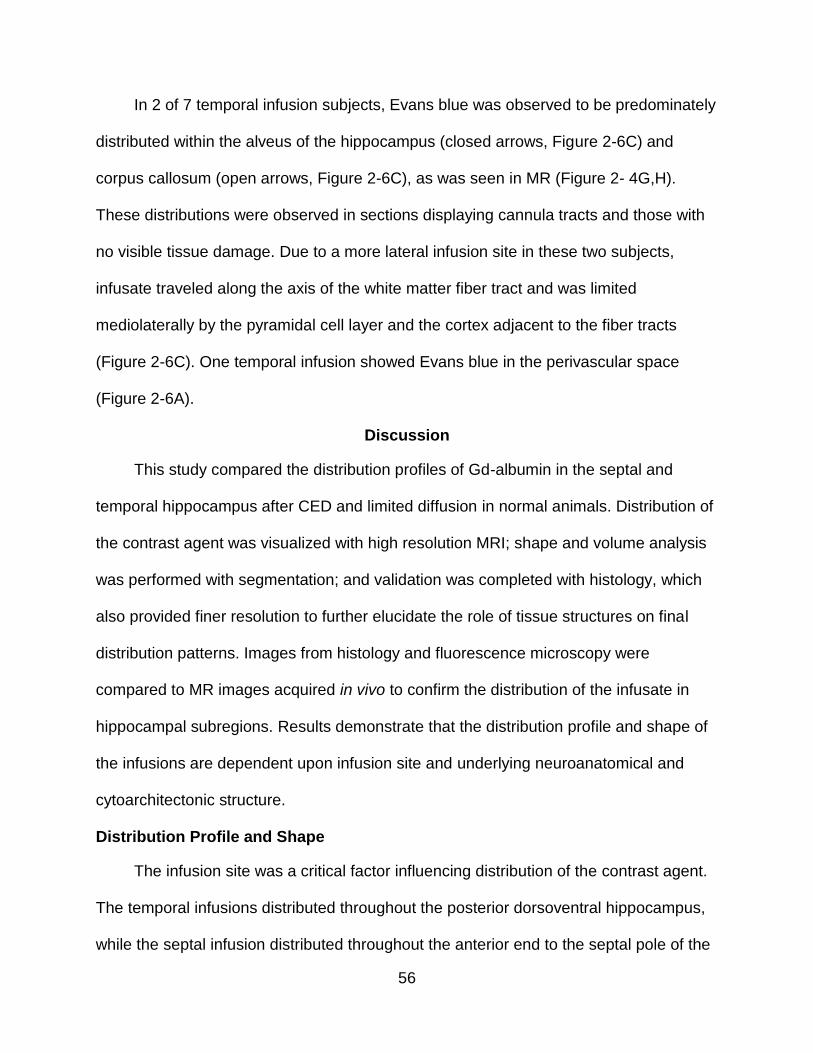
56
In 2 of 7 temporal infusion subjects, Evans blue was observed to be predominately
distributed within the alveus of the hippocampus (closed arrows, Figure 2-6C) and
corpus callosum (open arrows, Figure 2-6C), as was seen in MR (Figure 2- 4G,H).
These distributions were observed in sections displaying cannula tracts and those with
no visible tissue damage. Due to a more lateral infusion site in these two subjects,
infusate traveled along the axis of the white matter fiber tract and was limited
mediolaterally by the pyramidal cell layer and the cortex adjacent to the fiber tracts
(Figure 2-6C). One temporal infusion showed Evans blue in the perivascular space
(Figure 2-6A).
Discussion
This study compared the distribution profiles of Gd-albumin in the septal and
temporal hippocampus after CED and limited diffusion in normal animals. Distribution of
the contrast agent was visualized with high resolution MRI; shape and volume analysis
was performed with segmentation; and validation was completed with histology, which
also provided finer resolution to further elucidate the role of tissue structures on final
distribution patterns. Images from histology and fluorescence microscopy were
compared to MR images acquired in vivo to confirm the distribution of the infusate in
hippocampal subregions. Results demonstrate that the distribution profile and shape of
the infusions are dependent upon infusion site and underlying neuroanatomical and
cytoarchitectonic structure.
Distribution Profile and Shape
The infusion site was a critical factor influencing distribution of the contrast agent.
The temporal infusions distributed throughout the posterior dorsoventral hippocampus,
while the septal infusion distributed throughout the anterior end to the septal pole of the

57
hippocampus. In addition, infusion into the septal target site resulted in a smaller
distribution area compared to the temporal site and an apparent disconnect was noted
between septal and temporal hippocampal infusion sites.
Infusion site variability within the septal and temporal hippocampus also influenced
the distribution profile of the infused agent. For the septal hippocampus infusions,
variability (~1 mm) in the cannula placement within the medial-lateral/anterior-posterior
plane had negligible effects on tracer distribution, as observed in both MR and
fluorescence microscopy (Figure 2-3). Although occurring in only one animal, variability
in the depth of the cannula tip seems to have the most impact on final tracer distribution
(Figure 2-3D), which was most apparent in fluorescence imaging (data not shown). In
this subject, the most intense fluorescence signal was seen interior to the granule cell
layer of the dentate gyrus. In contrast, the most intense fluorescence signal was seen
around the hippocampal fissure and CA1 subregion of the hippocampus for all other
subjects. In the temporal hippocampus infusions, variability (~ 1 mm) in the depth of
cannula penetration had little impact on final distributions; however, variability in the
location of the cannula tip in the medial-lateral direction had a significant impact. This is
seen in two subjects where infusions lateral to the targeted infusion site resulted in
tracer distributing entirely within the alveus of the hippocampus and the corpus callosum
(Figure 2-4G,H). Since the infusion sites were stereotaxically targeted using an atlas
developed from a fixed rat brain, deviations between the fixed rat brain and in vivo rat
brain, anatomical variability between rats, and experimental error may contribute to
variability in the infusion site.

58
The dorsoventral disconnect may have several explanations. Since infusions were
only conducted at one volume, it is possible that the volume used was not sufficiently
large enough to distribute throughout the entire hippocampus. Alternatively, anatomical
“sinks” (such as ventricles or the hippocampal fissure) may “capture” a larger volume of
the infusate. The fissure is a cell-free region continuous with ventricular space that is
lined by pia mater and filled with CSF and blood vessels (Humphrey, 1967). It could act
as a mass sink for the contrast agent, especially since Gd-albumin is able to cross pial
boundaries (Jagannathan et al., 2008). Indeed, hyperintense regions were observed in
the MR imaging within and surrounding the hippocampal fissure (Figures 2-3 and 2-4),
and this finding was confirmed with fluorescence imaging (Figures 2-5 and 2-6).
Although this finding may be explained by targeting, a preferential distribution into the
fissure is also seen in images where the cannula tip is not positioned in the fissure
(Figure 2-6), indicating the contrast agent may be following the path of least resistance
and collecting within the hippocampal fissure.
A third explanation for the dorsoventral disconnect may arise from the effect of
differential axonal projections to, from, and between septal and temporal hippocampi.
For example, different densities of projections have been found to the septal and
temporal hippocampus from the entorhinal cortex (Krettek and Price, 1977; Dolorfo and
Amaral, 1998), amygdala (Krettek and Price, 1977), ventral tegmental area, and locus
coeruleus (Haring and Davis, 1985; Verney et al., 1985). Hilar (Fricke and Cowan,
1978) and CA3 projections (Ishizuka et al., 1990; Li et al., 1994) are also coded toward
specific areas of the hippocampus. These axonal structural differences likely underlie

59
functional differences between the septal and temporal hippocampus (Moser et al.,
1993; Jung et al., 1994; Esclassan et al., 2009) and may affect CED distribution.
This study demonstrates that neuroanatomical structure influences CED
distribution of contrast agent at the molecular level. Although contrast agent entered all
subfields of the hippocampus in each subject, limited penetration was observed in the
granule cell layer in the dentate and pyramidal cell layer in the CA3 and CA1. These cell
layers consist of densely-packed excitatory cells that appeared as hypointense regions
in the MR images (arrowheads, Figures 2-3 and 2-4), and displayed weak or no
response to fluorescence imaging (arrowheads, Figures 2-5 and 2-6). Hydraulic
conductivity describes the ease with which a fluid can move through a porous medium.
In the case of densely-packed cell layers, the hydraulic conductivity would be low and
permeation of the infused agent into these regions would be limited. Furthermore, the
pyramidal cell layer in the CA3 of the septal hippocampus appeared to prevent infusate
from entering the fimbria (Figure 2-3), while the CA1 and CA2 pyramidal cells layers
served as a boundary in the temporal hippocampus (Figure 2-4). It is likely that the
contrast agent traveled around these structural boundaries, along the trisynaptic circuit
(Andersen et al., 1969) of the hippocampus. The trisynaptic circuit is comprised of
axonal fibers connecting several subregions of the hippocampus. Preferential directions
of water diffusion have been found to correspond to the average aligned fiber directions
within a voxel (Basser and Jones, 2002). Hence, the hydraulic conductivity along the
direction of these fibers would be lower than that perpendicular to the fiber direction
leading to a preferential distribution along the trisynaptic circuit. However, further

60
studies with in vivo dynamic contrast-enhanced MRI (DCE-MRI) are necessary to
confirm this hypothesis.
It should be noted that other factors may influence the distribution patterns of
agents delivered by CED into the brain parenchyma. For example, choice in cannula
design and flow rate can impact the severity of backflow while the total infusion volume
will ultimately influence the distribution volume and exposure of structures to the agent.
In this study, flow rate and infusion volume were fixed to 0.3 μL/min and 5 μL,
respectively, for all subjects. Thus, we cannot comment on how these factors would
influence distributions in the hippocampus based on our results. However, it is surmised
that increasing the flow rate would contribute to backflow. Backflow would also be
dependent on cannula design with generally smaller diameter cannula resulting in less
backflow (Morrison et al., 1999). A step-design cannula has also been proposed that
has been shown to eliminate backflow at flow rates up to 5 μL/min (Krauze et al., 2005).
Although this study employed the use of a small diameter cannula and low flow rate,
several cases of severe backflow were observed. This backflow could be due to tissue
entering the cannula tip during insertion and obstructing flow. This tissue blockage
would cause the pressure in the infusion system to rise until the blockage is cleared and
then a volume of infusate would be injected into the tissue at a high flow rate. Further
investigations evaluating the effects of flow rate, infusion volume and cannula design on
hippocampal distribution volumes are warranted.
Analysis of Shape and Volume
Shapes segmented from the MR images matched well the shapes of the septal
and temporal hippocampus, suggesting that the infusate distributed throughout each
region. Certain anomalies, such as severe backflow or contrast agent entering the

61
corpus callosum, were also easily identified in the 3D segmentations. The 3D
segmentations also allowed quantitative comparisons between the septal and temporal
hippocampus infusion volumes. Assuming a brain tissue porosity of 0.2 (Mazel et al.,
1998; Sykova and Nicholson, 2008) the expected distributed volume would be 25 μL.
The septal hippocampus distribution volume calculated in this study was similar to this
value; however, the volume distribution calculated in the temporal hippocampus was
significantly higher than the distribution volume calculated in the septal hippocampus.
This suggests that the temporal hippocampus may have a lower porosity than the septal
hippocampus, or factors other than porosity may be influencing final distribution
volumes. One potential factor is the proximity of the septal hippocampus infusions to the
hippocampal fissure. Because the hippocampal fissure penetrates a larger portion of the
septal hippocampus than the temporal hippocampus, a larger region of the septal
hippocampus is in proximity to this mass sink. Another potential explanation for the
observed difference in distribution volumes is the more compact shape of the septal
hippocampus. Although it would be expected that the contrast agent would distribute
throughout the septal hippocampus and then enter the temporal hippocampus, the
dense pyramidal cell layer may serve as a barrier to this transport and may confine the
distribution of the contrast agent to the septal hippocampus. The observed distribution
profiles include the effects of CED and diffusion during the time delay between the final
infusion and MR imaging. We estimate that the effect of diffusion may increase the
measured distribution volumes by up to 40% which is equivalent to the contrast agent
traveling 2-3 MR imaging voxels by diffusion during the time delay. It is important to
recognize this post-infusion transport; however, the analysis of influence of hippocampal

62
tissue architecture on CED distributions and method of image segmentation for
determining final distribution volumes are still valid since both convective and diffusive
extracellular transport are influenced by tissue boundaries and preferential transport
routes.
To avoid observer bias, the segmentation of contrast agent distribution within the
infused structures was conducted using a semi-automatic routine employing the
selection of a lower-limit threshold that was set high to assure accurate segmentation.
All voxels above the threshold within the infused regions of the brain were included in
the segmented volumes. This lower-limit threshold was not based on a percentage of
the maximum signal observed in the MR images. The absolute value of the signal in the
presence of the contrast agent depends on the contrast agent relaxivity and the
baseline T1 values within that particular tissue (Caravan et al., 1999; Burtea et al.,
2008). Thus, establishing a threshold based solely on a percentage of the maximum
observed signal is not adequate for the quantitative determination of contrast agent
distribution. To establish the threshold value, the average signal was measured in the
contralateral, unexposed structure. The threshold value was then set to six times the
standard deviation above this average signal. By setting the lower-limit threshold to 6
times the standard deviation above the average signal observed in contralateral
structures, the threshold excludes over 99% of voxels that have a measured signal
greater than the baseline value due to solely a fluctuation in noise. A similar method has
been employed to establish a lower signal enhancement limit when calculating the
concentration profile of a contrast agent infused into an agarose gel (Chen et al., 2008).
Since the segmented volume is sensitive to the thresholding criteria, lowering the

63
criteria would result in larger calculated infusion volumes; however, the difference
between the septal and temporal hippocampus distribution profiles would probably not
substantially change.
Conclusions
This is the first study to observe CED delivery of MR-detectable agents into the
hippocampus. Injury was limited to damages induced directly by the cannula. The
observed infusate distribution did not cover the entire hippocampus, but rather
distributed according to known neuroanatomic features of the hippocampus with a
detailed dependence on the infusion site. It is important to note that these results
describe distributions in normally developed hippocampi. It is reasonable to expect
variability of infusate distribution in CNS injury that results in structural pathology.
Understanding extracellular transport in complex and/or edematous regions is
paramount for targeted delivery of therapeutics. When structural rearrangements in
injured hippocampi render other treatment options ineffective, targeted and predictable
delivery of therapeutics via CED might provide a method for delivery. Moreover, use of
MR imaging to observe distributions of therapeutic agents co-infused with contrast
agents may allow targeted treatment in cases of variability in individual brain anatomy.
The following chapter (Chapter 3) will describe studies examining infusate distribution
within the injured hippocampus.

64
Figure 2-1. Damage induced by the infusion cannula in the septal hippocampus. A) Blood at the tip of the cannula. B) Blood within the alveus/corpus callosum boundary.
Figure 2-2. Sagittal images of a single rat demonstrating the apparent disconnect between the septal hippocampus (top row) and temporal hippocampus (bottom row). A) The disconnect is seen when the contrast agent is infused into the septal hippocampus (A and C) and temporal hippocampus (B and D).

65
Figure 2-3. High-resolution T1-weighted MR images of septal hippocampus infusions. A) Schematic of key structures in the septal hippocampus adapted from (Paxinos, 1998). B-H) MR image coronal slice of infusion site for septal hippocampus infusions in 7 rats. Filled arrow heads, dentate gyrus granule cell layer; unfilled arrow heads, CA1 pyramidal cell layer; asterisk, hippocampal fissure.
Figure 2-4. High-resolution T1-weighted MR images of temporal hippocampus infusions. A) Schematic of key structures in the temporal hippocampus adapted from (Paxinos, 1998). B-H) MR image coronal slice of temporal hippocampus infusions into 7 rats. Filled arrow heads, dentate gyrus granule cell layer; unfilled arrow heads, CA1 pyramidal cell layer; asterisk, hippocampal fissure, filled arrow, alveus; unfilled arrow, corpus callosum.

66
Figure 2-5. Histological images following infusate CED into the septal hippocampus showing Evans blue dye spreading throughout the septal hippocampus. A, C) Fluorescence images of 2 subjects showing limited penetration in the septal hippocampal dense granule cell layer (filled arrowhead) and pyramidal cell layer (unfilled arrowhead). Preferential distribution can be seen in the hippocampal fissure (asterisks) and alveus (filled arrow). B) Black-gold stained image in close proximity to (A) confirming alveus and dense cell layer approximations. D) Cresyl violet staining of a section in close proximity to (C) confirming dense cell layers.

67
Figure 2-6. Histological images following infusate CED into the temporal hippocampus showing Evans blue dye spreading thoughout the temporal hippocampus. Arrowheads denote granule cell layer of the dentate gyrus and pyramidal cell layer of the CA1. A) A fluorescence image of Evans blue seen preferentially in the temporal hippocampal fissure (asterisks), alveus (filled arrow) and corpus callosum (unfilled arrow). B) Cresyl violet stained image of a section in close proximity to (A). C) Fluorescent image of Evans blue seen preferentially in the alveus and corpus callosum. Chevron shows Evans blue in the perivascular space. D) Cresyl violet stained image of a section in close proximity to (C).

68
CHAPTER 3 INFLUENCE OF LIMBIC SYSTEM INJURY ON INFUSATE DISTRIBUTIONS IN THE
RODENT HIPPOCAMPUS
Introduction
The work shown in Chapter 2 established the local heterogeneity of
neurostructural characteristics as a governing feature of CED. The dependence of
interstitial flow on normal hippocampal structure suggests pathological changes within
the hippocampus would introduce variability in the distributions, especially if myelin
integrity or dense cell layers were affected. It is well documented that that SE
(Meierkord et al., 1997; Kim et al., 2001; Fabene et al., 2003) and temporal lobe
epilepsy (Babb, 1987; Kuzniecky et al., 1987; Bruton, 1988; Bernasconi et al., 2004;
Parekh et al., 2010) result in structural changes within the limbic system, yet previous
studies investigating the influences of pathology on hippocampal distributions are
lacking. Therefore, in an effort to optimize targeted CED delivery into injured regions,
this chapter describes the influence of microstructural changes in the hippocampus on
the distribution of infusate in a pre-clinical SE-model of chronic limbic epilepsy. Limbic
system injury was ranked using MR imaging and then corroborated at a cellular level
using immunohistochemical and neurodegeneration markers. MR imaging was used to
monitor and measure the distribution of Gd-albumin, and then distributions were
compared to the results from control animal infusions described in Chapter 2.
Infusions were performed at acute and chronic points of TLE to illustrate the effect
of different pathologies on infusate distributions in the hippocampus. Infusions
Excerpts from this chapter have been submitted for publication to Neurotherapeutics.
This work was completed with the help of Dr. Garrett Astary. Dr. Astary helped with the infusions, and performed the MR imaging and image segmentation described in this chapter.

69
performed 24 hours after an episode of self-sustaining limbic SE translate to a window
for prophylactic treatment. Many treatment studies address only chronic time points in
TLE, even though structural changes occur progressively from shortly after SE up to the
appearance of spontaneous seizures (Parekh et al., 2010). Clinically, about 30% of
epilepsies can be linked to an identifiable injury to the brain that triggers the
development of the disorder (Manford et al., 1992; Hauser, 1997). Treatment after initial
insults have the potential to reduce structural damage, diminish associated behavioral
and cognitive impairment, or prevent epileptogenesis (for review see (Pitkanen, 2002a;
Sutula, 2002)).
While there is mounting experimental evidence that preventative therapy can be
beneficial in positive disease modification (Pitkanen, 2002b; Brandt et al., 2003; Nicoletti
et al., 2008; Zafar et al., 2012), clinical evidence is controversial (Willmore, 2005). The
failure of clinical trials has been attributed to the use of inappropriate treatment
strategies (Pitkanen, 2002a) and pharmacokinetic issues, i.e. the lack of therapeutic
levels in the brain after systemic administration (Brandt et al., 2003). The latter has
been specifically raised in cases of inconsistent or absent monitoring of therapeutic
levels in studies (Liu and Bhardwaj, 2007). This work addresses such concerns through
employing CED, which, unlike systemic administration, ensures the application of a
clinically relevant dosage and allows for provision of novel treatment strategies.
Infusions were also performed at 60 days post-SE, once animals were spontaneously
seizing. These infusions translate to the treatment of chronic TLE, and are specifically
relevant for one third of patients with epilepsy who are resistant to current AEDs. CED

70
at this time point can be used to maximize the effectiveness of therapeutic agents by
increasing drug concentration at the focus.
Both 24-hours and 60-day time points represent important treatment windows for
epilepsy, but exhibit distinct pathologies. The findings from this study add injury-specific
evaluations to the collection of principles influencing delivery of macromolecules within
the CNS. Information from this study can be applied to improve targeting guidelines for
CED, incorporated into computational CED transport models (Sarntinoranont et al.,
2006; Kim et al., 2010), and considered in the planning of preventative delivery
strategies of novel therapeutic agents.
Methods
Animals
Male Sprague-Dawley rats (Harlan Labs, Indianapolis, IN) weighing 225-250 g on
arrival were allowed one week to acclimate to the 12-h light/dark cycle and given food
and water ad libitum. All procedures were approved by the University of Florida Animal
Care and Use Committee and conducted in accordance with the National Institutes of
Health Guide for the Care and Use of Experimental Animals. A flow chart depicting the
order of experiments can be seen in Figure 3-1.
Surgical Procedures
Anesthesia was initiated with xylazine (10 mg/kg, SQ) and 4% isoflurane in 1
L/min oxygen. Once animals were securely placed in a Kopf stereotaxic apparatus,
anesthesia was maintained at 1.5% isoflurane in 0.4 L/min oxygen. The landmarks
bregma and lambda were exposed by a mid-sagittal incision and three 50 μm diameter
polyamide-coated tungsten microwire electrodes (Plastics One, Roanoke VA) were
implanted for the induction of self-sustaining SE. Two electrodes were implanted into

71
the right temporal hippocampus [-5.3mm AP, 4.9mm ML, -5.0mm DV] for stimulating
and recording, and one was implanted as a reference electrode into the corpus
callosum [-3.3mm AP, 4.9mm ML, -2.4mm DV]. A cannula guide was also secured to
the skull region above the left septal hippocampus [-3.7mm AP, -2.2mm ML] for the
future infusion of contrast agent. Infusion was planned contralateral to electrodes to
avoid the confound of electrode implantation on infusate distribution. Four nylon
anchoring screws were placed in the skull to allow for maximum support of the headset,
which was permanently secured with Cranioplast cement (Plastics One, Roanoke VA).
All animals were given one week to recover from the implantation surgery before the
stimulation procedure began.
Induction of Self-Sustaining Limbic Status Epilepticus (SE) by Hippocampal Electrical Stimulation
Approximating the evolution of structural changes that result in human epilepsy
took precedence for the animal model chosen in this study because changes in cellular
structure will undoubtedly affect migration in the interstitium. The self-sustaining SE
model replicates essential characteristics of epilepsy as it occurs in humans (See
Chapter 1), including the presence of a latent period. To create the model, one week
post-electrode implantation, animals (n=28) were electrically stimulated to induce self-
sustaining SE, a prolonged seizure lasting 30-90 minutes, as described in (Lothman et
al., 1989). Stimulus trains (50 Hz of 1ms biphasic square wave pulses) were delivered
for 10s on and 2s off for a total of 78 ± 16 minutes. A modified Racine scale (Racine,
1972; Borowicz et al., 2003) was used to grade the behavioral seizures as follows:
grade 0 for no seizure response; grade 1 for immobility, eye closure, ear twitching,
twitching of vibrissae, sniffing, facial clonus; grade 2 for head nodding associated with

72
more severe facial clonus; grade 3 for clonus of one forelimb; grade 3.5 for bilateral
forelimb clonus without rearing; grade 4 for bilateral forelimb clonus with rearing; grade
5 for rearing and losing balance. Animals (n=19) that experienced Racine grade 4 or 5
seizures during the hippocampal stimulation and experienced electrographic seizure
activity for at least 2 hours post stimulation were included in the study. Animals were
continuously recorded with time-locked video-EEG until 24 hours or 60 days post-SE.
These inclusion criteria were used to create a comparable injury across animals that
would likely lead to the development of spontaneous seizures (Lothman et al., 1989;
Bertram and Cornett, 1994; Bertram, 1997; Sanchez et al., 2006; Parekh et al., 2010).
MR Imaging
Twenty-four hours or 60 days post induction of SE, high-resolution T1 and T2-
weighted MR imaging was performed to generate a reference for contrast enhancement
images (T1) and to visualize morphological changes (T2). Immediately following
infusion of Gd-albumin (see next section), high resolution T1-weighted imaging was
repeated to visualize distribution profiles of the contrast agent. MR measurements were
performed using a Bruker Avance imaging console (Bruker NMR Instruments, Billeria,
MA) or Agilent Direct Drive imaging console (Agilent Technologies, Santa Clara, CA,
USA) connected to a Magnex Scientific 11.1 T horizontal bore magnet system(Varian,
Inc., Magnex Scientific Products, Walnut Creek, CA). A custom-made 130 degree arc,
3.5cm rectangular linear-field surface coil constructed on a 4cm diameter half-cylinder
was used for linear transmission and detection of MR signal. High- resolution T1-
weighted images, with slices oriented in the coronal direction, were acquired using a
spin-echo sequence with a 2.5cm×2.5 cm field-of-view in a matrix of 200×200, recovery
time of 1000 ms, echo time of 10ms, 8 averages, 30 slices, 500 µL slice thickness. T2-

73
weighted data were acquired using a fast spin echo sequence with 30 slices oriented in
the coronal direction and a 2.5cm×2.5cm field-of view in a matrix of 208×208, recovery
time of 3500ms, RARE factor of 8 and effective echo time of 45 ms.
T2-weighted images (30 coronal slices per brain) were examined and used to
classify injury in animals. The high water content of edematous tissue results in
prolonged T2 relaxation times and manifests as a hyperintense signal in T2-weighted
images. Hyperintense signal was defined as injury in these images and then validated
post-mortem (see Immunohistochemistry section). T2-weighted images were scored for
injury as follows: 1 = unilateral piriform cortex and/or amygdala damage, 2 = score of 1
plus injury in the septal nuclei, 3 = a score of 2 plus injury in the middle thalamic nuclei,
4 = a score of 3 plus damage in the lateral thalamic nuclei, 5 = a score of 4 plus
damage in the ventral subiculum, 6 = bilateral piriform cortex/amygdala damage, septal
injury, and damage in the middle and lateral thalamic nuclei. An early indication of the
development of spontaneous limbic seizures in this animal model is the presence of
edema in the parahippocampal gyrus (Parekh et al., 2010). Because the purpose of this
study was to examine injury before or after epileptogenisis, animals imaged at 24 hours
post-SE that did not exhibit parahippocampal gyrus were excluded from subsequent
analyses.
Infusion of Gd-albumin
Twenty-four hours (n=17) or 60 days (n=2) post induction of SE, animals were
infused with 5.0 µL of Gd-albumin (10 mg/mL in PBS solution; MW∼87 kDa,∼35 Gd-
DTPA molecules per albumin molecule; R. Brasch Laboratory, University of California,
San Francisco, CA), tagged with Evans Blue dye (1 mg dye/50 mg Gd-albumin) into the
septal dentate gyrus of the hippocampus [-3.7 AP, -2.2 ML, -3.4 DV]. The infusion was

74
performed through the previously implanted cannula guide using the same equipment
and infusion parameters as described in Chapter 2. Results from experimental animals
infused in this study were compared to results from control animals infused under
similar conditions (see Chapter 2). The only difference between infusions performed in
control animals and those performed in injured animals was a ~30 minute time delay
between infusion and MR imaging in control animals. The contribution of diffusion after
the end of CED in these animals was estimated in Chapter 2.
Immunohistochemistry
Following the last MR measurement, animals were transcardially perfused with
200 mL saline solution followed by 300 mL of 10% buffered formalin phosphate. Brains
were extracted and stored in the formalin solution overnight at 4°C, then equilibrated in
30% sucrose solution for 72 hours. Brains were then sectioned coronally using a
cryostat set at 50 µm. Every fifth section in succession was collected for staining with
either Fluoro Jade C (FJC), Black Gold II, glial fibrillary acidic protein (GFAP),
macrophage activation (CD-68), or Perl stain. GFAP, CD-68, and Perl-stained sections
were counterstained with cresyl violet for visualization of cell-bodies.
FJC staining (Schmued et al., 2005) was used to visualize degenerating neurons
with a modification by Lee et al (Lee et al., 2011). Mounted tissue sections were first
immersed in 1% sodium hydroxide in 80% ethanol for 5 minutes. They were then rinsed
for 20 minutes in 70% ethanol, followed by 2 minutes in distilled water, and then
incubated in 0.02% potassium permanganate solution for 3 minutes. Slides were then
rinsed for 2 minutes in distilled water and transferred for 15 minutes into a 0.0002%
solution of Fluoro-Jade C (Histo-Chem Inc., Jefferson, AR) dissolved in a 0.1% acetic
acid vehicle.Sections were stained for myelin using Black-Gold II (Schmued et al.,

75
2008). Mounted slides were incubated in a 0.3% Black-Gold II solution (Histo-Chem
Inc., Jefferson, AR) at 60°C for 12-15 minutes, rinsed, then transferred to a 1% sodium
thiosulfate solution for three minutes.
For assessment of micro- and astrogliosis, free-floating sections were incubated in
10mM citrate buffer, pH 9.0, for 25 minutes at 80°C for antigen retrieval. After a brief
wash, they were stained for microglial activation and astrocytosis overnight using
primary monoclonal antibodies against CD-68 (AbD Serotec; Raleigh, NC) or GFAP (G-
A-5, Sigma Chemicals Co.; St. Louis, MO), respectively, at a concentration of 1:400.
Sections were washed and incubated overnight in 1:10,000 biotinylated anti-mouse
immunoglobulin G, reacted with a 1:1,000 Extravidin peroxidase solution for 2 hours,
then visualized with 0.05% 3,3'-diaminobenzidine (DAB) in 0.0012% hydrogen peroxide
in PBS.
Image Segmentation and Statistical Analysis
Final distribution volumes of Gd-albumin were analyzed by performing semi-
automatic image segmentation on the T1-weighted coronal images using routines
written in MATLAB® (The MathWorks® Inc., Natick, MA, USA) with the following specific
threshold criteria. Voxels were included in the infusion volume if their signal intensity
was higher than at least 6 standard deviations of the noise in the corresponding region
contralateral to the site of infusion (control regions containing no Gd-albumin). The
segmentation output of the MATLAB® routine was refined using the ITK-SNAP open-
source medical image segmentation tool (Yushkevich et al., 2006). Dynamic and final
distribution volumes in the septal and temporal hippocampus were calculated by
counting the number of voxels included in each segmented region and multiplying by
the volume of a single voxel.

76
Total hippocampal volumes were calculated by manually segmenting the T2
weighted pre-infusion images in ITK-SNAP. The borders of the hippocampus (e.g.
corpus callosum, thalamus) were determined by white matter/gray matter contrast in the
T2 weighted images, anatomical landmarks such as the velum interpositum and by
referring to a rat brain atlas (Paxinos, 1998).
Distribution volumes of 24-hour animals were compared to injury ratings using
Kendall’s rank correlation. This non-parametric test is used for ordinal data and is
generally considered to be equivalent to Spearman’s rank correlation. The Kendall’s tau
correlation coefficient was chosen over Spearman’s rho because tau is a better
estimate of the corresponding population parameter and has more accurate p values in
small sample sizes (Gibbons, 1993). Furthermore, Spearman’s is difficult to interpret as
a measure of the strength of a relationship and does not have a meaningful operational
interpretation (Bland, 1995). The significance of differences in volume of distributions
between control animals, 60 day animals, and injury classifications of 24 day animals
was calculated by analysis of variance (ANOVA). Post hoc testing for individual
classification differences was done with Newman-Keuls test. All tests were two-tailed; a
p<0.05 was considered significant.
Results
SE-Induced Injury
Animals (n=19) were electrically stimulated in the temporal hippocampus to
experience one episode of SE. T2-weighted images (Figure 3-2) were acquired 24
hours (n=17) or 60 days (n=2) post induction of SE to reveal edema within regions of
the limbic circuitry. An early indication of the development of spontaneous limbic
seizures in this animal model is the presence of edema in the parahippocampal gyrus

77
(Parekh et al., 2010). One animal did not exhibit edema in the parahippocampal gyrus
and was not included in the subsequent injury analyses. Of the remaining 24-hour
group, 3 of 16 animals exhibited edema in the bilateral parahippocampal gyrus (Figure
3-2P-R) and 13 of 16 animals exhibited unilateral edema (Figure 3-2C-O). Out of the 13
animals that exhibited unilateral edema, injury was ipsilateral to the stimulating
electrode in 3 animals (Figure 3-2D,I,L), and contralateral in 10 animals (Figure 3-2C,E-
H,J-K,N-O). Table 3-1 presents the T2 injury index classification of each animal at 24
hours post-SE. Of the 2 animals that were imaged 60 days post-SE (Figure 3-2S-T),
only one revealed contralateral parahippocampus edema (Figure 3-2T) and enlarged
ventricles in MR imaging. Neither of the animals exhibited edema in any other limbic
structures.
Volumes of Distribution of Gd-albumin and Changes in Hippocampal Volume
Increasing classifications of injury were correlated with volumes of distribution of
Gd-albumin in 24-hour animals (tau = 0.51, p=0.006), which averaged 21.2 ± 3.6 µL for
animals classified as Class 1-2, 26.8 ± 5.4 µL for animals classified as 3-4, and 33.2 ±
6.0 µL for animals classified 5-6 (Figure 3-3). Distributions in animals with severe injury
(Class 5 and above) were significantly increased as compared to previously measured
control animals in Chapter 2 (p=0.018; average 23.4 µL ± 1.8 µL), and as compared to
60 day TLE animals (p=0.002, average 18.5 ± 2.1 µL). This increase may be
underestimated, as distribution volume of control animals includes ~30 extra minutes of
diffusion that occurred in the time delay between infusion and MR imaging. The
contribution of diffusion was estimated in Chapter 2 to increase control distribution
volumes up to 40% (2-3 voxels, 0.250-0.375 mm). Therefore, the relative increase of
distribution volumes in injured animals may actually be larger. No significant differences

78
were found between animals presenting with ipsilateral versus contralateral
parahippocampal injury.
Total hippocampal volumes of 24 hour animals pre-infusion were measured and
compared to volumes of distribution post-infusion. These volumes were not significantly
different between injury classes (Class 1-2:18.4 ± 1.0, Class 3-4:18.6 ± 1.6, Class 5-
6:19.2 ± 1.7), indicating that in this study, the larger infusion volumes seen in injured
animals cannot be solely explained by differences in hippocampal size.
Characteristics of Gd-albumin Distribution
While volumes of distribution correlated with magnitude of injury (Figure 3-3), the
pattern of infusate spread was consistent between animals exhibiting various levels of
injury and at different time points (Figure 3-4). All infusions showed clear demarcation
within the hippocampus, with very minimal backflow only along the cannula tract in 9/19
(47%) animals. Six animals (32%) showed limited backflow within the corpus callosum
overlying the hippocampal infusion site, and 4 animals (21%) exhibited no backflow at
all. As described in control animals (see Chapter 2), spread of the contrast agent in
experimental animals was seen in the dentate gyrus, CA3, CA2, CA1, and subiculum of
the hippocampus. Additionally, both the dentate granule cell layer and pyramidal cell
layers of CA3-CA1 and subiculum were clearly distinguishable from the surrounding
hyperintense subfields, indicating poor contrast agent penetration. This was especially
salient in the CA3 subregion in 8 animals (42%), where infusate coverage tapered at
stratum pyramidale, not quite reaching stratum oriens (Figure 3-4B,F,G,K,L,R-T). In 4
animals (21%), infusate filled all layers of the CA3 subregion and also penetrated the
fimbria (Figure 3-4I-J,M,P). As in controls, infusate did not extend to the contralateral
hippocampus or any other subcortical structures in any animals; however, enhancement

79
was observed as hyperintensity in T1 images within extraventricular regions
surrounding the septal and temporal hippocampus. Twelve animals (63%) exhibited
leakage into the velum interpositum of the septal hippocampus, and 14 animals (74%)
exhibited leakage into the midbrain cisterns of the temporal hippocampus, suggesting a
portion of the contrast agent distribution was not accounted for within the hippocampal
distribution volumes. Furthermore, 12 animals (63%) also exhibited leakage into the
lateral ventricle ipsilateral to the infusion site.
Histology 24 Hours Post-SE
MR-visualized injury was validated and characterized using histological
assessments of CNS injury. For animals infused 24 hours post-SE, injury was visualized
in several limbic regions. Within the hippocampus proper (Figure 3- 5),
neurodegeneration was observed via FJC staining in the CA3/CA2 subfield of all rats
and in the hilus of rats with more severe injury (10/17 animals, Class 3-6). Positive FJC
staining was not seen in the hippocampus of animals in injury Class 0-1 (compare
Figure 3-5D,F). A minority (5/17) of animals in more severely injured classes (Class 4-6)
also exhibited positive FJC staining in hippocampal subfield CA1. Activated microglia
were detected by expression of CD68 (Figure 3-5G-I, arrows) in the CA3 of 10/17 rats
encompassing injury Classes 2-6. Only a minority of animals exhibited activated
microglia in the CA1 and hilus (5 rats in Classes 2-6 and 4/17 rats in Class 4-6,
respectively). CD68-positive staining was not detected in animals of Class 0-1 (compare
Figure 3-5G,I). GFAP staining was used to visualize the enlarged soma and processes
typical of reactive astrocytes (Figure 3-5J-L, arrows). Hypertrophic astrocytes were seen
in the hilus (Figure 3-5K, arrows) of the majority of rats (14/17 animals, Class 2-6) and

80
in the CA3 of 5 rats (Class 2-6). Activated astrocytes were only seen in the CA1 of 1 rat
in Class 6, the most severe injury class.
All hyperintense regions identified in T2-weighted imaging were also
immunostained for CNS injury markers. Hyperintensity observed in the
parahippocampal gyrus (Figure 3-6) during in vivo T2-weighted imaging corresponded
to fluid-filled cavities (Figure 3-6, asterisks), myelin degradation (Figure 3-6A-C),
neuronal degeneration (Figure 3-6D-F), macrophage activation (Figure 3-6G-I), and
astrogliosis (Figure 3-6J-L) 24 hours post-SE. Injury in the ventral subiculum (Figure 3-
7), which resulted in a classification of Class 5 or above, resulted in considerable
degeneration of myelin (compare Figure 3-7A,B) and neurons, as measured by FJC
staining (compare Figure 3-7C,D) and cell layer integrity in cresyl violet staining
(compare Figure 3-7E,F and G,H). Thalamic injury (Figure 3- 8) did not consist of
notable myelin degradation (Figure 3-8A), but did encompass neuronal degeneration
(Figure 3-8B, arrows) and microglia activation (Figure 3-8C, arrows). Activated
astrocytes were seen in the medial habenular nucleus (Figure 3-8D, arrows).
No obvious difference was observed in the hippocampi of rats that exhibited
ipsilateral versus contralateral edema in the parahippocampal gyrus. Animals in higher
classes of injury (4 and above) exhibited increased activation of FJC, CD68, and GFAP
in the CA1 subfield, and increased activation of CD68 in the hilus. All animals exhibited
injury near the electrode stimulation site at the temporal hippocampus.
Histology 60 Days Post-SE
Histological analysis of 60-day animals revealed much less injury than acutely-
injured animals. In one animal (Figure 3-9), no positive staining of neurodegeneration,
microglia activation, or myelin degradation was seen in the hippocampus (red boxes),

81
thalamus (green boxes) or parahippocampus (blue boxes). Astrocytosis was visible in
the hippocampus, but not in other regions. The other animal (Figure 3-10) exhibited
slight microglia activation and substantial astrocyte activation in the hippocampus (red
boxes) and thalamus (green boxes), but no neurodegeneration. Cavitation, astrocytosis,
microgliosis, neurodegeneration, and myelin degradation were all seen in the
parahippocampus of this animal (blue boxes).
Discussion
This study investigated the effect of injury at different time points on CED contrast-
agent distribution profiles and volumes in the rat septal hippocampus. Distribution of
Gd-albumin was visualized with high-resolution MR imaging, then volume analysis was
performed with segmentation. Injury was rated based on edema visualized with T2-
weighted MR images, and characterized with staining against neuronal degeneration,
myelin degradation, astrocytosis, and macrophage activation.
The main finding in this study is that the volume of infusate distribution is
increased in animals with more severe acute injury relative to mildly-injured animals,
aged-matched controls, and chronically epileptic animals. In normal hippocampi, CED
performed under similar infusion conditions resulted in distribution volumes roughly 5
times greater than the volume infused (see Chapter 2). This spread corresponds to an
estimated brain tissue porosity of 0.2 (Mazel et al., 1998; Sykova and Nicholson, 2008),
which assumes isotropic porous medium and no CSF leaks. The volumes of distribution
in mildly injured animals at 24 hours (Class 1-4) in this study are similar to those
measured in control animals (Class 0). However, volumes are significantly larger in
animals that presented with a more severe CNS injury 24 hours post-SE, even with the
presence of CSF leakage. This effect was not present after 60 days; implying injury may

82
confer measurable effects on distribution volumes via changes in the extracellular
volume fraction.
Acute SE-Induced injury
Following brain injury, a cascade of pathological events evolves over minutes,
days, and weeks. Severity of CNS injury was classified in T2-weighted MR images and
identified with several histological stains. Although stimulation was always applied to the
right hippocampus, injury was observed on both sides of the brain. At 24 hours post-SE,
degeneration of neurons and myelin, in addition to activation of microglia and astrocytes
was detected in the hippocampus, parahippocampal gyrus, thalamus, and septal nuclei.
Injury in these areas is consistent with other histological reports at acute time points
ranging from 8 to 48 hours. Damage has been reported in the piriform and amygdalar
cortices after administration of pilocarpine (Wall et al., 2000; Nairismagi et al., 2006),
kainate (Nakasu et al., 1995; Brandt et al., 2003), angular bundle stimulation (Gorter et
al., 2003), and rostral forebrain stimulation (Handforth and Treiman, 1994). Damage has
been reported in the CA1 and CA3 after administration of pilocarpine (Nicoletti et al.,
2008), kainate (Brandt et al., 2003; Hsu et al., 2007), and rostral forebrain stimulation
(Handforth and Treiman, 1994). Injury in the entorhinal cortex is commonly reported
after angular bundle stimulation (Gorter et al., 2003), SSLSE, kainate, and pilocarpine
models (Du et al., 1995). Midline thalamic nuclei were affected after rostral forebrain
(Handforth and Treiman, 1994; Brandt et al., 2003) and angular bundle stimulation
(Gorter et al., 2003). In addition, as in this study, the work by Brandt et al. (Brandt et al.,
2003) and Gorter et al. (Gorter et al., 2003) report more extensive damage associated
with lateral thalamic nuclei.

83
Injury and Final Infusate Distribution Volume
SE is a major risk factor for the development of chronic epilepsy in both humans
(Sloviter, 1999) and animal models (Lothman et al., 1990; Cavalheiro, 1995; Hellier et
al., 1998). Both acute and chronic time points present opportunities for treatment.
The pathological states observed in this and other studies at acute time points
include morphological changes, such as neuronal death, glial cell loss or proliferation,
glial swelling, production of damaging metabolites, inflammation, edema, demyelination,
and loss of ionic, pH, and amino acid homeostasis. They may also be accompanied by
substantial changes in ECS ionic composition (Sykova, 1983) and various changes in
ECS diffusion parameters (Sykova, 1983; Sykova et al., 1994; Sykova, 1997a; Sykova
et al., 1998; Sykova and Nicholson, 2008), suggesting reduction of the ECS. In fact,
ECS volume shrinkage is likely a compensation mechanism for acute neuronal and glial
swelling (Sykova, 1997a). The presence of cellular debris and inflammatory markers
paired with ECS changes increases the tortuosity, or hindrance to diffusion, within the
ECS. Geometrically, tortuosity is quantified as degree of curvature and complexity of the
curve. Biologically, tortuosity is quantified as the ratio of the diffusivity in free space to
that in the brain. Tortuosity in both applications changes with edema and neuropil
remodeling. This has been documented in several models of brain injury, including
cortical stab wounds (Vorisek et al., 2002), neural tissue grafts (Sykova et al., 1999b),
and hypoxia (Sykova et al., 1994), where the ECS volume fraction in rat cortex was
specifically measured to decrease by 80% and was accompanied by an increase in
tortuosity. Hypertrophic astrocytes, which have been observed here and in many other
studies, were postulated to be the cause. Hence, an acute insult resulting in cellular
debris and/or the swelling of cells and fine glial processes would increase intercellular

84
tortuosity, affect the size of the intercellular channels, and change diffusional
characteristics. Accordingly, the consequence of smaller intercellular channels would be
a larger volume of Gd-albumin distribution in rats that experienced a greater degree of
injury.
On the other hand, the microstructural injury present at chronic time points
(weeks-years) has different characteristics and perhaps opposite effects on infusate
distribution. A longitudinal study (Parekh et al., 2010) has shed light on the progressive
changes occurring during epileptogenesis in the SE animal model. At acute phases, MR
measurements (decreased average diffusivity (AD) and T2) in the hippocampi
suggested the presence of cytotoxic edema and ongoing neurodegeneration that was
confirmed with histology. At the onset of spontaneous seizures, MR measurements
(increase in AD and T2) are indicative of vasogenic edema, and observed histologically
as ongoing degeneration, and myelin degradation. Increased FA in the dentate gyrus
suggested mossy fiber sprouting, which was confirmed with Timm’s staining. Chronic
thalamic damage was also seen that corresponded to microgliosis. Like the SE animal
model, human mesial temporal lobe epilepsy is also commonly associated with
hippocampal pathology with varying degrees of regional neuronal loss and gliosis.
Additionally, pathological changes in the human amygdala (Hudson et al., 1993),
entorhinal cortex (Du et al., 1993), and thalamus (Margerison and Corsellis, 1966;
Bruton, 1988) have often been reported. Histological evaluation of biopsy specimens
from chronic epilepsy reveal a majority of TLE patients have the hippocampal atrophy
and scarring typical of Ammon’s horn sclerosis, in addition to other abnormalities, such

85
as seizure-associated postnatal neurogenesis and mossy fiber sprouting (Thom et al.,
2005).
Sclerotic hippocampi in chronic epilepsy have even been associated with
increased ECS (Wieshmann et al., 1999), a development that may explain the change
in distribution volumes compared to acutely-injured hippocampi. As opposed to acute
damage, infusate spread in chronic TLE hippocampi was found to be decreased,
perhaps due to enlarged interstitial spaces. While this study only observed two animals
at chronic time points, histological analysis revealed less microglia activation and no
neurodegeneration in the hippocampus. The more injured animal also exhibited
enlarged ventricles, which may result in more drainage of the infusate and contribute to
the decrease in infusate distribution volume.
Injury and Pattern of Infusate Distribution
The data in this study suggest acute SE-induced injury is significantly correlated
with infusate distribution volumes. Interestingly, patterns of distribution within the septal
hippocampus were consistent with those in control animals. Largely underestimated, the
biophysical properties of the local tissue architecture at the infusion site are a critical
consideration for planning the coverage of therapeutic agents in both normal and injured
areas of the brain. Even in normal rat brains, measured tortuosity in vivo was found to
be higher in regions including a dense cell layer, such as stratum pyramidale, as
compared to stratum radiatum, which contains mostly fibers (Sykova et al., 1998).
Isotropic, dense gray matter regions will affect CED distribution differently than
directional white matter regions. Anisotropic regions such as axonal bundles often
exhibit increased infusate transport along fiber directions (Vorisek and Sykova, 1997),
while laminar structures such as the hippocampus may cause more widespread

86
dispersion. Additionally, ventricles and perivascular spaces can act as mass sinks in
which infusate may pool or be directed towards subarachnoid spaces (Neuwelt, 2004;
Astary et al., 2010). Gd-albumin access to fluid-filled spaces was observed in this study,
where a majority of animals exhibited Gd-albumin leakage into the lateral ventricle, the
velum interpositum, and the midbrain cisterns.
Other Factors Affecting Final Infusate Distribution
In this study, the severity of injury was significantly correlated with increases in
measured distribution volumes. It is important to note that the volume differences
between controls and injured animals may be underestimated because the observed
distribution profiles in control animals include the effects of CED and diffusion during a
~30 minute time delay between the final infusion and MR imaging. The analysis of
influence of hippocampal tissue architecture on CED distributions and method of image
segmentation for determining final distribution volumes are still valid since both
convective and diffusive extracellular transport are influenced by tissue boundaries and
preferential transport routes.
There are also several other factors (discussed in more detail in the subsection
“CED” of Chapter 1) that may add to the remaining variability in the final distribution of
infusate (for review, see (Krauze et al., 2006)). Firstly, infusion pump parameters, such
as flow rate and duration of infusion, will influence interstitial transport (Bobo et al.,
1994). However, these factors were kept constant across animals, and thus were
deemed to have a negligible effect on inter-subject variability. Secondly, distribution will
vary based on properties of the infusate itself, including size, shape, viscosity, solubility,
binding characteristics, concentration, and rate of efflux from the brain. Under certain
infusion conditions, highly viscous solutes display greatly increased volumes of

87
distribution (Mardor et al., 2009) and water-soluble, non-transported compounds display
slower efflux rates (Groothuis et al., 2007). Since the same compound was used for all
experiments in this study, the physico-chemical properties of Gd-albumin do not explain
the inter-subject variability. However, it should be noted that these properties pose a
significant influence on the rates and routes of delivery and efflux of various solutes.
A third key factor that introduces variability in final distribution is backflow, which
results in the spread of infusion into unintended regions. This issue can be addressed
with preventive cannula designs (Morrison et al., 1999; Guarnieri et al., 2005;
Ivanchenko and Ivanchenko, 2011), but remains an important variable in drug delivery
studies. In this study, roughly half of the infusions exhibited very minimal backflow only
along the cannula tract. About a quarter of the infusions resulted in no backflow, and
another quarter had backflow along the overlying corpus callosum. When compared to
infusions with no backflow, the distribution volumes of infusions exhibiting backflow
were not significantly affected (p=0.18).
Finally, infusion site is a key factor in the final distribution of infusate due to the
influence of normal local structural differences in CNS anatomy (see Chapter 2).
Infusions in this study were targeted to the same stereotaxic coordinates in each
animal, but there are small (≤ 1mm) differences in the exact cannula placement of each
experiment due to inter-animal variability. The infusion site variability of the majority of
animals in this study was very minimal; however, two Class 4 animals had infusion sites
that were too lateral in the hippocampus. The resulting infusion coverage in these
animals failed to cover the medial aspect of the CA1 subregion or the dorsal subiculum,
resulting in artificially low distribution volumes that fell within the average of Class 1-2

88
animals. This type of infusion site variability can be avoided with careful MR-guided
cannula insertion, but it underlines the effect of local tissue variability on the distribution
of infusate.
Conclusions
This is the first study to observe CED delivery into the hippocampus of a pre-
clinical rodent model of chronic epilepsy. This type of delivery bypasses systemic
circulation and opens the possibility of therapy to a wide variety of potential compounds,
since it does not require passage through the BBB or consideration of systemic safety.
Several studies have described CED in normal hippocampi in different species, but
understanding the influence of structural changes on extracellular transport in injured
regions is critical for planning drug delivery studies. Historically, CNS injury has been
associated with changes in the ECS, swelling of cellular elements, and overall
increased tortuosity within the interstitial space. This was observed here as neuronal
degeneration, myelin degradation, and macro- and microglia activation as an acute
response to SE. Such changes can affect diffusion parameters and in this study, were
found to be correlated with the final volume distribution of Gd-albumin. Recovery of
acute changes at chronic time points resulted in significantly reduced infusion volumes
as well. These results illustrate the importance of biophysical influences on CED and
should be incorporated in the planning of future studies tracking therapeutic agents.
Chapter 4 will describe two examples of CED of therapeutic carriers.

89
Figure 3-1. Experimental protocol flow chart

90
Figure 3-2. T2-weighted coronal images of 19 different rodent brains acquired post induction of SE reveal injury within regions of the limbic circuitry. Hyperintense regions signify areas of injury. A) Schematic of affected structures adapted from (Paxinos, 1998). B-R) MR images of injury induced in 17 different animals 24 hours post-SE. Structures most affected were the CA3 hippocampal subfield, ventral subiculum, piriform cortex (P), entorhinal cortex (ENT), amygdalar nuclei (AMYG), middle thalamic nuclei (MT), and laterodorsal/lateroposterior thalamic nuclei (LT). S-T) MR images of injury induced in two animals 60 days post-SE. Electrode implantation is on the left side of each image.

91
Table 3-1. Index of injury classification 24 hours post-SE epilepticus. Injured regions were identified using T2-weighted coronal images obtained in vivo prior to CED infusions.
Injury class Injury description Number of animals
Percentage of animals
Class1 Unilateral edema in the piriform cortex and amygdalar nuclei
2 12.5%
Class 2 Class 1 plus edema in septal nuclei 1 6.25% Class 3 Class 2 plus edema in the middle thalamic
nuclei 2 12.5%
Class 4 Class 3 plus edema in the laterodorsal/lateroposterior thalamic nuclei
5 31.25%
Class 5 Class 4 plus edema in the ventral subiculum
3 18.75%
Class 6 Class 5 plus bilateral edema in the piriform cortex and amygdalar nuclei
3 18.75%
Figure 3-3. Increasing classifications of injury were correlated with volumes of distribution in 24-hour animals (tau = 0.51, p=0.006), which averaged 21.2 ± 3.6 µL for animals classified as Class 1-2, 26.8 ± 5.4 µL for animals classified as 3-4, and 33.2 ± 6.0 µL for animals classified 5-6. Distributions in animals Class 5 and above were significantly increased as compared to previously measured control animals (Class 0), which averaged 23.4 ± 1.8 µL (p=0.018, see Chapter 2)) and to animals infused 60 days post-SE (average 18.48 ± 2.1 µL, p=0.002).
**

92
Figure 3-4. High resolution T1-weighted images of Gd-albumin infusions into the septal hippocampus of 19 different rodent brains post-SE. A) Schematic of key structures in the septal hippocampus adapted from (Paxinos, 1998). B-R) MR images of contrast agent distributions in the septal hippocampus 24 hours post-SE. S-T) Contrast agent distributions in the hippocampus of 2 animals 60 days post-SE. Hyperintense regions are voxels containing Gd-albumin. Distribution patterns contour along hippocampal circuitry with minimal backflow or exposure to extra-hippocampal regions. CC = Corpus callusom; CA1 = CA1 pyramidal cell layer; hf=hippocampal fissure; DGC = Dentate granule cell layer; CA3 = CA3 pyramidal cell layer.

93
Figure 3-5. Characterization of hippocampal damage 24 hours post-SE. Representative stained sections of affected hippocampi (left column:low magnification, middle column:high magnification) are compared to unaffected hippocampi (right column) for A-C) myelin degradation, D-F) neuronal degeneration, G-I) macrophage activation, and J-L) astrocytosis. Higher magnification of boxed areas show ongoing neurodegeneration within CA3 (E, arrows) that corresponds with macrophage activation (H, arrows). Cell loss is corroborated through loss of cresyl violet staining in CA2 (closed arrowheads, compare G,I and J,L) and CA3 (open arrowheads, compare G,I and J,L). Astrocytosis was seen predominantly in the hilus (K, arrows), while myelin degradation was not appreciably different within the hippocampus (compare A,C). BG = Black-gold II; FJC/DAPI = Flouro-jade C with 4',6-diamidino-2-phenylindole nuclear counterstain; GFAP = Glial fibrillary acidic protein; CD68 = Cluster of Differentiation 68; CV = Cresyl violet. Scale bar is 50µm for b,e,h,k; 200µm for all other.

94
Figure 3-6. Characterization of parahippocampal damage 24 hours post-SE. Hyperintense regions observed in the parahippocampal gyrus during in vivo T2-weighted imaging corresponded to A-C) myelin degradation, D-F) neuronal degeneration, G-I) macrophage activation, J-L) astrocytosis, and A,G,J) cavitation. Asterisks denote cavitation. Compare injured (left column:low magnification, middle column:high magnification) to uninjured (right column). BG = Black-gold II; FJC/DAPI = Flouro-jade C with 4',6-diamidino-2-phenylindole nuclear counterstain; GFAP = Glial fibrillary acidic protein; CD68 = Cluster of Differentiation 68; CV = Cresyl violet. Scale bar is 50µm for b,e,h,k; 200µm for all other images.

95
Figure 3-7. Damage to the ventral subiculum was seen in 6/17 rats 24 hours post-SE. Affected (left column) is compared to unaffected hippocampi (right column). Injury in the ventral subiculum resulted in considerable A-B) myelin degradation, asterisks, and C-D) ongoing neuronal degeneration of the pyramidal cell layer, white arrows. E-H) Cresyl violet staining reveals significant cell layer degradation, asterisks. E-F) activated microglia, black arrows, were also seen in the ventral subiculum, while G-H) total activated astrocytes were minimal, black arrows. BG = Black-gold II; FJC/DAPI = Flouro-jade C with 4',6-diamidino-2-phenylindole nuclear counterstain; GFAP = Glial fibrillary acidic protein, CD68 = Cluster of Differentiation 68; CV = Cresyl violet. Scale bar is 50µm.

96
Figure 3-8. Characterization of thalamic injury 24 hours post-SE. A) myelin staining did not show notable fiber degradation. B) ongoing neuronal degeneration and C) macrophage activation within middle thalamic nuclei. D) Activated astrocytes, arrows, were not seen in middle thalamic nuclei, but were present in middle habenular nuclei. BG = Black-gold II; FJC/DAPI = Flouro-jade C with 4',6-diamidino-2-phenylindole nuclear counterstain; GFAP = Glial fibrillary acidic protein, CD68 = Cluster of Differentiation 68; CV = Cresyl violet. Scale bar is 50µm.

97
Figure 3-9. T2-weighted MR image with corresponding histology of a spontaneously seizing animal 60 days post-SE. Each row displays histological staining for GFAP, CD68, FJC, and BG (from left to right, see Figures 3-5 to 3-8 for abbreviations). Colored boxes correspond to colored regions outlined on the MR image.
98
Figure 3-10. T2-weighted MR image and corresponding histology of another spontaneously seizing animal 60 days post-SE. Each row displays histological staining for GFAP, CD68, FJC, and BG (from left to right, see Figures 3-5 to 3-8 for abbreviations). Colored boxes correspond to colored regions outlined on the MR image.

99
CHAPTER 4
CONVECTION-ENHANCED DELIVERY OF THERAPEUTIC AGENT CARRIERS
Introduction
Chapters 2 and 3 describe CED distributions of Gd-albumin in normal and injured
hippocampi. These studies emphasize the importance of local tissue structure on
infusate distribution, specifically the presence of dense cell layers, fissures, white matter
bundles, and edema. However, they likely reveal “best-case scenario” distributions
because albumin is a non-binding, low-reactivity protein tracer. As mentioned in the
Chapter 3 subsection “Other Factors Affecting Final Infusate Distribution”, variability in
CED distribution is also introduced by physico-chemical properties (size, shape,
viscosity, solubility, binding, concentration, rate of efflux, etc.) of the infusate. The initial
Gd-albumin studies described in Chapters 1 and 2 can be used as a guide for predicting
the distribution of therapeutic agents with more complex properties, such as viral
vectors or neural stem cells (NSCs). As described further in this chapter, the use of viral
vectors and NSCs to deliver therapeutic agents are novel strategies that have shown
promise experimentally (see “Gene Therapy for Epilepsy” and “Stem Cell Therapy for
Epilepsy”, below). These systems also exhibit interesting migratory properties of which
CED studies are lacking. Further work analyzing the effect of other variables, such as
cellular interaction and chemotaxis, will allow for more accurate prediction of
Excerpts from this chapter are reprinted from Njie eG, Kantorovich S, Astary GW, Green C, Zheng T, Semple-Rowland SL, Steindler DA, Sarntinoranont M, Streit WJ, Borchelt DR (2012) A Preclinical Assessment of Neural Stem Cells as Delivery Vehicles for Anti-Amyloid Therapeutics. PLoS ONE 7: e34097. doi:10.1371/journal.pone.0034097.
This work was completed with the help of Drs. eMalick Njie and Garrett Astary. Dr. Njie provided the NSCs used in this study, helped with surgical procedures, and performed the quantification of transplant dimensions. Dr. Astary loaded the infusion pump for the surgeries and performed the image segmentation.

100
distribution. Therefore, as a follow-up to initial CED investigations, proof-of-principle
studies using viral and NSC drug carriers were undertaken to elucidate whether these
agents share the spatial and temporal properties of small molecule infusate
distributions.
Gene Therapy for Epilepsy
Gene therapy is often proposed as a solution for correcting or supplementing
defective genes responsible for disease development. The generation of viral vectors,
which can be engineered to induce specific and stable gene transfer, offers an attractive
strategy for epilepsy treatment. Thus far, therapeutic strategies have focused on
modulating the signaling of neurotransmitters and neuroactive peptides that may have
anticonvulsant or neuroprotective effects. Raol et al. (2006) showed the incidence of
developing chronic seizures was significantly lower in pilocarpine-treated animals that
overexpressed the GABAA receptor α1 subunit. Due to reports of reduced numbers of
GABAergic neuropeptides in experimental epilepsy (Gant et al., 2009), gene therapy
has also been designed to restore galanin (McCown, 2006; Kanter-Schlifke et al., 2007;
Loscher et al., 2008), neuropeptide Y (McCown, 2006; Noe et al., 2007; Noe et al.,
2008), and somatostatin (Zafar et al., 2012). Neuroprotective effects have also been
demonstrated with the overexpression of the glucose transporter-1 and the apoptosis
inhibitor Bcl-2 (McLaughlin et al., 2000).
Experimental evidence shows gene therapy is a promising utility for epilepsy
therapy, with several caveats. Vector systems differ in important aspects and the choice
of system should be based on a combination of safety and effectiveness of the vector in
a particular strategy. The adeno-associated virus (AAV) vector system has several
advantages over other systems such as lentiviruses or retroviruses. Lentiviruses, a

101
subclass of retroviruses 80-100nm in diameter, exhibit insertional mutagenesis. Overall
they seem to be less mutagenic than parent retroviruses (Modlich and Baum, 2009),
because they generally integrate into gene regions less likely to disturb regulation and
expression of host genes. Retroviruses integrate in promoter regions and CpG islands
that may influence the acitivity of the host promoter or give rise to new full-length
transcripts (Wu et al., 2003). AAV, on the other hand, exhibits low immunogenicity
similar to lentivirus, but does not integrate into the genome.
AAV is a small (20 nm) replication-defective, nonpathogenic human parvovirus
that requires co-infection with a helper virus to replicate (Mandel et al., 2006). It is
possible to concentrate and purify AAV vectors to very high titers, resulting in
widespread and stable transduction with low toxicity. Eleven strains of AAV have been
identified, and much effort has been put into modifying the tropism of the vector through
capsid manipulation and its specificity through promoter design. AAV serotypes are
distinct from each other in their capsid regions, allowing binding and entry into different
cell types. Tissue tropisms of AAV vectors likely arise due to the cumulative effects of
viral binding to multiple cell surface receptors, cellular uptake, intracellular processing,
nuclear delivery of vector genomes, uncoating, and second-strand DNA conversion (Wu
et al., 2006). AAV2 shows moderate efficiency in the CNS, but AAV1 and 5 have been
shown to exhibit higher tranduction frequencies (Davidson et al., 2000; Burger et al.,
2004). AAV8 and AAV9 (Cearley and Wolfe, 2006; Klein et al., 2006; Klein et al., 2007)
are also capable of achieving high levels of neuronal expression, but AAV4 appears to
transduce ependyma and astrocytes in the subventricular zone (Davidson et al., 2000).
The differential cellular interactions of AAV serotypes introduce another variable to CED

102
distributions. In this study, distributions of AAV1, 5, 8, and 9 were chosen to evaluate
after CED due to their increased efficiency and neuronal tropism.
Stem Cell Therapy for Temporal Lobe Epilepsy
The need for alternative therapeutic approaches for the evolution of TLE has also
resulted in intervention strategies involving the grafting of neural stem cells. Due to its
focal nature, TLE is one of the neurological disorders that could benefit from
transplantation of cells. This strategy has the potential to curb epileptogenesis, ease
chronic seizures, and benefit learning and memory impairments (Shetty and
Hattiangady, 2007).
Although this field is still in its infancy, there have been sundry approaches to
replace lost neurons or glia, produce more GABA-ergic cells, or deliver neuroprotective
factors via stem cells. Replacement of degenerated neurons in the injured hippocampus
via grafting of fetal hippocampal cells has shown promise for restraining epileptogenic
changes and controlling seizures (Shetty et al., 2005; Rao et al., 2007). Grafting of cells
engineered to produce GABA and fetal GABA-ergic cells into the epileptic foci have
been shown to transiently reduce seizures in a variety of animal models (Gernert et al.,
2002; Thompson, 2005; Castillo et al., 2006). Transplantation of GABA-producing cells
in the dentate gyrus was associated with increased GABA levels, enhanced local
electrical seizure threshold, and delayed onset of behavioral seizures in the kindling
model of epilepsy (Thompson, 2005). In the kainic acid model of TLE in rats, grafts
containing fetal neural precursors from CA3 were effective in increasing GABAergic
function (Shetty and Turner, 2000), and grafts of striatal precursor cells decreased the
frequency of spontaneous seizures (Hattiangady et al., 2008). Limited repair of the adult

103
hippocampus is also possible with grafts of neural stem cells with more restricted neural
or glial fates (Shetty et al., 2008).
In general, stem cell-based approaches focus on developing strategies to activate
NSCs to produce new neurons, facilitate differentiation into GABA-ergic neurons, and to
suppress established seizures. However, it would also be interesting to develop
methods for testing whether NSCs could prevent chronic epilepsy. Chu et al. (2004)
transplanted human NSCs intravenously after a pilocarpine injection and found a
positive result in the suppression of the formation of spontaneous seizures. Embryonic
stem (ES) cell derived neuronal precursors engineered to release adenosine protected
against developing generalized seizures in a kindling model of TLE (Li et al., 2007) and
suppression of spontaneous seizures in mice (Li et al., 2008).
To be successful, grafts of stem cells must not only survive, but also migrate
correctly to the appropriate sites to establish appropriate synaptic connections. Spatial
dynamics of implanted cells have been described after grafting (Hoehn et al., 2002), but
are solely attributed to pronounced migration towards chemotactic signals. This chapter
describes the pre-migrational mobility of NSCs.
Proof-of-Principle Studies for Viral Vector and Stem Cell CED Delivery
Although much progress has been made in developing viral vector and NSC-
based therapies for epilepsy, translation of either of these techniques requires control,
or at the very least, understanding of their interstitial mobility so risks of aberrant
migration could be weighed against potential benefits. One of the major hurdles in
development today is being able to control dispersion of these carriers. The effect of the
initial distribution of both AAV and NSCs has often been overlooked because these
other factors (migration, cellular uptake) are assumed to play a larger role in the final

104
distribution. However, enhancing initial distribution with CED can affect final outcome.
This has been shown through increase of viral spread and transduction efficiency in the
striatum (Bankiewicz et al., 2000). CED delivery of AAV has not been studied in the
hippocampus; and transduction efficiency varies markedly from one region to another
(McCown et al., 1996). No CED studies of NSC delivery exist; in fact, NSC distribution
outside of migration has not been studied. Therefore, this chapter presents preliminary
data to 1) illustrate the utility of CED in delivering NSCs and viral vectors in the
hippocampus, 2) reveal the effect of initial CED distribution on NSC spread, and 3)
describe the effect of vector tropism and size on hippocampal CED distribution.
Methods
Animals
NSC experiments were performed on 8-14 month C67/B6 non-transgenic mice.
Both host mice and NSC donor mice were congenic on the C57BL/6J background,
eliminating problems with graft rejection. AAV experiments were performed on male
Sprague-Dawley rats weighing 225-250 g.
Vector Construction
Standard cloning techniques were used to construct recombinant AAV-based
plasmids. GFP was subcloned in an expression cassette that had the cytomegalovirus
immediate early enhancer and the chicken beta-actin promoter (construct pTRUF11, UF
vector core). This was subcloned at the UF vector core into the rAAV backbone flanked
by rAAV2 inverted terminal repeats and pseudotyped with serotype 1, 5, 8, and 9 capsid
proteins (titers of 1.68 x 10¹³ vg/mL, 9.02 x 10¹² vg/mL, 6.47 x 10¹² vg/mL, 6.56 x 10¹²
vg/mL, respectively).

105
Lentivirus plasmids containing CaMKII-Channelrhodopsin-2/GFP were obtained
from Karl Deisseroth (Stanford University) and packaged by Dr. Phil Barish.
Transduction and Isolation of NSCs
GFP-expressing NSCs were provided by eMalick Njie. The NSCs were isolated by
removing the subependymal zone of neonatal B6 mice, processing with
trypsin/ethylenediaminetetraacetic acid, and dissociating into a single cell suspension.
Cells were maintained in culture flasks, and then transduced with self-inactivating
Lentiviruses containing plankton copepod green fluorescent protein (courtesy of Dr. Sue
Semple-Rowland). Cells were then enriched with fluorescence activated cell sorting
(FACS). Prior to transplantation, monolayers were detached from flasks, washed, and
diluted to 5 x 10⁴ cells/µL. Concentration was determined with two reference cell counts
on a hemacytometer.
Surgical Procedures and CED Infusions for NSC Experiments
Mice were deeply anesthetized with 1-5% isoflurane and then securely mounted
with ear bars and a nose bar to a stereotaxic apparatus (Kopf Instruments, Tujunga,
CA). The anesthesia mixture was delivered through an inlet within the nose bar
enclosure for the duration of the surgery. The top of the head was shaved and sterilized
with alternating swipes of betadine antiseptic and 70% ethanol. A sterile scalpel was
used to make a small incision into the skin above the skull. The skin was reflected in
order to expose Bregma and a burr holes were drilled to allow cells to be injected
bilaterally to the thalamus (n=7; [-2.0mm AP, +/- 1.5mm ML, -4mm DV]), striatum (n=3;
[+1.18mm AP, +/-1.5mm ML, -4mm DV]), and three depths within the hippocampus [-
2.00mm AP, +/-2.0mm ML, -1.5mm DV, -2.1mm DV, and -2.8mm DV]. Hippocampal
DV coordinates correspond to the superior aspect (n=5), dorsoventral center (n=5), and

106
inferior aspect (n=7) of the septal hippocampus, respectively. Approximately 5 x 10⁵
cells (9.8 µL) were infused into each region. Per experiment, 4-6 confluent T75 flasks
were harvested and concentrated at 5 x 10⁴ cells/µL in order to reliably have enough
volume for transplantation and for void volume in the infusion system. In general, the
infusion parameters used here are established protocols in other studies (Park et al.,
2006; Yamasaki et al., 2007; Tang et al., 2008). The cell numbers and volumes used
here are similar to intracranial surgeries by Park et al. (2006), in which mouse brains
were infused with 3 x 10⁵ NSCs in 8 µL.
All infusions were delivered via CED at 1 µL/min using the same infusion system
mentioned in Chapters 2 and 3. Following injection, the needle was left in place for 3
minutes to minimize backflow before being slowly withdrawn.
Surgical Procedures and CED Infusions for Viral Vector Experiments
Surgical procedures to expose bregma and lambda on the skull were performed
as described in Chapters 2 and 3. Once exposed, burr holes were drilled over the left
hippocampus for the injection of viral vectors (n=4; at [-3.80 mm AP, -2.50 mm ML, -
3.10 DV]). Injections were performed at 0.3 µL/min with a 10 mL Hamilton syringe (33
gauge, point style 4) attached to an infusion pump. The needle was kept in place for 5
additional minutes after cessation of injection to allow for distribution of the vector
before retraction. Volumes of injection were adjusted per serotype (2.0-5.19 µL) to
equalize the number of vector genomes (vg) delivered to be 3.36 x 10¹⁰ vg.
Perfusion and Immunochemistry
Tissue harvesting was performed within 15 minutes of NSC injection to visualize
immediate pre-migrational distribution. To harvest tissues, mice were deeply
anesthetized and euthanized by isoflurane overdose followed by immediate

107
exsanguination and perfusion with cold 1x PBS. Whole brains were quickly dissected
out and submerged in cold 4% paraformaldehyde fixative overnight. Fixed brains were
then cryoprotected in 30% sucrose and sectioned at 20 µm intervals with a cryostat.
Sections were stored in anti-freeze media at -20°C until staining with 4',6-diamidino-2-
phenylindole (DAPI, Invitrogen, Carlsbad, CA). Immunostained cells and tissue sections
were photographed with an Olympus DP71 camera mounted on an Olympus BX60
microscope.
Tissues from viral vector-injected animals were harvested one month post-
infusion. Perfusion, brain extraction, and tissue sectioning was performed as described
in Chapter 3. No staining was performed on these sections.
Quantification of NSC Transplant Dimensions
NSC transplant dimensions were quantified using a method adapted from Mazel et
al. (1998). An index of anisotropy, designated A, was determined by dividing the
distance of engraftment (x) along the transverse (i.e. mediolateral) axis by the distance
of engraftment (y) along the vertical (i.e. dorsoventral) axis. With this method, spherical
engraftments would result in A values close to 1, while anisotropical engraftments would
result in larger or smaller values of A. For each infusion, one to two 20 µm sections
containing engraftments were analyzed with AxioVision LE software (Zeiss, Jena,
Germany). Images of samples with equal pixel/micrometer value were used to
determine the distance of x and y. An unpaired, two-tailed Student’s t-test using
Microsoft Excel was used to compare A from different sites of infusion. A p-value of
<0.05 was considered statistically significant.

108
Image Segmentation and 3D Reconstruction of NSC Engraftments
A semi-automatic image segmentation routine was implemented in MATLAB® (The
MathWorks, Inc., Natick, MA USA) that distinguished regions of GFP expression from
control regions of the brain by means of a threshold unique to each histological section.
RGB images of the histological sections were imported into MATLAB®; however, only
the green channel of the images was used for image segmentation. The average
background signal was determined by averaging the signal intensity in GFP-free regions
of interest for each section. Similarly, the standard deviation of noise was determined by
evaluating the noise behavior in tissue-free regions in images. Thresholds were
calculated by adding six times the standard deviation of noise to the control signal
intensity for each section. The image segmentations were refined in ITK-SNAP
(Yushkevich et al., 2006), an open source medical image segmentation tool.
Refinements included removing regions of auto-fluorescence (false-positives) from the
image segmentation as well as segmentation of annotations such as scale bars. Three-
dimensional reconstructions were generated by first aligning the histological sections
prior to image segmentation and finally generating a mesh from the 3D image
segmentation using ITK-SNAP’s built in mesh generation tool.
Results
Distribution of Viral Vectors in the Hippocampus
Four neuronal serotypes of AAV-GFP and a lentivirus vector were infused into the
dorsal hippocampus (Figure 4-2, 4-3). A summary of these results can be found in
Table 4-1. AAV1-GFP (Figure 4-2A, 4-3) transduced cells in the dentate granule cell
layer, hilus, CA1, CA2, and medial CA3 throughout approximately 2800 µm of the
hippocampal septo-temporal axis. A portion of cells in Layer VI of the overlying cortex

109
were also transduced and projections in the lateral posterior thalamic nucleus were
visible throughout ~800 µm in the anterior-posterior direction. Contralateral projections
of transduced cells were visible in all subregions of the hippocampus proper.
AAV5-GFP (Figure 4-2B, 4-3) transduced cells were visible mostly in the CA2, with
less transduction in the CA3 and CA1 through approximately 2400 µm of the septo-
temporal axis. Hilar cells were also transduced, but almost no granule cells expressed
GFP. Interestingly, contralateral projections of transduced cells were visible in all
subregions of the hippocampus proper and in the inner molecular layer of the dentate
gyrus, the target of hilar mossy cells.
AAV8-GFP (Figure 4-2C, 4-3) transduced cells in the CA3, CA3, and CA1, with
minimal transduction in the hilus and dentate granule cells. Transduction was visible
through approximatel 2400 µm along the septo-temporal axis. Commissural projections
were visualized in the contralateral CA1 and CA2.
AAV9-GFP (Figure 4-2D, 4-3) transduced cells mainly in the CA1, CA2, and Layer
V1 of the overlying cortex. CA3 cells expressed GFP in the septal hippocampus, but
GFP in CA3 was not visible ~4.5 mm behind bregma through the temporal
hippocampus. Projections from transduced cells could be visualized in the contralateral
CA1, CA2, and in lateral posterior thalamic nuclei for ~1000 µm in the anterior-posterior
direction. AAV9-GFP expression was noticeably the most widespread and exhibited the
highest intensity of GFP expression.
The lentivector (Figure 4-2E) transduced pyramidal cells in the CA1 and granule
cells of the dentate gyrus. While AAV transduction occurred throughout the septo-

110
temporal axis, GFP expression from lentivirus was only visualized along 600 µm of the
septo-temporal axis.
Distribution of Transplanted NSCs in the Hippocampus
NSCs were bilaterally infused into the hippocampus and host mice sacrificed
within fifteen minutes of surgery to visualize pre-migrational distribution via CED. Across
various depths of infusion into the hippocampus, well-defined ellipsoid distributions of
GFP fluorescence were consistently observed in the transverse plane (Figure 4-4A-B,
E-F). GFP fluorescence was found distributed largely in three structures: the corpus
callosum, the velum interpositum and the hippocampal fissure. Specifically, NSCs that
were infused into the superior aspect of the septal hippocampus yielded GFP
fluorescence distributions throughout the corpus callosum (Figure 4-4A; n=5). Cells that
initially colonized white matter tracts moved laterally within this structure but did not
migrate into adjacent gray matter (Figure 4-4A). NSCs targeted to the inferior aspect of
the septal hippocampus produced GFP fluorescence distributed mediolaterally along
the velum interpositum (Figure 4-4B; n=7). The velum interpositum is a soft tissue
partition between the diencephalon and the telencephalon rather than a cavity or space
(Tubbs et al., 2008). Functionally, the velum interpositum forms the roof of the 3rd
ventricle and connects the choroid plexus of this ventricle to that of the lateral ventricle.
The distribution of GFP fluorescence in this region extended hundreds of micrometers
from the 3rd ventricle to above the dorsal lateral geniculate nucleus. NSCs targeted to
the dorso-ventral center commonly distributed in the hippocampal fissure, corpus
callosum, and velum interpositum (Figure 4-4E). In some instances, GFP fluorescence
was not only at the position the cells were targeted, but also in areas hundreds of
micrometers away (Figure 4-4E-F).

111
Distribution of Transplanted NSCs in the Thalamus and Striatum
NSCs were also infused into the thalamus and striatum to determine whether
engraftment patterns in the hippocampus are unique. NSCs that were infused into the
thalamus (Figure 4-4C; n=7) and striatum (Figure 4-4D; n=3) produced spherical
distributions of GFP fluorescence that were indicative of isotropic transport. 3D
reconstruction of serial sections of a representative corpus callosum infusion illustrates
the sheet-like spread of GFP fluorescence across the wide, flat bundle of corpus
colossal fibers (Figure 4-5A). In contrast, thalamic infusion reconstruction shows a
globular spread of GFP fluorescence (Figure 4-5B). These patterns of distribution were
consistent with the cells having been distributed along structure-specific pathways at the
time of injection (Figure 4-5C).
Discussion
Viral Vector Distribution
Comparisons of five viral vector infusions into the septal rat hippocampus revealed
primarily neuronal expression patterns that differed across serotype and vector.
Intensity of GFP expression was higher with AAV1 and 9 than AAV5 or 8. AAV9
resulted in the widespread expression in CA1 and CA2, but AAV1 and 8 resulted in
better expression in CA3. AAV1 and 9 resulted in GFP fluorescence in the thalamus,
though AAV9 showed the most widespread expression. Viral genomes were equalized
across all AAV serotypes by varying infusion volume, which cannot be discounted as an
influence on distribution. However, the largest volume infused was of AAV 8, which
resulted in the second-to-worst transduction efficiency. Alternatively, the second-to-least
volume infused was of AAV1, which resulted in the next best transduction efficiency.
Another study in which viral genomes are equal across serotypes is needed to

112
determine the effect of volume on AAV distribution. Despite this limitation, these results
are similar to that of other comparative studies. Previous comparisons have shown that
transgene expression was greater with AAV1 and AAV8 than AAV5, but no difference
between AAV1 or 8 (Klein et al., 2006). Another study demonstrated that AAV1 and
AAV5 are of similar efficiency (Burger et al., 2004). A study examining transgene
expression after systemic injection in mice revealed that AAV9 > AAV1, 8 > AAV5
(Zincarelli et al., 2008).
It is important to note results pertaining to serotype tropism should be interpreted
cautiously due to inter-study variations in vector titers, doses, and promoters. The
preliminary studies described in this chapter are distributions from one animal per vector
and do not represent quantifiable comparisons. They do, however, provide a practical
illustration of the targeting strategies presented by viral vector choice. On one hand,
AAV infusions result in widespread and efficient gene expression that can be modulated
by serotype. The disadvantage of AAV is the small (4-5 kb) cloning capacity of the
vector. This constrains the choice of genetic regulatory elements, which allow for
modulation of gene expression. Alternatively, lentiviruses do not have significant
limitations on gene size. With a cloning capacity of up to 8kb, lentivectors have the
ability to induce long-term stable expression and low immunogenicity (McGrew et al.,
2004). However, lentivectors can range from 80-100 nm in size, while AAV particles are
approximately 25 nm. In contrast to AAV vectors, the lentivirus infusion resulted in a
very focal pattern of expression of <1 mm, which may be due to larger particle sizes
relative to AAV.

113
As mentioned in Chapters 2 and 3, infusion site presents a considerable influence
on distribution. Infusion site could be visualized through a higher density and intensity of
GFP expression. Infusion with AAV5 was approximately 1 mm lateral as compared to
the other infusions, a potential explanation for the difference in transduction for this
animal. The widespread expression from AAV9 in CA1 may be due to a more dorsal
infusion site as compared to the other serotypes. As described in Chapter 1, preferential
distribution in the septal hippocampus is dependent upon location of the cannula tip
along the dorsoventral axis. Further studies with more animals are needed to distinguish
this influence from serotype cellular interactions.
NSC Distribution
To characterize NSC distribution patterns, transplants were analyzed immediately
after infusion into areas of diverse anisotropic properties. The main finding of this study
revealed areas of low fluid resistance (namely corpus callosum, hippocampal fissure,
velum interpositum) were a prevailing influence on the distribution of NSCs. Anisotropic
distribution patterns were most prominent in the hippocampus, but absent in other
regions such as the thalamus and striatum. Interestingly, the ectopic engraftment
pattern of NSCs is long-term, as demonstrated by the fact that NSCs engrafted in the
corpus callosum under identical conditions do not redistribute into gray matter after a
month (Njie et al., 2012). In fact, NSCs deposited into various hippocampal and cortical
sites paradoxically distribute mainly in the corpus callosum and to a lesser extent, the
hippocampal fissure (Olstorn et al., 2007; Blurton-Jones et al., 2009; Radojevic and
Kapfhammer, 2009). Similar distribution characteristics have been reported in epilepsy
models as well. Hattiangady et al. (2008) grafted striatal precursor cells 4 days post
kainate-induced SE and analyzed 9-12 months later. The grafts were targeted to CA3 of
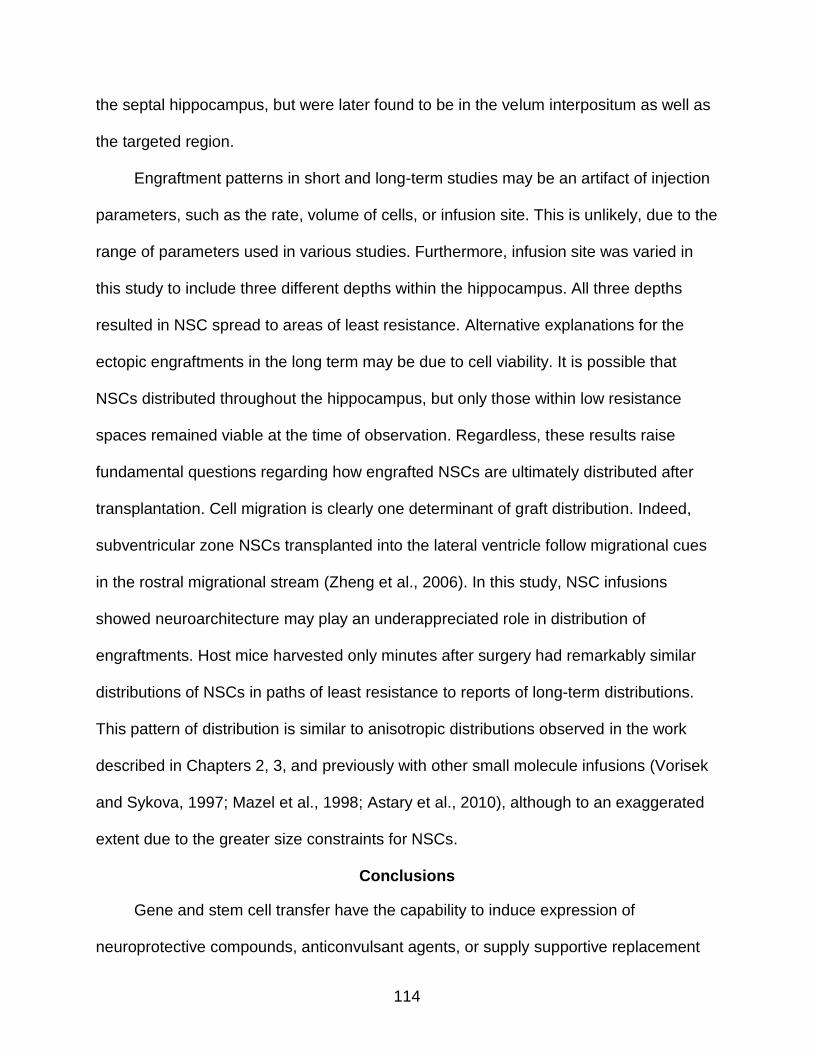
114
the septal hippocampus, but were later found to be in the velum interpositum as well as
the targeted region.
Engraftment patterns in short and long-term studies may be an artifact of injection
parameters, such as the rate, volume of cells, or infusion site. This is unlikely, due to the
range of parameters used in various studies. Furthermore, infusion site was varied in
this study to include three different depths within the hippocampus. All three depths
resulted in NSC spread to areas of least resistance. Alternative explanations for the
ectopic engraftments in the long term may be due to cell viability. It is possible that
NSCs distributed throughout the hippocampus, but only those within low resistance
spaces remained viable at the time of observation. Regardless, these results raise
fundamental questions regarding how engrafted NSCs are ultimately distributed after
transplantation. Cell migration is clearly one determinant of graft distribution. Indeed,
subventricular zone NSCs transplanted into the lateral ventricle follow migrational cues
in the rostral migrational stream (Zheng et al., 2006). In this study, NSC infusions
showed neuroarchitecture may play an underappreciated role in distribution of
engraftments. Host mice harvested only minutes after surgery had remarkably similar
distributions of NSCs in paths of least resistance to reports of long-term distributions.
This pattern of distribution is similar to anisotropic distributions observed in the work
described in Chapters 2, 3, and previously with other small molecule infusions (Vorisek
and Sykova, 1997; Mazel et al., 1998; Astary et al., 2010), although to an exaggerated
extent due to the greater size constraints for NSCs.
Conclusions
Gene and stem cell transfer have the capability to induce expression of
neuroprotective compounds, anticonvulsant agents, or supply supportive replacement

115
cells for temporal lobe epilepsy. A combination therapy of gene and stem cell therapy
may even be potential strategy in which GABA-ergic cell transplants supplement viral
vector delivery of anti-convulsants. Unfortunately, there are still many hurdles for stem
cell treatments for intractable epilepsy. Cells must first be capable of exhibiting enduring
survival and maintaining neurotransmitter release on a long term basis in the epileptic
brain (Zaman et al., 2000). Second, fetal precursor cells have not been shown generate
specific types of neurons or glial cells needed to replace damaged cell types. Embryonic
stem cells can be used to generate neural or glial precursors, but risk of tumor formation
is high because they are pluripotent and mitotically active. As stem cell therapies grow
in popularity, these challenges are among the studies being undertaken.
Chapter 4 describes proof-of-concept applications for CED in epilepsy using
carrier vehicles commonly proposed as novel therapeutic strategies. CED delivery of
these carriers resulted in distributions along paths of least resistance and exhibited a
dependence on infusion site, akin to infusions of Gd-albumin. Distributions of NSCs,
particularly, were influenced by hippocampal-specific anatomical constraints that
resulted in previously uncharacterized anisotropic transport. These results reiterate the
significance of biostructural factors in targeting strategies of delivery approaches, in
addition to the influence of serotype and chemotaxis.

116
Table 4-1. Features of gene expression vectors
Viruses Packaging capacity
Inflammatory Response
Advantage Disadvantage
Retrovirus 8 kb Low Large cloning capacity; stable transgene expression
Does not infect non-dividing cells. Insertional mutagenesis
Lentivirus
8-10 kb
Low
Infects diving and non-diving cells with 30% efficiency, large cloning capacity
Insertional mutagenesis
Adenovirus
8 kb
High
Infects all cell types with 100% efficiency; does not integrate with host
High inflammatory response
AAV
4.7 kb
Very Low
Infects all cell types; non-pathogenic, does not integrate with host
Small packaging capacity
Table 4-2. Results of hippocampal viral vector infusions
Viral vector
Volume Infused
Length of A/P Transduction
Length of M/L Transduction
Hippocampal subregions tranduced
AAV1 3.73 µL 2800 µm 2739 µm CA1-CA3, some DGC and hilar
AAV5
2.00 µL
2400 µm
1557 µm
CA1-CA3, some hilar
AAV8
5.19 µL
2400 µm
3789 µm
CA1-CA3, some hilar
AAV9
5.09 µL
3200 µm
4036 µm
CA1-CA3
Lentivirus
3.6 µL
600 µm
900 µm
CA1, DGC
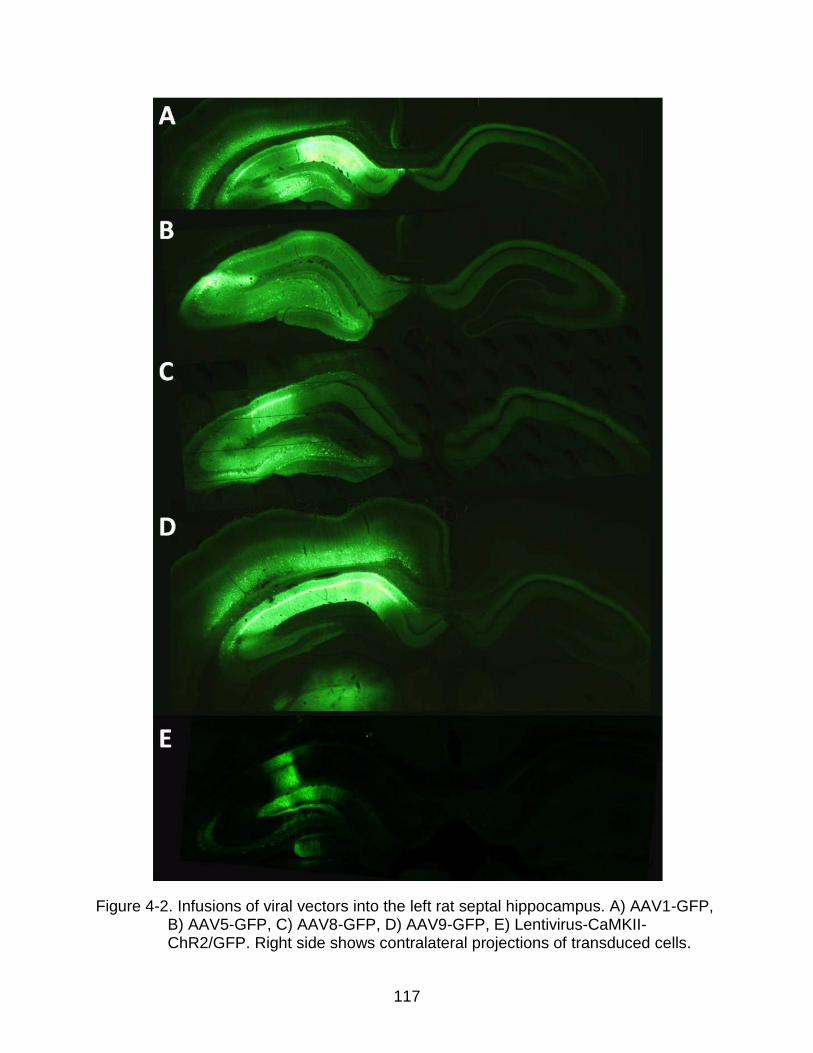
117
Figure 4-2. Infusions of viral vectors into the left rat septal hippocampus. A) AAV1-GFP, B) AAV5-GFP, C) AAV8-GFP, D) AAV9-GFP, E) Lentivirus-CaMKII-ChR2/GFP. Right side shows contralateral projections of transduced cells.

118
Figure 4-3. Infusions of four AAV serotypes exhibit specific distribution patterns throughout the hippocampal septo-temporal axis. Each column shows the GFP expression per AAV serotype at specific coronal sections along the septo-temporal plane. Each row depicts a coronal section posterior to the first row by the distance indicated on the y-axis.

119
Figure 4-4. Short-term engraftments of NSCs expressing GFP demonstrate the hippocampus specifically features anisotropic transport. NSCs infused into the septal hippocampus distributed anisotropically along A) the corpus callosum (CC) when deposited in the superior aspect of the septal hippocampus, and B) the velum interpositum (VI) when deposited in the inferior aspect of the hippocampus. In contrast, engraftments into C) the thalamus (THAL) and D) the striatum resulted in isotropic distributions that did not spread preferentially along the transverse plane. E) When injected into the dorsoventral center of the hippocampus, 38.5% of infusions resulted in transport along “paths of least resistance” to sites distal of target such as the hippocampal fissure (HF), the CC, and the VI. F) Backflow in thalamic infusions resulted in anisotropic transport along the VI.

120
Figure 4-5. Geometric analyses of NSC infusions. A-B) 3-dimensional reconstructions of serial histological sections shows engraftments form A) a sheet-like spread in the corpus callosum, and B) a globular spread in the thalamus. C) Anisotropy (A) was quantified by dividing the spread along the transverse plane (x) by the spread along the vertical plane (y). Compared to the thalamus, A is 7.3 times larger in the corpus callosum, 3.7 times larger in the hippocampal fissure, and 6.8 times larger in the velum interpositum (**, p<0.01, comparison to the thalamus).

121
CHAPTER 5 CONCLUSIONS AND FUTURE WORK
Conclusions
TLE is a devastating disease that affects people of all ages, races, and
socioeconomic backgrounds. Even with an advanced understanding of underlying
mechanisms, the current treatment approach has not changed in decades. Systemic
administration of AEDs is the main approach to treating seizures, even though one third
of patients are resistant to current pharmacotherapies. Furthermore, treatment occurs
only at chronic time points; there are currently no drugs available that prevent the
development of epilepsy after an initial insult, such as SE. Thus, the National Institute of
Health has listed several important benchmarks for epilepsy research, including 1)
identifying approaches to prevent epilepsy or its progression, 2) developing and
optimizing new strategies for targeted therapies, and 3) developing animal models for
the progression of epilepsy. The work presented herein addresses these NIH
benchmarks through the development of CED for targeted, prophylactic treatment of
TLE.
Identifying Approaches to Prevent Epilepsy or Its Progression
CED provides a targeting strategy applicable at any stage of epilepsy progression
that is amenable to delivery of various therapeutic agents--far more than systemic
administration is capable of transmitting to the brain. As discussed in Chapter 1, CED
results in widespread distributions that are capable of reaching clinically-relevant
volumes without the risk of systemic side effects. In this work, CED was applied to the
infusion of NSCs and several viral vectors into the rat hippocampus as a proof-of-
principle approach to delivering therapeutic compounds at a local level (Chapter 4). We

122
found NSCs distributed according to previously uncharacterized anisotropic conduits
(corpus callosum, hippocampal fissure, velum interpositum), which had a significant
impact on the final residence of the transplanted cells. Moreover, the distribution of
NSCs shared spatio-temporal similarities with small molecule distributions (Chapter 2),
validating the use of surrogate markers to enable real-time monitoring and prediction of
the distributed agents. Because NSCs are many orders of magnitude larger than most
tracers, we suspect size was a major factor in this transport pattern. This was also
observed when viral vectors were tested. Lentivirus (80-100 nm) expression in the
hippocampus was markedly reduced as compared AAV (25 nm) expression. Within
CED distributions of different AAV serotypes, AAV9 was found to have the most
widespread transduction efficiency, followed by AAV1 and 8, and lastly, AAV 5. The
variability in transduction distribution was likely due to both capsid interaction and
infusion site. No adverse effects were observed from the infusion of NSCs or viral
vectors in animal behavior, as assessed by daily handling, or cellular structure, as
analyzed through DAPI staining. CED of these therapeutic carriers is a possible
approach for the direct application of anti-epileptic drugs, viral-mediated gene transfer of
inhibitory peptides, or cell-based therapies. A combination therapy of gene and stem
cell therapy may be another potential strategy in which GABA-ergic cell transplants
supplement viral vector delivery of anti-convulsants.
Developing and Optimizing New Strategies for Targeted Therapies
Apart from molecular and enzymatic targeting strategies, physical targeting
strategies are commonly overlooked and underappreciated in drug delivery.
Unfortunately, the failure of several CED clinical trials (Sampson et al., 2007a; Sampson
et al., 2010) has prompted researchers to look more closely at the influence of

123
neurostructure on infusate distribution. Properties of CED have been well established in
homogenous gray and white matter, but only one study (Heiss et al., 2005) has
examined CED in the hippocampus, a structure commonly affected in TLE. Therefore,
to develop and optimize CED targeting for epilepsy treatment, infusions of Gd-albumin
were performed in normal (Chapter 2) and injured (Chapter 3) rat hippocampi at two
time points. We found hippocampal distributions to be influenced by the site and size of
the target structure, density of cellular elements, presence and orientation of pial
surfaces, and potentially, orientation of local axonal projections. We also found that
distribution volumes varied with the extent of brain injury, with diffuse limbic system
edema increasing the distribution volumes up to twice the volume measured in normal
animals. Differences in distributions of injured animals are likely due to decreases in the
size of extracellular channels, potentially resulting from ongoing neuronal degeneration
and accumulation of neuroinflammatory markers in the interstitium. These changes, in
addition to swelling of cellular elements and glia, affect diffusion parameters within the
hippocampus and influence the spread of infusate. This is supported by the fact that the
volume of infusate distributions 60 days post-SE returned to control ranges, accordant
with the abatement of these markers. The effect of varying the infusion site and integrity
of structure on distribution volume supports the hypothesis that anisotropic hippocampal
neuroarchitecture plays a prominent role in the distribution of infusate. These results not
only demonstrate a strategy for targeting and tracking therapies to the hippocampus,
but they also provide guidance for the planning of infusion therapy in heterogenous
tissue.

124
Developing Animal Models for the Progression of Epilepsy
The idea of preventative treatment for TLE was initiated in an article by Dr. Murray
Falconer (Falconer, 1974). Dr. Falconer, and many others since, believes the latent
period may offer a therapeutic window for the prevention of epileptogenesis.
Experimental evidence suggests there is a cascade of morphologic and biological
changes after an initial insult that are potential targets for the administration of
neuroprotective or anti-ictal substances. SE models are ideal for studying the
progression of epilepsy because they exhibit a latent period similar to the human
condition. Preventative studies are currently performed on kindling, pilocarpine, or
kainate models. However, these models are poor approximations of structural
rearrangements that occur in humans. Kindling models produce little to no damage,
while chemical models result in sizable injury with a high mortality rate. Moreover,
chemical models act on specific receptors, which present a confound to
pharmacological research and drug design.
In the electrical SE model presented here, we investigated the neuropathological
changes occurring within 24 hours of SE (Chapter 3). This model is often considered to
have the greatest parallels to human TLE, and thus was developed as a testing
paradigm for CED infusions. At 24 hours post-SE, diffuse limbic injury was observed in
the hippocampus (specifically CA3 and CA1), amygdala, piriform cortex, entorhinal
cortex, middle thalamic and lateral thalamic nuclei, and lateral septum. Additionally,
previous work (Parekh et al., 2010) has determined the presence of parahippocampal
edema in this model is predictive of the development of spontaneous seizures. These
early structural changes present a target for prophylactic treatment that resolve by the
time spontaneous seizures begin, when animals exhibit varying amounts of neuronal

125
loss and gliosis, similar to human hippocampal injury. We found the extent of injury was
a significant variable for infusate distribution volumes. This finding underscores the
importance of using appropriate models for drug delivery.
Future Work
This dissertation discusses CED for the infusion of therapeutic agents for epilepsy
treatment. Future work will focus on three extensions of these studies. Firstly, a larger
CED study will be undertaken at chronic time points. Since there are millions of people
in the world suffering from chronic epilepsy today, it is important to quantify distributions
using more animals at this treatment time point. Preliminary data from two animals
suggests distribution volumes at 60 days post-SE are not significantly different from
controls, implying that control Gd-albumin distributions can reliably predict infusion
patterns in chronic brain injury. We suspected ongoing neurodegeneration, cell loss,
and Wallerian degeneration would create pooling within the enlarged ECS and
decrease infusate volumes in the brain. Preliminary studies do not seem to support this
hypothesis, but more animals are needed to make that conclusion.
Secondly, one important dimension not measured in the studies described is the
distribution of concentration. Quantifying volume distributions is particularly relevant for
infusions of toxic or lytic agents that should be controlled carefully. It is also important to
know which structures are being targeted. However, the increase or decrease of
distribution volumes in the brain implies differences in concentration across animals.
Acquiring concentration measurements with MR are a future goal of these studies.
Concentration can currently be determined with autoradiography studies post-mortem,
but quantifying concentration maps using MR in addition to volumetric analyses will
allow for true co-registration of infusate concentration and spatial spread in vivo.

126
Finally, a third, and natural extension of these studies is to use CED to deliver
therapeutic agents. Work is currently being done to deliver light-activated protein
channels into the hippocampus to evoke cell-type specific activity with light. These
proteins can be virally transduced into any cell type with gene therapy, and then used to
modulate cell firing. This approach can be used to explore the causal function of
individual neuron types in epileptic circuitry and characterize the underlying cellular
dysfunction in the hippocampus.
Future studies also include using CED to deliver nanoparticles encapsulating or
conjugating potential drugs. Depending on their molecular weight and stability,
nanoparticles can release drugs over hours and days to several months (Yasukawa et
al., 2005). In general, nanoparticles are considered optimal for drug delivery to the brain
as their mean size allows traveling through physical restrictions presented by the brain
interstitial space. Nanoparticle encapsulation of the compound MRZ 2/576 resulted in
an increased duration of its antiepileptic activity (Friese et al., 2000). Efforts have also
been made to prepare and optimize nano-sized carrier systems for phenytoin (Thakur
and Gupta, 2006), carbamazepine (Douroumis and Fahr, 2007), clonazepam (Jeong et
al., 1998; Ryu et al., 2000), diazepam (Abdelbary and Fahmy, 2009), and valproic acid
(Darius et al., 2000). Although experimental progress has been made in development of
nano-carriers for AED release, pharmacokinetic data on the use of nanoparticles to
deliver these drugs are very limited. Future work will focus on using CED to deliver and
study in vivo pharmacodynamics.

127
LIST OF REFERENCES
Abdelbary G, Fahmy RH (2009) Diazepam-loaded solid lipid nanoparticles: design and characterization. AAPS PharmSciTech 10:211-219.
Abujudeh HH, Kaewlai R, Kagan A, Chibnik LB, Nazarian RM, High WA, Kay J (2009) Nephrogenic systemic fibrosis after gadopentetate dimeglumine exposure: case series of 36 patients. Radiology 253:81-89.
Agyare EK, Curran GL, Ramakrishnan M, Yu CC, Poduslo JF, Kandimalla KK (2008) Development of a smart nano-vehicle to target cerebrovascular amyloid deposits and brain parenchymal plaques observed in Alzheimer's disease and cerebral amyloid angiopathy. Pharm Res 25:2674-2684.
Amaral DG, Lavenex P (2007) Hippocampal Neuroanatomy. In: The Hippocampus Book, pp 37-94. New York: Oxford University Press.
Andersen P, Bliss TV, Lomo T, Olsen LI, Skrede KK (1969) Lamellar organization of hippocampal excitatory pathways. Acta Physiol Scand 76:4A-5A.
Astary GW, Kantorovich S, Carney PR, Mareci TH, Sarntinoranont M (2010) Regional convection-enhanced delivery of gadolinium-labeled albumin in the rat hippocampus in vivo. J Neurosci Methods 187:129-137.
Babb TL, Brown W.J. (1987) Pathological findings in epilepsy. In: Surgical Treatment of the Epilepsies (J. Enfel J, ed), pp 511-540. New York: Raven Press.
Baker GA, Jacoby A, Buck D, Stalgis C, Monnet D (1997) Quality of life of people with epilepsy: a European study. Epilepsia 38:353-362.
Bakhshi S, North RB (1995) Implantable pumps for drug delivery to the brain. J Neurooncol 26:133-139.
Bankiewicz KS, Eberling JL, Kohutnicka M, Jagust W, Pivirotto P, Bringas J, Cunningham J, Budinger TF, Harvey-White J (2000) Convection-enhanced delivery of AAV vector in parkinsonian monkeys; in vivo detection of gene expression and restoration of dopaminergic function using pro-drug approach. Exp Neurol 164:2-14.
Barcia JA, Gallego JM (2009) Intraventricular and intracerebral delivery of anti-epileptic drugs in the kindling model. Neurotherapeutics 6:337-343.
Basser PJ, Jones DK (2002) Diffusion-tensor MRI: theory, experimental design and data analysis - a technical review. NMR Biomed 15:456-467.
Ben-Ari Y, Crepel V, Represa A (2008) Seizures beget seizures in temporal lobe epilepsies: the boomerang effects of newly formed aberrant kainatergic synapses. Epilepsy Curr 8:68-72.

128
Beniczky S, Jose Miranda M, Alving J, Heber Povlsen J, Wolf P (2010) Effectiveness of the ketogenic diet in a broad range of seizure types and EEG features for severe childhood epilepsies. Acta Neurologica Scandinavica 121:58-62.
Berg AT, Vickrey BG, Langfitt JT, Sperling MR, Walczak TS, Shinnar S, Bazil CW, Pacia SV, Spencer SS (2003) The multicenter study of epilepsy surgery: recruitment and selection for surgery. Epilepsia 44:1425-1433.
Bernasconi N, Duchesne S, Janke A, Lerch J, Collins DL, Bernasconi A (2004) Whole-brain voxel-based statistical analysis of gray matter and white matter in temporal lobe epilepsy. Neuroimage 23:717-723.
Bertram EH (1997) Functional anatomy of spontaneous seizures in a rat model of limbic epilepsy. Epilepsia 38:95-105.
Bertram EH (2009) Temporal lobe epilepsy: where do the seizures really begin? Epilepsy Behav 14 Suppl 1:32-37.
Bertram EH, Cornett JF (1994) The evolution of a rat model of chronic spontaneous limbic seizures. Brain Res 661:157-162.
Bertram EH, Lothman EW, Lenn NJ (1990) The hippocampus in experimental chronic epilepsy: a morphometric analysis. Ann Neurol 27:43-48.
Bland M (1995) Methods based on rank order. In: An Introduction to Medical Statistics, pp 205-225. Oxford: Oxford University Press.
Blasberg RG, Patlak C, Fenstermacher JD (1975) Intrathecal chemotherapy: brain tissue profiles after ventriculocisternal perfusion. J Pharmacol Exp Ther 195:73-83.
Blumcke I, Thom M, Wiestler OD (2002) Ammon's horn sclerosis: a maldevelopmental disorder associated with temporal lobe epilepsy. Brain Pathol 12:199-211.
Blumcke I, Suter B, Behle K, Kuhn R, Schramm J, Elger CE, Wiestler OD (2000) Loss of hilar mossy cells in Ammon's horn sclerosis. Epilepsia 41 Suppl 6:S174-180.
Blumcke I, Zuschratter W, Schewe JC, Suter B, Lie AA, Riederer BM, Meyer B, Schramm J, Elger CE, Wiestler OD (1999) Cellular pathology of hilar neurons in Ammon's horn sclerosis. J Comp Neurol 414:437-453.
Blurton-Jones M, Kitazawa M, Martinez-Coria H, Castello NA, Muller FJ, Loring JF, Yamasaki TR, Poon WW, Green KN, LaFerla FM (2009) Neural stem cells improve cognition via BDNF in a transgenic model of Alzheimer disease. Proc Natl Acad Sci U S A 106:13594-13599.
Bobo RH, Laske DW, Akbasak A, Morrison PF, Dedrick RL, Oldfield EH (1994) Convection-enhanced delivery of macromolecules in the brain. Proc Natl Acad Sci U S A 91:2076-2080.

129
Bodor N, Kaminski JJ (1987) Prodrugs and site-specific chemical delivery systems. Annual Reports in Medicinal Chemistry 22:303-313.
Bondareff W, Pysh JJ (1968) Distribution of the extracellular space during postnatal maturation of rat cerebral cortex. Anat Rec 160:773-780.
Borowicz KK, Luszczki JJ, Duda AM, Czuczwar SJ (2003) Effect of topiramate on the anticonvulsant activity of conventional antiepileptic drugs in two models of experimental epilepsy. Epilepsia 44:640-646.
Bradbury MW (1985) The blood-brain barrier. Transport across the cerebral endothelium. Circ Res 57:213-222.
Brandt C, Potschka H, Loscher W, Ebert U (2003) N-methyl-D-aspartate receptor blockade after status epilepticus protects against limbic brain damage but not against epilepsy in the kainate model of temporal lobe epilepsy. Neuroscience 118:727-740.
Brightman MW (1965) The distribution within the brain of ferritin injected into cerebrospinal fluid compartments. II. Parenchymal distribution. Am J Anat 117:193-219.
Brodie MJ, Dichter MA (1996) Antiepileptic drugs. N Engl J Med 334:168-175.
Browne TR, Holmes GL (2001) Epilepsy. N Engl J Med 344:1145-1151.
Bruton C (1988) The neuropathology of temporal lobe epilepsy. In: Institute of Psychiatry Maudsley Monographs 31. Oxford, UK: Oxford University Press.
Burger C, Gorbatyuk OS, Velardo MJ, Peden CS, Williams P, Zolotukhin S, Reier PJ, Mandel RJ, Muzyczka N (2004) Recombinant AAV Viral Vectors Pseudotyped with Viral Capsids from Serotypes 1, 2, and 5 Display Differential Efficiency and Cell Tropism after Delivery to Different Regions of the Central Nervous System. Mol Ther 10:302-317.
Burtea C, Laurent S, Vander Elst L, Muller RN (2008) Contrast agents: magnetic resonance. Handb Exp Pharmacol:135-165.
Caravan P, Ellison JJ, McMurry TJ, Lauffer RB (1999) Gadolinium(III) Chelates as MRI Contrast Agents: Structure, Dynamics, and Applications. Chem Rev 99:2293-2352.
Castillo CG, Mendoza S, Freed WJ, Giordano M (2006) Intranigral transplants of immortalized GABAergic cells decrease the expression of kainic acid-induced seizures in the rat. Behav Brain Res 171:109-115.
Cavalheiro E (1995) The pilocarpine model of epilepsy. The Italian Journal of Neurological Sciences 16:33-37.
130
Cearley CN, Wolfe JH (2006) Transduction characteristics of adeno-associated virus vectors expressing cap serotypes 7, 8, 9, and Rh10 in the mouse brain. Mol Ther 13:528-537.
Charous SJ, Kempster G, Manders E, Ristanovic R (2001) The effect of vagal nerve stimulation on voice. Laryngoscope 111:2028-2031.
Chen MY, Lonser RR, Morrison PF, Governale LS, Oldfield EH (1999) Variables affecting convection-enhanced delivery to the striatum: a systematic examination of rate of infusion, cannula size, infusate concentration, and tissue-cannula sealing time. J Neurosurg 90:315-320.
Chen MY, Hoffer A, Morrison PF, Hamilton JF, Hughes J, Schlageter KS, Lee J, Kelly BR, Oldfield EH (2005) Surface properties, more than size, limiting convective distribution of virus-sized particles and viruses in the central nervous system. J Neurosurg 103:311-319.
Chen X, Astary GW, Sepulveda H, Mareci TH, Sarntinoranont M (2008) Quantitative assessment of macromolecular concentration during direct infusion into an agarose hydrogel phantom using contrast-enhanced MRI. Magn Reson Imaging 26:1433-1441.
Chu K, Kim M, Jung KH, Jeon D, Lee ST, Kim J, Jeong SW, Kim SU, Lee SK, Shin HS (2004) Human neural stem cell transplantation reduces spontaneous recurrent seizures following pilocarpine-induced status epilepticus in adult rats. Brain Research 1023:213-221.
Coloma MJ, Lee HJ, Kurihara A, Landaw EM, Boado RJ, Morrison SL, Pardridge WM (2000) Transport across the primate blood-brain barrier of a genetically engineered chimeric monoclonal antibody to the human insulin receptor. Pharm Res 17:266-274.
Commission on Classification and Terminology of the International League Against Epilepsy (1981) Proposal for revised clinical and electroencephalographic classification of epileptic seizures. Epilepsia 22:489-501.
Commission on Classification and Terminology of the International League Against Epilepsy (1989) Proposal for revised classification of epilepsies and epileptic syndromes. Epilepsia 30:389-399.
Commission on Epidemiology and Prognosis of the International League Against Epilepsy (1993) Guidelines for epidemiologic studies on epilepsy. . Epilepsia 34:592-596.
Corsellis JA, Goldberg GJ, Norton AR (1968) "Limbic encephalitis" and its association with carcinoma. Brain 91:481-496.
131
Cragg B (1979) Brain extracellular space fixed for electron microscopy. Neurosci Lett 15:301-306.
Cundy KC, Annamalai T, Bu L, De Vera J, Estrela J, Luo W, Shirsat P, Torneros A, Yao F, Zou J, Barrett RW, Gallop MA (2004) XP13512 [(+/-)-1-([(alpha-isobutanoyloxyethoxy)carbonyl] aminomethyl)-1-cyclohexane acetic acid], a novel gabapentin prodrug: II. Improved oral bioavailability, dose proportionality, and colonic absorption compared with gabapentin in rats and monkeys. J Pharmacol Exp Ther 311:324-333.
Darius J, Meyer FP, Sabel BA, Schroeder U (2000) Influence of nanoparticles on the brain-to-serum distribution and the metabolism of valproic acid in mice. J Pharm Pharmacol 52:1043-1047.
Davidson BL, Stein CS, Heth JA, Martins I, Kotin RM, Derksen TA, Zabner J, Ghodsi A, Chiorini JA (2000) Recombinant adeno-associated virus type 2, 4, and 5 vectors: transduction of variant cell types and regions in the mammalian central nervous system. Proc Natl Acad Sci U S A 97:3428-3432.
de Lanerolle NC, Lee TS (2005) New facets of the neuropathology and molecular profile of human temporal lobe epilepsy. Epilepsy Behav 7:190-203.
de Lanerolle NC, Kim JH, Williamson A, Spencer SS, Zaveri HP, Eid T, Spencer DD (2003) A retrospective analysis of hippocampal pathology in human temporal lobe epilepsy: evidence for distinctive patient subcategories. Epilepsia 44:677-687.
DeGiorgio CM et al. (2000) Prospective long-term study of vagus nerve stimulation for the treatment of refractory seizures. Epilepsia 41:1195-1200.
Demeule M, Regina A, Che C, Poirier J, Nguyen T, Gabathuler R, Castaigne JP, Beliveau R (2008) Identification and design of peptides as a new drug delivery system for the brain. J Pharmacol Exp Ther 324:1064-1072.
deToledo-Morrell L, Stoub TR, Wang C (2007) Hippocampal atrophy and disconnection in incipient and mild Alzheimer's disease. Prog Brain Res 163:741-753.
Dickson DW, Davies P, Bevona C, Van Hoeven KH, Factor SM, Grober E, Aronson MK, Crystal HA (1994) Hippocampal sclerosis: a common pathological feature of dementia in very old (> or = 80 years of age) humans. Acta Neuropathol 88:212-221.
Dietzel I, Heinemann U, Lux HD (1989) Relations between slow extracellular potential changes, glial potassium buffering, and electrolyte and cellular volume changes during neuronal hyperactivity in cat brain. Glia 2:25-44.
Dietzel I, Heinemann U, Hofmeier G, Lux HD (1980) Transient changes in the size of the extracellular space in the sensorimotor cortex of cats in relation to stimulus-induced changes in potassium concentration. Exp Brain Res 40:432-439.

132
Ding D, Kanaly CW, Cummings TJ, Ii JE, Raghavan R, Sampson JH (2009) Long-term safety of combined intracerebral delivery of free gadolinium and targeted chemotherapeutic agent PRX321. Neurol Res.
Dolorfo CL, Amaral DG (1998) Entorhinal cortex of the rat: topographic organization of the cells of origin of the perforant path projection to the dentate gyrus. J Comp Neurol 398:25-48.
Doolittle ND, Abrey LE, Ferrari N, Hall WA, Laws ER, McLendon RE, Muldoon LL, Peereboom D, Peterson DR, Reynolds CP, Senter P, Neuwelt EA (2002) Targeted delivery in primary and metastatic brain tumors: summary report of the seventh annual meeting of the Blood-Brain Barrier Disruption Consortium. Clin Cancer Res 8:1702-1709.
Douroumis D, Fahr A (2007) Stable carbamazepine colloidal systems using the cosolvent technique. Eur J Pharm Sci 30:367-374.
Du F, Schwarcz R, Tamminga CA (1995) Entorhinal cortex in temporal lobe epilepsy. Am J Psychiatry 152:826.
Du F, Whetsell WO, Jr., Abou-Khalil B, Blumenkopf B, Lothman EW, Schwarcz R (1993) Preferential neuronal loss in layer III of the entorhinal cortex in patients with temporal lobe epilepsy. Epilepsy Res 16:223-233.
Duyckaerts C, Panchal M, Delatour B, Potier MC (2009) [Morphologic and molecular neuropathology of Alzheimer's disease.]. Ann Pharm Fr 67:127-135.
Engel J, Jr. (2001a) A proposed diagnostic scheme for people with epileptic seizures and with epilepsy: report of the ILAE Task Force on Classification and Terminology. Epilepsia 42:796-803.
Engel J, Jr. (2001b) Intractable epilepsy: definition and neurobiology. Epilepsia 42 Suppl 6:3.
Esclassan F, Coutureau E, Di Scala G, Marchand AR (2009) Differential contribution of dorsal and ventral hippocampus to trace and delay fear conditioning. Hippocampus 19:33-44.
Fa Z, Zhang R, Li P, Zhang J, Zhang P, Zhu S, Wu Q, Huang F, Liu Y, Yang L, Chang H, Wen Z, Gao D, Zeng Y, Jiang X (2011) Effects of temporarily disrupting BBB on activity-induced manganese-dependent functional MRI. Brain Imaging Behav 5:181-188.
Fabene P, Marzola P, Sbarbati A, Bentivoglio M (2003) Magnetic resonance imaging of changes elicited by status epilepticus in the rat brain: diffusion-weighted and T2-weighted images, regional blood volume maps, and direct correlation with tissue and cell damage. Neuroimage 18:375-389.

133
Falconer MA (1974) Mesial temporal (Ammon's horn) sclerosis as a common cause of epilepsy. Aetiology, treatment, and prevention. Lancet 2:767-770.
Fechner J, Schwilden H, Schuttler J (2008) Pharmacokinetics and pharmacodynamics of GPI 15715 or fospropofol (Aquavan injection) - a water-soluble propofol prodrug. Handb Exp Pharmacol:253-266.
Fenstermacher J, Kaye T (1988) Drug "diffusion" within the brain. Ann N Y Acad Sci 531:29-39.
Fiandaca MS, Varenika V, Eberling J, McKnight T, Bringas J, Pivirotto P, Beyer J, Hadaczek P, Bowers W, Park J, Federoff H, Forsayeth J, Bankiewicz KS (2009) Real-time MR imaging of adeno-associated viral vector delivery to the primate brain. Neuroimage 47 Suppl 2:T27-35.
Foley CP, Nishimura N, Neeves KB, Schaffer CB, Olbricht WL (2009) Flexible microfluidic devices supported by biodegradable insertion scaffolds for convection-enhanced neural drug delivery. Biomed Microdevices 11:915-924.
French JA, Williamson PD, Thadani VM, Darcey TM, Mattson RH, Spencer SS, Spencer DD (1993) Characteristics of medial temporal lobe epilepsy: I. Results of history and physical examination. Ann Neurol 34:774-780.
Fricke R, Cowan WM (1978) An autoradiographic study of the commissural and ipsilateral hippocampo-dentate projections in the adult rat. J Comp Neurol 181:253-269.
Friedman A (2011) Blood-brain barrier dysfunction, status epilepticus, seizures, and epilepsy: a puzzle of a chicken and egg? Epilepsia 52 Suppl 8:19-20.
Friese A, Seiller E, Quack G, Lorenz B, Kreuter J (2000) Increase of the duration of the anticonvulsive activity of a novel NMDA receptor antagonist using poly(butylcyanoacrylate) nanoparticles as a parenteral controlled release system. Eur J Pharm Biopharm 49:103-109.
Gabathuler R (2010) Approaches to transport therapeutic drugs across the blood-brain barrier to treat brain diseases. Neurobiol Dis 37:48-57.
Gant JC, Thibault O, Blalock EM, Yang J, Bachstetter A, Kotick J, Schauwecker PE, Hauser KF, Smith GM, Mervis R, Li Y, Barnes GN (2009) Decreased number of interneurons and increased seizures in neuropilin 2 deficient mice: implications for autism and epilepsy. Epilepsia 50:629-645.
Gasior M, White NA, Rogawski MA (2007) Prolonged attenuation of amygdala-kindled seizure measures in rats by convection-enhanced delivery of the N-type calcium channel antagonists omega-conotoxin GVIA and omega-conotoxin MVIIA. J Pharmacol Exp Ther 323:458-468.

134
Gernert M, Thompson KW, Loscher W, Tobin AJ (2002) Genetically engineered GABA-producing cells demonstrate anticonvulsant effects and long-term transgene expression when transplanted into the central piriform cortex of rats. Exp Neurol 176:183-192.
Geyelin HR (1921) Fasting as a method for treating epilepsy. Med Record 99:1037-1039.
Gibbons JD (1993) Nonparametric measures of association. Thousand Oaks, CA: Sage Publication.
Gill SS, Patel NK, Hotton GR, O'Sullivan K, McCarter R, Bunnage M, Brooks DJ, Svendsen CN, Heywood P (2003) Direct brain infusion of glial cell line-derived neurotrophic factor in Parkinson disease. Nat Med 9:589-595.
Goldstein GW, Betz AL (1986) The blood-brain barrier. Sci Am 255:74-83.
Goodman JH (1998) Experimental models of status epilepticus. In: Neuropharmacological Methods in Epilepsy Research (Peterson SL, Albertson T.E., ed), pp 95-125. Boca Raton: CRC Press.
Gorter JA, Goncalves Pereira PM, van Vliet EA, Aronica E, Lopes da Silva FH, Lucassen PJ (2003) Neuronal cell death in a rat model for mesial temporal lobe epilepsy is induced by the initial status epilepticus and not by later repeated spontaneous seizures. Epilepsia 44:647-658.
Gowers WR (1881) Epilepsy and other chronic convulsive diseases; their causes, symptoms and treatment. London: J&A Churchill.
Groothuis DR, Vavra MW, Schlageter KE, Kang EW, Itskovich AC, Hertzler S, Allen CV, Lipton HL (2007) Efflux of drugs and solutes from brain: the interactive roles of diffusional transcapillary transport, bulk flow and capillary transporters. J Cereb Blood Flow Metab 27:43-56.
Guarnieri M, Carson BS, Khan A, Penno M, Jallo GI (2005) Flexible versus rigid catheters for chronic administration of exogenous agents into central nervous system tissues. J Neurosci Methods 144:147-152.
Haberman RP, Samulski RJ, McCown TJ (2003) Attenuation of seizures and neuronal death by adeno-associated virus vector galanin expression and secretion. Nat Med 9:1076-1080.
Haluska M, Anthony ML (2004) Osmotic blood-brain barrier modification for the treatment of malignant brain tumors. Clin J Oncol Nurs 8:263-267.

135
Handforth A, Treiman DM (1994) A new, non-pharmacologic model of convulsive status epilepticus induced by electrical stimulation: behavioral/electroencephalographic observations and response to phenytoin and phenobarbital. Epilepsy Res 19:15-25.
Harbaugh RE, Saunders RL, Reeder RF (1988) Use of implantable pumps for central nervous system drug infusions to treat neurological disease. Neurosurgery 23:693-698.
Haring JH, Davis JN (1985) Differential distribution of locus coeruleus projections to the hippocampal formation: anatomical and biochemical evidence. Brain Res 325:366-369.
Hattiangady B, Rao MS, Shetty AK (2008) Grafting of striatal precursor cells into hippocampus shortly after status epilepticus restrains chronic temporal lobe epilepsy. Exp Neurol 212:468-481.
Hauser WA (1997) Incidence and prevalence. Philadelphia: Lippincott-Raven.
Hauser WA, Lee JR (2002) Do seizures beget seizures? Progress in Brain Research 135:215-219.
Heiss JD, Walbridge S, Morrison P, Hampton RR, Sato S, Vortmeyer A, Butman JA, O'Malley J, Vidwan P, Dedrick RL, Oldfield EH (2005) Local distribution and toxicity of prolonged hippocampal infusion of muscimol. J Neurosurg 103:1035-1045.
Hellier JL, Patrylo PR, Buckmaster PS, Dudek FE (1998) Recurrent spontaneous motor seizures after repeated low-dose systemic treatment with kainate: assessment of a rat model of temporal lobe epilepsy. Epilepsy Res 31:73-84.
Hoehn M, Kustermann E, Blunk J, Wiedermann D, Trapp T, Wecker S, Focking M, Arnold H, Hescheler J, Fleischmann BK, Schwindt W, Buhrle C (2002) Monitoring of implanted stem cell migration in vivo: a highly resolved in vivo magnetic resonance imaging investigation of experimental stroke in rat. Proc Natl Acad Sci U S A 99:16267-16272.
Hrabetova S (2005) Extracellular diffusion is fast and isotropic in the stratum radiatum of hippocampal CA1 region in rat brain slices. Hippocampus 15:441-450.
Hrabetova S, Nicholson C (2000) Dextran decreases extracellular tortuosity in thick-slice ischemia model. J Cereb Blood Flow Metab 20:1306-1310.
Hrabetova S, Nicholson C (2007) Biophysical Properties of Brain Extracellular Space Explored with Ion-Selective Microelectrodes, Integrative Optical Imaging and Related Techniques. In: Electrochemical Methods for Neuroscience (Michael AC, Borland LM, eds). Boca Raton (FL).

136
Hsu YH, Lee WT, Chang C (2007) Multiparametric MRI evaluation of kainic acid-induced neuronal activation in rat hippocampus. Brain 130:3124-3134.
Hudson LP, Munoz DG, Miller L, McLachlan RS, Girvin JP, Blume WT (1993) Amygdaloid sclerosis in temporal lobe epilepsy. Ann Neurol 33:622-631.
Hughes GA (2005) Nanostructure-mediated drug delivery. Nanomedicine 1:22-30.
Humphrey T (1967) The development of the human hippocampal fissure. J Anat 101:655-676.
Huttunen KM, Raunio H, Rautio J (2011) Prodrugs--from serendipity to rational design. Pharmacol Rev 63:750-771.
Hwang DW, Son S, Jang J, Youn H, Lee S, Lee D, Lee YS, Jeong JM, Kim WJ, Lee DS (2011) A brain-targeted rabies virus glycoprotein-disulfide linked PEI nanocarrier for delivery of neurogenic microRNA. Biomaterials.
Ishizuka N, Weber J, Amaral DG (1990) Organization of intrahippocampal projections originating from CA3 pyramidal cells in the rat. J Comp Neurol 295:580-623.
Ivanchenko O, Ivanchenko V (2011) Designing and testing of backflow-free catheters. J Biomech Eng 133:061003.
Jagannathan J, Walbridge S, Butman JA, Oldfield EH, Lonser RR (2008) Effect of ependymal and pial surfaces on convection-enhanced delivery. J Neurosurg 109:547-552.
Jeong YI, Cheon JB, Kim SH, Nah JW, Lee YM, Sung YK, Akaike T, Cho CS (1998) Clonazepam release from core-shell type nanoparticles in vitro. J Control Release 51:169-178.
Jung MW, Wiener SI, McNaughton BL (1994) Comparison of spatial firing characteristics of units in dorsal and ventral hippocampus of the rat. J Neurosci 14:7347-7356.
Kanter-Schlifke I, Toft Sorensen A, Ledri M, Kuteeva E, Hokfelt T, Kokaia M (2007) Galanin gene transfer curtails generalized seizures in kindled rats without altering hippocampal synaptic plasticity. Neuroscience 150:984-992.
Karkan D, Pfeifer C, Vitalis TZ, Arthur G, Ujiie M, Chen Q, Tsai S, Koliatis G, Gabathuler R, Jefferies WA (2008) A unique carrier for delivery of therapeutic compounds beyond the blood-brain barrier. PLoS One 3:e2469.
Kikuchi T, Saito R, Sugiyama S, Yamashita Y, Kumabe T, Krauze M, Bankiewicz K, Tominaga T (2008) Convection-enhanced delivery of polyethylene glycol-coated liposomal doxorubicin: characterization and efficacy in rat intracranial glioma models. J Neurosurg 109:867-873.

137
Kim JA, Chung JI, Yoon PH, Kim DI, Chung TS, Kim EJ, Jeong EK (2001) Transient MR signal changes in patients with generalized tonicoclonic seizure or status epilepticus: periictal diffusion-weighted imaging. American journal of neuroradiology 22:1149-1160.
Kim JH, Mareci TH, Sarntinoranont M (2010) A voxelized model of direct infusion into the corpus callosum and hippocampus of the rat brain: model development and parameter analysis. Med Biol Eng Comput 48:203-214.
Kim JH, Astary GW, Chen X, Mareci TH, Sarntinoranont M (2009) Voxelized model of interstitial transport in the rat spinal cord following direct infusion into white matter. J Biomech Eng 131:071007.
Klein RL, Dayton RD, Tatom JB, Henderson KM, Henning PP (2007) AAV8, 9, Rh10, Rh43 Vector Gene Transfer in the Rat Brain: Effects of Serotype, Promoter and Purification Method. Mol Ther 16:89-96.
Klein RL, Dayton RD, Leidenheimer NJ, Jansen K, Golde TE, Zweig RM (2006) Efficient neuronal gene transfer with AAV8 leads to neurotoxic levels of tau or green fluorescent proteins. Mol Ther 13:517-527.
Krauze MT, Forsayeth J, Park JW, Bankiewicz KS (2006) Real-time imaging and quantification of brain delivery of liposomes. Pharm Res 23:2493-2504.
Krauze MT, Saito R, Noble C, Tamas M, Bringas J, Park JW, Berger MS, Bankiewicz K (2005) Reflux-free cannula for convection-enhanced high-speed delivery of therapeutic agents. J Neurosurg 103:923-929.
Krauze MT, Vandenberg SR, Yamashita Y, Saito R, Forsayeth J, Noble C, Park J, Bankiewicz KS (2008) Safety of real-time convection-enhanced delivery of liposomes to primate brain: a long-term retrospective. Exp Neurol 210:638-644.
Krettek JE, Price JL (1977) Projections from the amygdaloid complex and adjacent olfactory structures to the entorhinal cortex and to the subiculum in the rat and cat. J Comp Neurol 172:723-752.
Kuzniecky R, de la Sayette V, Ethier R, Melanson D, Andermann F, Berkovic S, Robitaille Y, Olivier A, Peters T, Feindel W (1987) Magnetic resonance imaging in temporal lobe epilepsy: pathological correlations. Ann Neurol 22:341-347.
Lambert DM (2000) Rationale and applications of lipids as prodrug carriers. Eur J Pharm Sci 11 Suppl 2:S15-27.
Lauffer RB, Vincent AC, Padmanabhan S, Villringer A, Saini S, Elmaleh DR, Brady TJ (1987) Hepatobiliary MR contrast agents: 5-substituted iron-EHPG derivatives. Magn Reson Med 4:582-590.

138
Lee SJ, Sun J, Flint JJ, Guo S, Xie HK, King MA, Sarntinoranont M (2011) Optically based-indentation technique for acute rat brain tissue slices and thin biomaterials. J Biomed Mater Res B Appl Biomater 97:84-95.
Lewis DV (2005) Losing neurons: selective vulnerability and mesial temporal sclerosis. Epilepsia 46 Suppl 7:39-44.
Li T, Ren G, Lusardi T, Wilz A, Lan JQ, Iwasato T, Itohara S, Simon RP, Boison D (2008) Adenosine kinase is a target for the prediction and prevention of epileptogenesis in mice. J Clin Invest 118:571-582.
Li T, Steinbeck JA, Lusardi T, Koch P, Lan JQ, Wilz A, Segschneider M, Simon RP, Brustle O, Boison D (2007) Suppression of kindling epileptogenesis by adenosine releasing stem cell-derived brain implants. Brain 130:1276-1288.
Li XG, Somogyi P, Ylinen A, Buzsaki G (1994) The hippocampal CA3 network: an in vivo intracellular labeling study. J Comp Neurol 339:181-208.
Liu KC, Bhardwaj A (2007) Use of prophylactic anticonvulsants in neurologic critical care: a critical appraisal. Neurocrit Care 7:175-184.
Lonser RR, Walbridge S, Garmestani K, Butman JA, Walters HA, Vortmeyer AO, Morrison PF, Brechbiel MW, Oldfield EH (2002) Successful and safe perfusion of the primate brainstem: in vivo magnetic resonance imaging of macromolecular distribution during infusion. J Neurosurg 97:905-913.
Loscher W (1997) Animal models of intractable epilepsy. Prog Neurobiol 53:239-258.
Loscher W (2011) Critical review of current animal models of seizures and epilepsy used in the discovery and development of new antiepileptic drugs. Seizure 20:359-368.
Loscher W, Schmidt D (2002) New horizons in the development of antiepileptic drugs. Epilepsy Res 50:3-16.
Loscher W, Gernert M, Heinemann U (2008) Cell and gene therapies in epilepsy--promising avenues or blind alleys? Trends Neurosci 31:62-73.
Lothman EW, Bertram EH, Bekenstein JW, Perlin JB (1989) Self-sustaining limbic status epilepticus induced by 'continuous' hippocampal stimulation: electrographic and behavioral characteristics. Epilepsy Res 3:107-119.
Lothman EW, Bertram EH, Kapur J, Stringer JL (1990) Recurrent spontaneous hippocampal seizures in the rat as a chronic sequela to limbic status epilepticus. Epilepsy Res 6:110-118.
Luo D, Woodrow-Mumford K, Belcheva N, Saltzman WM (1999) Controlled DNA delivery systems. Pharm Res 16:1300-1308.

139
MacKay JA, Deen DF, Szoka FC, Jr. (2005) Distribution in brain of liposomes after convection enhanced delivery; modulation by particle charge, particle diameter, and presence of steric coating. Brain Res 1035:139-153.
Maier M, Ron MA, Barker GJ, Tofts PS (1995) Proton magnetic resonance spectroscopy: an in vivo method of estimating hippocampal neuronal depletion in schizophrenia. Psychol Med 25:1201-1209.
Mandel RJ, Manfredsson FP, Foust KD, Rising A, Reimsnider S, Nash K, Burger C (2006) Recombinant adeno-associated viral vectors as therapeutic agents to treat neurological disorders. Mol Ther 13:463-483.
Manford M, Hart YM, Sander JW, Shorvon SD (1992) The National General Practice Study of Epilepsy. The syndromic classification of the International League Against Epilepsy applied to epilepsy in a general population. Arch Neurol 49:801-808.
Marchi N, Teng Q, Ghosh C, Fan Q, Nguyen MT, Desai NK, Bawa H, Rasmussen P, Masaryk TK, Janigro D (2010) Blood-brain barrier damage, but not parenchymal white blood cells, is a hallmark of seizure activity. Brain Res 1353:176-186.
Marchi N, Angelov L, Masaryk T, Fazio V, Granata T, Hernandez N, Hallene K, Diglaw T, Franic L, Najm I, Janigro D (2007) Seizure-promoting effect of blood-brain barrier disruption. Epilepsia 48:732-742.
Mardor Y, Last D, Daniels D, Shneor R, Maier SE, Nass D, Ram Z (2009) Convection-enhanced drug delivery of interleukin-4 Pseudomonas exotoxin (PRX321): increased distribution and magnetic resonance monitoring. J Pharmacol Exp Ther 330:520-525.
Margerison JH, Corsellis JA (1966) Epilepsy and the temporal lobes. A clinical, electroencephalographic and neuropathological study of the brain in epilepsy, with particular reference to the temporal lobes. Brain 89:499-530.
Marks WJ, Jr., Ostrem JL, Verhagen L, Starr PA, Larson PS, Bakay RA, Taylor R, Cahn-Weiner DA, Stoessl AJ, Olanow CW, Bartus RT (2008) Safety and tolerability of intraputaminal delivery of CERE-120 (adeno-associated virus serotype 2-neurturin) to patients with idiopathic Parkinson's disease: an open-label, phase I trial. Lancet Neurol 7:400-408.
Mathern GW, Pretorius JK, Babb TL (1995a) Quantified patterns of mossy fiber sprouting and neuron densities in hippocampal and lesional seizures. J Neurosurg 82:211-219.
Mathern GW, Babb TL, Pretorius JK, Leite JP (1995b) Reactive synaptogenesis and neuron densities for neuropeptide Y, somatostatin, and glutamate decarboxylase immunoreactivity in the epileptogenic human fascia dentata. J Neurosci 15:3990-4004.

140
Mathern GW, Babb TL, Leite JP, Pretorius K, Yeoman KM, Kuhlman PA (1996) The pathogenic and progressive features of chronic human hippocampal epilepsy. Epilepsy Res 26:151-161.
Mazel T, Simonova Z, Sykova E (1998) Diffusion heterogeneity and anisotropy in rat hippocampus. Neuroreport 9:1299-1304.
McBain CJ, Traynelis SF, Dingledine R (1990) Regional variation of extracellular space in the hippocampus. Science 249:674-677.
McCown TJ (2006) Adeno-associated virus-mediated expression and constitutive secretion of galanin suppresses limbic seizure activity in vivo. Mol Ther 14:63-68.
McCown TJ, Xiao X, Li J, Breese GR, Samulski RJ (1996) Differential and persistent expression patterns of CNS gene transfer by an adeno-associated virus (AAV) vector. Brain Res 713:99-107.
McGrew MJ, Sherman A, Ellard FM, Lillico SG, Gilhooley HJ, Kingsman AJ, Mitrophanous KA, Sang H (2004) Efficient production of germline transgenic chickens using lentiviral vectors. EMBO Rep 5:728-733.
McLaughlin J, Roozendaal B, Dumas T, Gupta A, Ajilore O, Hsieh J, Ho D, Lawrence M, McGaugh JL, Sapolsky R (2000) Sparing of neuronal function postseizure with gene therapy. Proc Natl Acad Sci U S A 97:12804-12809.
Meierkord H, Wieshmann U, Niehaus L, Lehmann R (1997) Structural consequences of status epilepticus demonstrated with serial magnetic resonance imaging. Acta Neurologica Scandinavica 96:127-132.
Mirski MA, Ferrendelli JA (1986) Anterior thalamic mediation of generalized pentylenetetrazol seizures. Brain Res 399:212-223.
Misra A, Ganesh S, Shahiwala A, Shah SP (2003) Drug delivery to the central nervous system: a review. J Pharm Pharm Sci 6:252-273.
Modlich U, Baum C (2009) Preventing and exploiting the oncogenic potential of integrating gene vectors. J Clin Invest 119:755-758.
Morrison PF, Chen MY, Chadwick RS, Lonser RR, Oldfield EH (1999) Focal delivery during direct infusion to brain: role of flow rate, catheter diameter, and tissue mechanics. Am J Physiol 277:R1218-1229.
Moser E, Moser MB, Andersen P (1993) Spatial learning impairment parallels the magnitude of dorsal hippocampal lesions, but is hardly present following ventral lesions. J Neurosci 13:3916-3925.

141
Nair S SD, Pardalos PD, Lasemidis L, Sackellares JC, Carney PR (2005) Dynamical Responses to Hippocampal Stimulation in a Rodent Model of Chronic Limbic Epilepsy. Epilepsia 46 Suppl:332.
Nairismagi J, Pitkanen A, Kettunen MI, Kauppinen RA, Kubova H (2006) Status epilepticus in 12-day-old rats leads to temporal lobe neurodegeneration and volume reduction: a histologic and MRI study. Epilepsia 47:479-488.
Nakasu Y, Nakasu S, Morikawa S, Uemura S, Inubushi T, Handa J (1995) Diffusion-weighted MR in experimental sustained seizures elicited with kainic acid. American journal of neuroradiology 16:1185-1192.
Nelson MD, Saykin AJ, Flashman LA, Riordan HJ (1998) Hippocampal volume reduction in schizophrenia as assessed by magnetic resonance imaging: a meta-analytic study. Arch Gen Psychiatry 55:433-440.
Neuwelt EA (2004) Mechanisms of disease: the blood-brain barrier. Neurosurgery 54:131-140; discussion 141-132.
Nicholson C, Sykova E (1998) Extracellular space structure revealed by diffusion analysis. Trends Neurosci 21:207-215.
Nicoletti JN, Shah SK, McCloskey DP, Goodman JH, Elkady A, Atassi H, Hylton D, Rudge JS, Scharfman HE, Croll SD (2008) Vascular endothelial growth factor is up-regulated after status epilepticus and protects against seizure-induced neuronal loss in hippocampus. Neuroscience 151:232-241.
Nitsch C, Klatzo I (1983) Regional patterns of blood-brain barrier breakdown during epileptiform seizures induced by various convulsive agents. J Neurol Sci 59:305-322.
Njie eG, Kantorovich S, Astary GW, Green C, Zheng T, Semple-Rowland SL, Steindler DA, Sarntinoranont M, Streit WJ, Borchelt DR (2012) A Preclinical Assessment of Neural Stem Cells as Delivery Vehicles for Anti-Amyloid Therapeutics. PLoS One 7: e34097. doi:10.1371/journal.pone.0034097.
Noe F, Nissinen J, Pitkanen A, Gobbi M, Sperk G, During M, Vezzani A (2007) Gene therapy in epilepsy: the focus on NPY. Peptides 28:377-383.
Noe F, Pool AH, Nissinen J, Gobbi M, Bland R, Rizzi M, Balducci C, Ferraguti F, Sperk G, During MJ, Pitkanen A, Vezzani A (2008) Neuropeptide Y gene therapy decreases chronic spontaneous seizures in a rat model of temporal lobe epilepsy. Brain 131:1506-1515.
Ohm TG (2007) The dentate gyrus in Alzheimer's disease. Prog Brain Res 163:723-740.
142
Olstorn H, Moe MC, Roste GK, Bueters T, Langmoen IA (2007) Transplantation of stem cells from the adult human brain to the adult rat brain. Neurosurgery 60:1089-1098; discussion 1098-1089.
Ommaya AK (1963) Subcutaneous Reservoir and Pump for Sterile Access to Ventricular Cerebrospinal Fluid. Lancet 2:983-984.
Oommen J, Kraus AC, Fisher RS (2007) Intraventricular administration of gabapentin in the rat increases flurothyl seizure threshold. Neurosci Lett 417:308-311.
Pardridge WM (1988) Recent advances in blood-brain barrier transport. Annu Rev Pharmacol Toxicol 28:25-39.
Pardridge WM (1997) Drug delivery to the brain. J Cereb Blood Flow Metab 17:713-731.
Pardridge WM (2003a) Blood-brain barrier genomics and the use of endogenous transporters to cause drug penetration into the brain. Curr Opin Drug Discov Devel 6:683-691.
Pardridge WM (2003b) Molecular biology of the blood-brain barrier. Methods Mol Med 89:385-399.
Pardridge WM (2005) The blood-brain barrier: bottleneck in brain drug development. NeuroRx 2:3-14.
Pardridge WM (2007) Drug targeting to the brain. Pharm Res 24:1733-1744.
Parekh MB, Carney PR, Sepulveda H, Norman W, King M, Mareci TH (2010) Early MR diffusion and relaxation changes in the parahippocampal gyrus precede the onset of spontaneous seizures in an animal model of chronic limbic epilepsy. Exp Neurol 224:258-270.
Park KI, Himes BT, Stieg PE, Tessler A, Fischer I, Snyder EY (2006) Neural stem cells may be uniquely suited for combined gene therapy and cell replacement: Evidence from engraftment of Neurotrophin-3-expressing stem cells in hypoxic-ischemic brain injury. Exp Neurol 199:179-190.
Paxinos GW, C. (1998) The rat brain in stereotaxic coordinates, 4th Edition. San Diego: Academic Press.
Perez-Pinzon MA, Tao L, Nicholson C (1995) Extracellular potassium, volume fraction, and tortuosity in rat hippocampal CA1, CA3, and cortical slices during ischemia. J Neurophysiol 74:565-573.
Peura L, Malmioja K, Laine K, Leppanen J, Gynther M, Isotalo A, Rautio J (2011) Large amino acid transporter 1 (LAT1) prodrugs of valproic acid: new prodrug design ideas for central nervous system delivery. Mol Pharm 8:1857-1866.

143
Pitkanen A (2002a) Efficacy of current antiepileptics to prevent neurodegeneration in epilepsy models. Epilepsy Res 50:141-160.
Pitkanen A (2002b) Drug-mediated neuroprotection and antiepileptogenesis: animal data. Neurology 59:S27-33.
Pitkanen A, Sutula TP (2002) Is epilepsy a progressive disorder? Prospects for new therapeutic approaches in temporal-lobe epilepsy. Lancet Neurol 1:173-181.
Racine RJ (1972) Modification of seizure activity by electrical stimulation. II. Motor seizure. Electroencephalogr Clin Neurophysiol 32:281-294.
Radojevic V, Kapfhammer JP (2009) Directed fiber outgrowth from transplanted embryonic cortex-derived neurospheres in the adult mouse brain. Neural Plast 2009:852492.
Raghavan R, Brady ML, Rodriguez-Ponce MI, Hartlep A, Pedain C, Sampson JH (2006) Convection-enhanced delivery of therapeutics for brain disease, and its optimization. Neurosurg Focus 20:E12.
Rao MS, Hattiangady B, Rai KS, Shetty AK (2007) Strategies for promoting anti-seizure effects of hippocampal fetal cells grafted into the hippocampus of rats exhibiting chronic temporal lobe epilepsy. Neurobiol Dis 27:117-132.
Raol YH, Lund IV, Bandyopadhyay S, Zhang G, Roberts DS, Wolfe JH, Russek SJ, Brooks-Kayal AR (2006) Enhancing GABA(A) receptor alpha 1 subunit levels in hippocampal dentate gyrus inhibits epilepsy development in an animal model of temporal lobe epilepsy. J Neurosci 26:11342-11346.
Rapoport SI (2000) Osmotic opening of the blood-brain barrier: principles, mechanism, and therapeutic applications. Cell Mol Neurobiol 20:217-230.
Rautio J, Kumpulainen H, Heimbach T, Oliyai R, Oh D, Jarvinen T, Savolainen J (2008) Prodrugs: design and clinical applications. Nat Rev Drug Discov 7:255-270.
Richichi C, Lin EJ, Stefanin D, Colella D, Ravizza T, Grignaschi G, Veglianese P, Sperk G, During MJ, Vezzani A (2004) Anticonvulsant and antiepileptogenic effects mediated by adeno-associated virus vector neuropeptide Y expression in the rat hippocampus. J Neurosci 24:3051-3059.
Rogawski MA (2009) Convection-enhanced delivery in the treatment of epilepsy. Neurotherapeutics 6:344-351.
Rubenstein JE (2008) Use of the ketogenic diet in neonates and infants. Epilepsia 49:30-32.

144
Ryu J, Jeong YI, Kim IS, Lee JH, Nah JW, Kim SH (2000) Clonazepam release from core-shell type nanoparticles of poly(epsilon-caprolactone)/poly(ethylene glycol)/poly(epsilon-caprolactone) triblock copolymers. Int J Pharm 200:231-242.
Saito R, Krauze MT, Noble CO, Tamas M, Drummond DC, Kirpotin DB, Berger MS, Park JW, Bankiewicz KS (2006) Tissue affinity of the infusate affects the distribution volume during convection-enhanced delivery into rodent brains: implications for local drug delivery. J Neurosci Methods 154:225-232.
Saltzman WM, Olbricht WL (2002) Building drug delivery into tissue engineering. Nat Rev Drug Discov 1:177-186.
Sampson JH, Brady ML, Petry NA, Croteau D, Friedman AH, Friedman HS, Wong T, Bigner DD, Pastan I, Puri RK (2007a) Intracerebral infusate distribution by convection-enhanced delivery in humans with malignant gliomas: descriptive effects of target anatomy and catheter positioning. Neurosurgery 60:89.
Sampson JH, Archer G, Pedain C, Wembacher-Schröder E, Westphal M, Kunwar S, Vogelbaum MA, Coan A, Herndon JE, Raghavan R (2010) Poor drug distribution as a possible explanation for the results of the PRECISE trial. J Neurosurg 113:301-309.
Sampson JH, Brady M, Raghavan R, Mehta AI, Friedman AH, Reardon DA, Petry NA, Barboriak DP, Wong TZ, Zalutsky MR, Lally-Goss D, Bigner DD (2011) Colocalization of gadolinium-diethylene triamine pentaacetic acid with high-molecular-weight molecules after intracerebral convection-enhanced delivery in humans. Neurosurgery 69:668-676.
Sampson JH, Raghavan R, Brady ML, Provenzale JM, Herndon JE, 2nd, Croteau D, Friedman AH, Reardon DA, Coleman RE, Wong T, Bigner DD, Pastan I, Rodriguez-Ponce MI, Tanner P, Puri R, Pedain C (2007b) Clinical utility of a patient-specific algorithm for simulating intracerebral drug infusions. Neuro Oncol 9:343-353.
Sanchez JC, Mareci TH, Norman WM, Principe JC, Ditto WL, Carney PR (2006) Evolving into epilepsy: Multiscale electrophysiological analysis and imaging in an animal model. Exp Neurol 198:31-47.
Sander JW (1993) Some aspects of prognosis in the epilepsies: a review. Epilepsia 34:1007-1016.
Sarntinoranont M, Chen X, Zhao J, Mareci TH (2006) Computational model of interstitial transport in the spinal cord using diffusion tensor imaging. Ann Biomed Eng 34:1304-1321.
Schmidt D, Loscher W (2009) New developments in antiepileptic drug resistance: an integrative view. Epilepsy Curr 9:47-52.

145
Schmued L, Bowyer J, Cozart M, Heard D, Binienda Z, Paule M (2008) Introducing Black-Gold II, a highly soluble gold phosphate complex with several unique advantages for the histochemical localization of myelin. Brain Res 1229:210-217.
Schmued LC, Stowers CC, Scallet AC, Xu L (2005) Fluoro-Jade C results in ultra high resolution and contrast labeling of degenerating neurons. Brain Res 1035:24-31.
Serralta A, Barcia JA, Ortiz P, Duran C, Hernandez ME, Alos M (2006) Effect of intracerebroventricular continuous infusion of valproic acid versus single i.p. and i.c.v. injections in the amygdala kindling epilepsy model. Epilepsy Res 70:15-26.
Shetty AK, Turner DA (2000) Fetal hippocampal grafts containing CA3 cells restore host hippocampal glutamate decarboxylase-positive interneuron numbers in a rat model of temporal lobe epilepsy. J Neurosci 20:8788-8801.
Shetty AK, Hattiangady B (2007) Concise review: prospects of stem cell therapy for temporal lobe epilepsy. Stem Cells 25:2396-2407.
Shetty AK, Zaman V, Hattiangady B (2005) Repair of the injured adult hippocampus through graft-mediated modulation of the plasticity of the dentate gyrus in a rat model of temporal lobe epilepsy. J Neurosci 25:8391-8401.
Shetty AK, Rao MS, Hattiangady B (2008) Behavior of hippocampal stem/progenitor cells following grafting into the injured aged hippocampus. J Neurosci Res 86:3062-3074.
Siegal T, Rubinstein R, Bokstein F, Schwartz A, Lossos A, Shalom E, Chisin R, Gomori JM (2000) In vivo assessment of the window of barrier opening after osmotic blood-brain barrier disruption in humans. J Neurosurg 92:599-605.
Simonova Z, Svoboda J, Orkand P, Bernard CC, Lassmann H, Sykova E (1996) Changes of extracellular space volume and tortuosity in the spinal cord of Lewis rats with experimental autoimmune encephalomyelitis. Physiol Res 45:11-22.
Sirven JI, Sperling M, Naritoku D, Schachter S, Labar D, Holmes M, Wilensky A, Cibula J, Labiner DM, Bergen D, Ristanovic R, Harvey J, Dasheiff R, Morris GL, O'Donovan CA, Ojemann L, Scales D, Nadkarni M, Richards B, Sanchez JD (2000) Vagus nerve stimulation therapy for epilepsy in older adults. Neurology 54:1179-1182.
Sloviter RS (1999) Status epilepticus-induced neuronal injury and network reorganization. Epilepsia 40 Suppl 1:S34-39; discussion S40-31.
Song DK, Lonser RR (2008) Convection-enhanced delivery for the treatment of pediatric neurologic disorders. J Child Neurol 23:1231-1237.
Spencer BJ, Verma IM (2007) Targeted delivery of proteins across the blood-brain barrier. Proc Natl Acad Sci U S A 104:7594-7599.
146
Stein AG, Eder HG, Blum DE, Drachev A, Fisher RS (2000) An automated drug delivery system for focal epilepsy. Epilepsy Res 39:103-114.
Sutula T (2002) Antiepileptic drugs to prevent neural degeneration associated with epilepsy: assessing the prospects for neuroprotection. Epilepsy Res 50:125-129.
Sykova E (1983) Extracellular K+ accumulation in the central nervous system. Prog Biophys Mol Biol 42:135-189.
Sykova E (1997a) The Extracellular Space in the CNS: Its Regulation, Volume and Geometry in Normal and Pathological Neuronal Function. The Neuroscientist 3:28-41.
Sykova E (1997b) The extracellular space in the CNS: its regulation, volume and geometry in normal and pathological neuronal function. In, pp 28-41: WILLIAMS & WILKINS.
Sykova E, Nicholson C (2008) Diffusion in brain extracellular space. Physiol Rev 88:1277-1340.
Sykova E, Mazel T, Simonova Z (1998) Diffusion constraints and neuron-glia interaction during aging. Exp Gerontol 33:837-851.
Sykova E, Svoboda J, Polak J, Chvatal A (1994) Extracellular volume fraction and diffusion characteristics during progressive ischemia and terminal anoxia in the spinal cord of the rat. J Cereb Blood Flow Metab 14:301-311.
Sykova E, Vargova L, Prokopova S, Simonova Z (1999a) Glial swelling and astrogliosis produce diffusion barriers in the rat spinal cord. Glia 25:56-70.
Sykova E, Roitbak T, Mazel T, Simonova Z, Harvey AR (1999b) Astrocytes, oligodendroglia, extracellular space volume and geometry in rat fetal brain grafts. Neuroscience 91:783-798.
Tang J, Xu H, Fan X, Li D, Rancourt D, Zhou G, Li Z, Yang L (2008) Embryonic stem cell-derived neural precursor cells improve memory dysfunction in Abeta(1-40) injured rats. Neurosci Res 62:86-96.
Tao L, Nicholson C (1996) Diffusion of albumins in rat cortical slices and relevance to volume transmission. Neuroscience 75:839-847.
Tate DF, Bigler ED (2000) Fornix and hippocampal atrophy in traumatic brain injury. Learn Mem 7:442-446.
Thakur R, Gupta RB (2006) Formation of phenytoin nanoparticles using rapid expansion of supercritical solution with solid cosolvent (RESS-SC) process. Int J Pharm 308:190-199.

147
Theodore WH, Fisher RS (2004) Brain stimulation for epilepsy. Lancet Neurol 3:111-118.
Thom M, Zhou J, Martinian L, Sisodiya S (2005) Quantitative post-mortem study of the hippocampus in chronic epilepsy: seizures do not inevitably cause neuronal loss. Brain 128:1344-1357.
Thomas LB, Steindler DA (1995) Glial boundaries and scars: programs for normal development and wound healing in the brain. Neuroscientist 1:142-154.
Thompson KW (2005) Genetically engineered cells with regulatable GABA production can affect afterdischarges and behavioral seizures after transplantation into the dentate gyrus. Neuroscience 133:1029-1037.
Thorne RG, Nicholson C (2006) In vivo diffusion analysis with quantum dots and dextrans predicts the width of brain extracellular space. Proc Natl Acad Sci U S A 103:5567-5572.
Trojnar MK, Wierzchowska-Cioch E, Krzyzanowski M, Jargiello M, Czuczwar SJ (2004) New generation of valproic acid. Pol J Pharmacol 56:283-288.
Tubbs RS, Louis RG, Jr., Wartmann CT, Loukas M, Shoja MM, Apaydin N, Oakes WJ (2008) The velum interpositum revisited and redefined. Surg Radiol Anat 30:131-135.
Van Harreveld A (1972) The extracellular space in the vertebrate central nervous system. In: The Structure and Function of Nervous Tissue (Bourne GH, ed), pp 447-511. New York: Academic Press.
Van Harreveld A, J C, SK M (1965) A study of extracellular space in central nervous tissue by freeze-substitution. J Cell Biol 25:117-137.
van Vliet EA, da Costa Araujo S, Redeker S, van Schaik R, Aronica E, Gorter JA (2007) Blood-brain barrier leakage may lead to progression of temporal lobe epilepsy. Brain 130:521-534.
Verney C, Baulac M, Berger B, Alvarez C, Vigny A, Helle KB (1985) Morphological evidence for a dopaminergic terminal field in the hippocampal formation of young and adult rat. Neuroscience 14:1039-1052.
Voges J, Reszka R, Gossmann A, Dittmar C, Richter R, Garlip G, Kracht L, Coenen HH, Sturm V, Wienhard K, Heiss WD, Jacobs AH (2003) Imaging-guided convection-enhanced delivery and gene therapy of glioblastoma. Ann Neurol 54:479-487.
Vonck K, Van Laere K, Dedeurwaerdere S, Caemaert J, De Reuck J, Boon P (2001) The mechanism of action of vagus nerve stimulation for refractory epilepsy: the current status. J Clin Neurophysiol 18:394-401.

148
Vorisek I, Sykova E (1997) Evolution of anisotropic diffusion in the developing rat corpus callosum. J Neurophysiol 78:912-919.
Vorisek I, Hajek M, Tintera J, Nicolay K, Sykova E (2002) Water ADC, extracellular space volume, and tortuosity in the rat cortex after traumatic injury. Magn Reson Med 48:994-1003.
Wall CJ, Kendall EJ, Obenaus A (2000) Rapid alterations in diffusion-weighted images with anatomic correlates in a rodent model of status epilepticus. AJNR Am J Neuroradiol 21:1841-1852.
White H, Johnson M, Wolf H, Kupferberg H (1995) The early identification of anticonvulsant activity: role of the maximal electroshock and subcutaneous pentylenetetrazol seizure models. The Italian Journal of Neurological Sciences 16:73-77.
Wiebe S, Blume WT, Girvin JP, Eliasziw M (2001) A randomized, controlled trial of surgery for temporal-lobe epilepsy. N Engl J Med 345:311-318.
Wieshmann UC, Clark CA, Symms MR, Barker GJ, Birnie KD, Shorvon SD (1999) Water diffusion in the human hippocampus in epilepsy. Magn Reson Imaging 17:29-36.
Willmore LJ (2005) Antiepileptic drugs and neuroprotection: current status and future roles. Epilepsy Behav 7 Suppl 3:S25-28.
Wu X, Li Y, Crise B, Burgess SM (2003) Transcription start regions in the human genome are favored targets for MLV integration. Science 300:1749-1751.
Wu Z, Asokan A, Samulski RJ (2006) Adeno-associated virus serotypes: vector toolkit for human gene therapy. Mol Ther 14:316-327.
Yamasaki TR, Blurton-Jones M, Morrissette DA, Kitazawa M, Oddo S, LaFerla FM (2007) Neural stem cells improve memory in an inducible mouse model of neuronal loss. J Neurosci 27:11925-11933.
Yasuhara T, Hara K, Maki M, Xu L, Yu G, Ali MM, Masuda T, Yu SJ, Bae EK, Hayashi T, Matsukawa N, Kaneko Y, Kuzmin-Nichols N, Ellovitch S, Cruz EL, Klasko SK, Sanberg CD, Sanberg PR, Borlongan CV (2010) Mannitol facilitates neurotrophic factor up-regulation and behavioural recovery in neonatal hypoxic-ischaemic rats with human umbilical cord blood grafts. J Cell Mol Med 14:914-921.
Yasukawa T, Ogura Y, Sakurai E, Tabata Y, Kimura H (2005) Intraocular sustained drug delivery using implantable polymeric devices. Adv Drug Deliv Rev 57:2033-2046.

149
Yushkevich PA, Piven J, Hazlett HC, Smith RG, Ho S, Gee JC, Gerig G (2006) User-guided 3D active contour segmentation of anatomical structures: significantly improved efficiency and reliability. Neuroimage 31:1116-1128.
Zafar R, King MA, Carney PR (2012) Adeno associated viral vector-mediated expression of somatostatin in rat hippocampus suppresses seizure development. Neurosci Lett 509:87-91.
Zaman V, Turner DA, Shetty AK (2000) Survival of grafted fetal neural cells in kainic acid lesioned CA3 region of adult hippocampus depends upon cell specificity. Exp Neurol 161:535-561.
Zhang Y, Pardridge WM (2005) Delivery of beta-galactosidase to mouse brain via the blood-brain barrier transferrin receptor. J Pharmacol Exp Ther 313:1075-1081.
Zheng T, Marshall GP, 2nd, Laywell ED, Steindler DA (2006) Neurogenic astrocytes transplanted into the adult mouse lateral ventricle contribute to olfactory neurogenesis, and reveal a novel intrinsic subependymal neuron. Neuroscience 142:175-185.
Zincarelli C, Soltys S, Rengo G, Rabinowitz JE (2008) Analysis of AAV serotypes 1-9 mediated gene expression and tropism in mice after systemic injection. Mol Ther 16:1073-1080.
150
BIOGRAPHICAL SKETCH
Svetlana Kantorovich was born in Vinnitsa, Ukraine where she lived with her
parents, twin sister, and older brother before moving to St. Louis, MO at the age of four.
After completing high school in St. Louis, she attended Washington University in St.
Louis to pursue her undergraduate degree. She graduated with honors in 2007 with a
Bachelor of Arts in Biology and a minor in psychology. In the fall of 2007, Svetlana
began graduate school in the Interdisciplinary Program in Biomedical Sciences (IDP) at
the University of Florida with a concentration in Neuroscience. She joined the laboratory
of Dr. Paul R. Carney in 2008 where she began characterizing the effect of normal and
pathological tissue structure on infusate distribution profiles following convection-
enhanced delivery for epilepsy. Her work culminated in a Ph.D. from the University of
Florida in the spring of 2012. Following graduation, Svetlana plans to widen her
knowledge and skill sets through the continuation of training in the field of biomedical
sciences.