influence of lean six sigma methodology on …
TRANSCRIPT
INFLUENCE OF LEAN SIX SIGMA METHODOLOGY ON
PERFORMANCE OF SERVICE ORGANIZATIONS IN KENYA: A
CASE OF THE KENYA INSTITUTE OF MANAGEMENT
BY
OGUDA SHIELA ORUAKO
A Research Project Report Submitted in Partial Fulfillment for the Requirements of
the Award of the Degree of Master of Arts in Project Planning and Management,
University of Nairobi.
2014
ii
DECLARATION
This research project report is my original work and has not been presented for any award
in any other university.
Signature………………… Date…………………………
Oguda Shiela Oruako
L50/61891/2013
This research project report has been submitted for examination with my approval as a
university supervisor
Signature………………………… Date…………………….
Dr. John Mbugua
School of Continuing and Distance Education
Department of Extra Mural Studies
University of Nairobi

iii
DEDICATION
This research project is dedicated to my mum Pamela Oguda and dad Mr. Henry Oguda,
my brothers Kevin, Allan and Felix and sister Shirleen. Thank you for your unconditional
love and support. Special thanks to one Andrew Esamai we brainstormed about this course
and look how far we have come. Thank you.
iv
ACKNOWLEDGEMENT
I am indebted to my supervisor Dr. John Mbugua who was diligent and persistent in ensuring
that my project was up to standard and was completed in good time. I sincerely appreciate his
effort, support, words of encouragement and understanding throughout.
I acknowledge the academic staff at the University of Nairobi, School of Continuing and
Distance Education, department of Extra Mural Studies who taught me and supported me
throughout the course work. I wish to thank my fellow students in the Masters class for
their continued cooperation and encouragement which in a great way has contributed
towards the attainment of my academic goal. They played such an important role along the
journey as we mutually engaged and tried to make sense of the various challenges we
faced.
Thank you to my family, friends and colleagues for their support and patience while I
pursued this program and understood when I had to miss deadlines or cancel appointments
in order to adhere to set deadlines.
In a very special way, I acknowledge Andrew Esamai who has been my sounding board
and champion during this journey. Lastly I would like to thank all the staff of Kenya
Institute of Management who participated in my research by taking time off their busy
schedules to provide me with all the information that I needed in the course of my research.
v
TABLE OF CONTENT
DECLARATION ............................................................................................................... ii
DEDICATION .................................................................................................................. iii
ACKNOWLEDGEMENT ............................................................................................... iv
LIST OF FIGURES........................................................................................................ viii
ABBREVIATIONS AND ACRONYMS ...................................................................... viii
ABSTRACT ...................................................................................................................... ix
CHAPTER ONE ................................................................................................................ 1
INTRODUCTION ............................................................................................................. 1
1.1 Background of the Study ............................................................................ 1
1.2 Statement of the Problem ........................................................................... 5
1.3 Purpose of the Study ................................................................................... 6
1.4 Objectives of the Study ............................................................................... 6
1.5 Research Questions ..................................................................................... 6
1.6 Significance of the Study ............................................................................ 7
1.7 Delimitation of the Study ............................................................................ 7
1.8 Limitations of the Study.............................................................................. 7
1.9 Assumptions of the Study ........................................................................... 8
1.10 Definitions of Significant Terms ................................................................ 8
1.11 Organization of the Study ........................................................................... 9
CHAPTER TWO:LITERATURE REVIEW ............................................................... 10
2.1 Introduction ............................................................................................... 10
2.2 Process Improvement Methodology in Service Sector Organizations ..... 10
2.3 The Concept of Lean Six Sigma Methodology ......................................... 12
2.4 Quality of Service and Performance of Organization ............................... 15
2.5 Cost and Performance of Organizations ................................................... 20
2.6 Lead Time and Organizational Performance ............................................ 23
2.7 Waste and Performance of an Organization ............................................. 25
2.8 Theoretical Framework ............................................................................. 27
2.9 A Conceptual Framework Analysis Model............................................... 30
2.10 Gaps in Literature Review ....................................................................... 32
2.11 Summary of Literature Review ................................................................ 32
CHAPTER THREE:RESEARCH METHODOLOGY ............................................... 34
3.1 Introduction .............................................................................................. 34
3.2 Research Design........................................................................................ 34
3.3 Target Population ...................................................................................... 34
3.4 Sample Size and Sampling Procedure ..................................................... 35
3.5 Data Collection Instruments ..................................................................... 36
3.6 Validity of Research Instruments.............................................................. 37
3.7 Reliability of Research Instruments ......................................................... 37
vi
3.8 Data Analysis Techniques ........................................................................ 38
3.9 Ethical Considerations ............................................................................. 38
3.10 Operational Definition of Variables .......................................................... 38
CHAPTER FOUR:DATA ANALYSIS, PRESENTATION, INTERPRETATION
AND DISCUSSION ......................................................................................................... 41
4.1 Introduction .............................................................................................. 41
4.2 Questionnaire Response Rate .................................................................. 41
4.3 Demographic Characteristics of Respondents ......................................... 41
4.3.1 Distribution of the Respondents by Gender .............................................. 41
4.3.2 Distribution of the Respondents by Level of Education .......................... 42
4.3.3 Trained Personnel in Lean Six Sigma ....................................................... 42
4.4 Influence of LSS Methodology on Organizational Performance ............. 43
4.4.1 Quality of Goods and Services and Performance of an Organization ...... 44
4.4.2 Cost of Doing Business and Performance of an Organization ................. 45
4.4.3 Lead Time and Performance of an Organization ...................................... 46
4.5 Correlation Analysis ................................................................................. 47
4.6 Discussion of Findings .............................................................................. 49
4.6.1 Quality of Service and Organization Performance ................................... 49
4.6.2 Cost of Doing Business and Organization Performance .......................... 51
4.6.3 Lead Time and Organization Performance ............................................... 51
4.6.4 Waste and Organization Performance ...................................................... 52
4.6.5 Organization Performance ........................................................................ 53
CHAPTER FIVE:SUMMARY OF FINDINGS, CONCLUSIONS AND
RECOMMENDATIONS ................................................................................................ 54
5.1 Introduction ............................................................................................... 54
5.2 Summary of Findings ................................................................................ 54
5.3 Conclusion of the Study ........................................................................... 55
5.4 Recommendations for Policy and Practice ............................................... 56
5.5 Suggested Areas for Further Research ...................................................... 57
REFERENCES ................................................................................................................ 58
APPENDICES ................................................................................................................. 66
APPENDIX I: Letter of Transmittal of Data Collection Instrument ............................... 66
APPENDIX II: Questionnaire ......................................................................................... 67
APPENDIX III: Excerpts from the Annual Report and Consolidated Financial Statement
Of KIM, 2012 And 2013 ................................................................................................... 71
vii
LIST OF TABLES
Table 2.1: Review of LSS in the Service Industry................................................ 12
Table 2.2: Sigma Level and the Cost of Quality ................................................... 20
Table 3.1: Target population ................................................................................ 37
Table 3.2 Reliability Test ...................................................................................... 37
Table 3.3: Operational Definition of Variables ................................................... 39
Table 4.1: Distribution of Respondents by Gender .............................................. 42
Table 4.2: Distribution of Respondents Highest Level of Education ................... 42
Table 4.3: Trained Lean Six Sigma Personnel ...................................................... 43
Table 4.4: Influence of LSS Methodology on Organizational Performance ........ 43
Table 4.5: Quality Determinants ........................................................................... 44
Table 4.6: Recommendation of Organization to Others ...................................... 45
Table 4.7: Components of Cost of Doing Business .............................................. 46
Table 4.8: Components of Lead Time .................................................................. 46
Table 4.9: Facets of Wastes .................................................................................. 47
Table 4.10: Correlation Analysis .......................................................................... 48
viii
LIST OF FIGURES
Figure 1 Traditional Management View vs. Six Sigma Philosophy ..................... 20
Figure 2 Conceptual Framework .......................................................................... 33
ABBREVIATIONS AND ACRONYMS
BPR Business Process Reengineering
ix
CFS Critical Success Factors
DMAIC Define, Measure, Analyze, Improve, Control
DMADV Define, Measure, Analyze, Design, Verify
KIM Kenya Institute of Management
LSS Lean Six Sigma
SS Six Sigma
TOC Theory of Constraints
TQM Total Quality Management
ABSTRACT
Lean Six Sigma is one of the many process improvement methodologies. It is a set of
powerful tools and techniques employed by an organization to help it improve its
efficiency, effectiveness and productivity. Although they originated from the
manufacturing environment their principles can be applied to businesses operating in any
x
sector. The study aimed to assess the influence of lean six sigma methodology on
performance of organizations, a case of the Kenya institute of Management. More
specifically, it aimed at examining how quality, cost, lead time and waste influence
performance of the Kenya Institute of Management. The study adopted a descriptive survey
design. The target population of the study was 145 employees based at the head office of
the Kenya Institute of Management. Using Cochran’s 1977 formula the desired sample size
of 106 respondents and stratified random sampling method were used to achieve the
desired representation from the various sub groups. Pilot testing of the data collection
instrument was performed by administering the questionnaires to 10% of the sample size.
To establish the validity of the research instrument content validity was used; to check
reliability of the instrument, Cronbach’s alpha methodology based on internal consistency
of the research instruments was used. An alpha value of 0.8 was obtained, thus the research
instrument used was reliable.Primary data was collected using self-designed questionnaires
and secondary data from e-journals, books and publications by the Kenya Institute of
Management. After data collection, the questionnaires were cleaned, coded organized and
analysed. Descriptive statistics and Correlation (using Karl Pearson’s product moment
coefficient of correlation) were used to analyse the data and establish the relationship
between the dependent variables and the set of independent variables using SPSS software.
The study established that cost had the strongest influence on performance of an
organization with a correlation coefficient of (- 0.743). Lead time and Wastes also had
significant influence on performance of an organization with correlation coefficients of (-
0.628) and (- 0.318) respectively lastly was quality of services which had a minimal
influence on performance of an organization with a correlation coefficient of (0.23). This
means that the three variables of cost, lead time and waste had significant negative
relationships with the dependent variable, performance of organization while the variable
quality had a positive relationship with the independent variable performance of an
organization. It was therefore concluded that the Lean Six Sigma methodology positively
influences the performance of an organization. This however is only possible if an
organization is willing to invest adequate resources, make goals very clear and actively
monitor these goals. Equally there should be management commitment and support,
internal process ownership, metrics, staff involvement staff training to make them
experienced staff, providing enhanced understanding and tailoring improvement training.
Future studies could evaluate the influence of Lean Six Sigma in other service sector
organizations like banks, hospitals etc. and equally its impact on organization culture.
.
1
CHAPTER ONE
INTRODUCTION
1.1 Background of the Study
The demand for process excellence professionals is increasing globally in all industrial sectors
irrespective of the size and their nature. Process excellence is achieved when all activities are in
total alignment with the vision, mission, strategy, values and objectives of an organization. An
organization that has a high level of process excellence is cost efficient, effective at serving its
customers, higher productivity, superior cycle times, higher process capability and process
throughput. One of the most successful process excellence models is Six Sigma. Since its
development by Motorola in the late 1980s six sigma has gained considerable attention,
especially since its adoption by high profile companies such as General Electric (GE) in the mid-
1990s, six sigma has spread like “wildfire” (Caulcutt, 2001; Goh, 2002; Chakrabarty and Tan,
2007). Many organizations in manufacturing and services, public and private, large and small
have joined the six sigma band wagon. In addition to Motorola and GE, many other Fortune 500
companies such as American Express, Boeing, Caterpillar, Fidelity Investments, Honeywell
International, J.P. Morgan Chase, Johnson and Johnson, Kodak, Lockheed Martin, Maytag,
Northrop Grumman, Sony, and Texas Instruments have applied six sigma to a myriad of
projects.
In East Africa for example a key segment of World Vision staff has caught the vision of process
excellence, understood and applied TQM concepts and tools, and significantly improved key
processes, for example, reduced by 40-80% the average time to procure items and recruit new
staff. We have reduced annual expenses by nearly $1,000,000. Such improvements help World
Vision to achieve better outcomes with existing funding, people, and other resources (Andrew,
2013). Academicians agree that Six Sigma is a distinct management methodology and it holds an
important role in management theory as the practices of Six Sigma complement traditional
quality management to enhance business performance. Lean is a very successful system focused
on problem solving, waste elimination, efficiency, and making changes (Schroeder et al. 2008).
Heuvel et al (2011) postulates that competition has become more and more fierce, customers are
demanding higher quality at lower prices and profit margins seem to be falling especially in
times of crisis. An efficient and effective strategy to become more competitive is to adopt Lean
2
Six Sigma. Quality is more than making things without errors. It is about making a product or
service meet the individual perception of a customer about the quality or value. Therefore, in
what regards Lean Six Sigma, the concern is not only to "do the things right" but also to "do the
right things right"(Antony, 2010). The study’s focus is on the key elements of Lean Six Sigma,
highlighting the effect of implementing Lean Six Sigma on companies, seeking to indicate the
requirements of a company for its implementation and investigate the strategy to obtain the
maximum practical outcome. Lean thinking is about efficiency. It is about removing variation
between the steps. It is the passionate belief that there is always a better way of doing something.
It is a methodology of eliminating wastes and smoothing the process flow. Emphasis is on
empowering employees to drive improvement, speed up things and thus reduce lead time. It is
the endless transformation of waste into value from the customer’s perspective.
The Kenya Institute of Management (KIM) is a membership based non-profit making
professional management development organization committed to the promotion of excellence
and integrity in the practice of management. The institute was established in 1954 as a premier
institute that provides management consultancy and capacity building services to corporate
organizations and other institutions. The mission of Kenya Institute of Management is to steer
and champion excellence, integrity and competitiveness in individuals and organizations
throughout Africa and beyond. KIM which has been in operation for nearly six decades has
undergone major transformation in the recent past. The Institution was initially a membership
based organization whose focus was to build capacity among the present and future leaders of
Kenya. Currently, KIM boasts of a portfolio of business units that include; an SME Solution
Centre, the “Management Magazine’ a publication that targets upper and middle level decision
makers within the organization, the KIM school of Management that offers Diploma and
certification courses for upcoming and established professionals and has sponsored a university –
The Management University of Africa (MUA) – whose main focus is to offer degree, master and
doctorate degrees in leadership and management (KIM, 2010).
From the above portfolio it is evident that the organization is in the service industry. It only
produces one product for its customers the Management magazine. To be able to deliver with
such a wide portfolio, various units/departments each carrying out different processes has to
work in sync to ensure the single client being targeted is satisfied. Over time this wide spread
3
portfolio has created room for duplication of roles among the various units/departments thus
leading to wastes and increased operational costs. With various colleges and universities offering
the same courses springing up in every corner of the country, there has been increased
competition with students opting for colleges offering the courses at the same cost, at a cheaper
cost or even more expensive fee depending on their preferences and what they perceive as value.
For the organization to maintain a competitive edge, it has to be flexible to adapt to market
conditions; reduce costs while increasing productivity. The question was what is value to our
customers and how fast can we as an organization provide this value to the customers to enable
them perceive us as their service provider of choice. Change was thus inevitable. It is against this
backdrop of duplication of roles among departments and units, increased operational costs and
cut throat competition within the industry that the organization had to relook how it does its
business. Given that the organization had tried other business process improvement tools like the
Organizational Performance Index (OPI) weighing its pros and cons and evaluating the gaps it
had not addressed, Lean Six Sigma was the methodology to address the gap. (KIM, 2012)
The focus of Lean Six Sigma is not on counting the defects in processes, but the number of
opportunities within a process that could result in defects so that causes of quality problems can
be eliminated before they are transformed into defects (Antony, 2010). From a business
perspective, Six Sigma could be described as a process that allows companies to drastically focus
on continuous and breakthrough improvements in everyday business activities to increase
customer satisfaction. Quality management has long been established as an important strategy
for achieving competitive advantage (Chua, 2011). Traditional quality initiatives such as
statistical quality control, zero defects, and total quality management have been key initiatives
for many years. Six sigma can be considered as a recent quality improvement initiative that has
gained popularity and acceptance in many industries across the globe (Gupta, 2010). With high
profile adoptions by companies such as General Electric (GE) in the mid-1990s, six sigma spread
like wildfire towards the end of the twentieth century (Basu, 2008).
A widely accepted definition of lean manufacturing is the “systematic approach to identify and
eliminate waste (non -value-adding activities) through continuous improvement by running the
product at the pull of the customer in the pursuit of perfection. It focuses on reducing the
business cycle time so as to become more responsive to customer demand, while using less
4
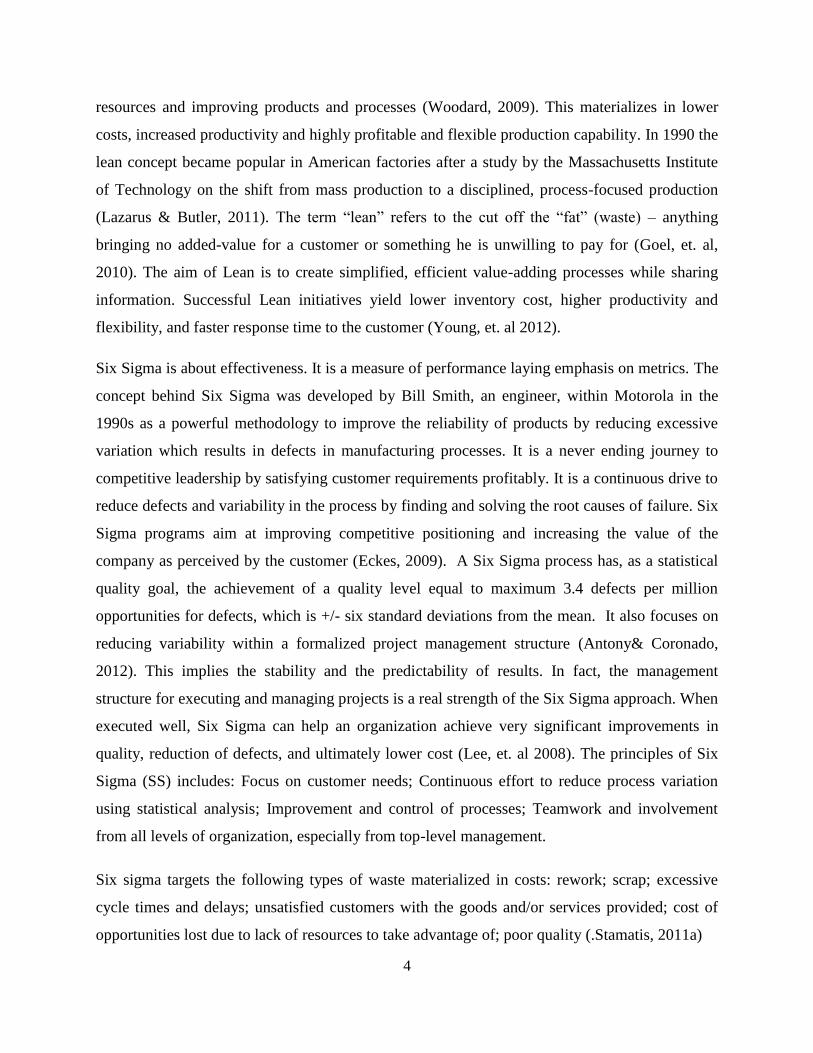
resources and improving products and processes (Woodard, 2009). This materializes in lower
costs, increased productivity and highly profitable and flexible production capability. In 1990 the
lean concept became popular in American factories after a study by the Massachusetts Institute
of Technology on the shift from mass production to a disciplined, process-focused production
(Lazarus & Butler, 2011). The term “lean” refers to the cut off the “fat” (waste) – anything
bringing no added-value for a customer or something he is unwilling to pay for (Goel, et. al,
2010). The aim of Lean is to create simplified, efficient value-adding processes while sharing
information. Successful Lean initiatives yield lower inventory cost, higher productivity and
flexibility, and faster response time to the customer (Young, et. al 2012).
Six Sigma is about effectiveness. It is a measure of performance laying emphasis on metrics. The
concept behind Six Sigma was developed by Bill Smith, an engineer, within Motorola in the
1990s as a powerful methodology to improve the reliability of products by reducing excessive
variation which results in defects in manufacturing processes. It is a never ending journey to
competitive leadership by satisfying customer requirements profitably. It is a continuous drive to
reduce defects and variability in the process by finding and solving the root causes of failure. Six
Sigma programs aim at improving competitive positioning and increasing the value of the
company as perceived by the customer (Eckes, 2009). A Six Sigma process has, as a statistical
quality goal, the achievement of a quality level equal to maximum 3.4 defects per million
opportunities for defects, which is +/- six standard deviations from the mean. It also focuses on
reducing variability within a formalized project management structure (Antony& Coronado,
2012). This implies the stability and the predictability of results. In fact, the management
structure for executing and managing projects is a real strength of the Six Sigma approach. When
executed well, Six Sigma can help an organization achieve very significant improvements in
quality, reduction of defects, and ultimately lower cost (Lee, et. al 2008). The principles of Six
Sigma (SS) includes: Focus on customer needs; Continuous effort to reduce process variation
using statistical analysis; Improvement and control of processes; Teamwork and involvement
from all levels of organization, especially from top-level management.
Six sigma targets the following types of waste materialized in costs: rework; scrap; excessive
cycle times and delays; unsatisfied customers with the goods and/or services provided; cost of
opportunities lost due to lack of resources to take advantage of; poor quality (.Stamatis, 2011a)
5
The integration of the Lean Principles into Six Sigma (or reversely) makes it possible to achieve
effective improvements (Wyper & Harrison 2008). This methodology was named Lean Six
Sigma. LSS uses the methodology of DMAIC (Do, Measure, Analyze, Improve and Control) and
DMADV (Define, Measure, Analyze, Design and Verify) which bring out measurable and
repeatable results. Lean uses "Kaizen events" - intensive, typically week-long improvement
sessions - to quickly identify improvement opportunities. The most common indices used to
measure process capability are: Cp (process capability) and Cpk (process performance). Cp is a
measure of the width of a distribution of outputs of the process and Cpk also indicates how close
the average value to the target value is (Rucker, 2010).
According to Nonthaleerak and Hendry (2008), rolled throughput yield is a better metric. It is the
probability that a single unit can pass through all the steps in a process free of defects. The cost
of poor quality, another metric for SS, is the cost of doing things wrong, the total of all the costs
of all defects in the processes (Schmidt & Aschkenase, 2008). Both Lean and Six Sigma are built
around the view that businesses are composed of processes that start with customer needs and
should end with satisfied customers currently or after using the product or service (Nonthaleerak
& Hendry, 2008). However, the goal of Lean Six Sigma is growth, not just cost-cutting. It aims
at both effectiveness and efficiency. This way, a Lean Six Sigma approach drives organizations
not just to do things better, but to do better things (Kwak, &Anbari, 2010).
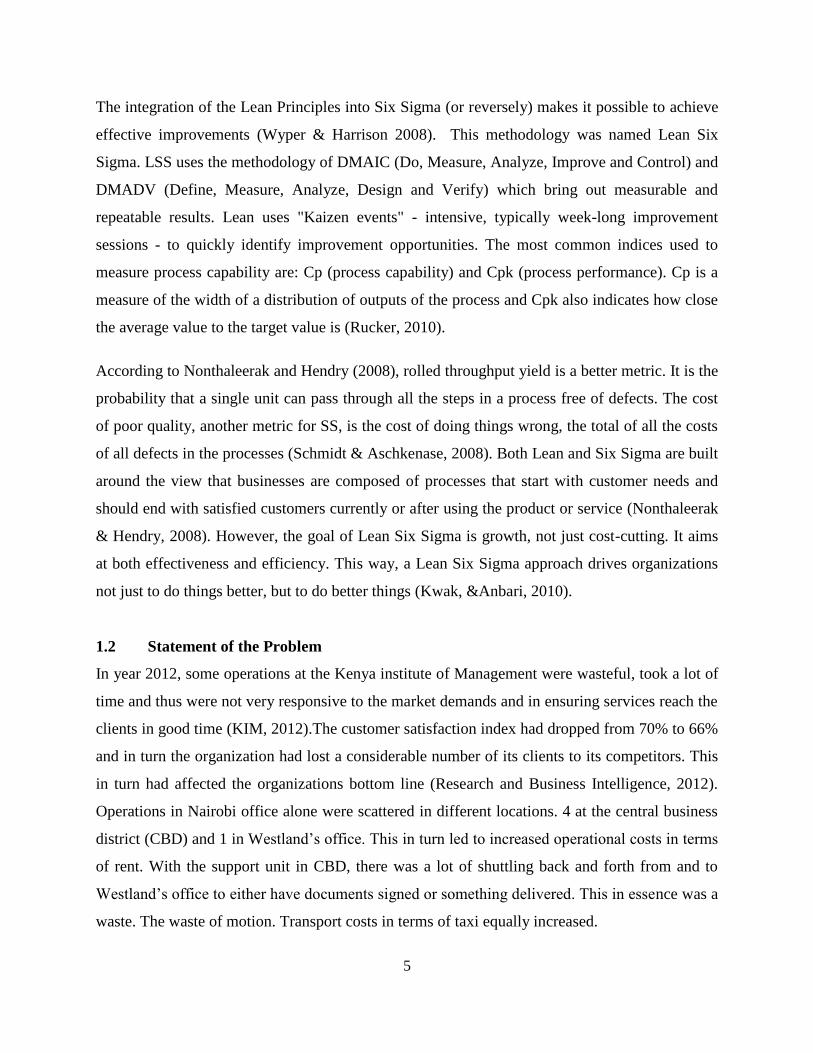
1.2 Statement of the Problem
In year 2012, some operations at the Kenya institute of Management were wasteful, took a lot of
time and thus were not very responsive to the market demands and in ensuring services reach the
clients in good time (KIM, 2012).The customer satisfaction index had dropped from 70% to 66%
and in turn the organization had lost a considerable number of its clients to its competitors. This
in turn had affected the organizations bottom line (Research and Business Intelligence, 2012).
Operations in Nairobi office alone were scattered in different locations. 4 at the central business
district (CBD) and 1 in Westland’s office. This in turn led to increased operational costs in terms
of rent. With the support unit in CBD, there was a lot of shuttling back and forth from and to
Westland’s office to either have documents signed or something delivered. This in essence was a
waste. The waste of motion. Transport costs in terms of taxi equally increased.
6
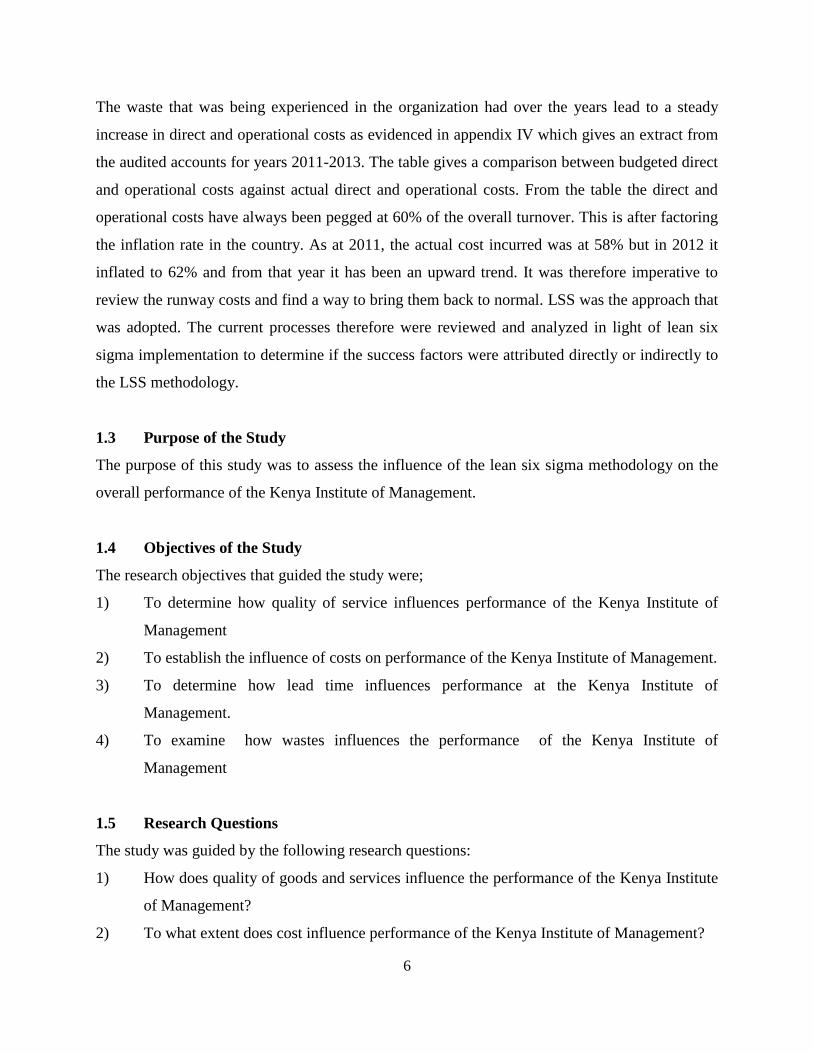
The waste that was being experienced in the organization had over the years lead to a steady
increase in direct and operational costs as evidenced in appendix IV which gives an extract from
the audited accounts for years 2011-2013. The table gives a comparison between budgeted direct
and operational costs against actual direct and operational costs. From the table the direct and
operational costs have always been pegged at 60% of the overall turnover. This is after factoring
the inflation rate in the country. As at 2011, the actual cost incurred was at 58% but in 2012 it
inflated to 62% and from that year it has been an upward trend. It was therefore imperative to
review the runway costs and find a way to bring them back to normal. LSS was the approach that
was adopted. The current processes therefore were reviewed and analyzed in light of lean six
sigma implementation to determine if the success factors were attributed directly or indirectly to
the LSS methodology.
1.3 Purpose of the Study
The purpose of this study was to assess the influence of the lean six sigma methodology on the
overall performance of the Kenya Institute of Management.
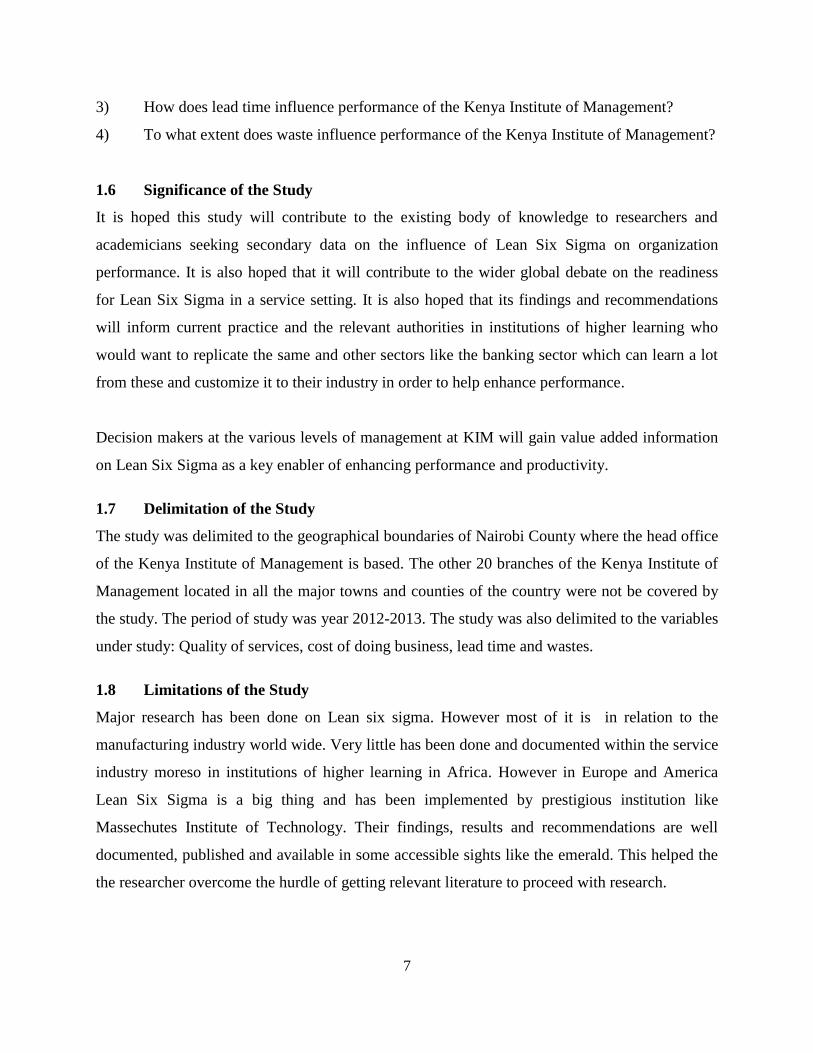
1.4 Objectives of the Study
The research objectives that guided the study were;
1) To determine how quality of service influences performance of the Kenya Institute of
Management
2) To establish the influence of costs on performance of the Kenya Institute of Management.
3) To determine how lead time influences performance at the Kenya Institute of
Management.
4) To examine how wastes influences the performance of the Kenya Institute of
Management
1.5 Research Questions
The study was guided by the following research questions:
1) How does quality of goods and services influence the performance of the Kenya Institute
of Management?
2) To what extent does cost influence performance of the Kenya Institute of Management?
7
3) How does lead time influence performance of the Kenya Institute of Management?
4) To what extent does waste influence performance of the Kenya Institute of Management?
1.6 Significance of the Study
It is hoped this study will contribute to the existing body of knowledge to researchers and
academicians seeking secondary data on the influence of Lean Six Sigma on organization
performance. It is also hoped that it will contribute to the wider global debate on the readiness
for Lean Six Sigma in a service setting. It is also hoped that its findings and recommendations
will inform current practice and the relevant authorities in institutions of higher learning who
would want to replicate the same and other sectors like the banking sector which can learn a lot
from these and customize it to their industry in order to help enhance performance.
Decision makers at the various levels of management at KIM will gain value added information
on Lean Six Sigma as a key enabler of enhancing performance and productivity.
1.7 Delimitation of the Study
The study was delimited to the geographical boundaries of Nairobi County where the head office
of the Kenya Institute of Management is based. The other 20 branches of the Kenya Institute of
Management located in all the major towns and counties of the country were not be covered by
the study. The period of study was year 2012-2013. The study was also delimited to the variables
under study: Quality of services, cost of doing business, lead time and wastes.
1.8 Limitations of the Study
Major research has been done on Lean six sigma. However most of it is in relation to the
manufacturing industry world wide. Very little has been done and documented within the service
industry moreso in institutions of higher learning in Africa. However in Europe and America
Lean Six Sigma is a big thing and has been implemented by prestigious institution like
Massechutes Institute of Technology. Their findings, results and recommendations are well
documented, published and available in some accessible sights like the emerald. This helped the
the researcher overcome the hurdle of getting relevant literature to proceed with research.
8
Secondly, being a relatively new concept which deals with each an every aspect of the
organization including its financials, it was projected that respondents would be concerned with
the extent to which the management might want them to volunteer information and relevant
documentation without any repercussions or fear of victimization. This was curtailed by
providing a letter of introduction from the National Council of Science and Technology and
providing the necessary assurances to the key respondents.
The third limitation was in regards to the fact that this was additional responsibility to the
respondents who already had their overwhelming day to day duties. Ample time was given to the
respondents with polite reminder once in a while to ensure a good return rate of the
questionnaires.
1.9 Assumptions of the Study
The researcher assumed that the respondents were available and willing to fill in the
questionnaires. The researcher also assumed that the questionnaires would be filled truthfully
and returned on time. The researcher had also assumed that funds required for the research would
be available on time. The researcher further assumed that access to relevant research data
throughout the study would be granted on time.
1.10 Definitions of Significant Terms
Service Sector
Organization
This term has been used in this research to mean portion of the economy
that earns its revenue through providing intangible services.
Lean Six Sigma
Methodology
LSS represents a management approach with emphasis on customer
satisfaction, a culture of continuous improvement, the search for root
causes, and comprehensive employee involvement.
Lead Time This is the amount of time between initiation and completion of a process
in this case from when the customer seeks to be served to when the
customer walks away either satisfied or dissatisfied.
9
Performance Standards of accuracy and completeness. In the study, performance is
deemed to be the fulfillment of an obligation in a manner that Kenya
institute Offers optimum services like quality education and prompt
services.
Quality of Services A measure of how the services offered meet the customer expectations
based on specific determinants: Reliability, Responsiveness, Believability
and Accessibility
Waste This is anything that does not add value to the customer. In this context the
waste of transportation is moving from office to office to have a document
signed and the waste of inventory is having stores to hold up stationery and
or material, purchasing excess promotional material.
1.11 Organization of the Study
The research project is organized into five chapters: Chapter one which is the introduction
includes the background of the study, statement of the problem, purpose of the study, objectives
of the study, research questions, significance of the study, basic assumptions of the study,
limitations of the study, delimitations of the study and definitions of significant terms. Chapter
two contains the literature review and focuses on the four key areas as described in the objectives
of the study. Chapter three presents the research methodology that was used in conducting the
study. Chapter four consists of data analysis, presentation interpretation and discussion of
findings. Chapter five presents a summary of findings, conclusions and recommendation made
there-to.
10
CHAPTER TWO
LITERATURE REVIEW
2.1 Introduction
This section extensively reviews literature on the previous related studies relevant to the study
topic. It is organized into the following sections: the concept of Lean Six Sigma methodology,
how quality of services influences the performance of an organization, the influence of costs on
performance and effects of lead time and waste on the overall performance of an organization. It
will also include the conceptual framework and the theoretical framework of the study.
2.2 Process Improvement Methodology in Service Sector Organizations
Continuous Improvement is something of an umbrella term and may encompass a variety of
disciplines and methodologies including Business Process Management, Performance
Management, Quality Management, Compliance, Lean, Six Sigma and more. Despite all the
different terms, techniques and methods available, there are commonalities between these
different approaches - they all seek to continuously improve business processes in order to
enhance business results. Increasingly, continuous process improvement is being touted as a
competitive differentiator.
According to Bowen and Youngdahl (1998) , Lean in service sector started gaining momentum
in the late 80s as a result of McDonald’s utilization of the Lean production flow concept in order
to meet their customer’s expectations and Taco Bell’s being recommended as an example of a
Lean production line in the service industry (Psychogios et al. 2012). Piercy and Rich (2009)
outlined Lean as a concept comprising a set of principles, practices, tools and techniques which,
when implemented by following a systematic approach, would improve resource utilization,
quality and delivery with respect to products and services. In the early 1990s, Lean was
successfully implemented in service industries such as banking sectors and public sectors, and
even hospitals and airlines were adopting this methodology to improve efficiency within their
organizations (George 2003).
11
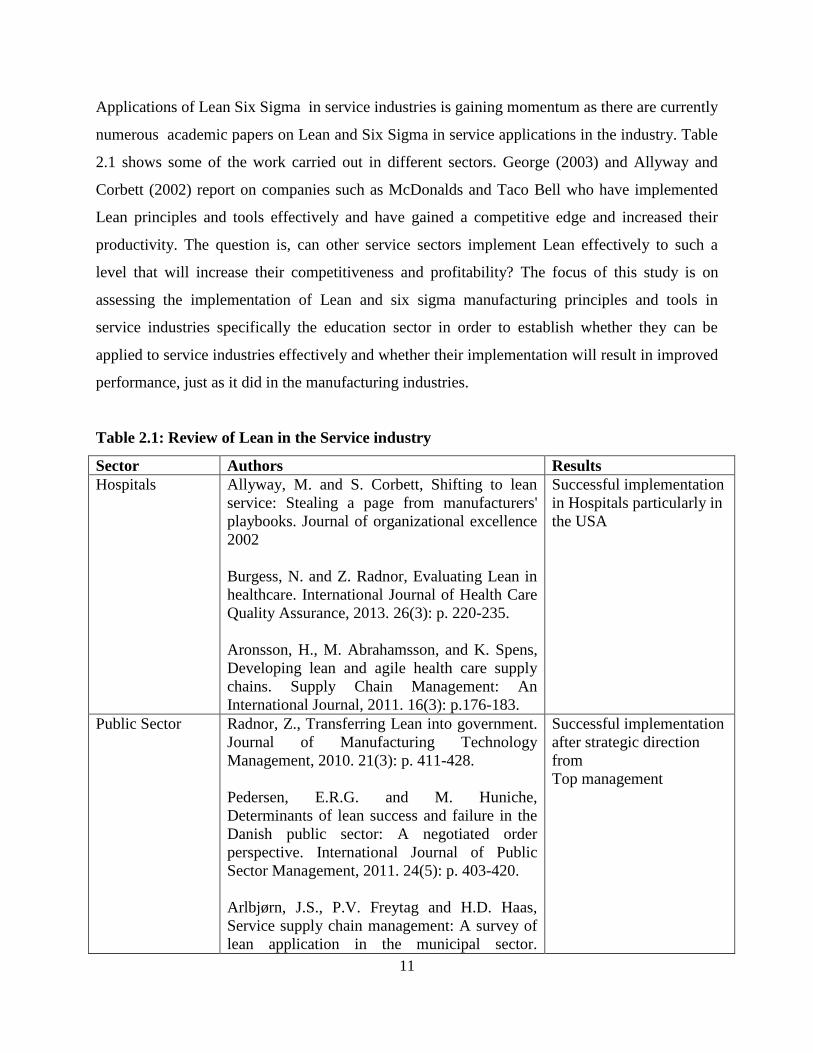
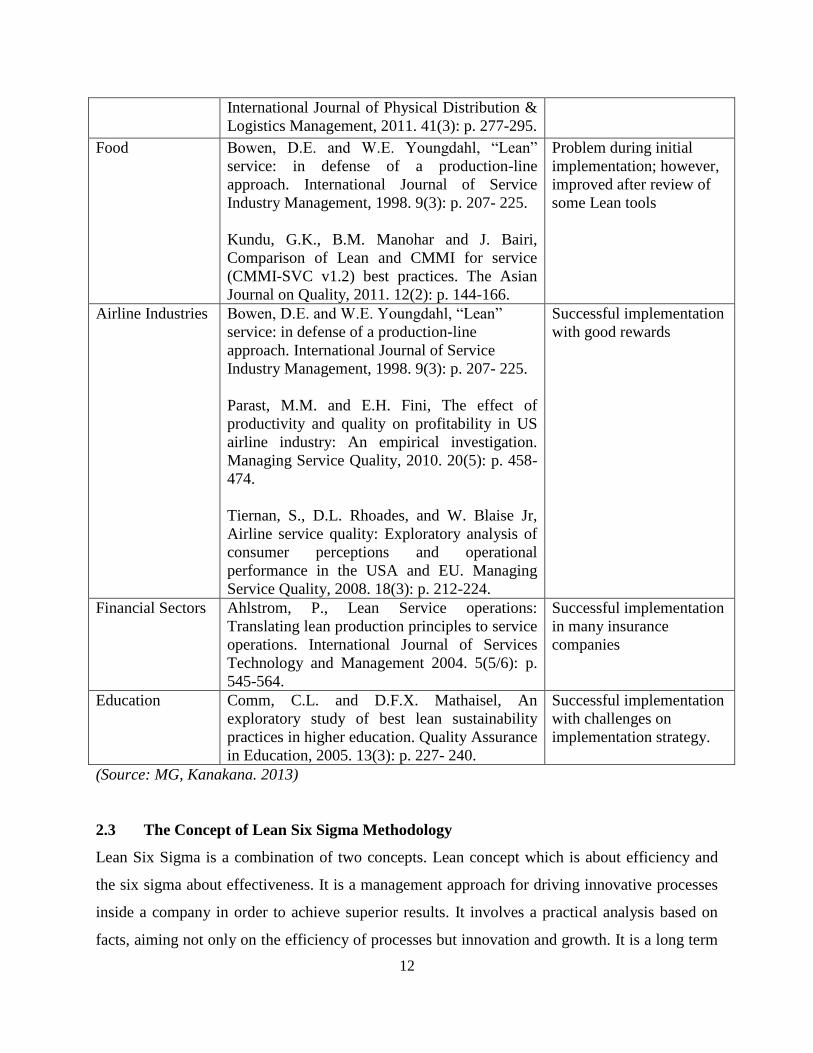
Applications of Lean Six Sigma in service industries is gaining momentum as there are currently
numerous academic papers on Lean and Six Sigma in service applications in the industry. Table
2.1 shows some of the work carried out in different sectors. George (2003) and Allyway and
Corbett (2002) report on companies such as McDonalds and Taco Bell who have implemented
Lean principles and tools effectively and have gained a competitive edge and increased their
productivity. The question is, can other service sectors implement Lean effectively to such a
level that will increase their competitiveness and profitability? The focus of this study is on
assessing the implementation of Lean and six sigma manufacturing principles and tools in
service industries specifically the education sector in order to establish whether they can be
applied to service industries effectively and whether their implementation will result in improved
performance, just as it did in the manufacturing industries.
Table 2.1: Review of Lean in the Service industry
Sector Authors Results
Hospitals Allyway, M. and S. Corbett, Shifting to lean
service: Stealing a page from manufacturers'
playbooks. Journal of organizational excellence
2002
Burgess, N. and Z. Radnor, Evaluating Lean in
healthcare. International Journal of Health Care
Quality Assurance, 2013. 26(3): p. 220-235.
Aronsson, H., M. Abrahamsson, and K. Spens,
Developing lean and agile health care supply
chains. Supply Chain Management: An
International Journal, 2011. 16(3): p.176-183.
Successful implementation
in Hospitals particularly in
the USA
Public Sector Radnor, Z., Transferring Lean into government.
Journal of Manufacturing Technology
Management, 2010. 21(3): p. 411-428.
Pedersen, E.R.G. and M. Huniche,
Determinants of lean success and failure in the
Danish public sector: A negotiated order
perspective. International Journal of Public
Sector Management, 2011. 24(5): p. 403-420.
Arlbjørn, J.S., P.V. Freytag and H.D. Haas,
Service supply chain management: A survey of
lean application in the municipal sector.
Successful implementation
after strategic direction
from
Top management
12
International Journal of Physical Distribution &
Logistics Management, 2011. 41(3): p. 277-295.
Food Bowen, D.E. and W.E. Youngdahl, “Lean”
service: in defense of a production-line
approach. International Journal of Service
Industry Management, 1998. 9(3): p. 207- 225.
Kundu, G.K., B.M. Manohar and J. Bairi,
Comparison of Lean and CMMI for service
(CMMI-SVC v1.2) best practices. The Asian
Journal on Quality, 2011. 12(2): p. 144-166.
Problem during initial
implementation; however,
improved after review of
some Lean tools
Airline Industries Bowen, D.E. and W.E. Youngdahl, “Lean”
service: in defense of a production-line
approach. International Journal of Service
Industry Management, 1998. 9(3): p. 207- 225.
Parast, M.M. and E.H. Fini, The effect of
productivity and quality on profitability in US
airline industry: An empirical investigation.
Managing Service Quality, 2010. 20(5): p. 458-
474.
Tiernan, S., D.L. Rhoades, and W. Blaise Jr,
Airline service quality: Exploratory analysis of
consumer perceptions and operational
performance in the USA and EU. Managing
Service Quality, 2008. 18(3): p. 212-224.
Successful implementation
with good rewards
Financial Sectors Ahlstrom, P., Lean Service operations:
Translating lean production principles to service
operations. International Journal of Services
Technology and Management 2004. 5(5/6): p.
545-564.
Successful implementation
in many insurance
companies
Education Comm, C.L. and D.F.X. Mathaisel, An
exploratory study of best lean sustainability
practices in higher education. Quality Assurance
in Education, 2005. 13(3): p. 227- 240.
Successful implementation
with challenges on
implementation strategy.
(Source: MG, Kanakana. 2013)
2.3 The Concept of Lean Six Sigma Methodology
Lean Six Sigma is a combination of two concepts. Lean concept which is about efficiency and
the six sigma about effectiveness. It is a management approach for driving innovative processes
inside a company in order to achieve superior results. It involves a practical analysis based on
facts, aiming not only on the efficiency of processes but innovation and growth. It is a long term
13
process of gradual and continuous improvement (Catherwood, 2012). It provides specific
methods to re-create the process so that defects and errors never arise in the first place (Harry
and Schroeder, 2009). The application of Lean Six Sigma in companies led to attaining superior
financial performance by addressing new needs, by differentiating the products and services or
by adjusting the business lines to new processes. (Does et. al, 2013). Quality is more than
making things without errors. It is about making a product or service meet the individual
perception of a customer about the quality or value (Tague, 2011). Therefore, regarding Lean
Six Sigma, the concern is not only to "do the things right” but also to "do the right things right".
Focus will be on the influence of implementing Lean Six Sigma approach on institution
performance, seeking what changes and benefits it brings. The key elements it aims at are
achieving the best quality, the lowest cost, getting the shortest lead-time, stressing on waste
elimination. The requirements of a company for its implementation and the strategy to obtain the
maximum practical outcome are investigated.
Most Lean experts agree that companies cannot become lean by applying Lean tools (such as
Kanban and Poka Yoke) alone. They must apply Lean thinking and principles. Spear & Bowen
(1999) identified four basic rules of how work in Toyota is specified, connected, flowed, and
improved. Spear (2004) identified the following four fundamental principles underlying the Lean
system: One must observe the actual work being done; Experiment (test) proposed changes;
Experiment as frequently as possible and managers should coach, not fix market share.
The integration of Lean and Six Sigma methodologies provides organizations with the methods,
tools and techniques for superior improvements (Snee, 2010). Lean Six Sigma (LSS) is a
powerful methodology for achieving process efficiency and effectiveness resulting in enhanced
customer satisfaction and improved bottom line results. Lean is a powerful business process
improvement methodology to minimize or even eliminate different forms of waste or non-value
added activities or steps whereas Six Sigma has proved to be an effective methodology to reduce
variation within a business process and thereby achieve process robustness. Six Sigma is an
approach to process improvement and organizational excellence focused on eliminating variation
and making data-driven decisions. Motorola started Six Sigma as they realized the need to
significantly reduce variation in order to compete successfully. General Electric, under the
leadership of Jack Welch, made Six Sigma a cornerstone of its corporate culture and used it to
14
generate billions of dollars of savings annually (Pande, et al., 2000). The key elements of Six
Sigma are: Gather and analyze data to make informed decisions; eliminate the variation that
drives waste; solve the root causes of problems, rather than fixing recurring mistakes and defects.
Lean and Six Sigma overlap in many of their concepts and tools. For example, both standardize
and measure processes, and both insist on continuous improvement. Both Lean and Six Sigma
also require a fundamental paradigm change from accepting problems and poor performance to
revealing and solving problems, and making improvements in pursuit of excellence. And both
rely on an equipped and empowered workforce to make improvements (Harbert, 2006).
We have witnessed a number of service organizations in Kenya embarked initially on Lean
management practices to tackle the so-called “low-hanging” fruits and then move on to more
complex problems using the principles of Six Sigma, especially when variation has been an issue
in their business processes. On the other hand, we have seen a number of product making
organizations like Unilever embarking initially on Six Sigma and then realized at a later stage
that they need to set up standard operating procedures at the workplace and reduce total lead-
times of their end-to-end business processes using the principles of Lean thinking. Since the
success or failure of quality management initiatives is associated more with their implementation
process than their content (Moosa and Sajid, 2010), the same issue arises regarding Lean six
sigma and its implementation in different organizations and industries.
Performance management systems allow an organization to align its business activities to its
strategy and to monitor performance toward achieving strategic goals over time. Organizational
performance is one of the key ingredients in determining the success or failure of the
organization. Measuring performance is not an easy fete to achieve, especially when that which
is to be measured keeps changing (Manz, 2011). Having the appropriate tools to identify
performance strengths and gaps gives an organization and its workforce clarity and allows for
there to be a platform for addressing performance issues in a structured manner. There are
different ways through which organizations can measure performance. Management by
objectives – high performing organizations actively identifies “key performance indicators,” and
measures their progress against established target values for those indicators, as a way of
measuring individual and organizational effectiveness (Drucker, 1954).
15
Use of the balanced score card – It integrates four sets of measurements (financial, internal
business processes, learning and development and the customer) complementing traditional
financial measures with those driving future performance. TQM firms focus on serving the
external customers. They first should know the customers’ expectations and requirements and
then should offer the products/services, accordingly. By the aid of successful customer focus
efforts, production can be arranged with respect to the customers’ needs, expectations, and
complaints. This encourages firms to produce high quality and reliable products/services on time
with increased efficiency and productivity. When customer expectations are met, their
satisfaction will be increased, and the firm’s sales and the market share will increase. (Harbert,
2006)
Use of Six Sigma- A measure of performance whose one vital benefit is its emphasis on metrics.
Developed and popularized by Motorola in the 1980s it refers to the statistical level of variation
where difficulties impacting customers are very rare signifying almost perfect quality.
2.4 Quality of Service and Performance of Organization
For a long time, academic institutions have preferred to focus on their internal academic needs
rather than viewing students as their main customers. This attitude has served them well as long
as the demand was greater than the supply. In the last two decades, more and more universities
and academic colleges (virtual and real) have been established to answer the demand for higher
education (HE) and many customers are willing to study out of their countries. The shift in the
HE market from a suppliers’ market (where there is less supply than demand and the suppliers
dictate quality) to a customers’ market (where there is higher supply than demand and the
customers dictate quality) has intensified the competition between academic institutions. The
competition for potential students has become more and more challenging. In light of the varied
alternatives, the students are becoming more and more assertive and critical and consequently the
HE institutions have to address the increasing dissatisfaction with the performance of HE
systems by improving them (Mizikaci, 2006). Both the students and their parents are looking for
added value for their money and the HE institutes have to deliver quality that is compatible with
the students’ expectations and needs (Smith et al., 2007).
16
Only 5 percent of all dissatisfied clients complain. (Carr and Littman, 1997; Goodman 1999).
This number has not really changed in the past 30 years (Grainer, 2003) despite the investment
of billions of dollars in service recovery systems. Negative publicity threatens to cause serious
damage to an organization .While a satisfied client shares his feelings with one or two people; a
dissatisfied client shares his negative feelings with nine to ten people (Carr and Littman, 1997).
Therefore, even if only one in ten students is dissatisfied, their negative influence overshadows
the positive influence of the other nine students. In view of these sentiments, only those
institutions focusing primarily on the needs of their customers will win this competition.
Implementing the principles of customer centrality and focusing on organizational aspects, which
contribute to improving services, may enhance an academic institution’s suitability to this new
reality.
In services, because of the inseparability between production and consumption of the service,
quality consists not only of the result, but also of the process (Sureshchander et al., 2002). Even
if the result is favorable (an academic degree), if the process is flawed, the quality is considered
low since quality is meeting customer expectations in service characteristics (Srikanthan and
Dalrymple, 2005). If lecturers are boring or rude or teach obsolete knowledge and if the
administrative units (e.g. academic departments, the students’ dean, the operations department,
the finance department, the training department and the examinations) supply poor service, the
graduates will not be pleased with the institution. Focus needs to be on external customers, and
their satisfaction with both the result and the process. In addition, customer’s expectations
towards particular services are also changing with respect to factors like time, increase in the
number of encounters with a particular service, competitive environment, etc. (Seth et al., 2005).
Accordingly, there is a continuing need to define the quality dimensions in HE and to measure
the students’ satisfaction based on the relevant quality dimensions in order to improve the HE
systems (Martin and Palmer, 2004; Van Kemenade et al., 2008).
When inquiring about the location of problematic areas dealing with quality within an
organization which provides services, one has to consider the different levels/tiers of service
organizations, as developed by Schneider and Bowen (1995) in order to understand the “the
service game” and how to win it in a competitive environment: The boundary tier which consists
of those who have direct contact with the customers and are on the receiving end of most of the
17
customers’ complaints; The coordination tier- those units which provide services to the boundary
tier, such as operations, finance ,procurement, human resources (HR), senior management, etc.;
The Customer tier who are students with different needs and expectations.
From the different tiers, the managers’ main role is to constantly improve work processes by
being attentive to employees, implementing their ideas and suggestions for improvement while
allowing them to lead the change (Deming, 2000; Zelnik et al., 2012). Increasing, the quality of
the work processes achieved by opening communication channels with the employees and
providing ongoing training will minimize mistakes, complaints and criticism and increase
employees’ commitment to provide quality service (Sharabi, 2010; Lobo et al., 2012). Zelnik et
al. (2012) further emphasize that the success of quality management system (QMS) is dependent
on the top management’s (coordination tier) communication with employees. Through effective
communication, managers can impart their expectations and priorities to their employees and
involve them in organizational efforts which eventually results in motivated and satisfied
workers. The service provided by the coordination level, especially the way in which human
resources are managed, contributes to the quality of work life within an organization and,
ultimately, to the customers’ satisfaction. There is no way to separate the quality work life from
the quality of the service. Both are necessary for a high quality organization (Sharabi, 2010).
Deming (2000) claims that workers are responsible for 15 percent of errors, while 85 percent of
errors are due to incorrect and illogical work processes that make it difficult for the worker to
achieve high service and product quality: new work methods are added to old ones, new
equipment and raw materials are melded to the old, new forms and procedures are layered over
the old ones, and the overall effect is to create a “patchwork” with multiple fail points. Sharabi
and Davidow (2010) indicate that every coin spent on fixing poor service quality is a cost, and
directly lowers profit by a dollar. Thus by improving service quality, we are directly improving
profits (Tanninena et al., 2010). Correcting the fault in the process contributes to its
improvement. This allows constant improvement, which is a never ending process. One
successful method to constant improvement of work processes and quality is the “Six Sigma
quality improvement methodology. Through implementation of this quality improvement process
in manufacturing Motorola saved $1.5 billion during the period 1986-1990 (Dahlgaard-Park,
2011).
18
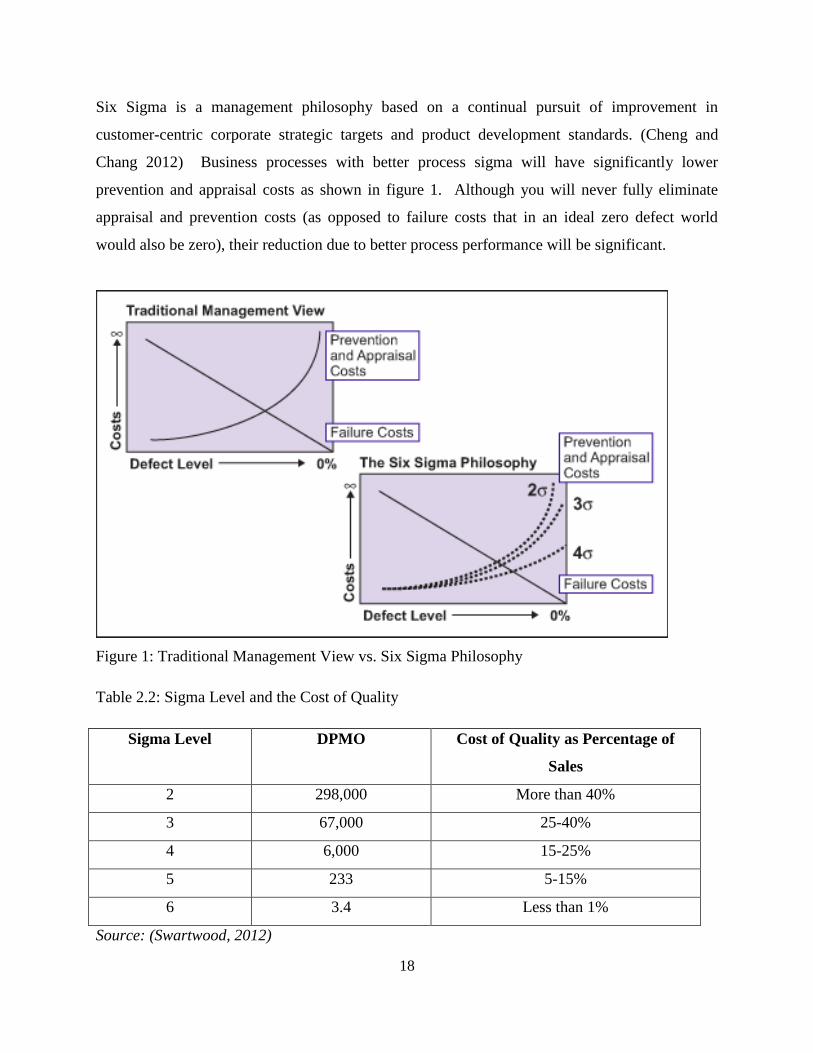
Six Sigma is a management philosophy based on a continual pursuit of improvement in
customer-centric corporate strategic targets and product development standards. (Cheng and
Chang 2012) Business processes with better process sigma will have significantly lower
prevention and appraisal costs as shown in figure 1. Although you will never fully eliminate
appraisal and prevention costs (as opposed to failure costs that in an ideal zero defect world
would also be zero), their reduction due to better process performance will be significant.
Figure 1: Traditional Management View vs. Six Sigma Philosophy
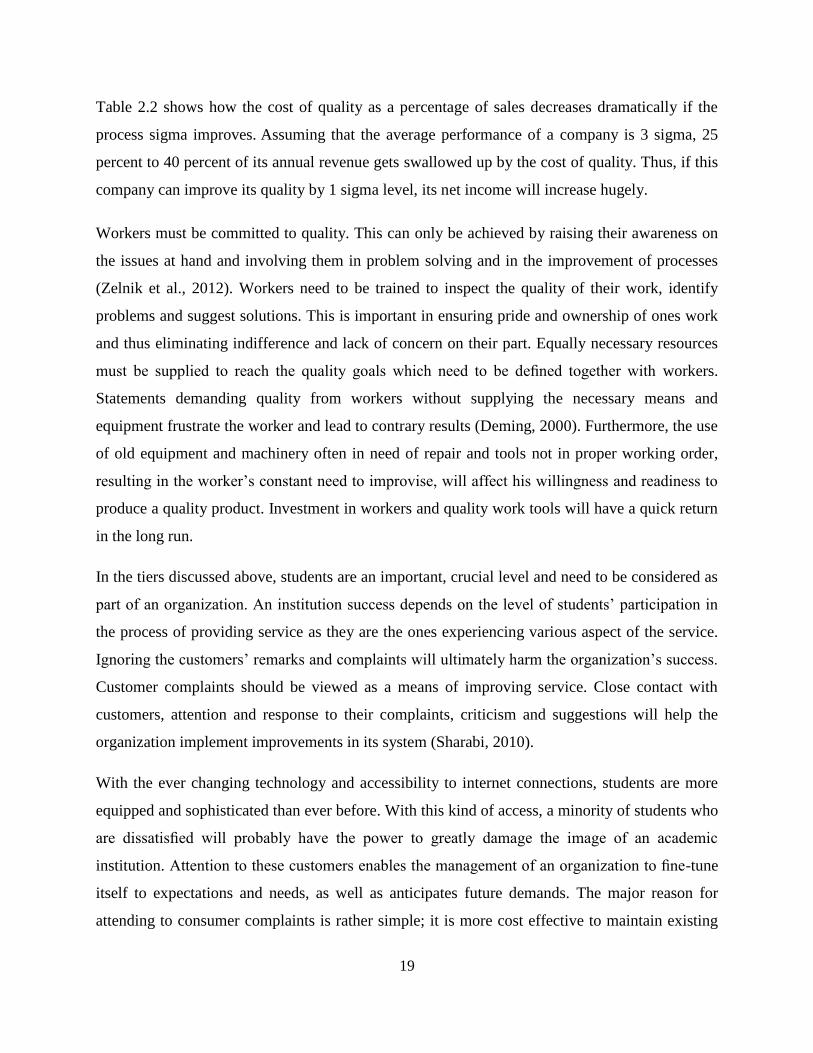
Table 2.2: Sigma Level and the Cost of Quality
Sigma Level DPMO Cost of Quality as Percentage of
Sales
2 298,000 More than 40%
3 67,000 25-40%
4 6,000 15-25%
5 233 5-15%
6 3.4 Less than 1%
Source: (Swartwood, 2012)
19
Table 2.2 shows how the cost of quality as a percentage of sales decreases dramatically if the
process sigma improves. Assuming that the average performance of a company is 3 sigma, 25
percent to 40 percent of its annual revenue gets swallowed up by the cost of quality. Thus, if this
company can improve its quality by 1 sigma level, its net income will increase hugely.
Workers must be committed to quality. This can only be achieved by raising their awareness on
the issues at hand and involving them in problem solving and in the improvement of processes
(Zelnik et al., 2012). Workers need to be trained to inspect the quality of their work, identify
problems and suggest solutions. This is important in ensuring pride and ownership of ones work
and thus eliminating indifference and lack of concern on their part. Equally necessary resources
must be supplied to reach the quality goals which need to be defined together with workers.
Statements demanding quality from workers without supplying the necessary means and
equipment frustrate the worker and lead to contrary results (Deming, 2000). Furthermore, the use
of old equipment and machinery often in need of repair and tools not in proper working order,
resulting in the worker’s constant need to improvise, will affect his willingness and readiness to
produce a quality product. Investment in workers and quality work tools will have a quick return
in the long run.
In the tiers discussed above, students are an important, crucial level and need to be considered as
part of an organization. An institution success depends on the level of students’ participation in
the process of providing service as they are the ones experiencing various aspect of the service.
Ignoring the customers’ remarks and complaints will ultimately harm the organization’s success.
Customer complaints should be viewed as a means of improving service. Close contact with
customers, attention and response to their complaints, criticism and suggestions will help the
organization implement improvements in its system (Sharabi, 2010).
With the ever changing technology and accessibility to internet connections, students are more
equipped and sophisticated than ever before. With this kind of access, a minority of students who
are dissatisfied will probably have the power to greatly damage the image of an academic
institution. Attention to these customers enables the management of an organization to fine-tune
itself to expectations and needs, as well as anticipates future demands. The major reason for
attending to consumer complaints is rather simple; it is more cost effective to maintain existing

20
customers than to invest extra marketing budgets to find new ones (Harrison-Walker,
2001).Service providers should not only monitor consumer issues, but also encourage dissatisfied
consumers to help remedy service problems. Responsive handling of complaints not only
facilitates effective resolution of consumer problems, but also provides opportunities to improve
long term relationships with customers (Estelami, 2000; Kirkby et al., 2001). It has been noted
that customers who are satisfied with the complaint handling process are found to be up to 8
percent more loyal than if they had had no problem at all (Goodman, 1999). It is also not
surprising that sometimes dissatisfied customers are actually more beneficial to a company than
satisfied ones since unhappy customers provide insights into service failures (Harrison-Walker,
2001).
In conclusion, the cost of quality isn't the price of creating a quality product or service. It's the
cost of not creating a quality product or service. Every time work is redone, the cost of quality
increases. To meet the students’ and other clients’ needs and expectations and to discover the
quality gaps, there is a need for consistent interaction. Beside focus groups, it is necessary to
implement periodic satisfaction questionnaires that include different measurements of quality
relevant to each organizations service provider (lecturers and administration assistants of the
different departments, students’ dean, admission process and tuition fees units, Examinations
departments etc.). The purpose of this kind of periodic surveys is to give the top management a
clear picture of the service provider’s quality from the student’s point of view and to identify the
gaps which have to be reduced (Sharabi, 2010).
2.5 Cost and Performance of Organizations
Defects and errors in all operations are a hidden cost to an organization. These errors and defects
negatively impact on production or service costs, profitability, and morale and customer
satisfaction. The problems that cause these impacts may lay hidden deep in processes. Six Sigma
aims to uncover these problems, get to their root causes and eliminate them. What is most
important in an organization performance management? One may ask. Is it sales or financial
performance? The answer is dependent on which you ask but to most people it is neither. Using
the analogy of a vehicle, sales and financial performance are like rearview mirrors that show you
where you have been. Process excellence is like the set of the vehicles headlights that shows
where you are headed. In companies where sales performance or financial performance is bad,
21
quite often process performance is the root cause of failures, and the reverse is true also. If sales
performance or financial performance is very good, often you can trace this success back to
process excellence.
Minimizing cost is a critical part of every investor's toolkit. This is because in investing, there is
no reason to assume that you get more if you pay more. Instead, every dollar paid for
management fees or trading commissions is simply a dollar less earning potential return. The key
point is that—unlike the markets—costs are largely controllable. In any market, the average
return for all investors before costs is, by definition, equal to the market return. However, once
various costs are accounted for, the distribution of returns realized by investors moves to the left,
because their aggregate return is now less than the market's. The actual return for all investors
combined is thus the market return reduced by all costs paid. One important implication of this is
that, after costs, fewer investors are able to outperform the markets (Kaplan, 2009)
In the LSS perspective, cost is a monetary valuation of effort, material, resources, time and
utilities consumed, risks incurred, and opportunity forgone in production and delivery of a good
or service. According to Process Excellence Network in an interview with Brad Power a
consultant and researcher in process innovation, there is a problem with how organizations go
about the cost cutting measures. A lot of companies are quite reactive when it comes to cost
cutting; they grow when things are good and then they just cut and slash and burn as soon as
things get bad. The organizations don’t maintain an ongoing approach to improvement, even in
the good times, so that they are better prepared when there is a downturn (Tague, 2011)
Poor process trumps good people, so process excellence enables all employees to consistently
deliver superior results. Lean adds powerful tools for identifying and eliminating waste in
processes and drastically reducing cycle times. Putting the two together makes a winning
combination. Boost your success by getting Lean! In the world of Lean thinking, your primary
goal is to operate more efficiently by eliminating not only defects in products and services, but
other forms of waste: inventory, processing, waiting, motion, transportation and overproduction.
Lean Six Sigma techniques help professionals in both service and manufacturing industries. Lean
Six Sigma principles-based methods will change how you manage your business and sustain
22
positive change into the future. Its data-based structure drives how management will make
reality-based decisions and govern day-to-day employee performance (Truscott, 2008)
Both Lean and Six Sigma are built around the view that businesses are composed of processes
that start with customer needs and should end with satisfied customers currently or after using
the product or service. However, the goal of Lean Six Sigma is growth, not just cost-cutting. It
aims for both effectiveness and efficiency. This way, a Lean Six Sigma approach drives
organizations not just to do things better, but to do better things. Six Sigma aims to
systematically decrease process variation so as to approach a quality level of near zero defects
and increased stability. The standard deviation is to be reduced so that it can fit within the
specification limits. At that level of process capability, a shift of 1, 5 sigma from the center
materializes in a defect rate of 3, 4 defects per million opportunities (Emiliani, 2008).
The methodology requires significant commitment from all levels within an organization
especially at the top. A process that is Lean is one that delivers products or services that the
customer wants at a price that reflects only the value that the customer is willing to pay for. Lean
Six Sigma for service is a "business”. According to Manz, (2011), Six Sigma does not directly
address process speed and so the lack of improvement in lead time in companies applying Six
Sigma methods alone is understandable. These companies also generally achieve modest
improvement in Work in Process (WIP) and finished goods inventory turns. In a similar manner,
those companies engaged in Lean methodology alone show limited improvements across the
organization due to the absence of Six Sigma organizational infrastructure. In essence, an
integrated approach utilizing the best of Six Sigma and Lean Strategies will maximize
shareholder value by accomplishing dramatic improvements in customer satisfaction, cost,
quality, speed and invested capital. The companies practicing the integrated approach will gain
four major benefits (Manz, 2011): Become faster and more responsive to customers; strive for
Six Sigma capability level; operate at lowest costs of poor quality; and achieve greater flexibility
throughout the business. Teamwork is not a concern for particular fields alone. Many industries
have recognized the critical role that teamwork plays in effective operation, particularly
industries that deal with high-risk, critical safety environments and tasks such as aviation,
military operations, and power generation (Kozlowski and Ilgen, 2006).
23
Moreover, in industries such as automotive manufacturing, the value of creating high-
performance teams has long been recognized. In this process, organizational complexity should
be reduced by decreasing functional concentration and increasing local control capabilities in
order to create the optimum conditions for collaboration and cross-functional teamwork. The
intensive collaboration provided by cross-functional teams accelerates the development of
routines, thereby reducing interference and facilitating the team’s ability to cope with
interference when it arises (Manz, 2011).
2.6 Lead Time and Organizational Performance
Time is the single best indicator of competitiveness. There exists many times in lean six sigma:
Set-up or change –over time, manufacturing time, product development time and customer lead
time or delivery time. Lead time is the time from when the customer gets in touch with the
organization until he or she is served with the required product or service. This is also called
customer-to-customer time. It is the summation of value added, non-value added and business
value-added time. Value added time is that time spent in doing the value-adding activities in a
process or the activities that the customer is willing to pay for. Non-value added time is the time
taken to do the activities in a process that the customer is not willing to pay for. Business value-
added time is the time taken to do the activities in a process that the customer is not willing to
pay for but is required for doing business (includes activities done for control, assurance,
regulation) (Schmidt and Aschkenase, 2008).
Revenue growth typically is top of mind for most executives and is directly impacted by the
supply chain. The importance of a reliable delivery system for getting products to market goes
without saying. However, the importance of transportation’s impact on revenue goes beyond just
delivering the product to the customer. A good example is the relationship between time and
revenue as affected by transportation. Goods with short lifecycles, perishable goods and goods
which are essential for production runs rely on transportation capacity and a reliable
transportation network to maintain their value. The order of holiday sweaters sitting in a Port of
Los Angeles warehouse during the crush of peak-season transportation demand does not produce
revenue for either the retailer or the vendor. Transportation impacts the top line in other ways as
well. For example, vendors who must guarantee delivery of goods within their retail customer’s
tight time parameters will readily plan expedited transportation services rather than the penalty
24
of charge backs and dissatisfied customers. And manufacturers practicing just-in-time and lean
operations are more likely to use vendors capable of offering the added value of visibility to
transportation and delivery information (Nonthaleerak & Hendry, 2008).
Lead time, the ability to meet market demand, customer satisfaction and sales all have an impact
on revenue growth. And all are affected by the shipper’s ability to assure the customer that it will
receive delivery of the right shipment, at the right time, at the right place and in good condition.
Transportation has a significant impact on the company’s operating expenses. Companies easily
can identify the transportation in their cost of goods sold (COGS) calculations. In addition, if
supply chain management truly is about process excellence, and we agree the less time it takes to
get products to market the more profitable the operation, then it follows that improvements in
transportation management will impact profitability. Since COGS typically accounts for a
significant percent of revenue, any actions that reduce the cost of goods sold as a percentage of
revenue will deliver a welcomed improvement in the financial performance of the company
(Mathieu et al. 2008).
To better understand a process, process lead time must be calculated. This calculation is a
foundational metric for both Lean and Six Sigma, or what is commonly referred to now as Lean
Six Sigma. Work in Process is anything that has entered the system and has not yet come out.
More than just the physical materials found in manufacturing, Work in Process can be
unanswered emails, customer requests, etc. For example, a team is currently working on five
reports and the Average Completion Rate is 2 hours. The Process Lead Time is calculated as 5 /
2 = 2.5. To decrease the Process Lead Time, either the WIP may be decreased or the Average
Completion Rate can be increased. Process Lead Time is also used to calculate Process Cycle
Efficiency (PCE) (Manz, 2011).
Lean management is a management style that promotes reducing waste through the elimination
of non-value added activities (streamlining operations), eliminating work in process and
inventory, and increasing productive flexibility and speed of employees and equipment. Average
Lead Time = (Average amount of WIP per period of time)/ (Average completion rate per period
of time).In other words, the average lead time is the average length of time a “thing” waits to be
completed in a process (Schmidt & Aschkenase, 2008).
25
2.7 Waste and Performance of an Organization
Wastes are non-value adding activities. Activities that take time, resources, or space, but do not
add value. Waste only adds to time and cost. George (2003) holds that services are full of wastes
and goes further to explain that service processes are usually slow processes and expensive
processes. They have far too much work-in-progress, e.g. Reports waiting on desks, e-mails in an
in-box, sales orders on a database etc. 90% of its time is waiting. He further adds that in any
slow process, 80% of the delay is caused by less than 20% of the activities. Lean philosophy
dictates that anything that does not add value to a process or product, or that the customer is
unwilling to pay for, is waste and should be eliminated. Each step of a process in the production
of a good or service either adds value or waste to the end product. Ultimately, the elimination of
waste increases an organization’s productivity and profit.
While creating the Toyota Production System, (Ohno, 1988) discovered that there are 8 wastes of
Lean manufacturing which have a universal application as discussed below. Despite what some
practitioners may say or write, the 8 wastes of Lean are applicable not just in a Lean
manufacturing system but also in services. These 8 wastes are: Waste from producing defects,
Waste of transportation; Waste from inventory; Waste from overproduction; Waste of waiting
time; Waste in processing; Waste of motion and Waste of skills.
According to Kippenberger (1997) the first type of production waste is over-production, which
relates to producing goods that are not needed at the moment. Martins (2010) further defined
over-production as the anticipation of changes in customer demand requirement would lead to
wastage of materials and labor. The effect of this creates longer process cycle times and higher
costs. Thus in a lean environment, its practitioners make an effort in eliminating this type of
production waste by matching available capacity to actual demand thereby only producing when
it is needed. According to Rother and Shook (2003), over-production waste is the most
significant source of production waste. In their opinion they claim it amounts to shortages as the
wrong things are produced and that it results to longer lead-time as it impair your ability to be
adaptable and easily respond to customer requirement.
26
The second type in Kippenberger (1997) perspective is waste as a result of waiting by employees
either due to movement of goods or for a process to complete. This waste results when people
wait for materials, information or resources necessary to begin or finish their work, or when
equipment is left idle, loss of process time, and cycle time and production cost increases
(Martins, 2010). Amongst the many negative effect caused by this waste of waiting is the delay
in moving production to downstream work operations. This type of production waste results
when time is not used effectively, Hines and Rich (1997) points out that this waste is
encountered when products are not moving or is being worked on and the result of this is that
both the product and employees are thus forced to wait unnecessary. In their view they assert that
waiting time should be used to train employees, maintenance or Kaizen activities.
The third waste is that of transportation, where goods are moved from one point to another
unnecessary amounts to transportation cost which creates waste. Transportation waste result
when information or materials have to be moved through unnecessary intermediaries. Cost is
increased whenever unnecessary work, inspection, or storage locations are added to a process
thereby leading to transportation waste. When parts are transported from one location to another
within the factory, value is not added to the product only to manufacturing lead-time thus its
reduction according to Karlsson and Ahlstrom (1996) is very important.
Over-processing waste forms the fourth type and it is the result of different circumstances.
Adding of unnecessary features and functions to a product leads to increased cycle time and cost
associated to design and production of that product (Martins, 2010). Hines and Rich (1997)
claims that over processing is as a result of making use of over complex solutions for simple
procedures that is to say when large inflexible machines are used rather than small flexible ones.
They stressed that the outcome of this situation discourages employees and it gives room to poor
layout thus leading to excessive transport and poor communication. Another factors that leads to
over processing is using machines without having sufficient safeguards such as poke-yoke or
jidoka devices.
Inventory waste forms the fifth type of production waste. This form of waste occurs when a work
object that has not being requested by a customer is produced. The risk associated with this type
of production waste is building-up of inventory that leads to tied down capital. This waste can
27
however be minimized if demand is matched with supply. The waste of inventory in Karlsson
and Ahlstrom (1996) opinion is the most important source of waste which is associated with the
keeping of parts and products in stock. According to them this does not add value thus it should
eliminated. They asserted that waste of inventory could be reduced through the reduction of lot
size which indirectly has positive effects such as increasing flexibility.
The sixth is the waste of motion, which has to do with unnecessary movement of employees
from one point to another (Kippenberger, 1997). This type of waste results when a specific work
process is not performed efficiently; this leads to higher cycle times and cost. Avoiding this type
of waste requires an understanding of the different processes involved in performing a task and
devising the best way to achieve it (Martins, 2010). Hines and Rich (1997) states this waste
results when employees have to stretch bend and pick up thereby causing unnecessary movement
when such actions could have been avoided. They claim that the outcome of such wasteful
activities makes employees to be tired and might lead to poor productivity and sometimes lead to
quality problems.
Lastly is the waste of defects, which relates to the mistakes in the production process that
requires rectification in Kippenberger (1997) opinion. Where work products do not meet
customer’s specification and rework is done leads to higher cycle time and production cost.
Minimizing the waste that results from defects would lead to increased customers’ satisfaction
amongst other benefits (Martins, 2010).
2.8 Theoretical Framework
This study will be based on the business process reengineering theory which was made known in
the 1990s by Michael Hammer and James Champy in the 90’s and theory of constraints which
was introduced by Eliyahu M. Goldratt in the late 70’s.
2.8.1 Business Process Reengineering Theory
The business process re-engineering (BPR) theory is a business management strategy, originally
pioneered in the early 1990s, focusing on the analysis and design of workflows and business
processes within an organization. BPR aimed to help organizations fundamentally rethink how
they do their work in order to dramatically improve customer service, cut operational costs, and
28
become world-class competitors. BPR seeks to help companies radically restructure their
organizations by focusing on the ground-up design of their business processes. According to
Davenport (1990) a business process is a set of logically related tasks performed to achieve a
defined business outcome. Re-engineering emphasized a holistic focus on business objectives
and how processes related to them, encouraging full-scale recreation of processes rather than
iterative optimization of sub processes.
Business Process Reengineering (BPR) is the practice of rethinking and redesigning the way
work is done to better support an organization's mission and reduce costs. Reengineering starts
with a high-level assessment of the organization's mission, strategic goals, and customer needs.
Basic questions are asked, such as "Does our mission need to be redefined? Are our strategic
goals aligned with our mission? Who are our customers?" An organization may find that it is
operating on questionable assumptions, particularly in terms of the wants and needs of its
customers. Only after the organization rethinks what it should be doing, does it go on to decide
how best to do it (Schmidt and Aschkenase, 2008).
Within the framework of this basic assessment of mission and goals, re-engineering focuses on
the organization's business processes—the steps and procedures that govern how resources are
used to create products and services that meet the needs of particular customers or markets. As a
structured ordering of work steps across time and place, a business process can be decomposed
into specific activities, measured, modeled, and improved. It can also be completely redesigned
or eliminated altogether. Re-engineering identifies, analyzes, and re-designs an organization's
core business processes with the aim of achieving dramatic improvements in critical performance
measures, such as cost, quality, service, and speed (Davenport 1990).
Companies use BPR to improve performance substantially on key processes that impact
customers. BPR helps reduces costs and cycle times by eliminating unproductive activities and
the employees who perform them. Reorganization of teams decreases the need for management
layers, accelerates information flows, and eliminates the errors and rework caused by multiple
handoffs. Workers gain responsibility for their output and can measure their performance based
on prompt feedback. Reengineering is a total reconstruction of business processes. It is not a
29
simple modification to existing practices. It is an all-or-nothing proposition with an uncertain
result. It is not tinkering with what already exists or making incremental changes which leave
basic structures intact. It involves going back to the beginning and inventing a better way of
doing work (George, 2003).
2.8.2 Theory of Constraints
Theory of Constraints (TOC) is a management philosophy originally developed by Dr. Eliyahu
M. Goldratt in the late 70s that focuses on constraint management. ”A chain is no stronger than
its weakest link” is the fundamental tenet of theory of constraint. Similarly, in any complex
system, at any point in time, more often than not there is always that one aspect of the system
that limits its ability to achieve its goal. The same is true for an organization. Therefore, for any
organization to attain significant improvement the constraint must be identified and the whole
system must be managed to keep that constraint in mind. TOC considers the fact that the entire
system is a collection of interrelated processes and each system having one or more constraints.
A constraint can be defined as any process that limits the ability of entire system to achieve its
intended goal. TOC seeks to achieve process of continuous improvement by following some 5
steps:
Identify the constraint – Determine the weakest link which in this case is anything that delays or
stops a process from achieving its goal.
Exploit the constraint – Look for ways and means to utilize the existing capacity of constrained
process to get the most out of it.
Subordinate the complete system to the constraint – Align all the other process to enable the
constraint operate at maximum effectiveness. This could involve letting the resources that have
excess capacity remain idle, or spend capacity to help the constraint. Avoid unnecessary
inventory.
Elevate the constraint – Raise the throughput rate of the constraint by making changes to break
the constraint. Do not let inertia become the constraint. If the constraint is broken go back to step
1 to identify new constraint and repeat the subsequent processes.
There are however limitations of Six Sigma and TOC. Six Sigma attempts to reduce variation in
all the processes so as to achieve overall improvement in system. System interdependencies are
not taken into account and processes are improved independently. As a result, there is probability
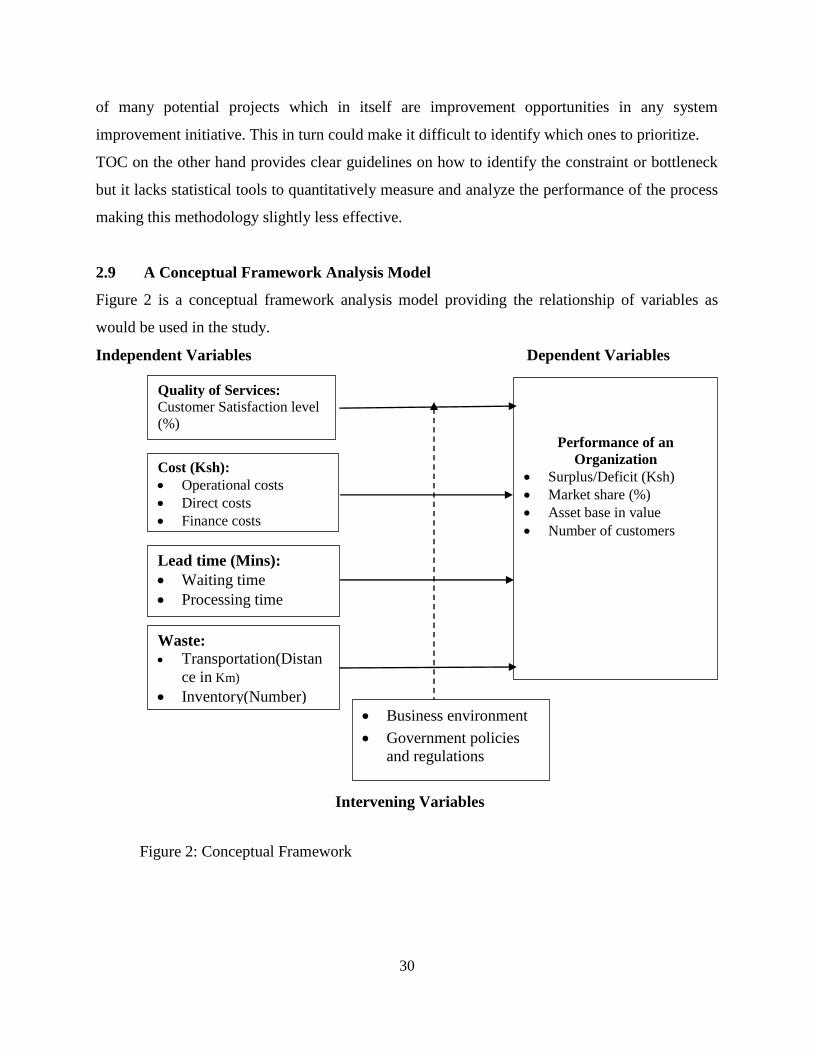
30
of many potential projects which in itself are improvement opportunities in any system
improvement initiative. This in turn could make it difficult to identify which ones to prioritize.
TOC on the other hand provides clear guidelines on how to identify the constraint or bottleneck
but it lacks statistical tools to quantitatively measure and analyze the performance of the process
making this methodology slightly less effective.
2.9 A Conceptual Framework Analysis Model
Figure 2 is a conceptual framework analysis model providing the relationship of variables as
would be used in the study.
Independent Variables Dependent Variables
Intervening Variables
Figure 2: Conceptual Framework
Quality of Services:
Customer Satisfaction level
(%)
Experience
Cost (Ksh):
Operational costs
Direct costs
Finance costs
Lead time (Mins):
Waiting time
Processing time
Waste:
Transportation(Distan
ce in Km)
Inventory(Number)
Performance of an
Organization
Surplus/Deficit (Ksh)
Market share (%)
Asset base in value
Number of customers
Business environment
Government policies
and regulations
31
2.9.1 Conceptualization of Variables
The section assesses the use of indicators that influence the performance of an organization. The
quality of services, cost, lead time and waste parameters will be analyzed as the independent
variables, to measure their influence on performance the dependent variable. The quality of
services evaluation will be done taking into account the leadership/ supervision style and the
main parameter of measurement being the customer satisfaction level.
Quality of Services can modify a customer’s perception on an organizationn. The quality will be
assessed if the services offer optimum satisfaction and value substitute to the client’s money. A
quality product or service is what is perceived by the customer and understood by the supplier. It
is what the customer is willing to pay for and not defective products.
Cost entails the finance costs, direct and indirect costs incurred by the organization. These are
the expenditures incurred by an entity in producing their products or in rendering their services.
This will be assessed through establishing total revenue in relation to expenditure costs.
Generally if total revenue is more than total cost, there is profit, while if total cost is more than
total revenue that is a loss to the organization. If total Revenue equals total Cost, there is break
even. This means that the profit is zero. If the profits received are high then this portrays a good
performance. In companies where sales performance or financial performance is bad, quite often
process performance is the root cause of failures, and the reverse is true also.
Lead time is the time from when the customer gets in touch with the organization until he or she
is served with the required product or service. Clients would like to receive services at the touch
of the button without delays and being taken round and round the organization. Lead time
therefore entails the ability to meet market demand, customer satisfaction and sales all of which
have a great impact on revenue growth and thus the organization performance.
Waste refers to the non-value adding activities that take time, resources, or space, but do not add
value. Waste only adds time and cost to service rendering and thus dispels customer quest for
services and inquiries. Each step of a process in the production of a good or service either adds
value or waste to the end product. Ultimately, the elimination of waste increases an
organization’s productivity and profit and hence the organization performance.
32
2.10 Gaps in Literature Review
Most of the literature reviewed dealt with Lean Six Sigma in manufacturing industries. The
service sector has been considerably slower in embracing six sigma than the manufacturing
sector (Furterer and Elshennawy, 2005). Managers of a service organization attempting to apply
Lean Six Sigma often find their task complicated by two mitigating circumstances. First, much
of Lean Six Sigma terminology and many of its techniques were originally intended for
manufacturing, and applying them to services has been challenging. Secondly, services by their
nature possess special characteristics, for example, the importance of information and the
abundance of cross-functional process flows.
Hensley and Dobie (2005, p. 87) identify some of the problems that come about when
implementing six sigma in the service sector: it is hard to collect data in service industries and
even harder to measure due to various things that happen when customers and service providers
interact and the data collected may not be as reliable since the data are collected through more
direct (“face to face”) means giving room for subjectivity. Very little has been done on
educational institutions that have adapted the six sigma model like the Kenya Institute of
Management, thus giving the urge to investigate the performance of organizations which have
adopted the lean six sigma methodology in the education sector.
2.11 Summary of Literature Review
Lean Six Sigma is viewed as a valuable approach in the portfolio of management improvement
programs that can be undertaken by organization executives. When waste is removed from a
service process, the lead time will always decrease. Re-engineering identifies, analyzes, and re-
designs an organization's core business processes with the aim of achieving dramatic
improvements in critical performance measures, such as cost, quality, service, and speed. The
goal of Lean Six Sigma should be to improve service and ultimately lower the cost of its
delivery. But this goal should be accomplished through a combination of employee attrition,
workforce reallocation, and contractor attrition, so that additional services are provided to the
public.
33
The integration of the Lean Principles into Six Sigma (or reversely) makes it possible to achieve
effective improvements. It provides organizations with the methods, tools and techniques for
superior improvements. Lean Six Sigma (LSS) is a powerful methodology of achieving process
efficiency and effectiveness resulting in enhanced customer satisfaction and improved bottom
line results. Lean is a powerful business process improvement methodology to minimize or even
eliminate different forms of waste or non-value added activities or steps whereas Six Sigma has
been proved to be an effective methodology to reduce variation within a business process and
thereby achieve process robustness.
Selection of a process improvement methodology is dependent on the culture of your
organization. If many popular programs appear to end up in the same place addressing the same
issues after a number of years of use, the main issue left to explore is the speed at which a
method will be accepted into an organization:
If your organization values analytical studies and the relationships of data, charts and analysis,
Six Sigma is a perfect program for you to start with.
If your organization values visual change and immediate results, then lean thinking might be the
way to go since lean is about speed of delivery.
More and more organizations are trying to determine what improvement method will work best
and fit best with their culture. When one is working through the apparent conflicting claims of
performance improvement programs various scholars advice one to concentrate on the primary
and secondary effects of their philosophies. Once the values of a specific improvement program
are identified, the comparison of those values with the values of the organization can make the
method of selection easier, if not obvious.
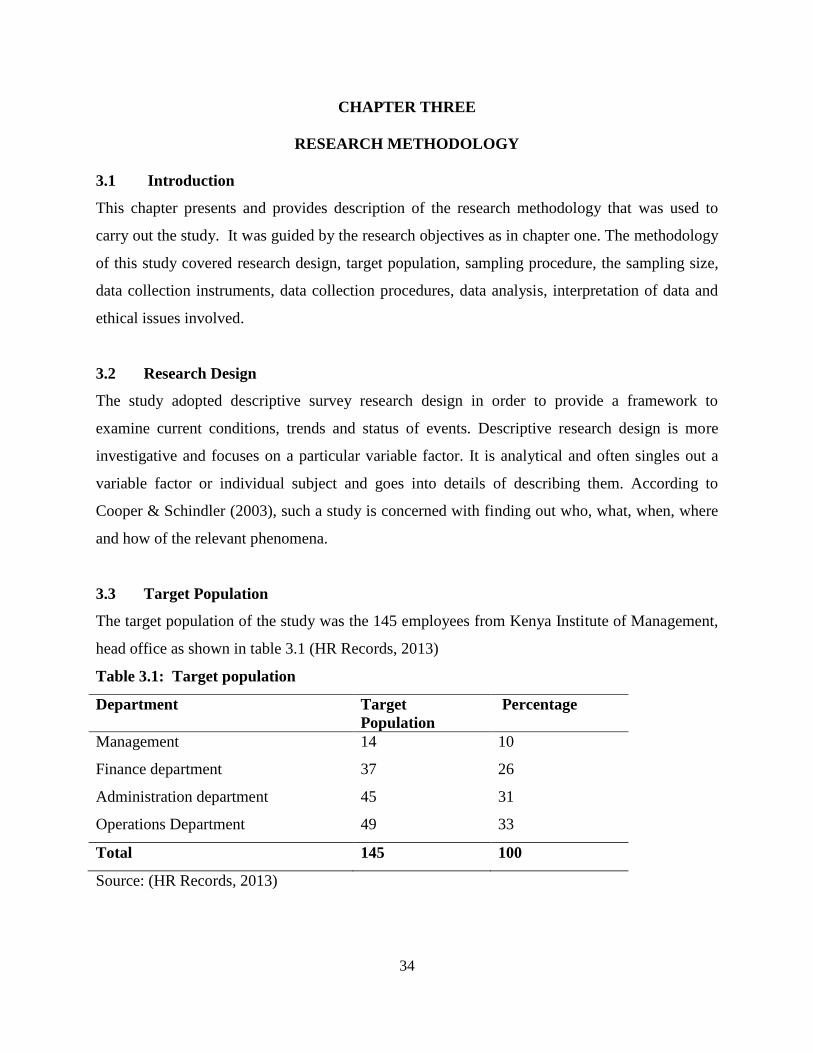
34
CHAPTER THREE
RESEARCH METHODOLOGY
3.1 Introduction
This chapter presents and provides description of the research methodology that was used to
carry out the study. It was guided by the research objectives as in chapter one. The methodology
of this study covered research design, target population, sampling procedure, the sampling size,
data collection instruments, data collection procedures, data analysis, interpretation of data and
ethical issues involved.
3.2 Research Design
The study adopted descriptive survey research design in order to provide a framework to
examine current conditions, trends and status of events. Descriptive research design is more
investigative and focuses on a particular variable factor. It is analytical and often singles out a
variable factor or individual subject and goes into details of describing them. According to
Cooper & Schindler (2003), such a study is concerned with finding out who, what, when, where
and how of the relevant phenomena.
3.3 Target Population
The target population of the study was the 145 employees from Kenya Institute of Management,
head office as shown in table 3.1 (HR Records, 2013)
Table 3.1: Target population
Department Target
Population
Percentage
Management 14 10
Finance department 37 26
Administration department 45 31
Operations Department 49 33
Total 145 100
Source: (HR Records, 2013)
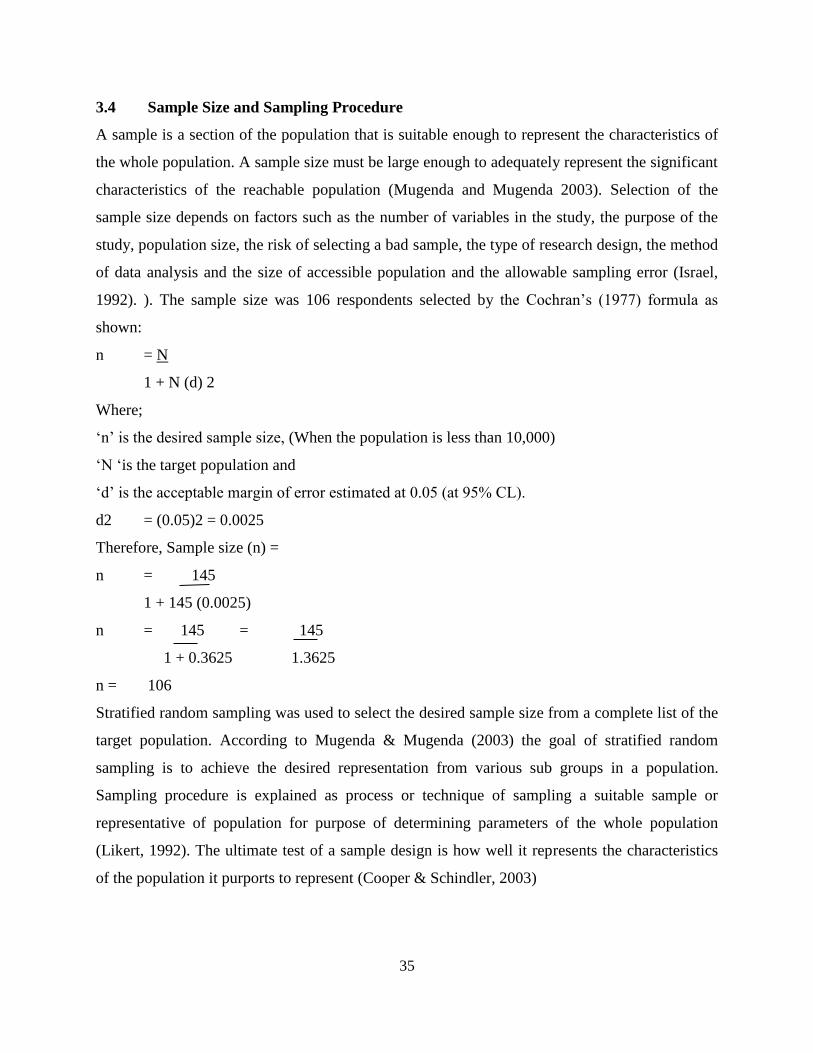
35
3.4 Sample Size and Sampling Procedure
A sample is a section of the population that is suitable enough to represent the characteristics of
the whole population. A sample size must be large enough to adequately represent the significant
characteristics of the reachable population (Mugenda and Mugenda 2003). Selection of the
sample size depends on factors such as the number of variables in the study, the purpose of the
study, population size, the risk of selecting a bad sample, the type of research design, the method
of data analysis and the size of accessible population and the allowable sampling error (Israel,
1992). ). The sample size was 106 respondents selected by the Cochran’s (1977) formula as
shown:
n = N
1 + N (d) 2
Where;
‘n’ is the desired sample size, (When the population is less than 10,000)
‘N ‘is the target population and
‘d’ is the acceptable margin of error estimated at 0.05 (at 95% CL).
d2 = (0.05)2 = 0.0025
Therefore, Sample size (n) =
n = 145
1 + 145 (0.0025)
n = 145 = 145
1 + 0.3625 1.3625
n = 106
Stratified random sampling was used to select the desired sample size from a complete list of the
target population. According to Mugenda & Mugenda (2003) the goal of stratified random
sampling is to achieve the desired representation from various sub groups in a population.
Sampling procedure is explained as process or technique of sampling a suitable sample or
representative of population for purpose of determining parameters of the whole population
(Likert, 1992). The ultimate test of a sample design is how well it represents the characteristics
of the population it purports to represent (Cooper & Schindler, 2003)
36
3.5 Data Collection Instruments
The study utilized mainly, primary and secondary data from individual departments executing
and implementing the Lean six sigma methodologies at Kenya Institute of Management as well
as those who did not. Prior to field work, desk research was conducted on the organization. Field
work was then conducted with support from the research team.
Data collection instruments involve methods which were used to collect data from the selected
respondents. This research study used self-designed structured questionnaires to collect primary
data from respondents. Questionnaires were used because each respondent receives the same set
of questions in exactly the same way and thus yielding data more comparable than information
obtained through an interview. The questionnaire had both open and closed ended questions to
allow respondents to express their opinions. They were developed with a set of semi structured
questions for pilot testing to check the reliability and validity of instrument of data collection.
The researcher finally prepared open and closed questionnaires with brief instructions which
allowed the respondents to tick the opinions they agree or disagree with, and express their views
with regards to the questions that were being asked. The questionnaires were administered
through drop and pick later method. The questionnaire was structured into 3 broad categories. It
started with the background information of the respondent, seeking to identify the gender of the
respondent, their level of education and the department they belong to. Section 2 contained
general information on the knowledge and information the respondents had regarding
implementation of lean six sigma in the organization. Section 3 sought information about the
various elements of LSS and their influence on organization performance.
3.5.1 Pilot Test
Pilot-testing is an important step in the research process because it reveals vague questions and
unclear instructions (Nachmias et al, 1996). The data collection assistants administered 10
questionnaires and the interview guides to the staff in Lutheran plaza a couple of days before the
study initiation. It is important to note that the data collected was used for testing the data
collection tool and not for the purpose of the study. The data collected was analyzed and
interpreted. After completion of the pilot testing all the data collection tools were reviewed and
suitable corrections and adjustments made to ensure the tool was fit for collection of objective
data.
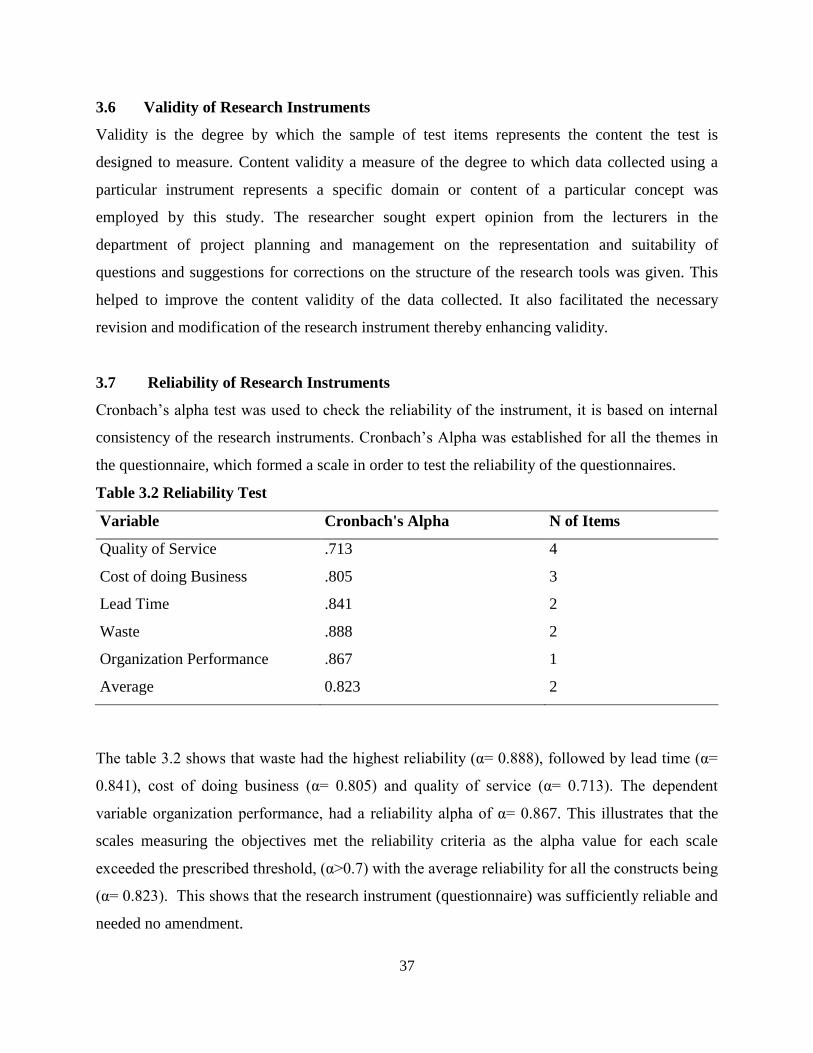
37
3.6 Validity of Research Instruments
Validity is the degree by which the sample of test items represents the content the test is
designed to measure. Content validity a measure of the degree to which data collected using a
particular instrument represents a specific domain or content of a particular concept was
employed by this study. The researcher sought expert opinion from the lecturers in the
department of project planning and management on the representation and suitability of
questions and suggestions for corrections on the structure of the research tools was given. This
helped to improve the content validity of the data collected. It also facilitated the necessary
revision and modification of the research instrument thereby enhancing validity.
3.7 Reliability of Research Instruments
Cronbach’s alpha test was used to check the reliability of the instrument, it is based on internal
consistency of the research instruments. Cronbach’s Alpha was established for all the themes in
the questionnaire, which formed a scale in order to test the reliability of the questionnaires.
Table 3.2 Reliability Test
Variable Cronbach's Alpha N of Items
Quality of Service .713 4
Cost of doing Business .805 3
Lead Time .841 2
Waste .888 2
Organization Performance .867 1
Average 0.823 2
The table 3.2 shows that waste had the highest reliability (α= 0.888), followed by lead time (α=
0.841), cost of doing business (α= 0.805) and quality of service (α= 0.713). The dependent
variable organization performance, had a reliability alpha of α= 0.867. This illustrates that the
scales measuring the objectives met the reliability criteria as the alpha value for each scale
exceeded the prescribed threshold, (α>0.7) with the average reliability for all the constructs being
(α= 0.823). This shows that the research instrument (questionnaire) was sufficiently reliable and
needed no amendment.
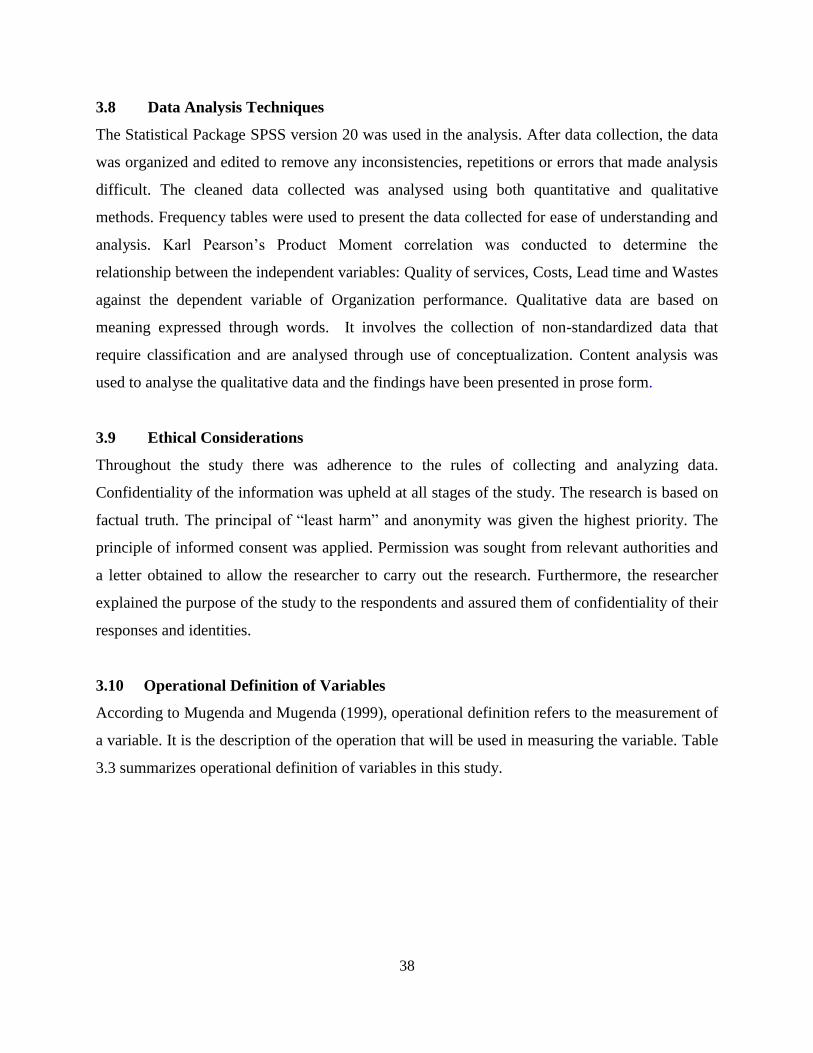
38
3.8 Data Analysis Techniques
The Statistical Package SPSS version 20 was used in the analysis. After data collection, the data
was organized and edited to remove any inconsistencies, repetitions or errors that made analysis
difficult. The cleaned data collected was analysed using both quantitative and qualitative
methods. Frequency tables were used to present the data collected for ease of understanding and
analysis. Karl Pearson’s Product Moment correlation was conducted to determine the
relationship between the independent variables: Quality of services, Costs, Lead time and Wastes
against the dependent variable of Organization performance. Qualitative data are based on
meaning expressed through words. It involves the collection of non-standardized data that
require classification and are analysed through use of conceptualization. Content analysis was
used to analyse the qualitative data and the findings have been presented in prose form.
3.9 Ethical Considerations
Throughout the study there was adherence to the rules of collecting and analyzing data.
Confidentiality of the information was upheld at all stages of the study. The research is based on
factual truth. The principal of “least harm” and anonymity was given the highest priority. The
principle of informed consent was applied. Permission was sought from relevant authorities and
a letter obtained to allow the researcher to carry out the research. Furthermore, the researcher
explained the purpose of the study to the respondents and assured them of confidentiality of their
responses and identities.
3.10 Operational Definition of Variables
According to Mugenda and Mugenda (1999), operational definition refers to the measurement of
a variable. It is the description of the operation that will be used in measuring the variable. Table
3.3 summarizes operational definition of variables in this study.
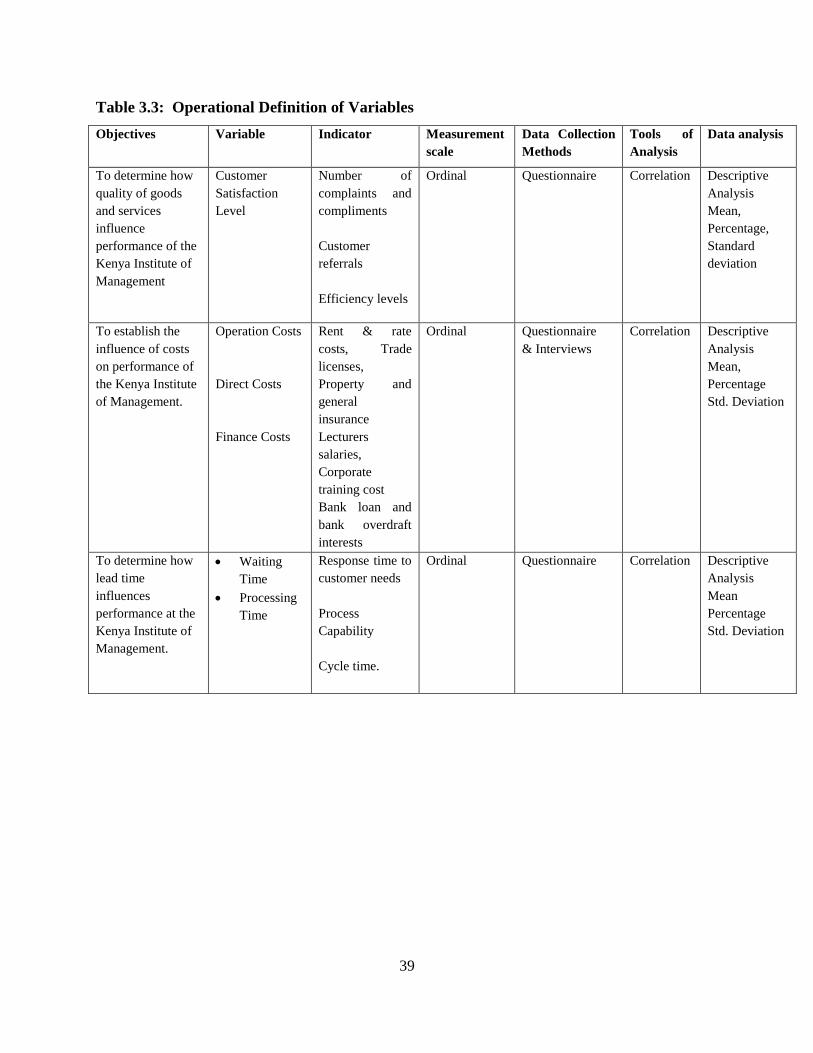
39
Table 3.3: Operational Definition of Variables
Objectives Variable Indicator Measurement
scale
Data Collection
Methods
Tools of
Analysis
Data analysis
To determine how
quality of goods
and services
influence
performance of the
Kenya Institute of
Management
Customer
Satisfaction
Level
Number of
complaints and
compliments
Customer
referrals
Efficiency levels
Ordinal Questionnaire Correlation
Descriptive
Analysis
Mean,
Percentage,
Standard
deviation
To establish the
influence of costs
on performance of
the Kenya Institute
of Management.
Operation Costs
Direct Costs
Finance Costs
Rent & rate
costs, Trade
licenses,
Property and
general
insurance
Lecturers
salaries,
Corporate
training cost
Bank loan and
bank overdraft
interests
Ordinal Questionnaire
& Interviews
Correlation
Descriptive
Analysis
Mean,
Percentage
Std. Deviation
To determine how
lead time
influences
performance at the
Kenya Institute of
Management.
Waiting
Time
Processing
Time
Response time to
customer needs
Process
Capability
Cycle time.
Ordinal
Questionnaire
Correlation
Descriptive
Analysis
Mean
Percentage
Std. Deviation
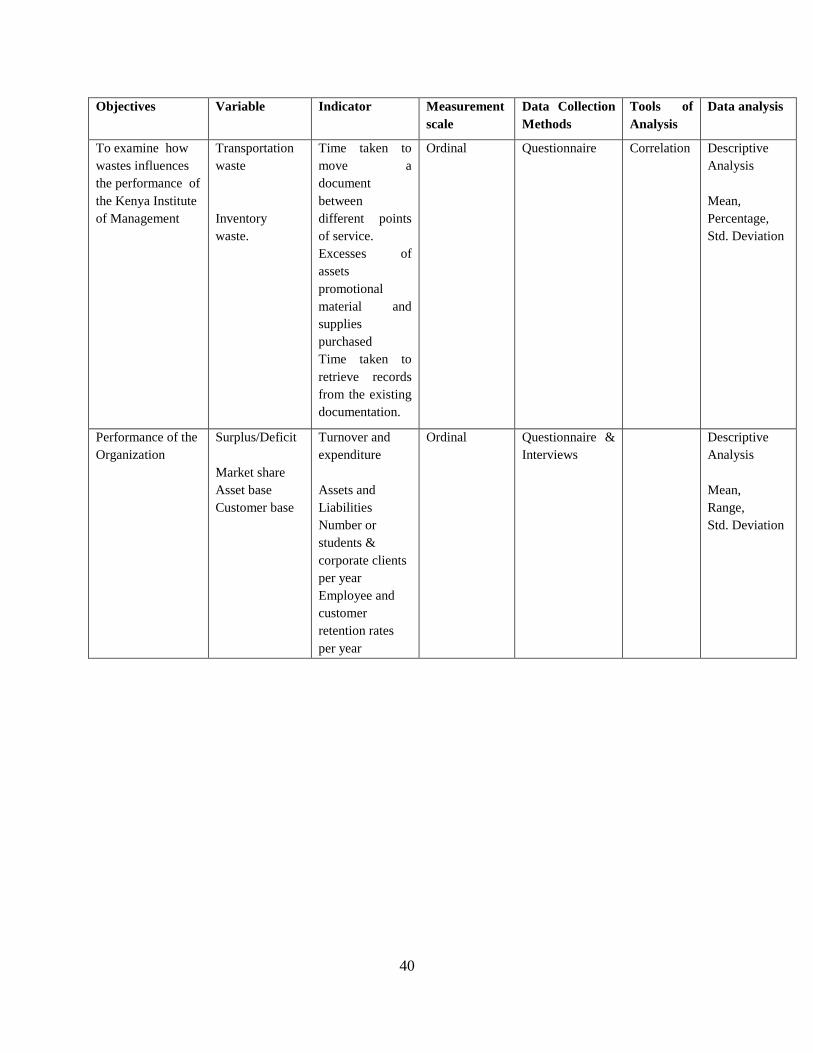
40
Objectives Variable Indicator Measurement
scale
Data Collection
Methods
Tools of
Analysis
Data analysis
To examine how
wastes influences
the performance of
the Kenya Institute
of Management
Transportation
waste
Inventory
waste.
Time taken to
move a
document
between
different points
of service.
Excesses of
assets
promotional
material and
supplies
purchased
Time taken to
retrieve records
from the existing
documentation.
Ordinal Questionnaire Correlation
Descriptive
Analysis
Mean,
Percentage,
Std. Deviation
Performance of the
Organization
Surplus/Deficit
Market share
Asset base
Customer base
Turnover and
expenditure
Assets and
Liabilities
Number or
students &
corporate clients
per year
Employee and
customer
retention rates
per year
Ordinal Questionnaire &
Interviews
Descriptive
Analysis
Mean,
Range,
Std. Deviation
41
CHAPTER FOUR
DATA ANALYSIS, PRESENTATION, INTERPRETATION AND DISCUSSION
4.1 Introduction
This chapter covers the presentation and interpretation of the findings. The purpose of this study
was to establish the influence of lean six sigma methodology on performance of organizations: a
case of the Kenya Institute of Management. The study further sought to determine the influence
of quality of goods and services, cost of doing business, lead time and waste on performance of
organizations. The findings are presented in tables.
4.2 Questionnaire Response Rate
The study had a sample of 106 respondents drawn from different departments of the Kenya
Institute of Management. Of the 106 questionnaires distributed, 87 were filled in and returned
which represents 82% of the respondents. This is a reliable response rate for data analysis.
Mugenda & Mugenda 2003 point that a response rate of 60% is good and a response rate of 70%
and over is excellent. The above response rate was achieved because of the collection procedure
of drop and pick later method. The respondents were regularly reminded through phone calls to
fill the questionnaires and any help or additional clarifications needed by the respondents were
accorded. However, 18% of the respondents were either reluctant to participate or misplaced the
questionnaires.
4.3 Demographic Characteristics of Respondents
The study sought to establish the background information of the respondents which includes the
respondents’ gender, level of education and the number of staff trained on lean six sigma.
4.3.1 Distribution of the Respondents by Gender
The study sought to find out the gender of the respondents. The findings obtained are as shown
in table 4.1.
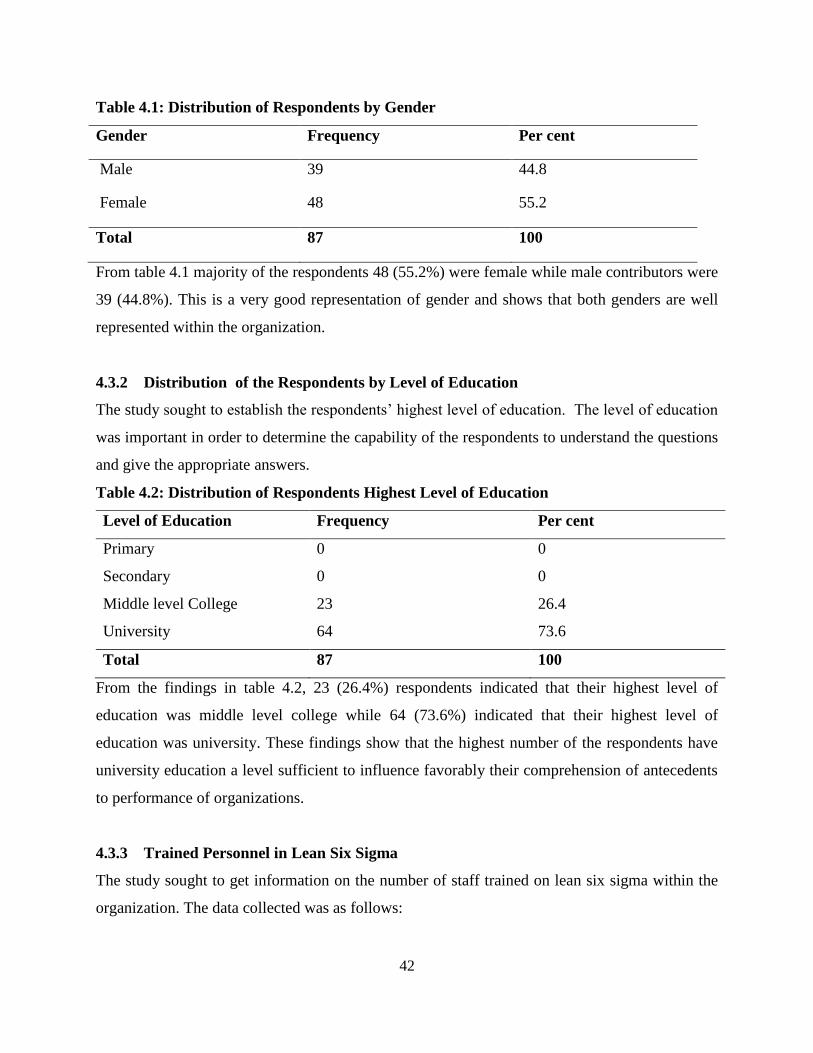
42
Table 4.1: Distribution of Respondents by Gender
Gender Frequency Per cent
Male 39 44.8
Female 48 55.2
Total 87 100
From table 4.1 majority of the respondents 48 (55.2%) were female while male contributors were
39 (44.8%). This is a very good representation of gender and shows that both genders are well
represented within the organization.
4.3.2 Distribution of the Respondents by Level of Education
The study sought to establish the respondents’ highest level of education. The level of education
was important in order to determine the capability of the respondents to understand the questions
and give the appropriate answers.
Table 4.2: Distribution of Respondents Highest Level of Education
Level of Education Frequency Per cent
Primary 0 0
Secondary 0 0
Middle level College 23 26.4
University 64 73.6
Total 87 100
From the findings in table 4.2, 23 (26.4%) respondents indicated that their highest level of
education was middle level college while 64 (73.6%) indicated that their highest level of
education was university. These findings show that the highest number of the respondents have
university education a level sufficient to influence favorably their comprehension of antecedents
to performance of organizations.
4.3.3 Trained Personnel in Lean Six Sigma
The study sought to get information on the number of staff trained on lean six sigma within the
organization. The data collected was as follows:
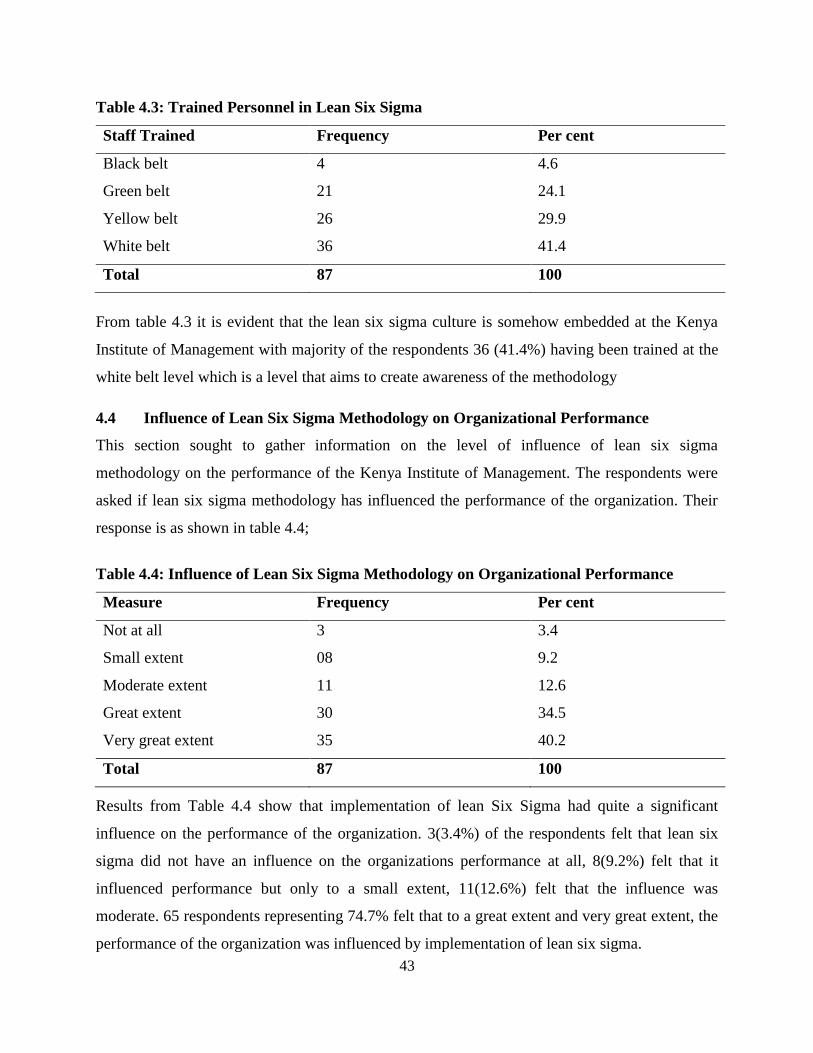
43
Table 4.3: Trained Personnel in Lean Six Sigma
Staff Trained Frequency Per cent
Black belt 4 4.6
Green belt 21 24.1
Yellow belt 26 29.9
White belt 36 41.4
Total 87 100
From table 4.3 it is evident that the lean six sigma culture is somehow embedded at the Kenya
Institute of Management with majority of the respondents 36 (41.4%) having been trained at the
white belt level which is a level that aims to create awareness of the methodology
4.4 Influence of Lean Six Sigma Methodology on Organizational Performance
This section sought to gather information on the level of influence of lean six sigma
methodology on the performance of the Kenya Institute of Management. The respondents were
asked if lean six sigma methodology has influenced the performance of the organization. Their
response is as shown in table 4.4;
Table 4.4: Influence of Lean Six Sigma Methodology on Organizational Performance
Measure Frequency Per cent
Not at all 3 3.4
Small extent 08 9.2
Moderate extent 11 12.6
Great extent 30 34.5
Very great extent 35 40.2
Total 87 100
Results from Table 4.4 show that implementation of lean Six Sigma had quite a significant
influence on the performance of the organization. 3(3.4%) of the respondents felt that lean six
sigma did not have an influence on the organizations performance at all, 8(9.2%) felt that it
influenced performance but only to a small extent, 11(12.6%) felt that the influence was
moderate. 65 respondents representing 74.7% felt that to a great extent and very great extent, the
performance of the organization was influenced by implementation of lean six sigma.
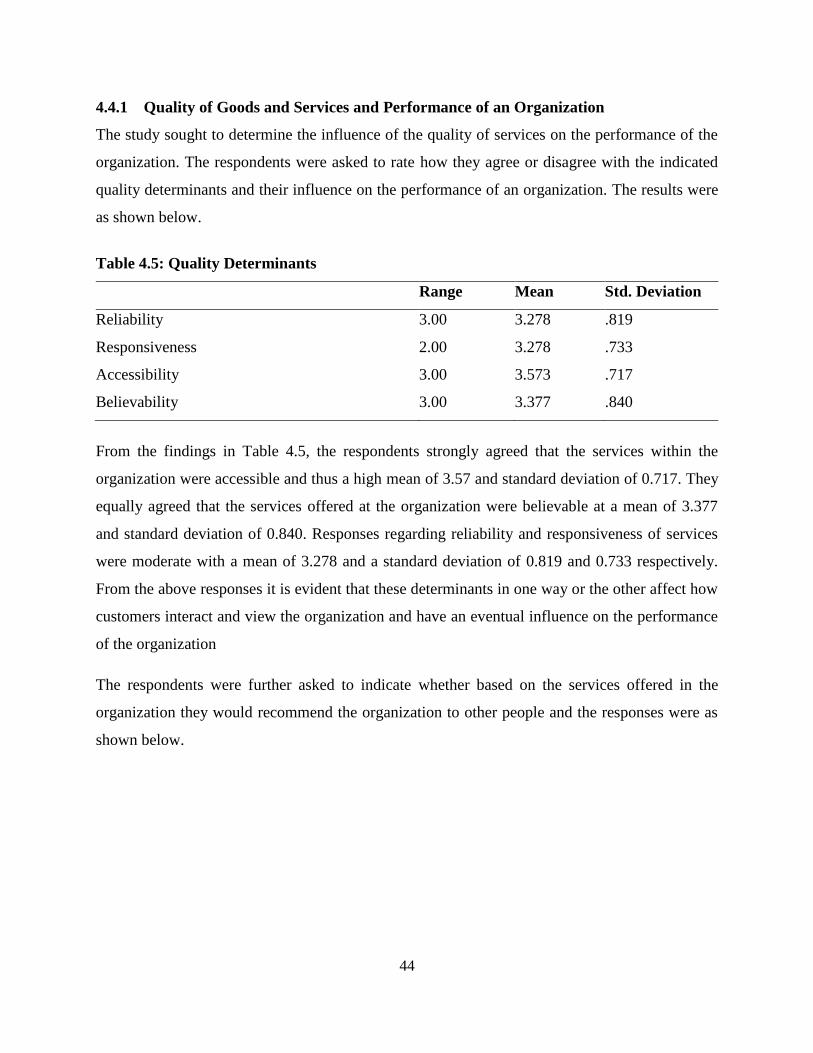
44
4.4.1 Quality of Goods and Services and Performance of an Organization
The study sought to determine the influence of the quality of services on the performance of the
organization. The respondents were asked to rate how they agree or disagree with the indicated
quality determinants and their influence on the performance of an organization. The results were
as shown below.
Table 4.5: Quality Determinants
Range Mean Std. Deviation
Reliability 3.00 3.278 .819
Responsiveness 2.00 3.278 .733
Accessibility 3.00 3.573 .717
Believability 3.00 3.377 .840
From the findings in Table 4.5, the respondents strongly agreed that the services within the
organization were accessible and thus a high mean of 3.57 and standard deviation of 0.717. They
equally agreed that the services offered at the organization were believable at a mean of 3.377
and standard deviation of 0.840. Responses regarding reliability and responsiveness of services
were moderate with a mean of 3.278 and a standard deviation of 0.819 and 0.733 respectively.
From the above responses it is evident that these determinants in one way or the other affect how
customers interact and view the organization and have an eventual influence on the performance
of the organization
The respondents were further asked to indicate whether based on the services offered in the
organization they would recommend the organization to other people and the responses were as
shown below.
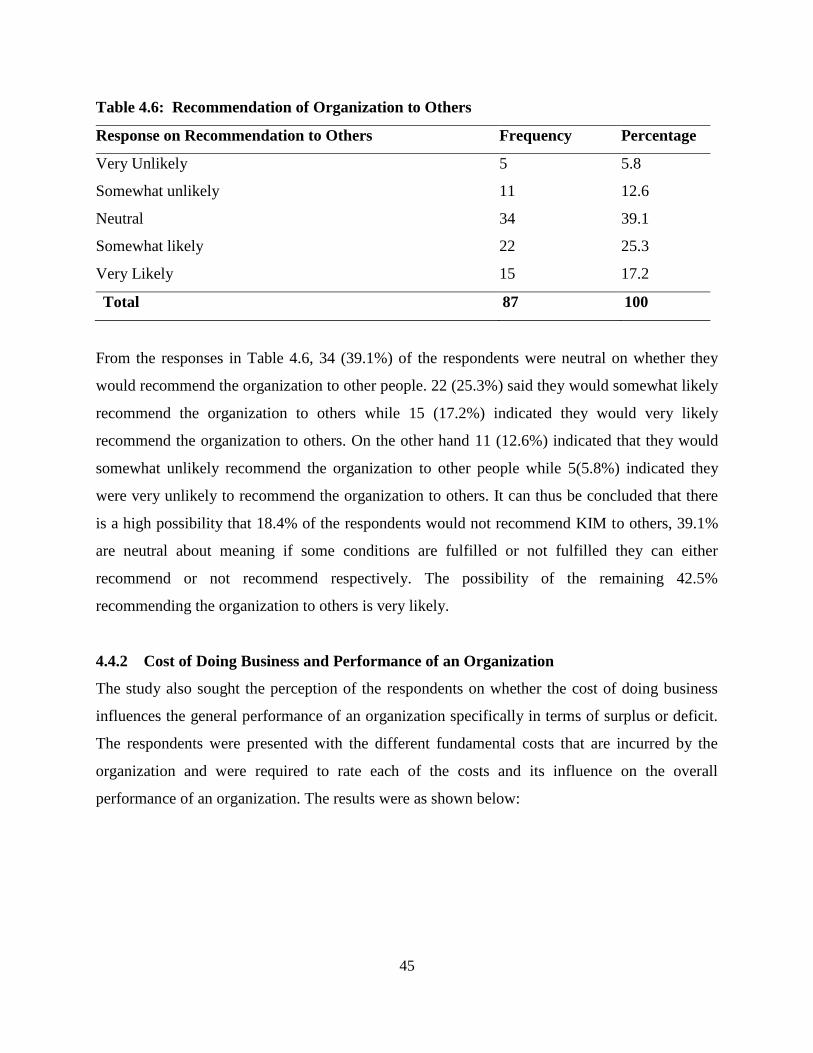
45
Table 4.6: Recommendation of Organization to Others
Response on Recommendation to Others Frequency Percentage
Very Unlikely 5 5.8
Somewhat unlikely 11 12.6
Neutral 34 39.1
Somewhat likely 22 25.3
Very Likely 15 17.2
Total 87 100
From the responses in Table 4.6, 34 (39.1%) of the respondents were neutral on whether they
would recommend the organization to other people. 22 (25.3%) said they would somewhat likely
recommend the organization to others while 15 (17.2%) indicated they would very likely
recommend the organization to others. On the other hand 11 (12.6%) indicated that they would
somewhat unlikely recommend the organization to other people while 5(5.8%) indicated they
were very unlikely to recommend the organization to others. It can thus be concluded that there
is a high possibility that 18.4% of the respondents would not recommend KIM to others, 39.1%
are neutral about meaning if some conditions are fulfilled or not fulfilled they can either
recommend or not recommend respectively. The possibility of the remaining 42.5%
recommending the organization to others is very likely.
4.4.2 Cost of Doing Business and Performance of an Organization
The study also sought the perception of the respondents on whether the cost of doing business
influences the general performance of an organization specifically in terms of surplus or deficit.
The respondents were presented with the different fundamental costs that are incurred by the
organization and were required to rate each of the costs and its influence on the overall
performance of an organization. The results were as shown below:
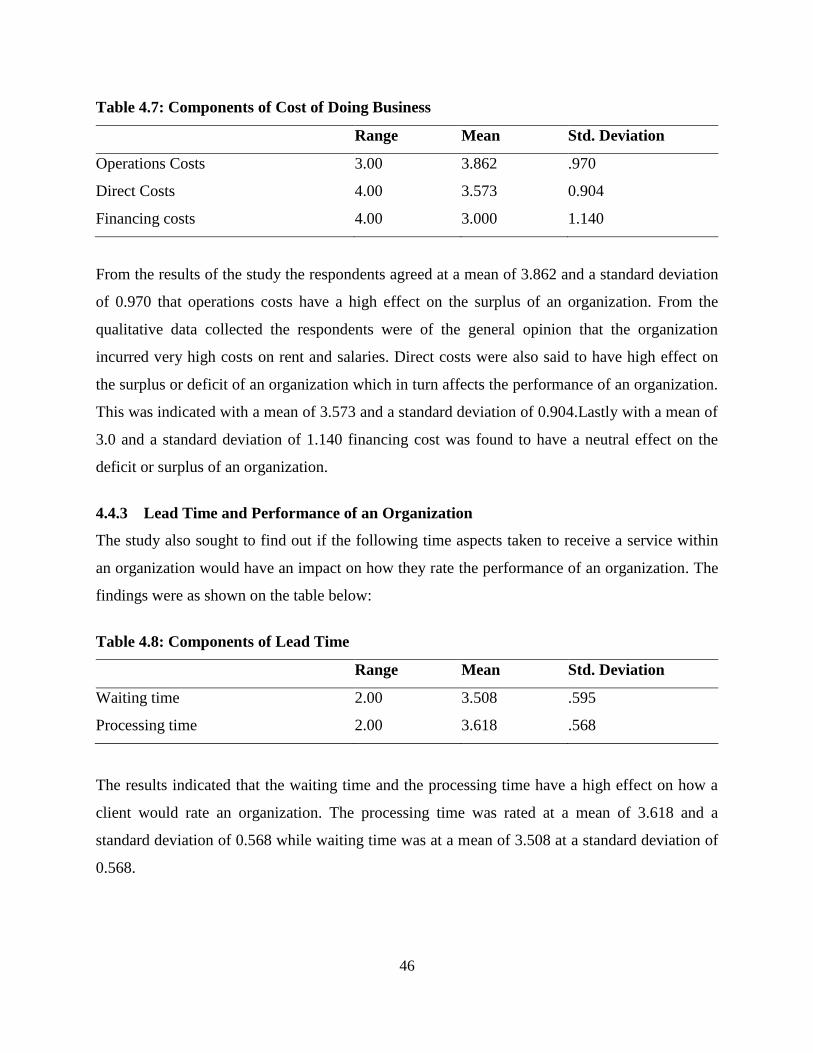
46
Table 4.7: Components of Cost of Doing Business
Range Mean Std. Deviation
Operations Costs 3.00 3.862 .970
Direct Costs 4.00 3.573 0.904
Financing costs 4.00 3.000 1.140
From the results of the study the respondents agreed at a mean of 3.862 and a standard deviation
of 0.970 that operations costs have a high effect on the surplus of an organization. From the
qualitative data collected the respondents were of the general opinion that the organization
incurred very high costs on rent and salaries. Direct costs were also said to have high effect on
the surplus or deficit of an organization which in turn affects the performance of an organization.
This was indicated with a mean of 3.573 and a standard deviation of 0.904.Lastly with a mean of
3.0 and a standard deviation of 1.140 financing cost was found to have a neutral effect on the
deficit or surplus of an organization.
4.4.3 Lead Time and Performance of an Organization
The study also sought to find out if the following time aspects taken to receive a service within
an organization would have an impact on how they rate the performance of an organization. The
findings were as shown on the table below:
Table 4.8: Components of Lead Time
Range Mean Std. Deviation
Waiting time 2.00 3.508 .595
Processing time 2.00 3.618 .568
The results indicated that the waiting time and the processing time have a high effect on how a
client would rate an organization. The processing time was rated at a mean of 3.618 and a
standard deviation of 0.568 while waiting time was at a mean of 3.508 at a standard deviation of
0.568.
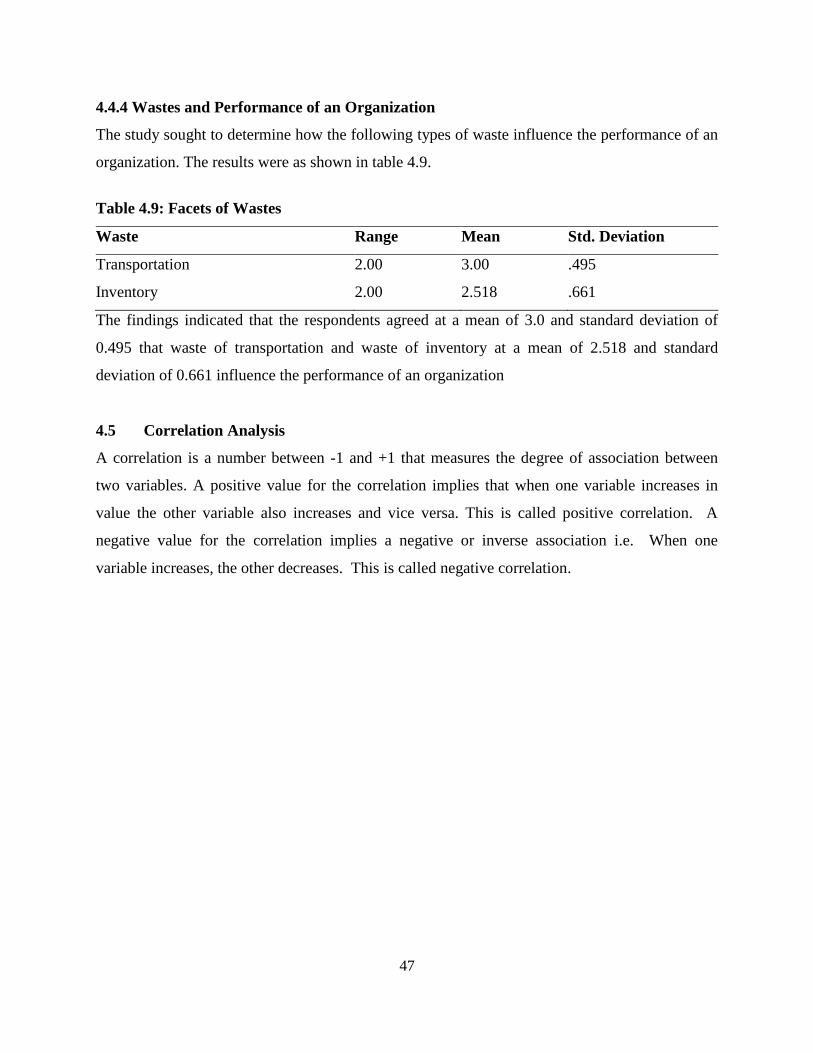
47
4.4.4 Wastes and Performance of an Organization
The study sought to determine how the following types of waste influence the performance of an
organization. The results were as shown in table 4.9.
Table 4.9: Facets of Wastes
Waste Range Mean Std. Deviation
Transportation 2.00 3.00 .495
Inventory 2.00 2.518 .661
The findings indicated that the respondents agreed at a mean of 3.0 and standard deviation of
0.495 that waste of transportation and waste of inventory at a mean of 2.518 and standard
deviation of 0.661 influence the performance of an organization
4.5 Correlation Analysis
A correlation is a number between -1 and +1 that measures the degree of association between
two variables. A positive value for the correlation implies that when one variable increases in
value the other variable also increases and vice versa. This is called positive correlation. A
negative value for the correlation implies a negative or inverse association i.e. When one
variable increases, the other decreases. This is called negative correlation.
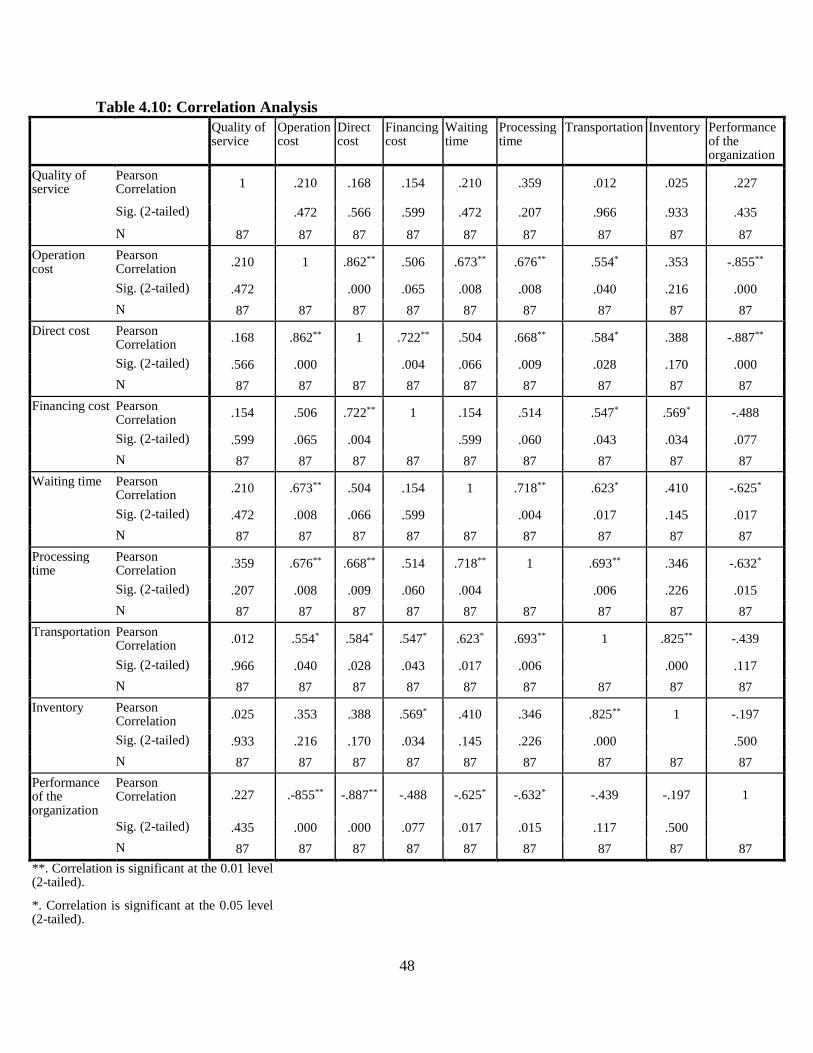
48
Table 4.10: Correlation Analysis
Quality of service
Operation cost
Direct cost
Financing cost
Waiting time
Processing time
Transportation Inventory Performance of the organization
Quality of service
Pearson Correlation 1 .210 .168 .154 .210 .359 .012 .025 .227
Sig. (2-tailed) .472 .566 .599 .472 .207 .966 .933 .435
N 87 87 87 87 87 87 87 87 87
Operation cost
Pearson Correlation
.210 1 .862** .506 .673** .676** .554* .353 -.855**
Sig. (2-tailed) .472 .000 .065 .008 .008 .040 .216 .000
N 87 87 87 87 87 87 87 87 87
Direct cost Pearson Correlation
.168 .862** 1 .722** .504 .668** .584* .388 -.887**
Sig. (2-tailed) .566 .000 .004 .066 .009 .028 .170 .000
N 87 87 87 87 87 87 87 87 87
Financing cost Pearson Correlation
.154 .506 .722** 1 .154 .514 .547* .569* -.488
Sig. (2-tailed) .599 .065 .004 .599 .060 .043 .034 .077
N 87 87 87 87 87 87 87 87 87
Waiting time Pearson Correlation
.210 .673** .504 .154 1 .718** .623* .410 -.625*
Sig. (2-tailed) .472 .008 .066 .599 .004 .017 .145 .017
N 87 87 87 87 87 87 87 87 87
Processing time
Pearson Correlation
.359 .676** .668** .514 .718** 1 .693** .346 -.632*
Sig. (2-tailed) .207 .008 .009 .060 .004 .006 .226 .015
N 87 87 87 87 87 87 87 87 87
Transportation Pearson Correlation
.012 .554* .584* .547* .623* .693** 1 .825** -.439
Sig. (2-tailed) .966 .040 .028 .043 .017 .006 .000 .117
N 87 87 87 87 87 87 87 87 87
Inventory Pearson Correlation
.025 .353 .388 .569* .410 .346 .825** 1 -.197
Sig. (2-tailed) .933 .216 .170 .034 .145 .226 .000 .500
N 87 87 87 87 87 87 87 87 87
Performance of the organization
Pearson Correlation .227 .-855** -.887** -.488 -.625* -.632* -.439 -.197 1
Sig. (2-tailed) .435 .000 .000 .077 .017 .015 .117 .500
N 87 87 87 87 87 87 87 87 87
**. Correlation is significant at the 0.01 level (2-tailed).
*. Correlation is significant at the 0.05 level (2-tailed).
49
From correlation analysis in table 4.10, the study found that there is a positive relationship
between the quality of service and performance of an organization, where the correlation
coefficient was 0.227 .The study also found that costs and overall performance of an
organization correlate strongly negative with an average correlation coefficient of (- .743) with (-
.855) for operation costs, (-.887) for direct cost and (-.488) for the financing costs. The study
further established that there is a strong negative correlation between time and performance with
an average correlation coefficient of -0.628 (-.625 being the coefficient of waiting time and- .632
being the coefficient of processing time). Lastly, the study found that there is a weak negative
correlation between waste and performance with a correlation coefficient of (-.318) with (-. 439)
being the correlation coefficient of waste of transportation and (-.197) being the correlation
coefficient of the waste of inventory.
From these findings we can infer that cost of doing business and lead time had the most
significant influence on overall performance of the organization with Karl Product moment
correlation coefficient of - 0.743 and -0.628 respectively. They were followed by waste which
had a correlation coefficient of -0.318 and lastly quality of services which had the least
correlation coefficient of 0.23
4.6 Discussion of Findings
This section looks at findings of the four variables, that is: the influence of operating costs,
wastes, lead time and quality of service influence the performance of organizations. This section
further looks at how these finding are linked to previous literature.
The findings show that though the variables have an influence on organization performance, the
significance varies from variable to another. All this is in line with the findings in the literature
review which indicates that that the main motivation for organizations deciding to implement
Lean six sigma usually boils down to the following: greater predictability of the process; Less
waste and rework which lowers costs; products and services that perform better and last longer
and finally happier customers who value you as a supplier, according to Michael et al (2002)
4.6.1 Quality of Service and Organization Performance
The study established that quality of services influences organization performance to a
small/weak extent. From literature review, quality consists not only of the result, but also of the
50
process (Sureshchander et al., 2002). This is because of the inseparability between production
and consumption of the service. Even if the result is favorable but the process is flawed, the
quality is considered low since quality is meeting customer expectations in service characteristics
(Srikanthan and Dalrymple, 2005).
Research findings in the last decade have started to elaborate on the process by which delivering
high quality goods and services influences profitability through customer satisfaction. Building
from the individual-level model of customer satisfaction proposed by Oliver (1980), several
studies discuss and/or observe a strong link between customer satisfaction and loyalty (Anderson
and Sullivan 1993; Bearden and Teel 1983; Bouding et al. 1993; Fornell 1992; LaBarbera and
Mazursky 1983; Oliver and Swan1989). Reichheld and Sasser (1990) discuss why increasing
customer loyalty should lead to higher profitability. Rust and Zahorik (1993) empirically
demonstrate the relationship between customer satisfaction and profitability for a health care
organization.
It has been long recognized that customer satisfaction is dependent on value (Howard and Sheth
1969; Kotler and Levy 1969), where value can be viewed as the ratio of perceived quality
relative to price or benefits received relative to costs incurred (Dodds, Monroe, and Grewal
1991; Holbrook 1994; Zeithaml 1988). The greater the value the higher the probability of a
repeat customer and the greater the chances of referral. This will in turn affect the bottom line of
the organization which is one of the indicators of measuring an organizations performance.
Fornell (1992) enumerates several key benefits of high customer satisfaction for the firm. In
general, high customer satisfaction should indicate increased loyalty for current customers,
reduced price elasticity, insulation of current customers from competitive efforts, lower costs of
future transactions, reduced failure costs, lower costs of attracting new customers, and an
enhanced reputation for the firm. Increased loyalty of current customers means more customers
will repurchase (be retained) in the future. If a firm has strong customer loyalty, it should be
reflected in the firm's economic returns because it ensures a steady stream of future cash flow
(Reichheld and Sasser 1990).
From the various scholars above it is evident that quality is multifaceted. There is what goes into
production of quality and there is the consumption of quality. The weak positive correlation
51
obtained in this research can thus be justified by the fact that the research considered only one
aspect of quality; consumption.
4.6.2 Cost of Doing Business and Organization Performance
The study established costs as having the strongest association with performance of an
organization. Operating cost concept is conceptualized by Datta & Roy (2013), as the sum of an
organization’s transaction and production costs while financing cost is the total expense
associated with securing financing for a business. From the literature review Kaplan (2009)
argues that for any investor in any market, once costs have been accounted for, very few are able
to outperform the market as now their aggregate return is now less than the markets. He goes on
to say that cost is that necessary evil one cannot do without. However according to him unlike
the markets, costs are largely controllable. One either accepts it or keeps it at manageable levels
or when the costs are excess then they are transferred to other institutions (outsourcing).
From the findings it was evident that increased operational and direct costs had an influence on
organizational performance when considering the surplus/deficit aspect. The relationship
between this two was found to be inverse i.e. All factors remaining constant, an increase in one
in this case cost resulted in decreased surplus at the end of the year. This is supported by Sharabi
and Davidow (2010) who indicate that every coin spent on fixing poor service quality is a cost
that directly lowers profit/surplus by a dollar.
4.6.3 Lead Time and Organization Performance
The third objective was to establish the influence of lead time on organization performance.
According to Schmidt & Aschkenase (2008), time is the single best indicator of competitiveness.
Scott and Thomas (1989), the longer the waiting time and completion time i.e. the time
experienced by a customer waiting for a product or service and the due date or specified time to
complete a task respectively, the more disgruntled the customer becomes. While a satisfied client
shares his feelings with one or two people, a dissatisfied client shares his negative feelings with
nine ten people (Carr and Littman, 1997). Negative publicity threatens to cause serious damage
to an organization. Organizations have spent millions of dollars on a charm offensive mission to
appease disgruntled clients.
52
Lead time affects both surplus and cost. Short lead time is valuable to buyers of a given product
or service because it reduces the time to consumption and realization of cash flows to an
industrial purchaser. From a cost perspective lead time is proportional to work in progress
inventory, it cause the firm to hold finished goods. Short lead time reduces agency costs which
are costs associated with measurement, control and divergence of interest of the managers and
firm (Jensen and Meckling, 1976)
From the research findings there was a strong influence of lead time on performance of the
Kenya Institute of Management. Schmidt and Aschkenase (2008) defined lead time as the
summation of value added, non-value added and business value-added time. Literature according
to Lederer and Seung-Kyu (1996) is of the argument that reducing non- value added time causes
two favorable effects on an organizations profit in this case surplus. First the firms cost is
reduced and lead time to customer is reduced leading to higher sales. This directly increases
profits (in this case surplus). Second, the divergence between marginal costs and average cost
declines: the effect is that the firm makes better production rate decisions, reducing opportunity
costs and increases firm profits.
4.6.4 Waste and Organization Performance
The fourth objective was to establish the influence of waste on the performance of the Kenya
Institute of Management. From the research findings, waste had a weak negative correlation with
organization performance. This is not to say that it does not influence performance. In fact,
various scholars are of the opinion that elimination of waste through the lean six sigma
methodology helps improve organization competitiveness and thus increasing the chances of
superior performance.
Engelund et al (2009) sees lean six sigma as a tool to abolish waste so as to create wealth for
companies. Hanes and Taylor (2000) state that for companies to achieve profitability in the short
run and long term expectations, processes that amount to production of wastes should be reduced
or eliminated. They further explain that defect wastes relates to lack of quality which in turn
demands rework and is not value adding to either the company or their customers and as a result
it should be eliminated.
53
Chen et al, (2010) proposed that eliminating waste enables companies to better understand their
customers and what they need thereby delivering it just how they want it and when they want it.
They mentioned that identifying the specific production waste and successfully eliminating them
transcend to reduce cost of manufacturing, higher product quality, improved customer
satisfaction, and increased profits.
4.6.5 Organization Performance
The study established that lean six sigma influences organizational performance for the better.
These findings agree with Michael et al (2002) argument that following lean six sigma concept
and using its accompanying methods helps an organization: have a measurable way of tracking
performance improvement; focus its attention on process management at all organization levels;
improve their customer relationship by addressing defects and finally improve efficiency and
effectiveness of their process by aligning them with their customers’ needs.
The above argument is further supported by Harry and Schroeder (2009) that conducting
measurable tracking keeps an organization informed about what changes are working and which
ones are not. This can speed up significant improvement. Having a process focus lets you define
defects and calculate sigma levels. Aligning a process with one’s customer needs can result in
greater customer loyalty and retention. Also by being in touch with one’s customers and their
needs, one can more easily develop new ideas for improvement and enhancement to ones
products and services.
It did not escape the researcher’s eye that there are mechanisms by which performance in one
time period is affected positively by performance in previous periods. Many of the cognitive and
affective factors that seem likely to influence performance e.g. investors, customer and worker
confidence in the organization are themselves likely to be influenced by prior performance. Good
performance rankings lead both to self-assurance and to being treated favorably by others.
Unfortunately the vice versa is true for poor performance. Equally executives strongly influence
organization performance because they make strategic decisions (viz., upper echelon theory;
Hambrick & Mason, 1984).
54
CHAPTER FIVE
SUMMARY OF FINDINGS, CONCLUSIONS AND RECOMMENDATIONS
5.1 Introduction
This chapter presents the discussion of key data findings, conclusions drawn from the findings
highlighted and recommendations made. The conclusions and recommendations drawn were
focused on addressing the objectives of the study.
5.2 Summary of Findings
The study sought to examine the influence of Lean Six Sigma on the performance of
organizations. From the findings it can generally be said that the four objectives had an influence
on organization performance albeit others were strong and others were weak and thus the main
reason for implementation of lean six sigma in an organization is not cost cutting as most have
been made to think but for process improvement with cost savings, customer satisfaction and
maintaining a competitive edge as some of the rewards reaped.
The overall findings generally indicate that costs and specifically operational costs and direct
costs highly influence the performance of an organization. This is confirmed with the Karl
Pearson’s Product Moment correlation of - 0.743 which indicates a strong negative association
between costs and organization performance. The higher the costs (operating, direct and
financing) the lower the organization performance as these extra costs eat into the profits/surplus
of the organization. Cost savings are bound to be the biggest rewards of an organization that
systematically and consistently applies the Lean Six Sigma methodology in their day to day
activities. Primarily, these costs savings are realized due to having a measurable way of tracking
performance improvement and focusing attention on addressing defects thus reducing reworks,
and finally improving efficiency and effectiveness of processes. The study established that
operation costs, direct and finance costs (with means of 3.862, 3.573, and 3.000 respectively),
greatly influence organization performance. These are the components that an organization
would endeavour to control in order to reduce its overall costs Vis a Vis its profits or surplus.
The study also established that quality of service with a correlation coefficient of 0.227 slightly
influenced the performance of an organization. The study established that quality is
multidimensional .This is because of the inseparability between production and consumption of
55
the service. Delivering high quality goods and services influences profitability through customer
satisfaction and as such organizations should strive to give superior customer experience
resulting into satisfied customers who in turn translate to a wider customer base, more referrals,
more sales and definitely improved profits/surplus.
The study established that availability of wastes with a correlation coefficient of -0.318
moderately influenced organization performance. An increase in waste reduces performance. The
study established that when the processes of an organization are full of wastes the probability of
reworks and not delivering on time according to customers demand are inevitable. Lean six
sigma is thus a tool that can be adopted by various organizations who want to eliminate wastes in
their processes, improve efficiency and effectiveness and in turn create wealth for the
organization
The study found out that lead time with a correlation coefficient of 0.628 also had a significant
influence on an organization performance. The longer the time one has to be in an organization
to receive a service the lesser the confidence they have in the organization. Organizations need
to react rapidly to customer requirements more so because customers’ needs keep evolving and
their tastes and preferences keep changing. The time taken from when a customer contacts an
organization for a product or service to when it is delivered should be as short as possible. This is
seen as delivering at the demand of the customer and organizations which are capable of this
have a competitive edge above the rest.
5.3 Conclusion of the Study
The aim of this study was to determine the influence of Lean Six Sigma methodology on the
performance of an organization. The objectives were: To determine how quality of goods and
services influence performance; to establish the influence of costs on performance; to determine
how lead time influences performance; to examine how wastes influences the performance of the
Kenya Institute of Management. The results of this study indicate that the Lean Six Sigma
methodology has a positive influence on the performance of an organization. This study has
established that specifically the Lean Six Sigma methodology influences process improvement
within the organization.
56
All factors remaining constant, with process improvement comes efficiency in the operational
execution of business processes. This in turn has enabled organizations meet new opportunities
thus generating business benefits and competitive advantage. The study has established that the
use of the methodology has had a positive impact on various processes in the Kenya Institute of
Management. The organization was able to consolidate some of its operations which were
scattered within Nairobi as noted in the problem statement (1.2).This involved incorporating; the
Westland’s office with the head office based at Lutheran plaza and development house
operations with emperor plaza This in turn helped lower the rental costs by close to Kshs 10
million annually. The waste of transportation was also addressed as there was no movement of
people and taxis shuttling between head office and Westland’s to have documents approved or to
attend meetings. The waste of inventory was also addressed. The holding area for stationery,
promotional materials and other items needed to run the Westland office was consolidated with
the central store at the head office.
5.4 Recommendations for Policy and Practice
Selection of a process improvement methodology is dependent on the culture of the organization.
If many popular programs appear to end up in the same place addressing the same issues after a
number of years of use, the main issue left to explore is the speed at which a method will be
accepted into an organization. Lean Six sigma is just one of the many process improvement
methodologies. It is viewed as a valuable approach in the portfolio of management improvement
program that can be undertaken by organization executives. Once the values of a specific
improvement program are identified, the comparison of those values with the ones of the
organization can make selection of an improvement program easier. For an organization that
value analytical studies, the relationships of data, charts and analysis, Six Sigma is a perfect
program for you to start with. If on the other hand the organization values visual and immediate
change, then lean thinking might be the way to go. Based on the results that have been yielded at
the Kenya Institute of Management and other places like the banking sector -National bank of
Kenya, Kenya Commercial Bank just to mention but a few, a combination of the two yields
superior results.
57
The relative importance of organizational processes cannot be overlooked when making the
decision to implement lean six sigma. Organizations must put in place process performance
measurement systems in place in order to be able to evaluate and manage the overall
organization performance effectively. It is virtually impossible for an organization to know how
its performing if it cannot develop clear and measurable; quality determinants to estimate how
satisfied its customers are, service turnover times i.e. from the customer and back to the customer
and at the same time monitor its costs to ensure that they do not outstrip the benefits of the
services to the clients.
5.5 Suggested Areas for Further Research
1. Future studies on the influence of Lean Six Sigma Methodology on the performance of
Organizations could be conducted on other service sector organizations other than the
education one e.g. Hospitals, Banks, Retail chain stores. Results from such a study would be
essential in testing the validity of this study’s findings in a number of settings so that
additional insights into influence of lean six sigma and performance of organizations might
be generated.
2. There is equally room for other researches to “evaluate the impact of Lean Six Sigma on the
organization culture.
58
REFERENCES
Adam, Everett E., James C. Hershauer and William A. Ruch (1981), Productivity and Quality:
Measurement as a Basis for Improvement, Englewood Cliffs, N.J.: Prentice Hall
Andrew, P. (2013), “Improving Processes for Good in East Africa” The TQM Journal 29 August
2013, Vol. 25, No. 5, pp. 458-472
Antony, J. (2010a), “Six sigma in the UK Service Organizations: results from a pilot survey”,
Managerial Auditing Journal, Vol. 19 No. 8, pp. 1006-13.
Antony, J. (2010b), “Some pros and cons of six sigma: an academic perspective”, The TQM
Magazine, Vol. 16 No. 4, pp. 303-6.
Antony, J. and Coronado, R.B. (2012), “Design for six sigma”, IEE Manufacturing Engineer,
February, pp. 24-6.
Basu, R. (2008), Implementing Quality: A Practical Guide to Tools and Techniques: Enabling
the Power of Operational Excellence, Thomson Learning, and London.
Benedetto, A.R. (2009), “Adapting manufacturing-based six sigma methodology to the service
Environment of a radiology film library”, Journal of Healthcare Management, Vol. 48
No. 4, pp. 263-80.
Biolos, J. (2012), “Six sigma meets service economy”, Harvard Management Update, November,
pp. 3-5.
Bolze, S. (2010), “A six sigma approach to competitiveness”, Transmission and Distribution
World, August, available at: http://tdworld.com/mag/power_six_sigma_approach/
Bott, C., Keim, E., Kim, S. and Palser, L. (2010), “Service quality six sigma case studies”,
ASQ’s 54th Annual Quality Congress Proceedings, pp. 225-31.
Carleysmith, S. (2009), "Implementing Lean Sigma in pharmaceutical research and
development: a review by practitioners", R&D Management, Vol. 39 No.1, pp.95-106.
Carr, K.D. and Littman, D.I. (1997), Excellence in Government, Coopers and Lybrand,
Arlington, VA.
59
Catherwood, P. (2012), “What’s different about six sigma” IEE Manufacturing Engineer,
August, pp. 186-9.
Caulcutt, R. (2011), “Why is six sigma so successful?” Journal of Applied Statistics, Vol. 28
No. 3 and 4, pp. 301-6.
Chakravorty, Satya S. (2009), “Six Sigma Programs. An implementation model” International
Journal of Production Economics, 119, 1-16
Cheng, C.Y. and Chang, P.Y. (2012), “Implementation of the lean Six Sigma framework in
Non-profit organizations: a case study”, Total Quality Management and Business
Excellence, Vol. 23 Nos 3/4, pp. 431-447.
Chinua Achebe (1959), “Things fall apart”, the second coming, pp. 18 of 158.
Coronado, R.B. and Antony, J. (2012), “Critical success factors for the successful
implementation of six sigma projects in organizations”, The TQM Magazine, Vol. 14 No.
2, pp. 92-9.
Dahlgaard-Park, S.M. (2011), “The quality movement: where are you going?” Total Quality
Management and Business Excellence, Vol. 22 No. 5, pp. 493-516.
Davenport, Thomas & Short, J. (1990), “The New Industrial Engineering: Information
Technology and Business Process Redesign”, in: Sloan Management Review, summer
1990, pp 11-27
De Koning, H., Verver, J.P.S., van den Heuvel, J., Bisgaard, S., Does, R.J.M.M. (2006), "Lean
Six Sigma in healthcare", Journal of Healthcare Quality, Vol. 28 No.2, pp.4-11.
Delgado, C., Ferreira, M., Branco, C.M. (2010), "The implementation of Lean Six Sigma in
financial services organizations", Journal of Manufacturing Technology Management,
Vol. 21 No.4, pp.512-23.
Deming, W.E. (2000), Out of the Crisis, MIT Center for Advanced Engineering Study,
Cambridge, MA.
Does, R., Heuvel, E., Mast, J. and Bisgaard, S. (2013), “Comparing non-manufacturing with
Traditional applications of six sigma”, Quality Engineering, Vol. 15 No. 1, pp. 177
Eckes, G. (2009), “Managing six sigma last (and work)”, Ivey Business Journal
November/December, pp. 1-5, available at: www.iveybusinessjournal.com/archives/
60
El-Haik, B. and Roy, D.M. (2009), “Service Design for Six Sigma: A Roadmap for Excellence”,
John Wiley& Sons, Hoboken, NJ.
Engelund, E., Breum, G., and Friis, A., (2009). Optimisation of large-scale food production
using Lean Manufacturing principles. Journal of Foodservice, Vol 20, Issue 1, p 4-14
285-300
Emiliani, M. L. (2008), “Better Thinking, Better Results. Center for Lean Management”,
Estelami, H. (2000), “Competitive and procedural determinants of delight and disappointment in
consumer complaint outcomes”, Journal of Service Research, Vol. 2 No. 3, pp.
Fomell, Claes (1992), "A National Customer Satisfaction Barometer: The
Swedish Experience," Journal of Marketing, 55 (January), 121
Furterer, S. and Elshennawy, A.K. (2005), “Implementation of TQM and lean six sigma tools in
local government: a framework and a case study”, Total Quality Management, Vol. 16
No. 10, pp. 1179-91.
George, M.L., Lean Six Sigma for Service 2003: McGraw-Hill. p. 381.
Goodman, J. (1999), “Basic facts on customer complaint behavior and the impact of service on
the bottom line”, Competitive Advantage, June, pp. 1-5.
Grainer, M. (2003), Customer Care – The Multibillion Dollar Sinkhole: A Case of Customer
Rage Unassuaged, Customer Care Measurement and Consulting, Alexandria, VA.
Ghobadian, A., Speller, S. and Jones, M. (2008), “Service quality: concepts and models”,
International Journal of Quality & Reliability Management, Vol. 11 No. 9, pp. 43-66.
Goel, S.P., Gupta, P., Jain, R. and Tyagi, R.K. (2010), Six Sigma for Transactions and
Service, McGraw-Hill, New York, NY.
Goh, T.N. (2012), “A strategic assessment of six sigma”, Quality Reliability Engineering
International, Vol. 18 No. 5, pp. 403-10.
Gupta, P. (2010), “Six sigma and service operations”, Technology Company and Circuits
Assembly, (A magazine from UP Media Group), available at: www.accelper.com/pdfs/
SS_Service_Operations.pdf
61
Hahn, G.J., Hill, W.J., Hoerl, R.W. and Zinkgraf, S.A. (2009), “The impact of six sigma
improvement – a glimpse into the future of statistics”, The American Statistician, Vol. 53
No. 3, pp. 208-15.
Harbert, S.T. (2006), "Lean, Mean Six Sigma machines", Design News, Vol. 61 No.18, pp.64-8
Harrison-Walker, L.J. (2001), “E-complaining: a content analysis of an internet complaint
forum”, Journal of Services Marketing, Vol. 15 No. 5, pp. 397-412.
Harry, M. J., & Schroeder, R. R. (2000). Six Sigma The Breakthrough Management Strategy
Revolutionizing the World's Top Corporates. Currency Press.
Harry, M.J. and Schroeder, R. (2009), Six Sigma: The Breakthrough Management Strategy
Revolutionizing the World’s Top Corporations, Doubleday, New York
Henderson, K.H. and Evans, J.R. (2010), “Successful implementation of six sigma:
benchmarking General Electric company”, Benchmarking: An International Journal, Vol.
7 No. 4, pp. 260-81.
Hensley, R.L. and Dobie, K. (2005), “Assessing readiness for six sigma in a service setting”,
Managing Service Quality, Vol. 15 No. 1, pp. 82-101.
Hensley, R.L. and Dobie, K. (2010), “Assessing readiness for six sigma in a service setting”,
Managing Service Quality, Vol. 15 No. 1, pp. 82-101.
IBM Institute for Business Value (2010). Driving Operational Innovation Using Lean Six Sigma,
January
Israel, G.D. (1992). Determining Sample Size. University of Florida IFAS extension.
Johnson, A. and Swisher, B. (2013), “How six sigma improves R&D”, Research Technology
Management, March-April, pp. 12-15.
Johnstone, P.A.S., Hendrickson, J.A.W., Dernbach, A.J., Secord, A.R., Parker, J.C., Favata,
M.A.and Puckett, M.L. (2011), “Ancillary services in the health care industry: is six
sigma reasonable?”, Quality Management in Health Care, Vol. 12 No. 1, pp. 53-63.
Karlsson, C. and Åhlström, P, (1996) “Assessing changes towards lean production”
International Journal of Operations & Production Management, Vol. 16 No. 2, p. 24-41.
62
Kippenberger, A., (1997). Apply lean thinking to a value stream to create a lean enterprise,
Journal of the Antitode, Vol 2, Issue 5, p 11-14
Kirkby, J., Thompson, E. and Wecksell, J. (2001), Customer Experience: The Voice of the
Customer, Research Note No.TG-14-9567, Gartner, Stamford, CT.
Krupar, J. (2011), “Yes, six sigma can work for financial institutions”, ABA Banking Journal,
September, pp. 93-4.
Kwak, Y.H. and Anbari, F.T. (2010), “Benefits, obstacles and future of six sigma approach”,
Technovation, Vol. 26, pp. 708-15.
Kubiak, T., & Benbow, D. (2009), The Certified Six Sigma Black Belt Handbook 2nd Edition.
Quality Press.
Lazarus, I.R. and Butler, K. (2011), “The promise of six sigma – part one”, Managed Healthcare
Executive, Vol. 11 No. 9, pp. 22-6.
Lee, D.J., Cassano-Pinche, A. and Vicente, K.J. (2008), “Bibliometric analysis of human factors
(1970-2000): a quantitative description of scientific impact”, Human Factors, Vol. 47 No.
4, pp. 753-66.
Lobo, R.S., Matawie, M.K. and Samaranayake, P. (2012), “Assessment and improvement of
quality management capabilities for manufacturing industries in Australia”, Total Quality
Management and Business Excellence, Vol. 23 No. 1, pp. 103-121.
Lowenthal, J.N. (1994), “Reengineering the organization: a step-by-step approach to corporate
Revitalization”, Quality Progress, Vol. 27 No. 2, pp. 61-3.
Maleyeff, John. “Exploration of Internal Service Systems Using Lean Principles.” Management
Decision 44-5 (2006), pp. 674–689.
Manganelli, R.L. and Klein, M.M. (1994), The Reengineering Handbook: A Step-by-Step
Guide to Business Transformation, AMACOM, New York, NY.
Manz, C.C. (2011), “The illusion of self-management: using teams to disempower”, in Manz,
C.C. and Sims, H.P. (Eds), Business without Bosses: How Self-managing Teams Are
Building High-performing Companies, John Wiley & Sons, New York, NY, pp. 115-130.
63
Martin, A.O. and Palmer, A. (2004), “Importance-performance analysis: a useful tool for
directing continuous quality improvement in higher education”, Quality Assurance in
Education, Vol. 12 No. 1, pp. 39-52.
Mathieu, J., Maynard, T., Rapp, T. and Gilson, L. (2008), “Team effectiveness 1997-2007: a
review of recent advancements and a glimpse into the future”, Journal of Management,
Vol. 34 No. 3, pp. 410-476.
McPartlin, J.P. (1992), “Seeing eye to eye on reengineering”, Information week, June 15, p. 74.
Mizikaci, F. (2006), “A systems approach to program evaluation model for quality in higher
education”, Quality Assurance in Education, Vol. 14 No. 1, pp. 37-53.
Moosa, K., & Sajid, A. (2010). Critical analysis of six sigma implementation. Total Quality
Management & Business Excellence, 21(7), 745-759. oi:10.1080/14783363.2010.483100
Nachmias Chave Frankfort (1996), Research methods in social sciences, fifth edition: Hodder
Arnold, page 129.
Nonthaleerak, P. and Hendry, L. (2008), “Six sigma: literature review and key future research
areas”, LUMS Working Paper Series, June, pp. 1-66.
Ohno, T. (1988). Toyota Production System: Beyond Large Scale Production. Productivity Press.
Piercy, N. and N. Rich, Lean transformation in the pure service environment: The
case of the call service center. International Journal of Operations & Production
Management, 2009. 29(1): p. 54-76.
Raisinghani, M.S. (2010), “Six sigma: concepts, tools and applications”, Industrial
Management & Data Systems, Vol. 105 No. 4, pp. 491-505.
Reichheld, Fredrick F. and W. Earl Sasser (1990), "Zero Defections: Quality Comes to
Services," Harvard Business Review, 68 (September/October), 105-11.
Rother, M., Shook, J. (2003), Learning to see. Value stream mapping to create value and
eliminate MUDA, The lean enterprise institute, USA
R.P.Mohanty, & R.R.Lakhe. (2002). TQM in the Service Sector. Mumbai: Jaico Publishing
House.
64
Rust, R. T., Moorman, C., & Dickson, P. R. (2002, October). Getting Return on Quality:
Revenue Expansion, Cost Reduction or both? Journal of Marketing, 7-24.
Rucker, R. (2010), “Citibank increases customer loyalty with defect-free processes”, The Journal
for Quality and Participation, Vol. 23, Fall, pp. 32-6.
Schmidt, M. and Aschkenase, S. (2008), “The building blocks of service”, Supply Chain
Management Review, July-August, pp. 34-40.
Schneider, B. and Bowen, D. (1995), Winning the Service Game, Harvard Business School
Press, Boston, MA.
Seth, N., Deshmukh, S.G. and Vrat, P. (2005), “Service quality models: a review”, International
Journal of Quality & Reliability Management, Vol. 22 No. 9, pp. 913-949.
Sharabi, M. (2010), “HR manager leadership in quality improvement in a college environment”,
Quality Assurance in Education, Vol. 18 No. 4, pp. 317-327.
Sharabi, M. and Davidow, M. (2010), “Service quality implementation: problems and solutions”,
International Journal of Quality and Service Sciences, Vol. 2 No. 2, pp. 189-205.
Shukla, A., Srinivasan, R. (2007), "Six Sigma implementation at Bharti Infotel", Asian Case
Research Journal, Vol. 11 No.2, pp.367-84.
Smith, G., Smith, A. and Clarke, A. (2007), “Evaluating service quality in universities: a service
department perspective”, Quality Assurance in Education, Vol. 15 No. 3, pp. 334-351.
Smith, H. & Fingar, P. 2007. Business process management: The third wave. Meghan-
Kiffer Press.
Srikanthan, G. and Dalrymple, J. (2005), “Implementation of a holistic model for quality in
Higher education”, Quality in Higher Education, Vol. 11 No. 1, pp. 69-81.
Stamatis, D.H. (2011a), “Guidelines for six sigma design reviews – part one”, Quality Digest,
April, pp. 27-33, available at: www.qualitydigest.com/past2002.shtml.
Sureshchander, G.S., Rajendran, C. and Anatharaman, R.N. (2002), “The relationship between
Service quality and customer satisfaction: a factor specific approach”, Journal of Services
Marketing, Vol. 16 No. 4, pp. 363-379
Swartwood, D. (2012). Using Lean, Six Sigma, and Score To Improve Competitiveness,
Pragmatek Consulting Group, Retrieved from http://www.bptrends.com/publicationfiles
65
Stamatis, D.H. (2011b), “Guidelines for six sigma design reviews – part two”, Quality Digest,
May, pp. 48-54, available at: www.qualitydigest.com/past2002.
Tague, N.R. (2011), The Quality Toolbox, ASQC Quality Press, Milwaukee, WI.
Tanninena, K., Puumalainenb, K. and Sandstro¨ mb, J. (2010), “The power of TQM: analysis of
its effects on profitability, productivity and customer satisfaction”
Truscott, W. (2008). Six Sigma: Continual Improvement for Business. Butterworth Heinemann,
England
United Nations (2005).Designing Household Survey Samples: Practical Guidelines. Department
of Economic and Social Affairs, Statistics Division. pg. 38
Van Kemenade, E., Pupius, M. and Hardjono, T. (2008), “More value to defining quality”,
Quality in Higher Education, Vol. 14 No. 2, pp. 175-185.
Womack, James P., and Daniel T. Jones. (2010).Lean Solutions. Simon & Schuster,
Womack, James P., and Daniel T. Jones. (2009).Lean thinking (2nd Edition). Free Press,
Womack, James P., Daniel T. Jones, and Daniel Roos (2011). The Machine That Changed the
World. HarperCollins Publishers.
Woodard, D.T. (2009), “Addressing variation in hospital quality: is six sigma the answer?”,
Journal of Healthcare Management, Vol. 50 No. 4, pp. 226-36.
Woodall, T. (2001), “Six sigma and service quality: Christian Gro¨nroos revisited”, Journal of
Marketing Management, Vol. 17 Nos 5-6, pp. 595-607.
Wyper, B. and Harrison, A. (2008), “Deployment of six sigma methodology in human resource
function: a case study”, Total Quality Management, Vol. 11 No. 4 and 5, pp. S720-7.
Young, T., Brailsford, S., Connell, C., Davies, R., Harper, P. and Klein, J.H. (2012), “Using
industrial processes to improve patient care”, British Medical Journal, Vol. 328, January
17,pp. 162-4
Zelnik, M., Maleticˇ, M., Maleticˇ, D. and Gomisˇcˇek, B. (2012), “Quality management systems
as a link between management and employees”, Total Quality Management and Business
Excellence, Vol. 23 No. 1, pp. 45-62.

66
APPENDICES
APPENDIX I: LETTER OF TRANSMITTAL OF DATA COLLECTION INSTRUMENT
Shiela Oguda
University of Nairobi,
P.O. Box 30197-00100, GPO, Nairobi
30 September 2014
Dear Respondent,
RE: REQUEST FOR YOUR PARTICIPATION IN MY RESEARCH STUDY
My name is Sheila Oguda, a student from the University of Nairobi carrying out a survey entitled
“The influence of Lean Six Sigma Methodology on performance of Organizations: A Case of
Kenya Institute of Management”. This in in partial fulfillment for the requirement for the award
of degree of masters of Arts in project planning and management. It is in this regard that I am
humbly requesting for your participation in filing this questionnaire. Kindly give answers to the
best of your knowledge. Any information collected will be treated with confidentiality and only
used for academic purposes. Thank you in advance.
Yours Faithfully,
SHEILA OGUDA.
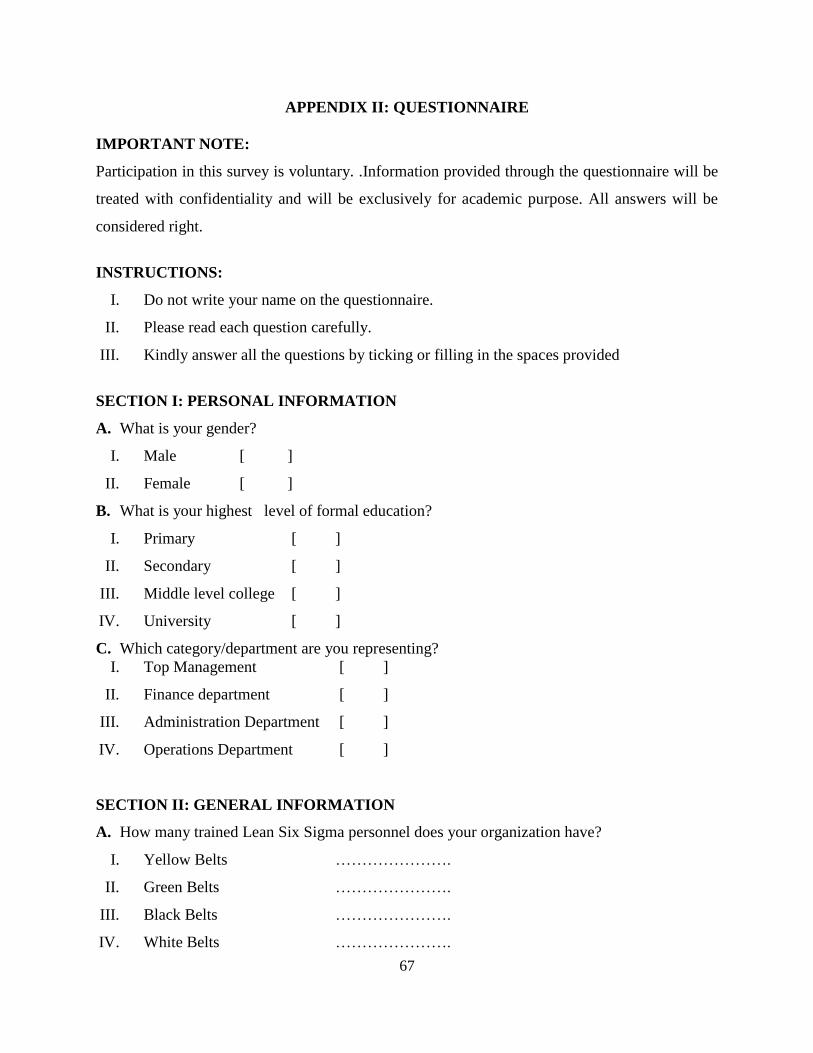
67
APPENDIX II: QUESTIONNAIRE
IMPORTANT NOTE:
Participation in this survey is voluntary. .Information provided through the questionnaire will be
treated with confidentiality and will be exclusively for academic purpose. All answers will be
considered right.
INSTRUCTIONS:
I. Do not write your name on the questionnaire.
II. Please read each question carefully.
III. Kindly answer all the questions by ticking or filling in the spaces provided
SECTION I: PERSONAL INFORMATION
A. What is your gender?
I. Male [ ]
II. Female [ ]
B. What is your highest level of formal education?
I. Primary [ ]
II. Secondary [ ]
III. Middle level college [ ]
IV. University [ ]
C. Which category/department are you representing?
I. Top Management [ ]
II. Finance department [ ]
III. Administration Department [ ]
IV. Operations Department [ ]
SECTION II: GENERAL INFORMATION
A. How many trained Lean Six Sigma personnel does your organization have?
I. Yellow Belts ………………….
II. Green Belts ………………….
III. Black Belts ………………….
IV. White Belts ………………….
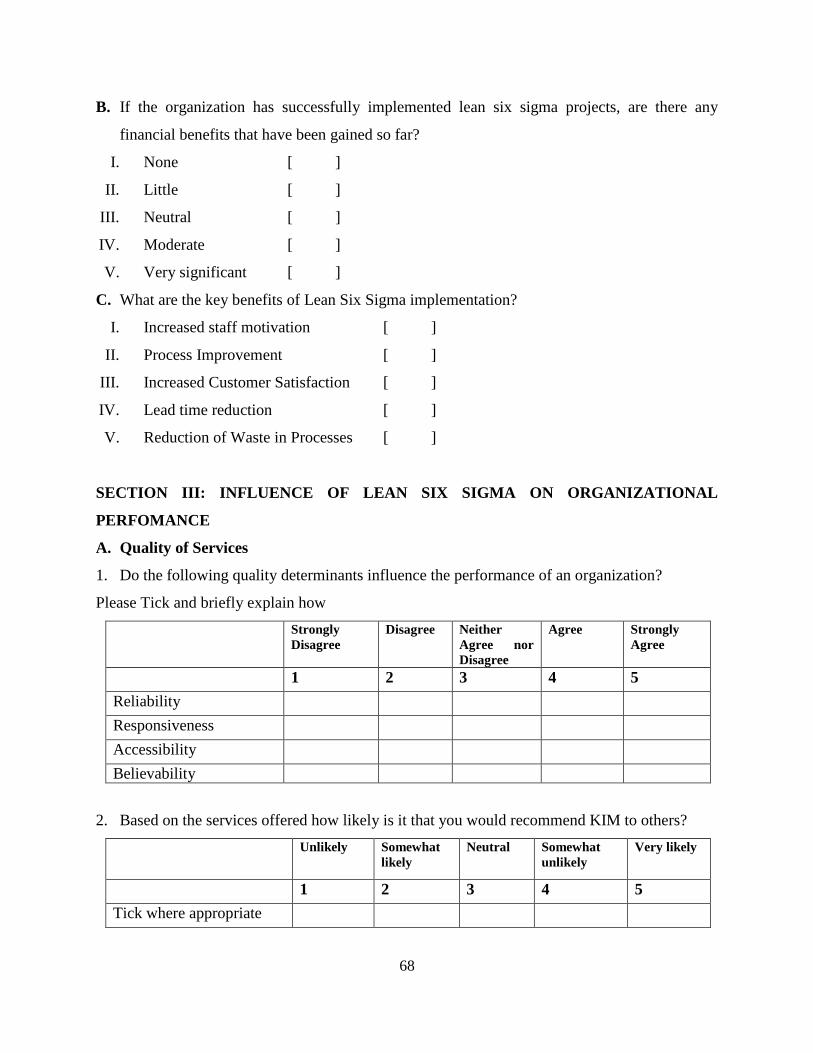
68
B. If the organization has successfully implemented lean six sigma projects, are there any
financial benefits that have been gained so far?
I. None [ ]
II. Little [ ]
III. Neutral [ ]
IV. Moderate [ ]
V. Very significant [ ]
C. What are the key benefits of Lean Six Sigma implementation?
I. Increased staff motivation [ ]
II. Process Improvement [ ]
III. Increased Customer Satisfaction [ ]
IV. Lead time reduction [ ]
V. Reduction of Waste in Processes [ ]
SECTION III: INFLUENCE OF LEAN SIX SIGMA ON ORGANIZATIONAL
PERFOMANCE
A. Quality of Services
1. Do the following quality determinants influence the performance of an organization?
Please Tick and briefly explain how
Strongly
Disagree
Disagree Neither
Agree nor
Disagree
Agree Strongly
Agree
1 2 3 4 5
Reliability
Responsiveness
Accessibility
Believability
2. Based on the services offered how likely is it that you would recommend KIM to others?
Unlikely Somewhat
likely
Neutral Somewhat
unlikely
Very likely
1 2 3 4 5
Tick where appropriate
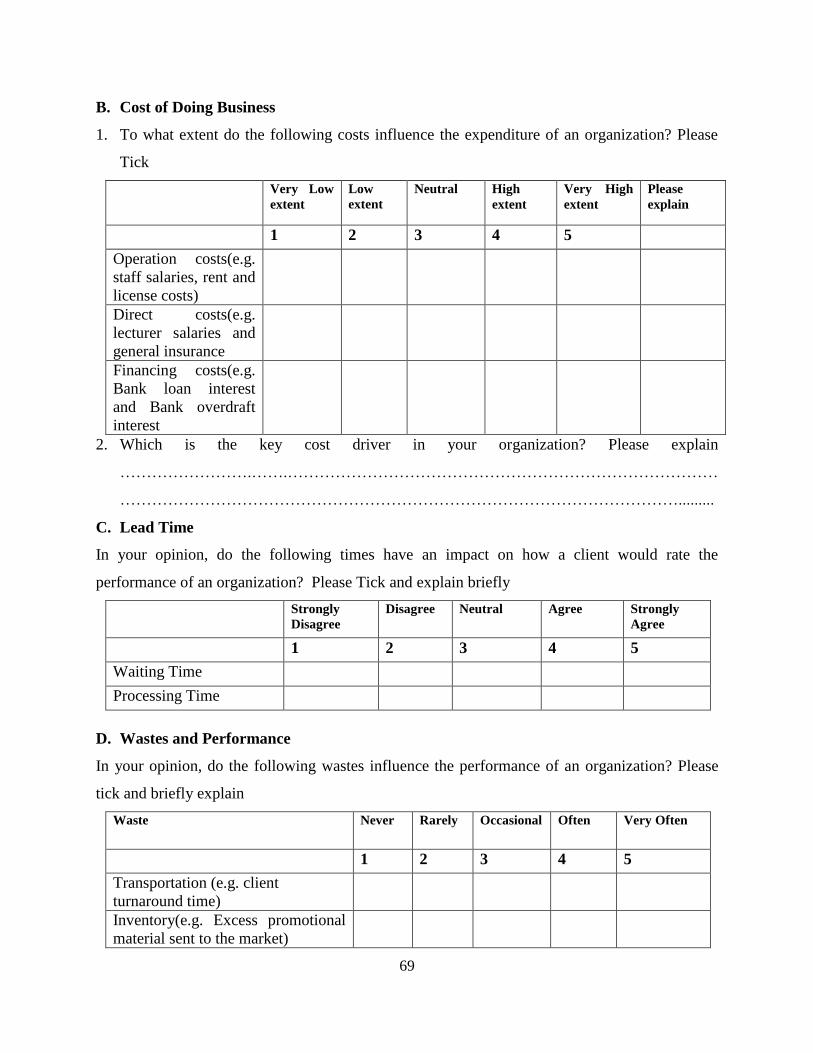
69
B. Cost of Doing Business
1. To what extent do the following costs influence the expenditure of an organization? Please
Tick
Very Low
extent
Low
extent
Neutral High
extent
Very High
extent
Please
explain
1 2 3 4 5
Operation costs(e.g.
staff salaries, rent and
license costs)
Direct costs(e.g.
lecturer salaries and
general insurance
Financing costs(e.g.
Bank loan interest
and Bank overdraft
interest
2. Which is the key cost driver in your organization? Please explain
…………………….…….………………………………………………………………………
…………………………………………………………………………………………….........
C. Lead Time
In your opinion, do the following times have an impact on how a client would rate the
performance of an organization? Please Tick and explain briefly
Strongly
Disagree
Disagree Neutral Agree Strongly
Agree
1 2 3 4 5
Waiting Time
Processing Time
D. Wastes and Performance
In your opinion, do the following wastes influence the performance of an organization? Please
tick and briefly explain
Waste Never Rarely Occasional Often Very Often
1 2 3 4 5
Transportation (e.g. client
turnaround time)
Inventory(e.g. Excess promotional
material sent to the market)
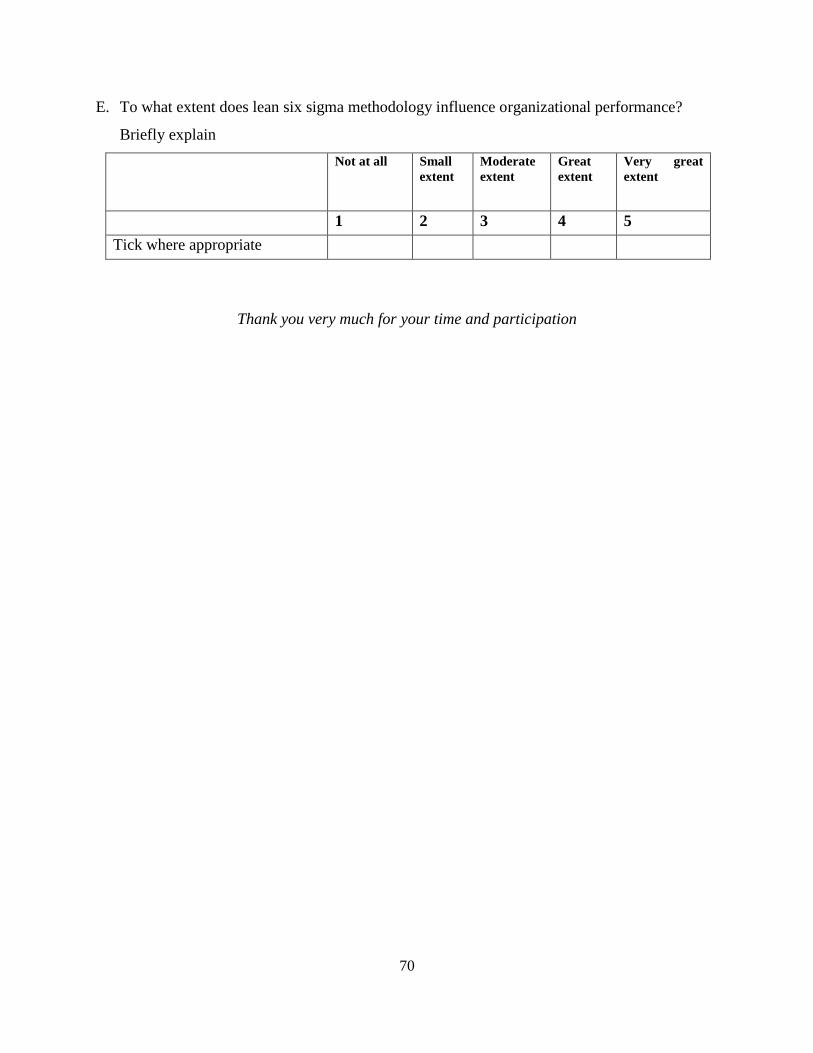
70
E. To what extent does lean six sigma methodology influence organizational performance?
Briefly explain
Not at all Small
extent
Moderate
extent
Great
extent
Very great
extent
1 2 3 4 5
Tick where appropriate
Thank you very much for your time and participation
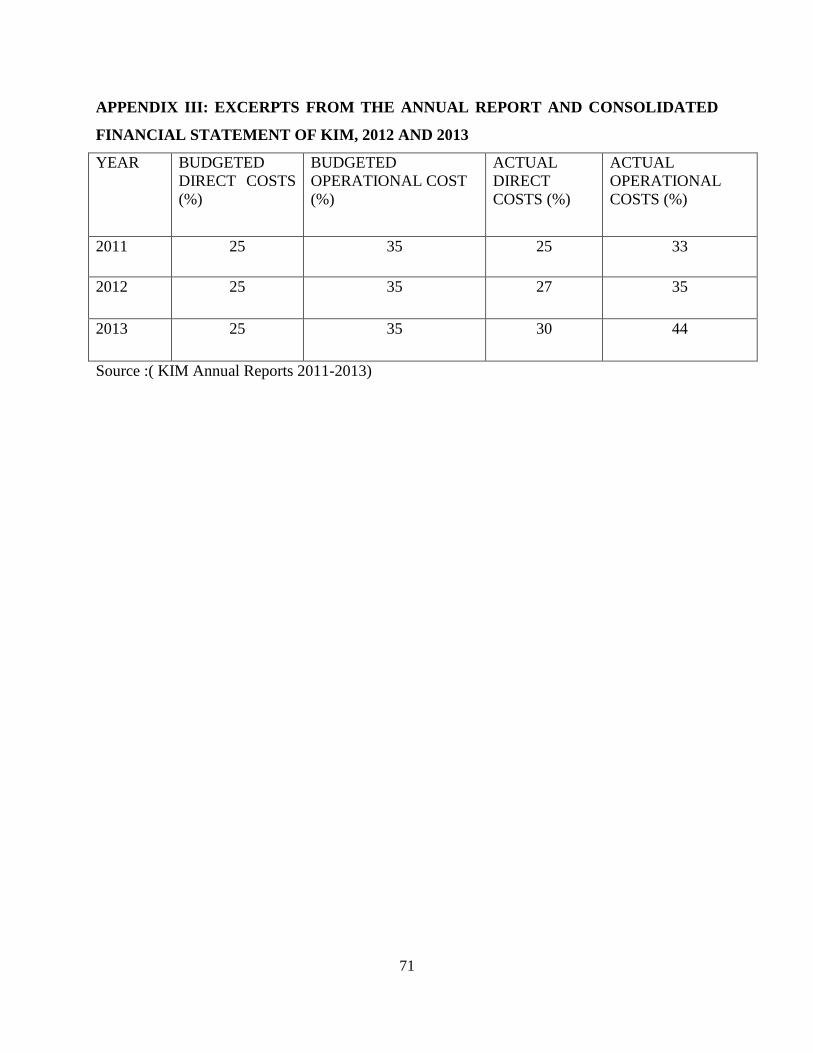
71
APPENDIX III: EXCERPTS FROM THE ANNUAL REPORT AND CONSOLIDATED
FINANCIAL STATEMENT OF KIM, 2012 AND 2013
YEAR BUDGETED
DIRECT COSTS
(%)
BUDGETED
OPERATIONAL COST
(%)
ACTUAL
DIRECT
COSTS (%)
ACTUAL
OPERATIONAL
COSTS (%)
2011 25 35 25 33
2012 25 35 27 35
2013 25 35 30 44
Source :( KIM Annual Reports 2011-2013)