influence of information product quality on informing … · influence of information product...
TRANSCRIPT

Informing Science: the International Journal of an Emerging Transdiscipline Volume 19, 2016 Cite as: Nam, J. (2016). Influence of information product quality on informing users: A web portal context. Informing Science: the International Journal of an Emerging Transdiscipline, 19, 381-409. Retrieved from http://www.informingscience.org/Publications/3570
Editor: Raafat Saadé Submitted: July 3, 2016; Revised: September 23, September 24, 2016; Accepted: September 26, 2016
Influence of Information Product Quality on Informing Users: A Web Portal Context
Junghyun Nam Ulsan National Institute of Science and Technology (UNIST),
Ulsan, South Korea
Abstract Web portals have been used as information products to deliver personalized, feature-rich, and flexible information needs to Internet users. However, all portals are not equal. Most of them have relatively a small number of visitors, while a few capture the majority of surfers. This study seeks to uncover the factors that contribute the perceived quality of a general portal. Based on 21 factors derived from an extensive literature review on Information Product Quality (IPQ), web usage, and media use, an experimental study was conducted to identify the factors that are per-ceived by web portal users as most relevant. The literature categorizes quality factors of an in-formation product in three dimensions: information, physical, and service. This experiment sug-gests a different clustering of factors: Content relevancy, Communication interactiveness, Infor-mation currency, and Instant gratification. The findings in this study will help developers find a more customer-oriented approach to developing high-traffic portals.
Keywords: web portal, web portal quality, information quality, information product quality, per-ceived quality; intention to use
Introduction An Information Product can be defined as a highly interdependent package of information that can be digitalized and can be transmitted and distributed in digital form (Fielding et al., 1998; Shapiro & Varian, 1998). Web portals are one of the commonly used Information Products now-adays and an example of the delivery mechanisms in the informing science framework (Cohen, 1999). People often set up a web portal as the first page of their web browser, a single access point to search, retrieve, and disseminate information (Marck, Raving, & Byrd, 2001). This re-sults in the use of web portals for a considerable amount of time every day.
To enhance the quality of website design, many developers refer to the templates proposed by software vendors. Most of the design principles were derived from the well-tested UML-based Graphical User Interfaces design principles and the increasing use of flash and related technologies. However, due to the necessity of using the portals as a gateway for collecting data that could be ex-ploited for marketing and marketing research pur-poses, the design of the portals has recently been more directed toward the needs of the businesses rather than focusing on the desires of the surfers or customers. Google.com has recently issued some
(CC BY-NC 4.0) This article is licensed to you under a Creative Commons Attribution-NonCommercial 4.0 International License. When you copy and redistribute this paper in full or in part, you need to provide proper attribution to it to ensure that others can later locate this work (and to ensure that others do not accuse you of plagiarism). You may (and we encourage you to) adapt, remix, transform, and build upon the mate-rial for any non-commercial purposes. This li-cense does not permit you to use this material for commercial purposes.

Influence of Information Product Quality on Informing users
382
quality guidelines to remind developers to “make pages primarily for users, not for search en-gines” since there is an increasing trend to deceive surfers or present different content to improve search engine rankings (“Webmaster guidelines”, 2009).
In contrast, there remains little research as to what would attract users to a portal, as a particular Information Product (Meisel & Sullivan, 2000). Since many people spend a significant of their time on the use of web portals every day, it becomes important to investigate how people to use web portals and perceive their quality. In this research, information product quality is examined to see if it can be the key determinant of web portal use.
Considering the quality of web portals, the content of web portals themselves is not the only thing of importance. The form in which web portals are presented is also very important, as well as the services they offer. Every information product has three components in it: informational, physi-cal, and service components (Alter, 2002). In this study, the quality of web portals was examined in terms of these three components in information products.
Web Portal Definition and Classification Tatnall (2005) defines a web portal as a website designed “to act as a gateway to access to other sites” and “to aggregate information from multiple sources and make that information available to various users” and “to provide the services of a guide that can help to protect the user from the chaos of the Internet and direct them towards an eventual goal”. Portals have considerably helped the users reduce search costs on the Internet and created positive value for their users (Brynjolfs-son & Smith, 2000). Most Web users usually start their online activities using web portals, there-by making portals the major sites of Internet traffic (Hanson, 2000).
Web portals can be categorized into nine types (See Table 1): general portals, vertical industry portals, horizontal industry portals, community portals, enterprise information portals, e-market place portals, personal/mobile portals, information portals, and specialized/niche portals (Tatnall, 2005). These categories are not mutually exclusive as some portals fit more than one category. A portal is called ‘horizontal’ if it is used by broad base of users, but if it is focused on a particular audience, the portal is vertical (Lynch, 1998). Perhaps the most popular Web portals are general portals. They provide links to all sorts of sites that can be either closely related or quite diverse, and they include services such as email, links to search engines, blog, chat rooms, online messen-gers, news, etc. A general portal is not targeted to a specific group of people and is aimed to serve a large populace of individual users.
Table 1. Portal types (Source: Tatnall, 2005)
Portal type Characteristics
General portal • To provide links to all sorts of sites that can be either closely related or quite diverse.
• It includes services such as email, links to search engines and catego-ries of information, membership services, news, a customized space with a user’s selections, chat rooms, links to virtual shopping malls, and directories.
Nam
383
Portal type Characteristics
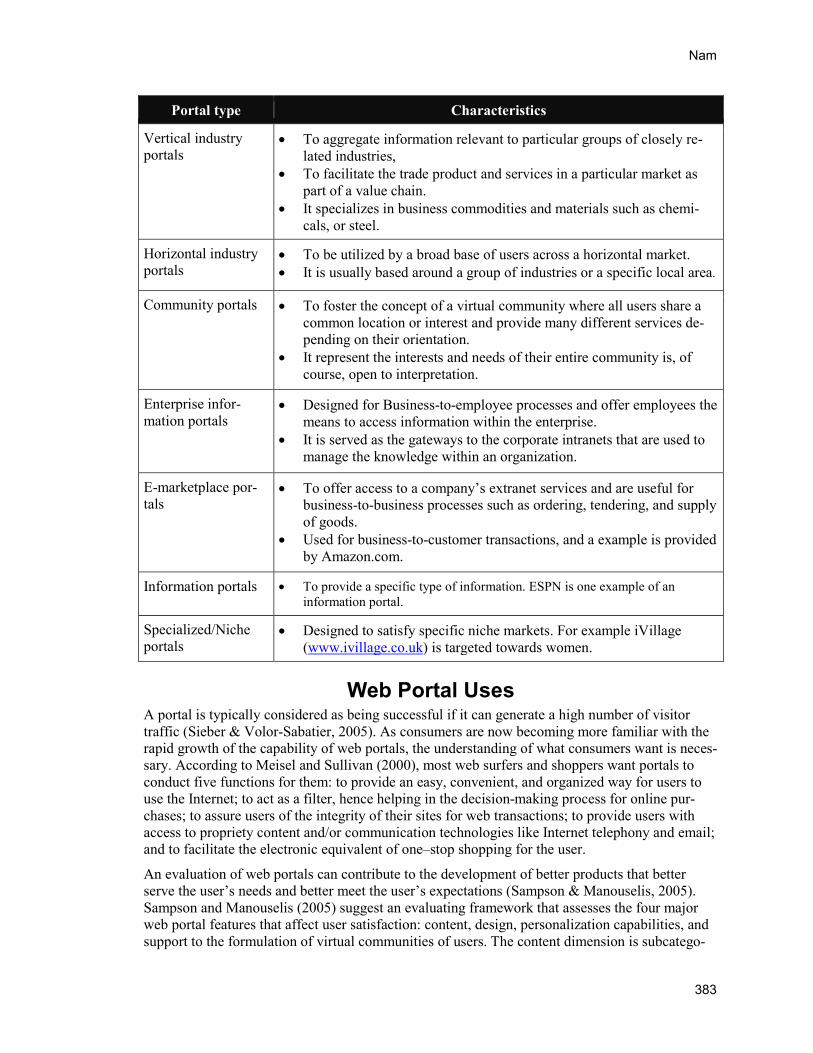
Vertical industry portals
• To aggregate information relevant to particular groups of closely re-lated industries,
• To facilitate the trade product and services in a particular market as part of a value chain.
• It specializes in business commodities and materials such as chemi-cals, or steel.
Horizontal industry portals
• To be utilized by a broad base of users across a horizontal market. • It is usually based around a group of industries or a specific local area.
Community portals • To foster the concept of a virtual community where all users share a common location or interest and provide many different services de-pending on their orientation.
• It represent the interests and needs of their entire community is, of course, open to interpretation.
Enterprise infor-mation portals
• Designed for Business-to-employee processes and offer employees the means to access information within the enterprise.
• It is served as the gateways to the corporate intranets that are used to manage the knowledge within an organization.
E-marketplace por-tals
• To offer access to a company’s extranet services and are useful for business-to-business processes such as ordering, tendering, and supply of goods.
• Used for business-to-customer transactions, and a example is provided by Amazon.com.
Information portals • To provide a specific type of information. ESPN is one example of an information portal.
Specialized/Niche portals
• Designed to satisfy specific niche markets. For example iVillage (www.ivillage.co.uk) is targeted towards women.
Web Portal Uses A portal is typically considered as being successful if it can generate a high number of visitor traffic (Sieber & Volor-Sabatier, 2005). As consumers are now becoming more familiar with the rapid growth of the capability of web portals, the understanding of what consumers want is neces-sary. According to Meisel and Sullivan (2000), most web surfers and shoppers want portals to conduct five functions for them: to provide an easy, convenient, and organized way for users to use the Internet; to act as a filter, hence helping in the decision-making process for online pur-chases; to assure users of the integrity of their sites for web transactions; to provide users with access to propriety content and/or communication technologies like Internet telephony and email; and to facilitate the electronic equivalent of one–stop shopping for the user.
An evaluation of web portals can contribute to the development of better products that better serve the user’s needs and better meet the user’s expectations (Sampson & Manouselis, 2005). Sampson and Manouselis (2005) suggest an evaluating framework that assesses the four major web portal features that affect user satisfaction: content, design, personalization capabilities, and support to the formulation of virtual communities of users. The content dimension is subcatego-

Influence of Information Product Quality on Informing users
384
rized as follows: content organization, content creditability, content usefulness, and content inte-gration. The design dimension is comprised of four sub-dimensions: information architecture, usability, graphical design, and technical integrity/performance. Personalization is examined at three different levels: navigation, information/content, and interface personalization. Community support consists of two sub-dimensions: communication support and collaboration support. To evaluate web portal, Sampson and Manouselis (2005) focus on user satisfaction and web portal features.
Telang and Mukhopadhyay (2004) argue that successful portals need users to come back repeat-edly (repeat use) and frequently (frequency), and for extended periods of time (stickiness). They developed a conceptual model explaining portal uses, which consists of repeat use, stickiness, use frequency. Portal services can be categorized in three ways: personal services, information ser-vices, and search services (Telang & Mukhopadhyay, 2005). A detail of the three types of ser-vices and analysis of those according to GOMS (Goals, Operators, Methods and Selection rules) model appears on Table 2.
Table 2. A typology of web portal services. (Source: Telang & Mukhopadhyay, 2005)
Service types
Characteristics
Personal services
• Portal lets users customize their interactions with the site. • Portal offers personalized services for emails, chat rooms, bulletin boards,
messaging services, and personalized home pages, etc. • Portal requires registration via entry of a username and password to access
the services.
Information services
• News, weather, and sports are some of the examples of information services. • Users access these services directly from the portal by clicking the appropri-
ate link on the portal site, without entering any username and password.
Search ser-vices
• Users enter the search term(s) and click the ‘‘search’’ button, users can re-trieve information relevant to search terms. The search feature (a text box, and search button) is easily visible, and easy to locate on the portals.
Telang and Mukhopadhyay (2005) also found that users develop loyalty for a given portal. If someone has used a particular portal frequently in the past, the person is more likely to visit the portal again in the future. This may refer to user loyalty to the particular web portal. Repeat use is an indicator of loyalty. They found search services as well as personal services develop strong repeat use. For frequency, they counted the total number of times a user went to a portal weekly. Stickiness was the average number of minutes spent on portals. For repeat use, they used an ex-ponentially weighted average of all previous use. The data used for their study came from HomeNet Project (Kraut, Mukhopadhyay, Szczypula, Kiesler, & Scherlis, 1999), so the data used in their study was taken from detailed usage records from the server used in the HomeNet project. They found that the highest frequency is for search services, followed by information services, and, lastly, personal services. This result is in contrast to the stickiness results. Users spent the least amount of time for search services. The use of information and personal services increases the time a user spends on a portal, but search services are not sticky as users move on to the re-ferred sites. They also found that the use of personal and information services requires longer time compared to the use of search services (Telang & Mukhopadhyay, 2005).

Nam
385
Web portals can be viewed as information systems, consisting of information and delivering in-frastructure. The use of information systems has been an important Management of Information Systems (MIS) success measure in MIS empirical research (Zmud, 1979). To examine infor-mation system use, the amount of use time (Ginzberg, 1981) or frequency of use (Hogue, 1987) have been identified as central for success.
Conceptual Model of Information Product Quality (IPQ) Nam (2009) developed a conceptual model of web portal quality incorporating an information product concept. Information Products are comprised of three components: informational, physi-cal, and service components (Alter, 2002). As a kind of Information Product, a web portal also has three components. In the following, the Information Product Quality (IPQ) will be discussed in each of these three aspects. Concepts and constructs from an array of information system, me-dia, and marketing studies were also considered.
Informational and Physical Component of Information Product Quality (IPQ) There have been several information system studies done to evaluate Information Quality (IQ). Wang and Strong (1996) empirically developed a framework to pinpoint the elements of IQ. Twenty objectives and measurable dimensions of information quality were measured and ana-lyzed using factor analysis. The framework includes four categories of IQ: intrinsic, contextual, representational, and accessibility (Wang & Strong, 1996). Intrinsic quality dimension consists of four attributes: accuracy, objectivity, believability, and reputation. Contextual quality consists of relevancy, value, timeliness, completeness and the amount of data. Representational quality con-sists of interpretability, ease of understanding, concise representation, and consistent representa-tion. Accessibility quality consists of access and security (Wang & Strong, 1996). Price and Shanks (2005) adopted a semiotic approach to develop a new framework of IQ which consists of syntactic, semantic, and pragmatic categories.
Eppler and Muenzenmayer (2002) developed an IQ framework which consists of four different levels: community, product, process, and infrastructure. Each level consists of four sub-dimensions. The community level consists of comprehensiveness, accuracy, clarity, and applica-bility. The product level consists of conciseness, consistency, correctness, and currency. The pro-cess level consists of convenience, timeliness, traceability, and interactivity. The infrastructure level consists of accessibility, security, maintainability, and speed. These four levels are further divided into two categories: content quality (community and product level); and media quality (process and infrastructure level) (Eppler, 2003). Media is defined as the “materials that hold data in any form or that allow data to pass through them, including paper, transparencies, multipart forms, hard, floppy and optical disks, magnetic tape, wire, cable and fiber” (“Media”, 2007). In-formation products are stored, presented, and delivered through media. This means that infor-mation products should be formatted according to the nature of the media. Therefore, the physical component of information product quality is media-related. All of the attributes of Eppler and Muenzenmay’s framework are relevant to this study, and these two big categories fit well with the quality conceptual model in this study. Eppler’s IQ framework was utilized to explain infor-mation and physical components of web portal quality in this study.
Service Component of IPQ A service is “any activity or benefit that one party can offer to another that is essentially intangi-ble and does not result in the ownership of anything.” (Kotler & Bloom, 1984).

Influence of Information Product Quality on Informing users
386
Service quality has been rigorously studied in the marketing research domain. According to Par-asuraman, Zeithaml, and Berry's (1985) studies, service quality is defined as the gap between the expected level of service and customer perceptions of the service level received. Parasuraman, Zeithaml, and Berry (1988) and Gronroos (1982) both offer well-known frameworks that have been employed to determine service quality. Gronroos (1982) argued for two dimensions of ser-vice quality that are functional and technical. Functional quality relates to how the service is de-livered, and technical quality relates to the type of service delivered. Parasuraman et al. (1988) propose five service encounter characteristics: reliability, responsiveness, assurance, empathy, and tangibility.
Rationales for Model Integration The distinctions between the physical and service components of information products are not always clear. Furthermore, as ongoing services provided by sellers and manufacturers through the Internet extend the function of information products, it is sometimes hard to distinguish between information products and information services because every product contains some combination of information, service, and physical component (Alter, 2002). The complexity of information products provides further justification for evaluating the information product quality from a ‘package’ perspective.
As information is stored, delivered, and presented in various physical forms through media, the quality of information is usually measured in conjunction with the media. The ways people com-municate affect how they think (Stephens, 1998). As Stephens points out, not only the content, but the medium itself has a meaning, and some recent studies highlight the differences in per-ceived quality that may be tied to the whole package. Abdulla, Garrison, Salwen, Driscoll, and Casey (2002) found that people rated newspaper and television news credibility in the same way but differently for online news credibility. Their survey respondents rated online news as being the highest in credibility. However, some researchers raised questions about Internet credibility. They argue that the Internet may affect the credibility aspect of information quality because of its potential to allow anybody to browse and upload information without any scrutiny (Johnson & Kaye, 1998), and because of the lack of the verification of information before it reaches the pub-lic (Flanagin & Metzger, 2000).
Various types of information biases may be related to technologies. Because of their accessibility and speed of communication, different technologies offer various levels of political biases (Post-man, 1996). Also, because of technical and economical structure differences, various technolo-gies show distinct content biases. Different physical forms result in distinct sensory biases, and the divergent conditions in which we attend to them result in various social biases (Postman, 1996). These different biases, which are informed by characteristics of the technology, are inex-tricable when we consider information product quality. Postman (1996) does not provide further elaboration on these information biases and although they are very interesting and require more in-depth explanation, discussion and interpretation, this treatment is outside the scope of this study. Subsequently, some news users report that news sources or the medium is more important than news content itself when rating news credibility (Newhagen & Nass, 1989). Therefore, in this study, quality of web portals product is to be measured as package.
A web site quality model has been developed by Webb and Webb (2004) especially for business-to-customer electronic commerce web site. They name it the SiteQual model, which integrates the SERVQUAL (Parasuraman et al., 1985) model and Data quality (Wang & Strong, 1996) model. They initially used an instrument constructed by adapting 21 service quality items (Parasuraman et al., 1994) and 22 items derived from Wang and Strong (1996)’s information quality model. They reduced the desired dimensions through factor analysis and found four minimum web site quality factors (reliability, assured empathy, perceived usability, and trustworthiness) and seven

Nam
387
desired web site quality factors (reliability, assured empathy, perceived usability, trustworthiness, tangibility, navigability, relevant representation, accuracy, and security) which are important to consumers in the retail music industry. Moraga, Calero, and Piattini (2004) also integrate the SERVQUAL model and the Data quality model (which is originated from Wang and Strong’s study in 1996; this model consists of intrinsic, representation, accessibility, and contextual data quality) and propose a portal quality model which consists of six dimensions (tangibility, reliabil-ity, responsiveness, assurance, empathy, and data quality). These previous studies incorporate information quality model and SERVQUAL models to develop web portal quality model.
The original description of each service quality dimension is as follows: tangibles (physical facili-ties, equipment, and appearance of personnel); reliability (the ability to perform the promised ser-vice dependably and accurately); responsiveness (the willingness to help customers and provide prompt service); assurance (knowledge and courtesy of employees and their ability to inspire trust and confidence); and empathy (caring, individualized attention the firm provides its customer). These service quality dimensions were developed through the repeated computation of coefficient alpha and factor analysis of data obtained across a range of businesses such as retail stores, banks, telephone companies, securities brokers, and credit card companies (Parasuraman et al., 1988). However, their definitions of service quality dimensions are not compatible with web portals as they are generated for general service sectors. Moraga et al. (2004) suggest a definition of each service dimension specifically for web portals. Tangibility indicates “if the portal contains all the software and hardware infrastruc-tures needed according to its functionality.” Reliability is the “ability of the portal to perform its functionality accurately.” Responsiveness is the “willingness of the portal to help and to provide its functionality in an im-mediate form to the users.” Assurance is “ability of the portal to convey trust and confidence.” Empathy is de-fined as “the ability of the portal to provide caring and individual attention.” As these definitions are suitable to describe web portal quality, these were utilized in this study to describe each dimension of service component of web portal quality.
In this study, Eppler’s (2003) information quality model and SERVQUAL was incorporated to investigate web portal quality. Eppler’s concepts of content quality and media quality were used to explain information and physical components, and SERVQUAL explained the service component of web portal quality. Moraga et al. (2004)’s definition of each service dimension was uti-lized in this study to describe each dimension of service component of web portal quality as their definitions are specifically designed to describe web portal quality. As these definitions are suitable to describe web portal quality, these were utilized in this study to describe each dimension of service component of web portal quality. Figure 1 shows the conceptual model of Information Product quality.
Information Product Quality (IPQ)
Informational components Comprehensiveness
Accuracy Clarity
Applicability Conciseness Consistency Correctness Currency
Physical components Convenience Timeliness Traceability Interactivity Accessibility
Security Maintainability
Speed
Service components Reliability
Responsiveness Assurance Empathy
Tangibility Figure 1.
Conceptual model of IPQ

Influence of Information Product Quality on Informing users
388
The Impact of Perceived Quality on Intention-To-Use a General Web Portal
In this study, use of a web portal means the utilization of a web portal accompanied with actions such as searching, reading, typing, and clicking in real time. To measure intention-to-use, partici-pants were asked about their likelihood of future use of a general web portal. The theoretical grounding for this construct derives from the technology acceptance model (TAM) (Davis, 1989). According to TAM, a behavior is determined by the intention to perform the behavior. Actual behavior and intention have been found to be correlated (Davis, Bagozzi, & Warshaw, 1989). Intention-to-use is defined as their commitment toward using a technology (Fishbein & Azjen, 1975) and it reflects the strengths of a person’s tendency to engage in a specific behavior (Cooper & Zmud, 1990).
Among various types of portals, a general web portal was examined in this study. A general por-tal means a portal which aims to provide links to all sorts of different sites that can be either closely related or quite diverse, trying to meet various user needs (Tatnall, 2005). Portal services can be divided into three categories: personal services, information services, and search services (Telang & Mukhopadhyay, 2005). Therefore, each subject was asked his/her intention-to-use per-sonal, information, and search services provided by a web portal. Each subject also predicted the overall use of a web portal using a seven-point scale.
In this study, personal services means the customized features which require registration via entry of a username and password to access the services. They let users customize their interactions with the site. Portals may offer various personalized services such as emails, chat rooms, bulletin boards, messaging services, and personalized home pages. Information services refer to the fea-tures that allow users to directly access another sites by clicking them, without entering anything. News, entertainment, and sports are some of the examples of information services. Search ser-vices are references to the features that enable users to search the web through entering the search term(s) and clicking the search button. The search feature (which involves a textbox and a search button) is easily visible on the main page of web portals and sometime it appears with several tabs next to textbook to narrow down search results to specific search categories.
Figure 2. Conceptual model of IPQ
The relationship between web portal quality and a general web portal intention-to-use was inves-tigated in this study. DeLone and McLean’s (1992) and Seddon and Kiew (1994)’s information use study served as the rationales of this relationship in this study. DeLone and McLean (1992)

Nam
389
reviewed information system success measures and created six different categories: system quali-ty; information quality; information use; user satisfaction; individual impact; and organization impact. They suggest a model of causal dependency between those categories. Their model shows that each of system quality and information quality influence both information use and user satis-faction. Their updated model (Delone & McLean, 2003) is shown in Figure 2.
Based on the DeLone and McLean’s review (1992), Seddon and Kiew (1994) adopted DeLone and McLean’s causal model and tested the interdependency of four variables (system quality, in-formation quality, use, satisfaction), which includes the causal relationship between information quality and information use. Livari (2005) tested the DeLone-McLean model of information sys-tem success empirically, and his results showed that perceived system quality is a predictor of information use, but perceived information quality is not, though it is expected. His empirical findings are from a field study of usage of financial and accounting systems among employees in an organization. As Livari points out, the mandatory nature of the system limits his findings; therefore, he suggested more testing with voluntary systems. Telang and Mukhopadhyay (2005) also said that the quality of the portal results is a strong predictor of user choices. If a user is not satisfied with the quality portal output, then the user is not going to use the portal in the future. A poor quality portal cannot develop user loyalty (Telang & Mukhopadhyay, 2005). Although the influence of quality on information system usage in work places have been studied in MIS field and various quality factors have been identified in web usage, little is known about the influence of quality on intention-to-use web portal usage.
Research Design This study explored a specific research question.
Research question: To what extent does each dimension of web portal quality correlate to the in-tention-to-use a general web portal?
In this study, the quality of web portals—as an information product—was examined from the per-spective of end-users. In other words, given many factors that were discussed in the literature on information quality, which one would be pertinent to Web portals?
Alter (2002) said that information product has three components in it: information, physical, and service. A Web portal utilizes the Internet media as the physical component. In this study, Ep-pler’s (2003) information quality model and SERVQUAL was integrated to investigate web por-tal quality. Eppler’s content quality and media quality attributes were to explain the informational and physical components, and SERVQUAL (Parasuraman et al., 1985) to explain the service component of web portal quality. However, the definition of each service quality dimension of the SERVQUAL model may not suitable to this study, as the SERVQUAL model was originally developed for general services. Moraga et al. (2004) suggested a revision of these service quality dimensions to specifically target web portal services. Their definition of each service dimension was utilized in this study to describe each dimension of service component of web portal quality as their definitions are specifically designed to describe web portal quality. DeLone and McLean's (2003) causal mode l was adopted to explain the relationship between web portal quali-ty and use.
A total of 21 quality dimensions are examined in this study. They are comprehensiveness, accura-cy, clarity, applicability, conciseness, consistency, correctness, currency, convenience, timeliness, traceability, interactivity, accessibility, security, maintainability, speed, reliability, responsive-ness, assurance, empathy, and tangibility. The list of dimensions appears in Table 3.

Influence of Information Product Quality on Informing users
390
Table 3. List of Information Product Quality attributes.
Information Product Quality
Attributes: description
Informational components
Comprehensiveness: “Is the scope of information adequate (not too much nor too little)”*
Accuracy: “Is the information precise enough and close enough to reality?”*
Clarity: “Is the information understandable or comprehensible to the target group?”*
Applicability: “Can the information be directly applied? Is it useful?”*
Conciseness: “Is the information to the point, void of unnecessary elements?”*
Consistency “Is the information free of contradictions or convention breaks?”*
Correctness: “Is the information free of distortion, bias, or error?”*
Currency: “Is the information up-to-date and not obsolete?”*
Physical com-ponents
Convenience: “Does the information provision correspond to the user’s needs and habits?”*
Timeliness: “Is the information processed and delivered rapidly without delays?”*
Traceability: “Is the background of the information visible? (author, date, etc.)”*
Interactivity: “Can the information process be adapted by the information consumer?”*
Accessibility: “Is there a continuous and unobstructed way to get to the information?”*
Security: “Is the information protected against loss or unauthorized access?”*
Maintainability: “Can all of the information be organized and updated on an on-going basis?”*
Speed: “Can the infrastructure match the user’s working pace?”*
Nam
391
Information Product Quality
Attributes: description
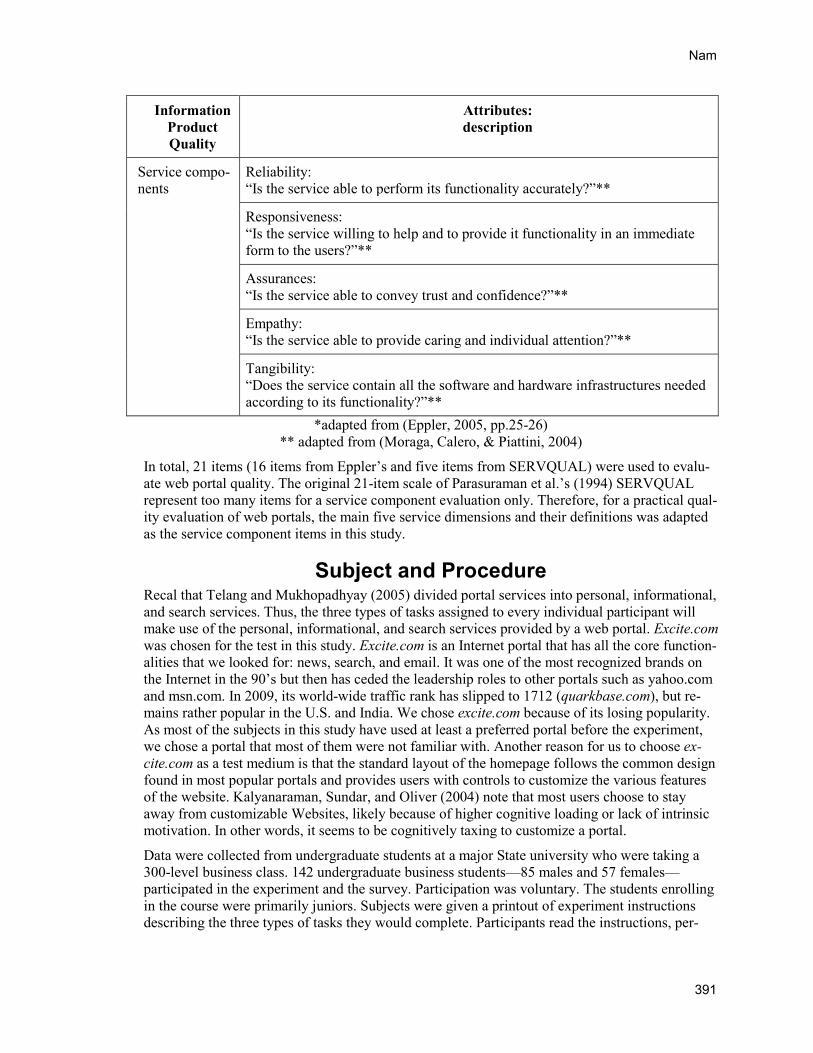
Service compo-nents
Reliability: “Is the service able to perform its functionality accurately?”**
Responsiveness: “Is the service willing to help and to provide it functionality in an immediate form to the users?”**
Assurances: “Is the service able to convey trust and confidence?”**
Empathy: “Is the service able to provide caring and individual attention?”**
Tangibility: “Does the service contain all the software and hardware infrastructures needed according to its functionality?”**
*adapted from (Eppler, 2005, pp.25-26) ** adapted from (Moraga, Calero, & Piattini, 2004)
In total, 21 items (16 items from Eppler’s and five items from SERVQUAL) were used to evalu-ate web portal quality. The original 21-item scale of Parasuraman et al.’s (1994) SERVQUAL represent too many items for a service component evaluation only. Therefore, for a practical qual-ity evaluation of web portals, the main five service dimensions and their definitions was adapted as the service component items in this study.
Subject and Procedure Recal that Telang and Mukhopadhyay (2005) divided portal services into personal, informational, and search services. Thus, the three types of tasks assigned to every individual participant will make use of the personal, informational, and search services provided by a web portal. Excite.com was chosen for the test in this study. Excite.com is an Internet portal that has all the core function-alities that we looked for: news, search, and email. It was one of the most recognized brands on the Internet in the 90’s but then has ceded the leadership roles to other portals such as yahoo.com and msn.com. In 2009, its world-wide traffic rank has slipped to 1712 (quarkbase.com), but re-mains rather popular in the U.S. and India. We chose excite.com because of its losing popularity. As most of the subjects in this study have used at least a preferred portal before the experiment, we chose a portal that most of them were not familiar with. Another reason for us to choose ex-cite.com as a test medium is that the standard layout of the homepage follows the common design found in most popular portals and provides users with controls to customize the various features of the website. Kalyanaraman, Sundar, and Oliver (2004) note that most users choose to stay away from customizable Websites, likely because of higher cognitive loading or lack of intrinsic motivation. In other words, it seems to be cognitively taxing to customize a portal.
Data were collected from undergraduate students at a major State university who were taking a 300-level business class. 142 undergraduate business students—85 males and 57 females—participated in the experiment and the survey. Participation was voluntary. The students enrolling in the course were primarily juniors. Subjects were given a printout of experiment instructions describing the three types of tasks they would complete. Participants read the instructions, per-

Influence of Information Product Quality on Informing users
392
formed all three types of tasks individually online, and answered the questions in the two-phase survey.
After completing these tasks, the subjects evaluated the quality of the web portal and their inten-tion-to-use. To measure perceived quality and the intention-to-use, a self-administered survey was done right after performing the tasks. To evaluate the quality of the web portal, the question-naire also asked participants to rate the extent to which they agree on a seven-point scale (an-chored by extremely unlikely and extremely likely).
Participants also were asked to self-predict their future use of the web portal. To measure the in-tention-to-use, the similar technique was used as it appears in the TAM study. The statement, “Assuming the web portal is available, I predict that I will use it on a regular basis in the future,” were followed by a seven-point scale (1: extremely unlikely, 7: extremely likely). The question-naire is in the Appendix. Subjects were asked the question again to evaluate the individuals’ in-tention-to-use each of the personal, informational, and search services provided by EX-CITE.COM using this seven-point scale.
Data Analyses and Findings Demographics 142 undergraduate business students—85 males and 57 females—enrolled in BUS 300-level courses at the University of Hawaii at Manoa. The mean age among participants was 22.6 with the youngest being 19 and the oldest being 37 years of age. The age of the majority of partici-pants (90%) ranged between 19 to 26 years old. Most of them were in the junior or senior year of their academic careers.
At the time of the survey, 81.7% of participants indicated they had prior experience using web portals. 36% of those surveyed had less than 5 years experiences, and 64% had more than or equal to 5 years of experience with web portal use. Seventy six percent of participants had expe-rience with YAHOO.COM and thirty three percent of participants said they use YAHOO.COM often. Sixty five percent of participants had experience with MSN.COM, and twenty percent of the participants said that they use MSN.COM often. Seventy five percent of the participants had no prior experience with EXCITE.COM. In addition, a large number of participants indicated they had no experience with LYCOS.COM (91%), GO.COM (95%), NETSCAPE.COM (89%), and AOL.COM (77%). The web portal ranked most favorite among the participants was Google (37.3%), with Yahoo (17.6%) and MSN (7%) ranked second and third, respectively.
Kendall’s Tau-b was used to calculate the correlation between quality and intention-to-use. Tau-b can be used for both square and non-square tables. As 7-point ordinal data were collected for the measurement of quality and intention-to-use, Tau-b was the most appropriate method to compute measures of association between quality and intention-to-use. In this study, the main focus of the relationship between web portal quality and web portal use is not causality, but correlation. The ordinal coefficient gamma is a correlation coefficient for ordinal, interval, or ratio data. It is used as a symmetric measure which varies from +1 to -1. However, it is not considered in this study because it provides an inflated value compared to most other ordinary coefficients on the same data set. The formula for Gamma is (P - Q)/(P + Q). Here P represents the concordant pairs and Q represents the discordant pairs. Tau-b equals the difference between concordant and discordant pairs divided by a term representing the geometric mean between the number of pairs not tied on x (X0) and the number not tied on y (Y0):
tau-b = (P - Q)/ SQRT[((P + Q + Y0)(P + Q + X0))]

Nam
393
To test and validate the conceptually developed three factors of web portal quality, factor analy-sis, using SPSS 15.0 (“SPSS”, 2000), was conducted with maximum likelihood extraction with iterations. Varimax rotation was specified to identify variables that might indicate potential con-structs.
Factor Analysis The first step in the analysis was aimed at validating the conceptually developed measurement of three factors designed to capture web portal quality. To accomplish this objective, factor analysis was conducted with maximum likelihood extraction with iterations. Varimax rotation was speci-fied to identify variables that might indicate potential constructs. Four factors with eigenvalues over one were obtained. Table 4 displays the rotated loading for these factors. Factor loadings were examined and highest scores were marked in bold and placed on top of each item. The four factors explained 72.77 percent of the variance. Data did not support the original structure of the research model. However a factorial analysis has allowed the model to be rearranged. The four factors are labeled: (1) Content relevancy, (2) Communication interactiveness, (3) Information currency, and (4) Instant gratification (see Table 4).
Table 4. Web portal quality factors.
Factors Attributes
Factor 1: Content relevancy Eigenvalue = 11.49
Cronbach’s alpha = .861
Correctness ( .700) Consistency ( .692) Tangibility ( .596)
Security ( .564) Conciseness ( .556)
Empathy ( .473)
Factor 2: Communication interactiveness Eigenvalue = 1.39 Cronbach’s alpha = .911
Interactivity ( .727) Accessibility ( .713)
Clarity ( .649) Comprehensiveness ( .642)
Traceability ( .560) Applicability ( .485)
Factor 3: Information currency Eigenvalue = 1.25 Cronbach’s alpha = .892
Currency ( .752) Timeliness ( .727) Accuracy ( .633)
Convenience ( .559) Maintainability ( .537)
Factor 4: Instant gratification Eigenvalue = 1.15
Cronbach’s alpha = .878
Speed ( .814) Reliability ( .540) Assurance ( .506)
Responsiveness ( .504)
Factor 1: Content relevancy. Among the four factors, Content relevancy appeared to be the most important because it explained the largest portion (54.71%) of the total variance. Content relevancy was indicated by the attributes “Correctness”, “Consistency”, “Tangibility”, “Security”,

Influence of Information Product Quality on Informing users
394
“Conciseness”, and “Empathy”. “Correctness” is most highly correlated with factor 1 with rotated loading score .700.
Factor 2: Communication interactiveness. Communication interactiveness explained 6.61% of total variance. Communication interactiveness was indicated by the attributes “Interactivity”, “Accessibility”, “Clarity”, “Comprehensiveness”, “Traceability”, and “Applicability”. “Interac-tivity” is correlated with the highest rotated score .727.
Factor 3: Information currency Information currency accounted for 5.96% of the variance. In-formation currency was indicated by the attributes “Currency”, “Timeliness”, “Accuracy”, “Con-venience”, and “Maintainability”. “Currency” is the most highly correlated with the factor 3.
Factor 4: Instant gratification. Instant gratification represented 5.48% of the variance and con-sisted of the attributes “Speed”, “Reliability”, “Assurance”, and “Responsiveness”. “Speed” is the most highly correlated attribute to Instant gratification. This result is different from the theoreti-cally proposed three components of web portal quality: information, physical, and service. Cronbach’s alpha, a measure of internal consistency reliability, was computed for each factor to assess the reliability of the set of items forming that factor (see Table 4).
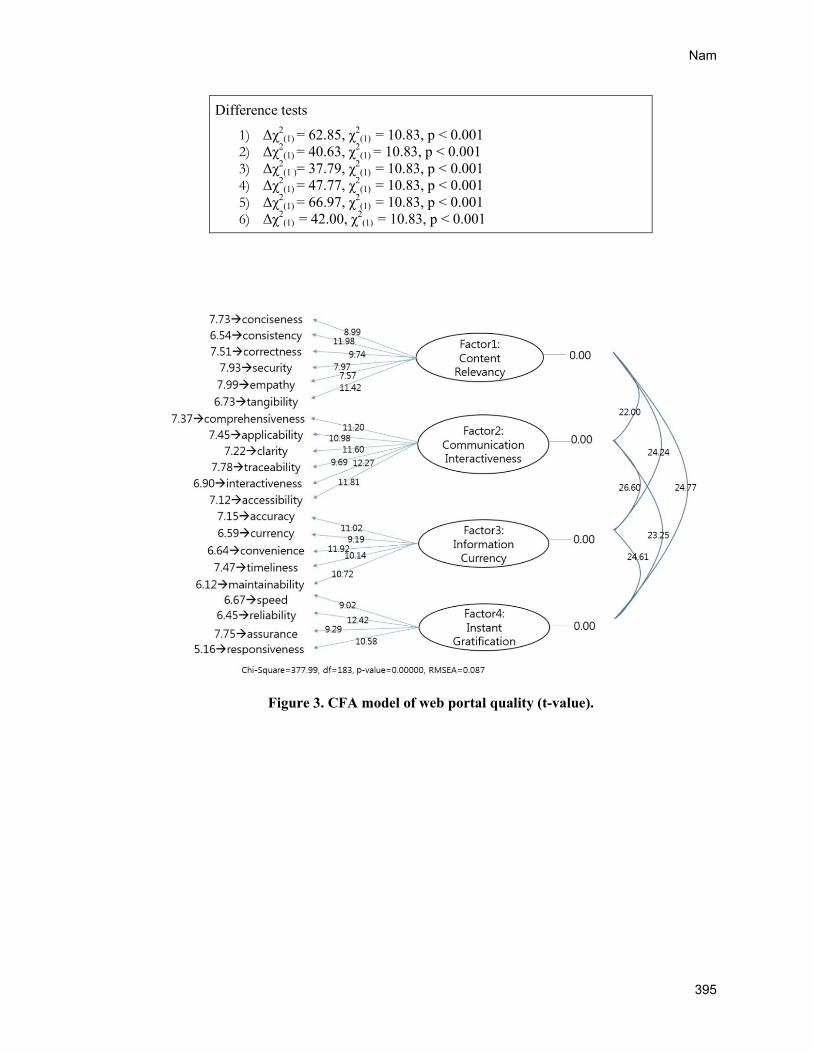
The reliability estimation for the four factors was strong, evidenced by a coefficient alpha of .86 for factor 1, .91 for factor 2, .89 for factor 3, and .87 for factor 4. The four factors were confirmed through a measurement model in LISREL 8.80 (“LISREL”, 2006). The LISREL Maximum Like-lihood solution algorithm was used to estimate model parameters. χ2
(183) of the model was 377.99 (p = .000). In addition, the Root Mean Square Error of Approximation (RMSEA) = 0.087, 90 Percent Confidence Interval for RMSEA = (0.074 ; 0.099), and P-Value for Test of Close Fit (RMSEA < 0.05) = 0.00. LISREL 8.80 uses Maximum Likelihood for analysis of missing data.
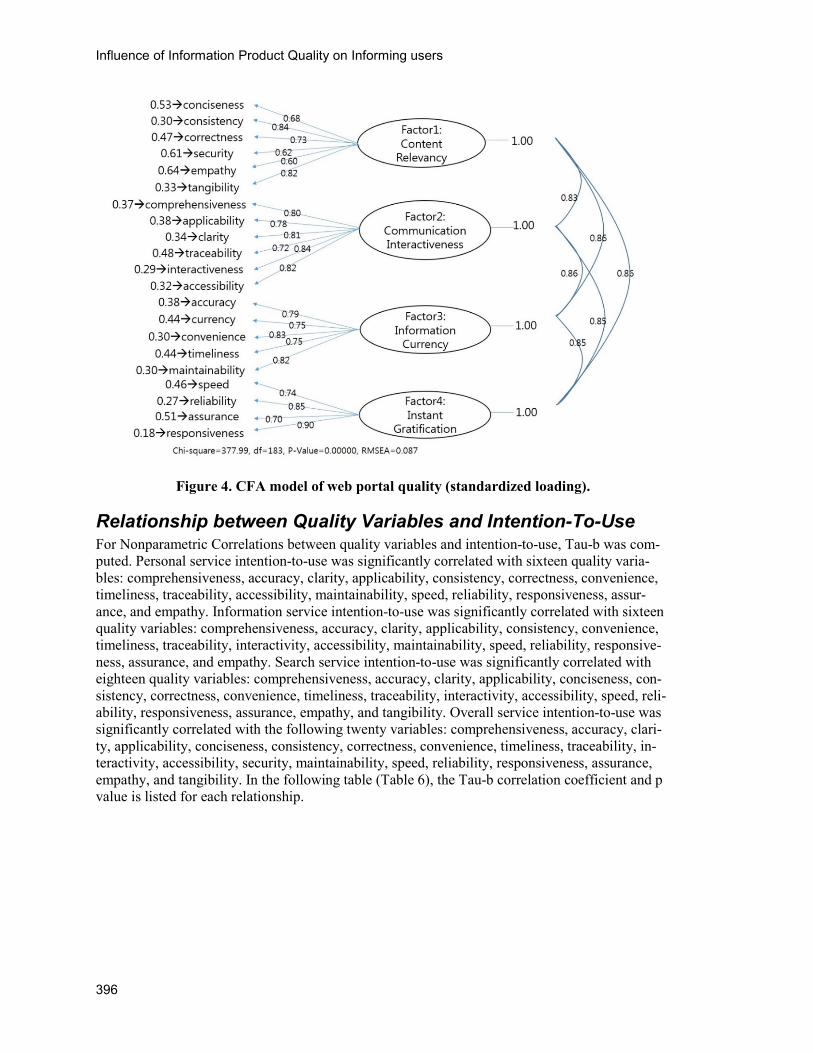
The standardized factor loading of each item and all the t-value are higher than statistically signif-icant level. Therefore good convergent validity exists (Dunn, Seaker, & Waller, 1994). Each vari-able exhibits high t-value (Figure 3) and significant loadings (Figure 4), which support conver-gent validity. For discriminant validity checking, the estimated correlation parameter Φij between one pair of components was constrained to 1.0, and a χ2 difference test was conducted on the val-ues obtained from the constrained model and the unconstrained model. A chi-square difference test was conducted for each possible pair of the four factors at any given time (Anderson & Gerb-ing, 1988). In Table 5, the unconstrained model shows a significantly lower value of χ2 than all the constrained models. The chi-square difference test for each pair of factors was significant (p < .001), so the factors possess discriminant validity.
Table 5. Test of discriminant validity (chi-square difference Test)
Model with correlation between factors free χ2
(183) = 377.99
Models with correlation between factors constrained to unity(Φ = 1)
1) Φ21 = 1, χ2(184) = 440.84
2) Φ31 = 1, χ2(184) = 418.62
3) Φ41 = 1, χ2(184) = 415.78
4) Φ32 = 1, χ2(184) = 425.76
5) Φ42 = 1, χ2(184) = 444.96
6) Φ43 = 1, χ2(184) = 419.99
Nam
395
Difference tests
1) Δχ2(1) = 62.85, χ2
(1) = 10.83, p < 0.001 2) Δχ2
(1) = 40.63, χ2(1) = 10.83, p < 0.001
3) Δχ2(1 )= 37.79, χ2
(1) = 10.83, p < 0.001 4) Δχ2
(1) = 47.77, χ2(1) = 10.83, p < 0.001
5) Δχ2(1) = 66.97, χ2
(1) = 10.83, p < 0.001 6) Δχ2
(1) = 42.00, χ2(1) = 10.83, p < 0.001
Figure 3. CFA model of web portal quality (t-value).
Influence of Information Product Quality on Informing users
396
Figure 4. CFA model of web portal quality (standardized loading).
Relationship between Quality Variables and Intention-To-Use For Nonparametric Correlations between quality variables and intention-to-use, Tau-b was com-puted. Personal service intention-to-use was significantly correlated with sixteen quality varia-bles: comprehensiveness, accuracy, clarity, applicability, consistency, correctness, convenience, timeliness, traceability, accessibility, maintainability, speed, reliability, responsiveness, assur-ance, and empathy. Information service intention-to-use was significantly correlated with sixteen quality variables: comprehensiveness, accuracy, clarity, applicability, consistency, convenience, timeliness, traceability, interactivity, accessibility, maintainability, speed, reliability, responsive-ness, assurance, and empathy. Search service intention-to-use was significantly correlated with eighteen quality variables: comprehensiveness, accuracy, clarity, applicability, conciseness, con-sistency, correctness, convenience, timeliness, traceability, interactivity, accessibility, speed, reli-ability, responsiveness, assurance, empathy, and tangibility. Overall service intention-to-use was significantly correlated with the following twenty variables: comprehensiveness, accuracy, clari-ty, applicability, conciseness, consistency, correctness, convenience, timeliness, traceability, in-teractivity, accessibility, security, maintainability, speed, reliability, responsiveness, assurance, empathy, and tangibility. In the following table (Table 6), the Tau-b correlation coefficient and p value is listed for each relationship.

Nam
397
Table 6. Correlations between quality variables and intention-to-use
Personal ser-vice intention-to-use
Information service in-tention-to-use
Search service intention-to-use
Overall ser-vice inten-tion-to-use
Comprehensiveness (n = 142) .197(**) .246(***) .269(***) .308(***)
Accuracy (n = 142) .201(**) .195(**) .244(***) .293(***)
Clarity (n = 142) .206(**) .206(**) .307(***) .264(***)
Applicability (n = 142) .245(***) .257(***) .291(***) .301(***)
Conciseness (n = 142) .089 .110 .199(**) .136(*)
Consistency (n = 142) .148(*) .142(*) .142(*) .158(*)
Correctness (n = 141) .151(*) .113 .188(**) .205(**)
Currency (n = 108) .088 .096 .078 .123
Convenience (n = 141) .211(**) .206(**) .259(***) .286(***)
Timeliness (n = 142) .191(**) .214(**) .232(***) .245(***)
Traceability (n = 142) .209(**) .160(*) .174(**) .149(*)
Interactivity (n = 142) .131 .152(*) .252(***) .189(**)
Accessibility (n = 142) .192(**) .216(**) .271(***) .250(***)
Security (n = 142) .128 .105 .110 .190(**)
Maintainability (n = 109) .201(**) .224(**) .134 .228(**)
Speed (n = 109) .260(**) .236(**) .275(***) .331(***)
Reliability (n = 142) .231(***) .257(***) .259(***) .294(***)
Responsiveness (n = 141) .167(*) .165(*) .203(**) .260(***)
Assurance (n = 142) .195(**) .198(**) .219(**) .242(***)
Empathy (n = 142) .182(**) .179(**) .219(**) .238(***)
Tangibility (n = 138) .068 .131 .175(**) .178(**) ***p < .001 ** p < .01 * p < 0.05
Personal service intention-to-use was significantly correlated with factor 2 (r = .188, p < .009) and factor 4 (r = .174, p = .016). Information service intention-to-use was significantly correlated with factor 2 (r = .174, p = .016) and factor 4 (r = .144, p = .047). Search service intention-to-use was significantly correlated with factor 2 (r=.241, p < .001) and factor 4 (r = .167, p = .020). Overall service intention-to-use was significantly correlated with factor 2 (r = .218, p = .003), factor 3(r = .159, p = .029), and factor 4 ( r= .217, p = .003). Factor 1 was not correlated signifi-cantly with personal service, information service, search service, or overall service intention-to-use (see Table 7).

Influence of Information Product Quality on Informing users
398
Table 7. Correlations between quality factors and intention-to-use
Correlation
Personal ser-vice(n=103)
Information service(n=103)
Search ser-vice(n=103)
Overall ser-vice(n=103)
Factor 1: Content relevancy 0.038 0.28 0.004 0.40
Factor2: Communication interactiveness
0.188(**) .174(*) .241(***) .218(**)
Factor 3: Information Curren-cy
.133 .121 .118 .159(*)
Factor 4: Instant gratification .174(*) .144(*) .167(*) .217(**)
***p < .001 ** p < .01 * p < 0.05
Discussion The purpose of this investigation was to find out the relationship between quality and intention-to-use a web portal. This effort was successful to generate several new insights about the nature of information product quality and then roles as determinants of intention-to-use a product. Using a conceptually developed information product quality framework, which incorporates 21 quality items from Eppler (2003) and Moraga et al. (2004), web portal quality was measured. The 16 item scale from Eppler (2003) was used to measure informational and physical components of web portal quality. The five item scale from Moraga et al. (2004) was used to measure the service component in this study.
Kendall’s Tau-b was used to calculate the correlation between quality and intention-to-use.
For personal services intention-to-use, the most highly correlated quality attributes were speed (r = .260, p < .01), applicability (r = .245, p < .001), and reliability (r = .231, p < .001). For infor-mation services intention-to-use, reliability (r = .257, p < .001), applicability (r=.257, p < .001), and comprehensiveness (r = .246, p < .001) are highly related. For search services intention-to-use, clarity (r=.307, p<.001), applicability (r = .291, p < .001), speed (r = .275, p < .001) are high-ly related. For overall services intention-to-use, speed (r = .331, p < .001), comprehensiveness (r = .308, p < .001), and applicability (r = .301, p < .001) are identified as highly correlated attrib-utes. Clarity is perceived more important in search services compared to personal and information services. Even though two quality dimensions (reliability and currency) are regarded as signifi-cant dimensions in this research, Xu, Benbasat, & Cenfetelli (2013) posit differently that four quality dimensions (format, currency, accessibility, and reliability) were not so significant when evaluating e-service websites. These dimensions need further studies to clarify the significance.
In this study, there exist significant correlations between informational, physical, and service quality components and intention-to-use web portals. This finding differs from Khristianto, Kertahadi, and Suyadi’s (2012) study. Informational and service qualities directly influenced on customer satisfaction, but system qualities did not significantly influence on customer satisfaction during online shopping (Khristianto et al., 2012).
Nam
399
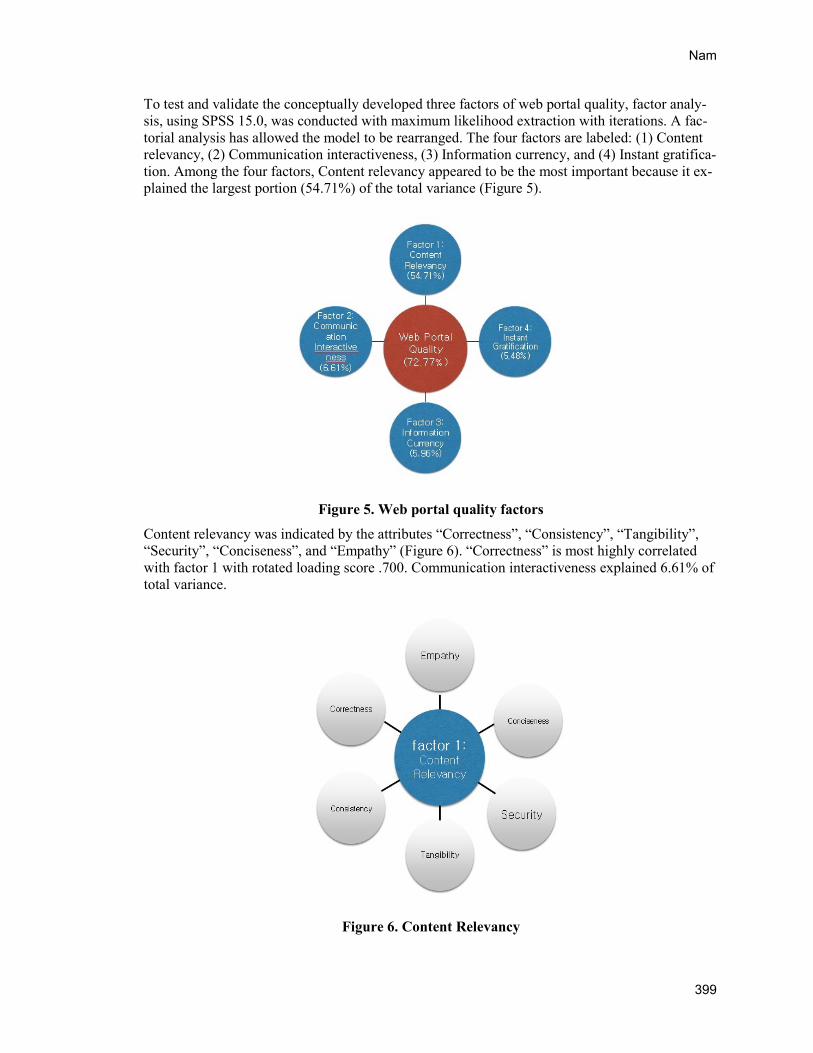
To test and validate the conceptually developed three factors of web portal quality, factor analy-sis, using SPSS 15.0, was conducted with maximum likelihood extraction with iterations. A fac-torial analysis has allowed the model to be rearranged. The four factors are labeled: (1) Content relevancy, (2) Communication interactiveness, (3) Information currency, and (4) Instant gratifica-tion. Among the four factors, Content relevancy appeared to be the most important because it ex-plained the largest portion (54.71%) of the total variance (Figure 5).
Figure 5. Web portal quality factors
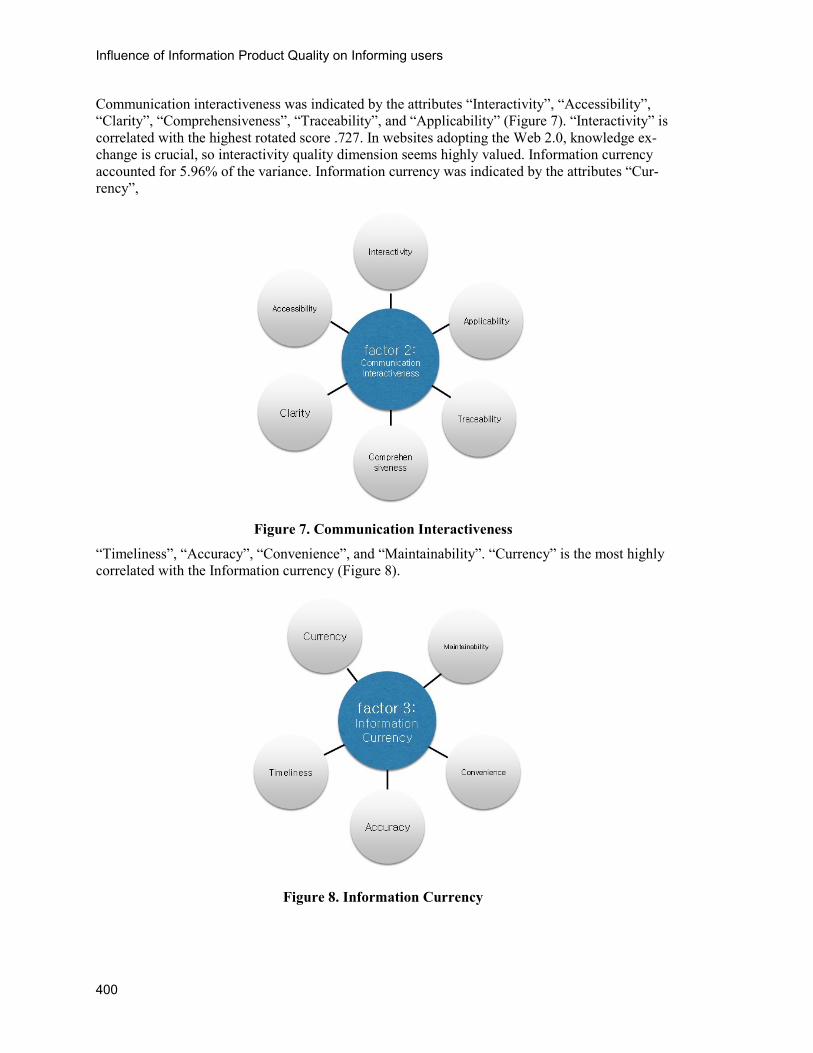
Content relevancy was indicated by the attributes “Correctness”, “Consistency”, “Tangibility”, “Security”, “Conciseness”, and “Empathy” (Figure 6). “Correctness” is most highly correlated with factor 1 with rotated loading score .700. Communication interactiveness explained 6.61% of total variance.
Figure 6. Content Relevancy
Influence of Information Product Quality on Informing users
400
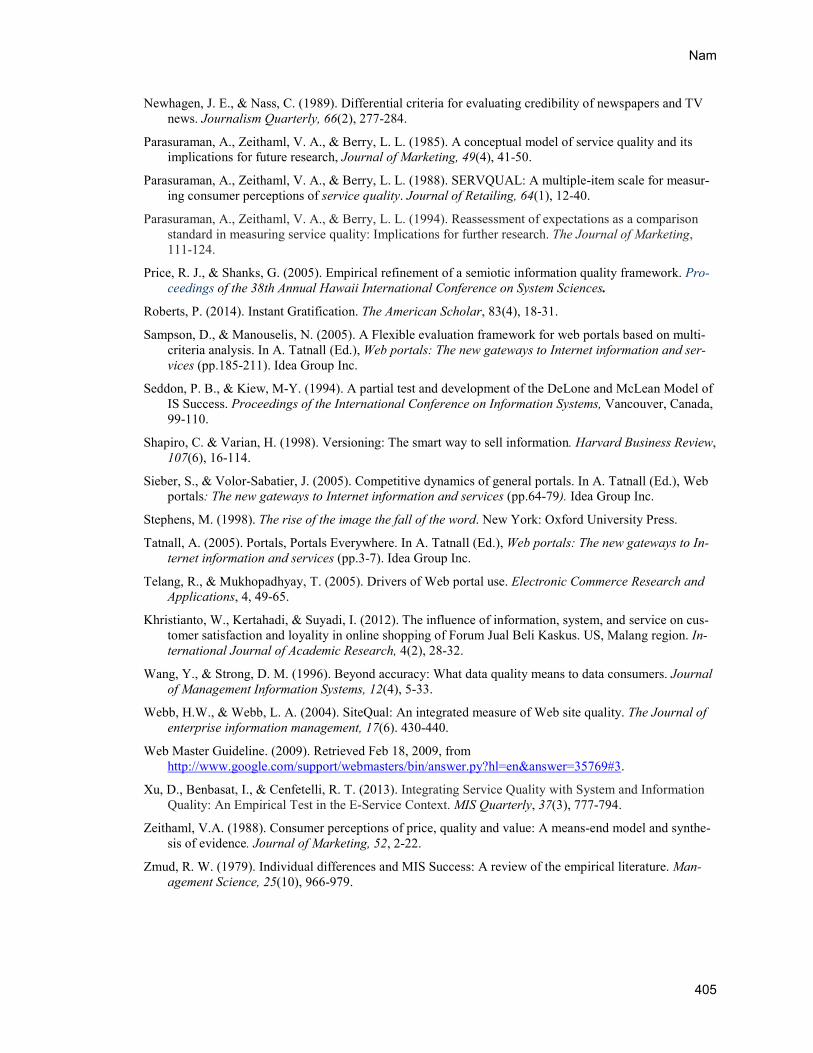
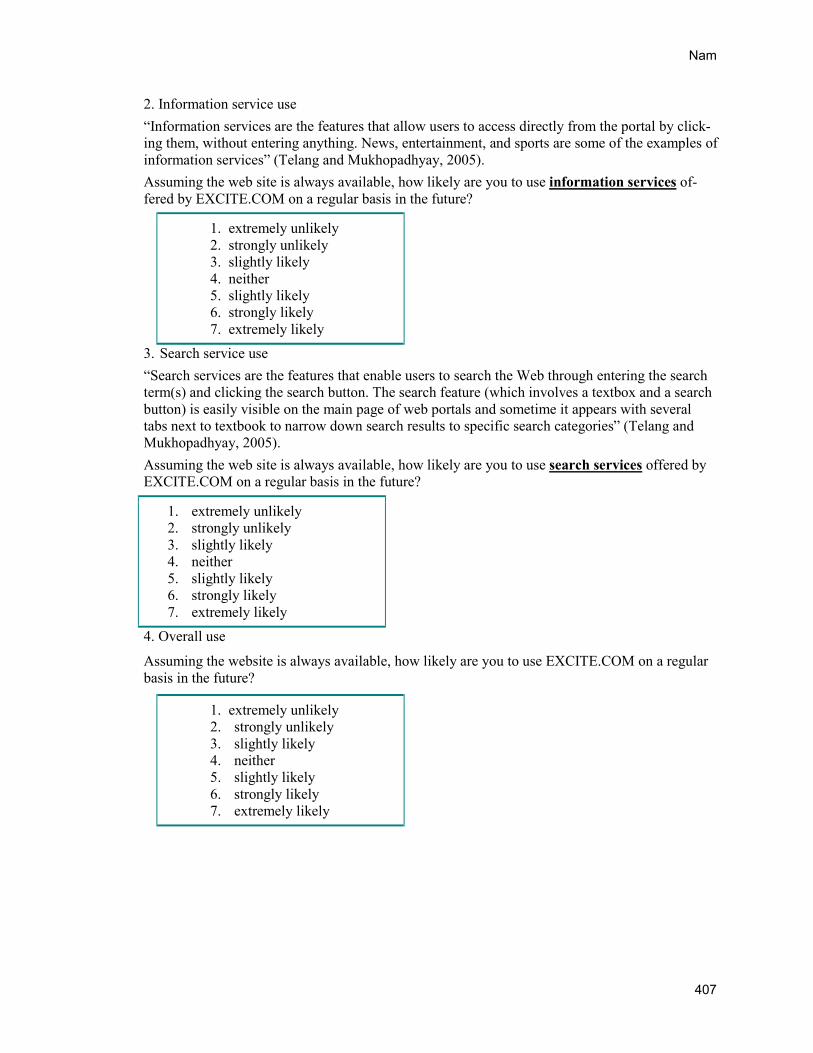
Communication interactiveness was indicated by the attributes “Interactivity”, “Accessibility”, “Clarity”, “Comprehensiveness”, “Traceability”, and “Applicability” (Figure 7). “Interactivity” is correlated with the highest rotated score .727. In websites adopting the Web 2.0, knowledge ex-change is crucial, so interactivity quality dimension seems highly valued. Information currency accounted for 5.96% of the variance. Information currency was indicated by the attributes “Cur-rency”,
Figure 7. Communication Interactiveness
“Timeliness”, “Accuracy”, “Convenience”, and “Maintainability”. “Currency” is the most highly correlated with the Information currency (Figure 8).
Figure 8. Information Currency

Nam
401
Figure 9. Instant Gratification
Instant gratification represented 5.48% of the variance and consisted of the attributes “Speed”, “Reliability”, “Assurance”, and “Responsiveness”. “Speed” is the most highly correlated attribute to Instant gratification (Figure 9).
This result is different from the theoretically proposed three components of web portal quality: information, physical, and service. Data did not support the conceptually developed information product quality structure. Even though the conceptually developed information product quality consists of three components, it was found out that people perceived quality of web portal in a different framework.
In web portal uses, this study found that Communication Interactiveness and Instant Gratification are the most importantly perceived qualities that affect the intention-to-use a general web portal. Instant Gratification is a phenomenon of our whole socieoeocnomic system in that people are pursuing for short and efficient returns (Roberts, 2014). This impulsiveness must be most obvious on web portal as it enables people to pursue quick self-serving rewards without time and place restrictions. A general web portal, as an interactive communication channel, becomes a wonderful gateway of instant gratification whenever people seek specific information. Interactivity is one of defining characteristics of internet media.
Theoretical and Practical Contributions This study makes several contributions to the literature. First, web portal quality concept was ap-proached from the concept of information product quality. In this study, each attribute of the con-ceptually developed web portal quality model incorporating information, physical, and service components of information products was examined to find out the major factors of web portal quality in full extent. While the dimensions of informational, physical and service components of web portal quality were discussed in this study, few studies were approached from the concept of Information Product Quality in quality literature.
Therefore, few studies bring together all of the quality dimensions within a single study. In many studies, to explain the physical component, the term of ‘system quality’ (Jingjun, Benbasat, & Cenfetelli, 2013; Khristianto et al., 2012) and ‘media quality’ have been used (Eppler, 2003). To

Influence of Information Product Quality on Informing users
402
indicate informational components and physical components together, the terms of ‘data quality’ (Moraga et al., 2004; Webb &Webb, 2004) and ‘information quality’ (Eppler & Muenzenmayer, 2002; Price & Shanks, 2005; Wang & Strong, 1996) are used concurrently. In other studies (Jingjun et al., 2013; Khristianto et al., 2012), the term of ‘information quality’ indicates only the information component, excluding physical components. Jingjun et al. (2013) empirically tested the relationships among these three types of quality constructs (System, Information, and Service quality). In their study, System quality was not found to significantly influence Service quality, but it does significantly influence Information Quality, which influences Service Quality. This may leads to confusion to the readers. The concept of ‘Information Product Quality’ used in this study may clear of the confusion of the terms in information quality studies.
Second, given that the theoretical importance of integrating information, physical, and service components of information products (Alter, 2002), four quality factors were identified as the most important component of web portal quality in this study. Following the literature, this study iden-tified the attributes of web portal quality that are important to web portal users. Web portal quali-ty attributes were collected, and the importance ratings for these attribute were collected and structured into a hierarchical representation of web portal user’s needs. The four factors are la-beled (1) Content relevancy, (2) Communication interactiveness, (3) Information currency, and (4) Instant gratification. These factors are different from Webb and Webb’s study (2004). Their web site quality model was developed especially for Business-to-customer electronic commerce web sites. They found four minimum web site quality factors (reliability, assured empathy, per-ceived usability, and trustworthiness) and seven desired web site quality factors (reliability, as-sured empathy, perceived usability, trustworthiness, tangibility, navigability, relevant representa-tion, accuracy, and security). As the motivation to use a web portal quality is different, from the ecommerce websites, it seems that desired quality for web portal is also different from the quality factors of electronic commerce website.
A practical implication of this study relates to the design and development of successful web por-tals. Instead of looking for “tricks” (such as artificially creating irrelevant links or contents on the portal) to increase traffic, a portal that features up-to-date relevant news or contents, provides tools for communication interaction, and fast and reliable medium for information access would be expected to yield a higher value proposition to portal users. Also, articulation of these factors would help identify potential problems that may significantly promote or hinder use when web designers, managers, and users evaluate the quality of a general web portal.
Limitations and Future Research The gap between actual behavior and intention-to-use is a limitation of this study. Even though, actual behavior and intention-to-use are highly correlated, there always exist other variables af-fecting actual behaviors, such as social change, personal norm, personal habits, influence of situa-tions, and moral obligations.
Another limitation of this study comes from the fact that it employs a limited number of subjects, tasks, and only one example of web portal. The student sample may not represent public popula-tion, and the tasks cannot represent actual usage of web portals. For the elderly, different sets of quality dimensions may appear significant as the elderly feel more unsecure with registration pro-cedures and popup notices, and they may have more optical problems compared to younger gen-eration (Chou, Lai, & Liu, 2013)
Also, the web portal used in this study, EXCITE.COM, may not represent all general web portals as it is just one example of web portals. Therefore, the finding of this study may not be general-izable to other types of web portals, and other users. “After only” types of experiments are subject to the danger that the responses of individuals may not be controlled enough, so differences in

Nam
403
their responses may merely reflect individual variations, rather than patterns in web portal usages. If tests can be done before and after treatment, the study can fully control individual variations. However, since this study adoptied an “after only” test, it has some limitation that may not fully control for individual differences. This is a generic limitation of after only tests. According to Babbie (2007), by repeating the experiment several times using different groups of people in fu-ture studies will strengthen the confidence in the findings. Future research will shed more light on the generality of these findings. Future studies should be extended to other types of web portals such as a specific community portal or medical portal.
Conclusion The most significant finding in this study is the identification of the four important dimensions of quality factors (Content relevancy, Communication interactiveness, Information currency, and Instant gratification) perceived by users of web portals. Even though higher-level abstract dimen-sions could be developed to capture the meaning of perceived web portal quality, specific attrib-utes used to infer quality could not be generalized across information products (Zeithml, 1988). The quality attributes from the conceptual dimensions were thus rearranged to create four factors. This finding seems to corroborate the recent literature of the effectiveness or success of Web por-tals. Further studies will be necessary to test those new factors in different types of web portals.
References Abdulla, R. A., Garrison, B., Salwen, M., Driscoll, P., & Casey, D. (2002, August). The credibility of
newspapers, television news, and online news. Paper presented to the Mass Communication and Socie-ty Division, Association for Education in Journalism and Mass Communication, Miami, Florida.
Alter, S. (2002). Information system: The foundation of E-business (4th ed.). NJ: Prentice hall.
Anderson, J.C., & Gerbing, D.W. (1988), Structural equation modeling in practice: a review and recom-mended two-step approach. Psychological Bulletin, 103, 411-423.
Babbie, E. (2007). The practice of social research (11th ed.). Belmont, CA:Thomson Wadsworth.
Brynjolfsson, E., & Smith, M. (2000). Frictionless commerce? A comparison of Internet and aconventional retailers. Management Science, 46(4), 563-585.
Chou, W. H., Lai, Y., & Liu, K. (2013). User requirements of social media for the elderly: A case study in Taiwan. Behavior & Information Technology, 32(9), 920-937.
Cohen, E.B. (1999). Reconceptualizing Information Systems as a Field of the Transdiscipline Informing Science: From Ugly Duckling to Swan, Journal of Computing and Information Technology, 7(3), 213-219.
Cooper, R., & Zmud, R. W. (1990). Health care e-commerce and the Internet. Russ Coile’s Health Trends, 11, 1-3.
Davis, F. D. (1989). Perceived usefulness, perceived ease of use, and user acceptance of information tech-nology. MIS Quarterly, 13(3),319-340.
Davis, F. D., Bagozzi, R.P., & Warshaw, P.R. (1989). User acceptance of computer technology: A compar-ison of two theoretical models. Management Science, 35(8), 982-1103.
Delone, W., & McLean, E. (1992). Information systems success: the quest for the dependent variable. In-formation Systems Research, 3(1), 60-95.
Delone, W. H., & McLean, E. R. (2003). The DeLone and McLean model of information systems success: A ten-year update. Journal of Management Information Systems, 19(4), 9-30.
Dunn, S.C., Seaker, R.F., & Waller, M.A. (1994). Latent variables in business logistics research: scale de-velopment and validation, Journal of Business Logistics, 15(2), 145-172.

Influence of Information Product Quality on Informing users
404
Eppler, M. (2003). Managing information quality. Berlin:Springer-Verlag.
Eppler, M., & Muenzenmayer, P. (2002). Measuring information quality in the web context: A survey of state-of-the-art instruments and an application methodology. Proceedings of 7th International Confer-ence on Information Quality. MIT
Fishbein, M., & Ajzen, I. (1975). Belief, attitude, intention and behavior: An introduction to theory and research. Reading, MA: Addison-Wesley.
Fielding, R. T., Whitehead, E. J., Anderson, K. M., Bolcer, G. A., Oreizy, P., &Taylor, R. N. (1998). Web based development of complex information products. Communications of the ACM, 41, 8, 84-92.
Flanagin, A. J., & Metzger, M. J. (2000). Perceptions of Internet information credibility. Journalism and Mass Communication Quarterly, 77(3), 515-540.
Ginzberg, M. J. (1981). Early diagnosis of MIS implementation failure. Management Science, 27(4),459-478.
Gronroos, C. (1982). Strategic management and marketing in the service sector. Helsingfors: Swedish School of Economics and Business Administration.
Hanson, W. (2000). Principles of Internet marketing. Cincinnati, OH: South-Western College Publishing.
Hogue, J. T. (1987). A framework for the examination of management involvement in decision support systems. Journal of MIS, 4(1), 96-110.
Johnson, T.J., & Kaye, B. K. (1998). Cruising is believing: Comparing Internet and traditional sources on media credibility measures. Journalism and Mass Communication Quarterly, 75(2), 325-340
Kalyanaraman,S., Sundar, S., & Oliver, M.B. (2004). Customization and cognition: exploring the role of individual differences in Web portal, Annual Meeting of the International Communication Association, New Orleans.
Khristianto, W., Kertahadi, & Suyadi, I. (2012). The influence of information, system, and service on cus-tomer satisfaction and loyalty in online shopping of Forum Jual Beli Kaskus.us, Malang region. Inter-national Journal of Academic Research, 4(2), 28-32.
Kotler, P. & Bloom, P.N. (1984). Marketing professional services. New Jersey, NJ: Prentice Hall.
Kraut, R., Mukhopadhyay, T., Szczypula, J., Kiesler, S., & Scherlis, B. (1999). Information and communi-cation: Alternative uses of the Internet in households. Information Systems Research, 10 (4), 287-303.
Livari, J. (2005). An empirical test of the DeLone-McLean Model of information system success. Database for Advances in Information Systems, 36(2), 8-27.
Lockyer, K (1986). Service-A Polemic and Proposal. International Journal of Operations and Production Management, 6(3), 5-9.
Lynch, J. (1998). Web portals. PC Magazine, 17(19), 18-20.
Marck, R., Ravin, Y., & R.J. Byrd (2001). Knowledge Portals and the Emerging Digigal Knowledge Work-splace. IBM Systems Journal, 40(4), 925-955.
Media. (2007). Computer Desktop Encyclopedia. Computer Language Company Inc. Retrieved Mar 15, 2007, from http://www.answers.com/topic/media
Meisel, J. B., & Sullivan, S. T. (2000). Portals: The new media companies. Journal of Policy, Regulation, and Strategy for Telecommunications, Information and Media, 2(5), 477-486.
Moraga, M. A., Calero, C., & Piattini, M. (2004). A first proposal of a portal quality model. In IADIS In-ternational Conference, E-Society.
Nam, J. (2009). Web portal quality. 2009 IEEE International Conference on Service Operations, Logistics and Informatics, Chicago (July 22 – 24).
Nam
405
Newhagen, J. E., & Nass, C. (1989). Differential criteria for evaluating credibility of newspapers and TV news. Journalism Quarterly, 66(2), 277-284.
Parasuraman, A., Zeithaml, V. A., & Berry, L. L. (1985). A conceptual model of service quality and its implications for future research, Journal of Marketing, 49(4), 41-50.
Parasuraman, A., Zeithaml, V. A., & Berry, L. L. (1988). SERVQUAL: A multiple-item scale for measur-ing consumer perceptions of service quality. Journal of Retailing, 64(1), 12-40.
Parasuraman, A., Zeithaml, V. A., & Berry, L. L. (1994). Reassessment of expectations as a comparison standard in measuring service quality: Implications for further research. The Journal of Marketing, 111-124.
Price, R. J., & Shanks, G. (2005). Empirical refinement of a semiotic information quality framework. Pro-ceedings of the 38th Annual Hawaii International Conference on System Sciences.
Roberts, P. (2014). Instant Gratification. The American Scholar, 83(4), 18-31.
Sampson, D., & Manouselis, N. (2005). A Flexible evaluation framework for web portals based on multi-criteria analysis. In A. Tatnall (Ed.), Web portals: The new gateways to Internet information and ser-vices (pp.185-211). Idea Group Inc.
Seddon, P. B., & Kiew, M-Y. (1994). A partial test and development of the DeLone and McLean Model of IS Success. Proceedings of the International Conference on Information Systems, Vancouver, Canada, 99-110.
Shapiro, C. & Varian, H. (1998). Versioning: The smart way to sell information. Harvard Business Review, 107(6), 16-114.
Sieber, S., & Volor-Sabatier, J. (2005). Competitive dynamics of general portals. In A. Tatnall (Ed.), Web portals: The new gateways to Internet information and services (pp.64-79). Idea Group Inc.
Stephens, M. (1998). The rise of the image the fall of the word. New York: Oxford University Press.
Tatnall, A. (2005). Portals, Portals Everywhere. In A. Tatnall (Ed.), Web portals: The new gateways to In-ternet information and services (pp.3-7). Idea Group Inc.
Telang, R., & Mukhopadhyay, T. (2005). Drivers of Web portal use. Electronic Commerce Research and Applications, 4, 49-65.
Khristianto, W., Kertahadi, & Suyadi, I. (2012). The influence of information, system, and service on cus-tomer satisfaction and loyality in online shopping of Forum Jual Beli Kaskus. US, Malang region. In-ternational Journal of Academic Research, 4(2), 28-32.
Wang, Y., & Strong, D. M. (1996). Beyond accuracy: What data quality means to data consumers. Journal of Management Information Systems, 12(4), 5-33.
Webb, H.W., & Webb, L. A. (2004). SiteQual: An integrated measure of Web site quality. The Journal of enterprise information management, 17(6). 430-440.
Web Master Guideline. (2009). Retrieved Feb 18, 2009, from http://www.google.com/support/webmasters/bin/answer.py?hl=en&answer=35769#3.
Xu, D., Benbasat, I., & Cenfetelli, R. T. (2013). Integrating Service Quality with System and Information Quality: An Empirical Test in the E-Service Context. MIS Quarterly, 37(3), 777-794.
Zeithaml, V.A. (1988). Consumer perceptions of price, quality and value: A means-end model and synthe-sis of evidence. Journal of Marketing, 52, 2-22.
Zmud, R. W. (1979). Individual differences and MIS Success: A review of the empirical literature. Man-agement Science, 25(10), 966-979.

Influence of Information Product Quality on Informing users
406
Appendix: Questionnaire
A. Demographic information
1. What is your gender? ( )Male ( )Female
2. How old are you?_______ 3. What school year are you in?
( )Freshman ( )sophomore ( )junior ( )senior ( )post graduate 4. Have you ever used web portals? ( )yes ( )no 5. If you have, how long have you been using web portals?_________years. 6. Do you have experience with YAHOO.COM portal site? ( )yes ( )no 7. Do you have experience with LYCOS.COM portal site? ( )yes ( )no 8. Do you have experience with GO.COM portal site? ( )yes ( )no 9. Do you have experience with NETSCAPE.COM portal site? ( )yes ( )no 10. Do you have experience with MSN.COM portal site? ( )yes ( )no 11. Do you have experience with AOL.COM portal site? ( )yes ( )no 12. Do you have experience with EXCITE.COM portal site? ( )yes ( )no
B. Intention to use of the web portal
1. Personal service use Personal services are “customized features that require registration via entry of a username and password to access these services. They also let users customize their interactions with the site. Portals may offer various personalized services such as emails, chat rooms, bulletin boards, mes-saging services, and personalized home pages, etc” (Telang and Mukhopadhyay, 2005). Assuming the web site is always available, how likely are you to use personal services offered by EXCITE.COM on a regular basis in the future?
1. extremely unlikely 2. strongly unlikely 3. slightly likely 4. neither 5. slightly likely 6. strongly likely 7. extremely likely
Nam
407
2. Information service use “Information services are the features that allow users to access directly from the portal by click-ing them, without entering anything. News, entertainment, and sports are some of the examples of information services” (Telang and Mukhopadhyay, 2005). Assuming the web site is always available, how likely are you to use information services of-fered by EXCITE.COM on a regular basis in the future?
1. extremely unlikely 2. strongly unlikely 3. slightly likely 4. neither 5. slightly likely 6. strongly likely 7. extremely likely
3. Search service use “Search services are the features that enable users to search the Web through entering the search term(s) and clicking the search button. The search feature (which involves a textbox and a search button) is easily visible on the main page of web portals and sometime it appears with several tabs next to textbook to narrow down search results to specific search categories” (Telang and Mukhopadhyay, 2005). Assuming the web site is always available, how likely are you to use search services offered by EXCITE.COM on a regular basis in the future?
1. extremely unlikely 2. strongly unlikely 3. slightly likely 4. neither 5. slightly likely 6. strongly likely 7. extremely likely
4. Overall use
Assuming the website is always available, how likely are you to use EXCITE.COM on a regular basis in the future?
1. extremely unlikely 2. strongly unlikely 3. slightly likely 4. neither 5. slightly likely 6. strongly likely 7. extremely likely
Influence of Information Product Quality on Informing users
408
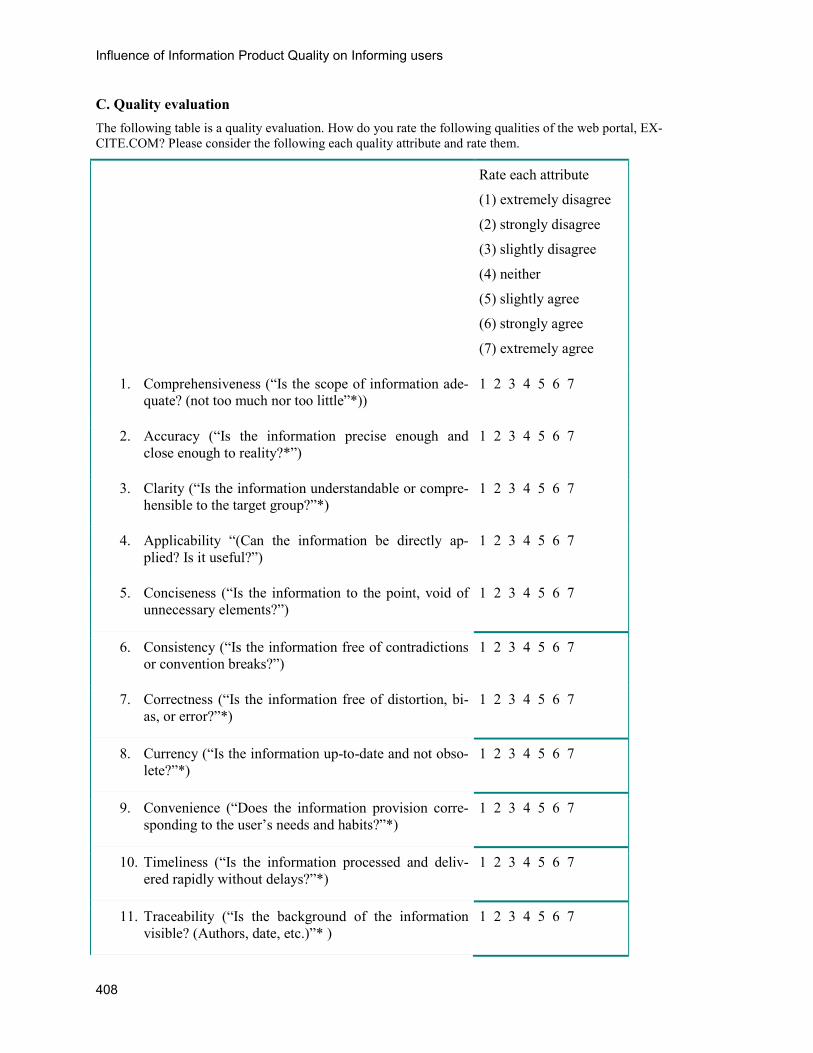
C. Quality evaluation
The following table is a quality evaluation. How do you rate the following qualities of the web portal, EX-CITE.COM? Please consider the following each quality attribute and rate them.
Rate each attribute
(1) extremely disagree
(2) strongly disagree
(3) slightly disagree
(4) neither
(5) slightly agree
(6) strongly agree
(7) extremely agree
1. Comprehensiveness (“Is the scope of information ade-quate? (not too much nor too little”*))
1 2 3 4 5 6 7
2. Accuracy (“Is the information precise enough and close enough to reality?*”)
1 2 3 4 5 6 7
3. Clarity (“Is the information understandable or compre-hensible to the target group?”*)
1 2 3 4 5 6 7
4. Applicability “(Can the information be directly ap-plied? Is it useful?”)
1 2 3 4 5 6 7
5. Conciseness (“Is the information to the point, void of unnecessary elements?”)
1 2 3 4 5 6 7
6. Consistency (“Is the information free of contradictions or convention breaks?”)
1 2 3 4 5 6 7
7. Correctness (“Is the information free of distortion, bi-as, or error?”*)
1 2 3 4 5 6 7
8. Currency (“Is the information up-to-date and not obso-lete?”*)
1 2 3 4 5 6 7
9. Convenience (“Does the information provision corre-sponding to the user’s needs and habits?”*)
1 2 3 4 5 6 7
10. Timeliness (“Is the information processed and deliv-ered rapidly without delays?”*)
1 2 3 4 5 6 7
11. Traceability (“Is the background of the information visible? (Authors, date, etc.)”* )
1 2 3 4 5 6 7

Nam
409
12. Interactivity (“Can the information process be adapted by the information consumer?”*)
1 2 3 4 5 6 7
13. Accessibility (“Is there a continuous and unobstructed way to get to the information?”*)
1 2 3 4 5 6 7
14. Security (“Is the information protected against loss or unauthorized access?”*)
1 2 3 4 5 6 7
15. Maintainability: (“Can all of the information be orga-nized and updated on an on-going basis?”*)
1 2 3 4 5 6 7
16. Speed: (“Can the infrastructure match the user’s work-ing pace?”*)
1 2 3 4 5 6 7
17. Assurances: (“able to convey trust and confidence”**) 1 2 3 4 5 6 7
18. Reliability: (“able to perform its functionality accurate-ly”**)
1 2 3 4 5 6 7
19. Responsiveness: (“willing to help and to provide it functionality in an immediate form to the users”**)
1 2 3 4 5 6 7
20. Assurances: (“able to convey trust and confidence”**) 1 2 3 4 5 6 7
21. Empathy: (“able to provide caring and individual atten-tion”**)
1 2 3 4 5 6 7
*adapted from (Eppler, 2003 ** adapted from (Moraga, Calero, Piattini, 2004)
Biography Dr. Junghyun Nam earned her Ph.D. in communication and infor-mation sciences with a focus on Management Information System from University of Hawaii at Manoa in 2008. She is a visiting professor at Ulsan National Institute of Science and Technology (UNIST), South Korea. Her recent research interests include user behaviors in the ac-ceptance of technology.