influence of grading on the value of fine aggregate …
TRANSCRIPT

INFLUENCE OF GRADING ON THE VALUE OF FINEAGGREGATE USED IN PORTLAND CEMENT CONCRETE ROAD CONSTRUCTION
By F. H. JACKSON, JR.,
Assistant Testing Engineer, Office of Public Roads and Rural Engineering, United StatesDepartment of Agriculture
THE PROBLEM
Everyone familiar with either the testing of cement concrete or itspractical use in various forms of construction realizes the marked effectvariations in the grading of the aggregates may have on its strength,density, and other properties. It is known, for instance, that, otherthings being equal, the use of a coarse sand combined with a uniformlygraded coarse aggregate will result in the production of a very muchbetter grade of concrete than will the use of either a fine sand, a poorly
. graded coarse aggregate, or both. The importance of this matter,with special reference to the use of concrete as a road-surfacing material,has been much emphasized recently before engineering societies andelsewhere. The conclusions so far drawn, however, are apparentlybased upon the generally accepted principle as applied to the ordinaryuse of concrete rather than upon definite tests made with the object ofdetermining the effect of variations in either the quality or grading ofthe aggregate on the resistance of concrete t~ the peculiar .destructiveforces encountered on a road. It is, of cQurse, apparent that these forcesare not only more severe but are more varied than those which actupon unreinforced concrete as ordinarily used, 'which is usually subjectedonly to direct compression.
Agencies particularly destructive to a concrete road are (I) traffic,(2) weather, and (3) constructional defects, all of-which produce stressesin the concrete which should be taken care of as completely as .possiblethrough an intelligent selection of materials as well as a proper observanceof the details of construction.
Traffic operates as a destructive for~e in three ways: (I) Iron tirescause an abrasion or grinding away of the particles composing thesurface of the pavement, which varies inversely with the hardness -ofthe concrete. (2) Suddenly applied loads, horses' hoofs, etc., subjectthe pavement to impact, tending to loosen and sometimes fracture theindividual fragments composing the aggregate, and is resisted by theproperty of toughness in the material. (3) The actual weight of trafficas transmitted by wheel loads produces also compressive,stresses proportional to the unit loads, but these are of much less importance in causing
Journal of Agricultural Research,WashingtoD J D. C.;b
Vol. X J NO.5July 30, 191 7Key No. D-u

Journal of Agricultural Research Vol.X,No.S
wear than are the stresses produced by abrasion and impact. The combined destructive effect of abrasion and impact therefore may be calledthe effect of weart so that any concrete which will successfully resistthese two forces may be said to possess high resistance to wear.
The influences of the weather tend to stress the concrete sometimes intension and sometimes in compression, either through the action oftemperature or moisture changes, or both t and usually result in the formation of cracks whose edges, unless adequately maintained, subsequently wear rapidly under the action of traffic.
Constructional defects usually re~ult in unduly stressing the concreteat some particular point, such as might be caused by settlement due toimproper consolidation of the subbase. Traffic undoubtedly is the mostimportant destructive agency in so far as the ultimate life of the road isconcerned, because its effects are cumulative and also serve to hastendeterioration started from other causes. With this point in mind, it follows that a detennination' of the suitability of concrete for use a,s a roadmaterial should be essentially a determination of its resistance to wear; .and, since resistance to wear means both resistance to abrasion andimpact, it wo~ld seem that hardness, and toughness tests, or a single testcombining both t should be logical ones to apply.
It is the purpose of this paper to present some. results obtained recently. in the laboratory of the Office of Public Roads and Rural .Engineering;
which show in a general way the possible effect of variations in· thegrading of fine aggregate on each .of these essential properties. Ofcourse t it is realizeq. that grading is only one of a number of properties
. of the aggregates which may influence the quality of the finished product.The character of the particles themselves, whether they are of a hardsiliceous ,or soft calcareous nature, as well·as the amount of impurities,organic or otherwise, present, is of the utmost importance. In thefollowing tests, however, these influences were controlled by, the use ofa standard aggregate which was artificially ,graded in the laboratoryprior to use.
In the case of rock used in macadam-road construction the nature ofthe material is such that its hardness and toughness may be determined readily, either by means of independent tests' or by means of awear test in which both, properties are measured. These tests havebecome well known, but,' because the principles involved have beenused in this ,vork t they will be discussed very briefly here. The hardness of a rock is determined by subjecting' a cylindrical specimen, prepared by means of a diamond drill, to the abrasive action of crushedquartz sand of a definite size. The rock cylinder is held against a horizontally revolving steel disk upon which the abrasive is fed. The lossin weight is determined after a given number of revolutions, and thisloss is used as an index of the hardness of the material.

July 30, Ii»t7 Influence of Grading on Value of Fine Aggregate 265
Toughness is measured by subjecting a cylindrical rock core, I by I
inch in size, to the impact produced by the fall of a given weight throughsuccessively increasing heights until failure occurs. .
The combined effects of both abrasion an~ impact are measured together by means of the well-known Deval abrasion test, in which a standard weight of material is rattled in a cast-iron drum in such a way thatthe pieces "composing the sample are subjected to both influences. Theweight of charge larger than a certain size after a given number of revolutions measures the resistance to wear. '
From a consideration of these tests it is seen at once that, with theexception of rock or slag, they are not adapted to a direct determinationof the quality of concrete aggregates. The Deval test in modified formhas been used to determine the resistance to wear of gravel and sand,but its use for this purpose, though promising, still is in the experimental,stage. It is manifestlx impossible to test the wearing qualities of fineaggregates directly by any of these methods. Eith~r the hardness or
. toughness test or a wear test may, however, be applied to the fineaggregate when combined with cement to form a mortar or with cement andcoarse aggregate to form "concrete. Wear "tests of mortar and concretehave been made with the Deval machine, the Tablot-Jones brick rattler,and other special devices. Of these the adaptation of the brick rattleras described by Abrams 1 appears to be the nearest solution of the problem of obtaining a laboratory wear test. Only preliminary results oftests using this method have been published. Wear tests of concreteinplace on the road have been confined largely to suggestions for suitablemethods, although tests using the apparatus designed by Goldbeck 2
have been, started on an experj.mental concrete road near Washington,D.C.
EXPERIMENTAL WORK
In the following tests the effect of varying the grading of sand on thehardness, toughness, tensile strength, and crushing strength of mortarshas been studied. The fine aggregate was prepared by artificially grading a quantity of Potomac River concrete sand, the analysis of which isshown in Table I into three sizes as follo,vs:
(1) A coarse sand (C) composed of equal parts of material passing a.u-inch screen but retained on a lo-mesh sieve and that passing a 10
mesh 'but retained on a 2o-mesh sieve.(2) A medium sand (M) composed of equal parts of 20 to 30 mesh,
30 to 40 mesh, and 40 to So mesh material.(3) A fine sand (F) composed of the run of the sand below No. so.
1 ABRAMS, D. A. A MBTHOD OF MAKING WEAR TESTS OF' CONCRE'l'S•. In Amer. Soc. Testing MaterialsProc. 19th Ann. Meeting, 1916, V. 16, pt. 2, p. 194-202. 1916. "
J GoLDBBCK, A. T. APPARATUS FOR MEASURING THEe W8AR 0' CONCRll'l'B ROADS. In Jour. Agr. Research, v. 5, no. 20, p. 9SI-gS4, pI. 66. I916.
266 Journal of Agricultural Research
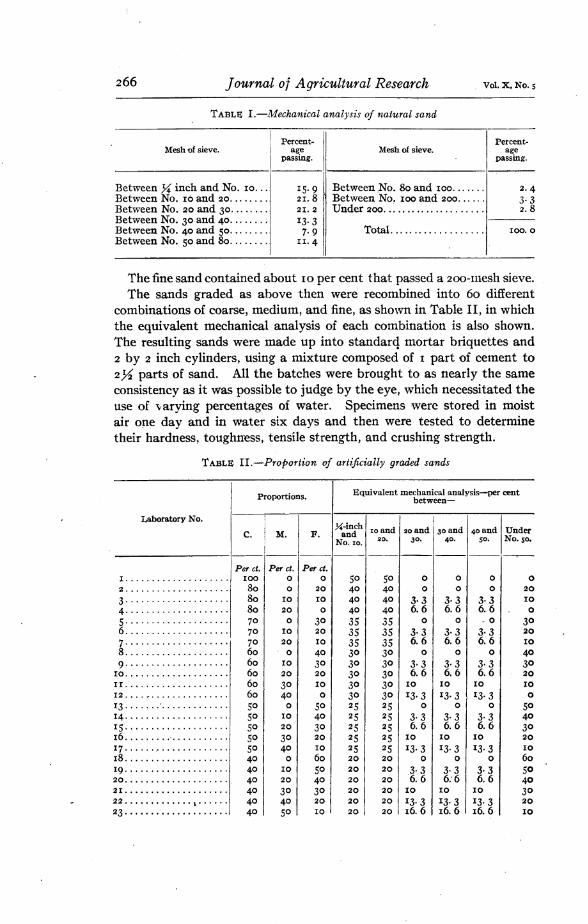
TABLE I.-Mechanical analysis of natural sand
Vol. X. No. s
Percent-
I
Percent-Mesh -of sieve. age Mesh of sieve. age
passing. passing.
Between ~ inch and No. 10... 1$·9 Between No. 80 and 100....... 2·4Between No. 10 and 20........ 21. 8 Between -No. 100 and 200.•.... 3·3Between No. 20 and 30........ 21.2 Under 200.• ~ .................. 2.8Between No. 30 and 40........ 13·3Between No. 40 and 50........ 7·9 Total ................... 100.0Between No. 50 and 80........ II. 4
The fine sand contained about 10 per cent that passed a 2oo-tuesh sieve.The sands graded as above then were recombined into 60 different
combinations of coarse, medium, and fine, as sho\vn in Table II, in whichthe equivalent mechanical analysis of each combination is also shown.The resulting sands were made up· into standarq. mortar briquettes and2 by 2 inch cylinders,using a mixture composed of· I part of cement to2,U parts of sand. All the batches were brought to as nearly the sameconsistency as it was possible to judge by the eye, which necessitated theuse of ·varying percentages of water. Specimens \vere stored in moistair op.e day and in water six days and then were tested to determinetheir hardness, toughn-ess, tensile strength, and crushing strength.
TABLE Ir.-Proportion of artificially graded sands
Proportions. Equivalent mechanical analysis-per centbetween-
Laboratory No.~-inch
C. M. F. and Ioand 20 and 30 and 40 and UnderNo. 10.
20. 30. 40 • so. No·so.
---------------,-Per ct. Per ct. Perct.
I .................... 100 a 0 50 $0 0 0 0 02 ..................... 80 0 20 40 4° ° 0 0 203· ................ , .. 80 IO 10 40 40 3·3 3·3 3·3 104·················· .. 80 20 0 40 40 6.6 6.6 6.6 0
5···· .. ·············· . 7° ° 30 35 35 0 0 .0 306..................... 7° 10 20 35 35 3·3 3·3 3·3 20
7···· .. ····· .. ····· .. ·· . 7° 20 10 35 35 6.6 6.6 6.6 108 ................. , .. 60 0 40 3° 3° 0 0 0 409 ................... c•• 60 IO 3° 3° 30 3·3 3·3 3·3 30
10..................... 60 20 20 3° 30 6.6 6.6 6.6 20I I.'••............. , ... 60 3° 10 3° 30 10 10 10 1012 .... "' ......... , ..... 60 40 0 3° 3° 13·3 13· 3 13·3 013· ., .. ,,', , ,. , ........ 5° 0 5° 25 25 0 ° 0 5014···,·,···········,· . $0 10 4° 25 2S 3·3 3·3 3·3 40IS· .......... , . , ...... $0 20 30 25 25 6.6 6.6 6.6 3°16......... '..... , ...... 50 30 20 25 25 10 10 10 2017· ..... " ............. So 40 10 2S 25 13·3 13·3 13·3 1018 .................... 40 0 60 20 20 ° 0 0 6019· ................... 4° 10 5° 20 20 3·3 3·3 3·3 5020 .................... 4° 20 40 20 20 6.6 6:6 6.6 4021 .................... 4° 3° 3° 20 20 10 10 10 3°22 ............. \ ...... 40 4° 20 20 20 13·3 13·3 13·3 2023··················· . 40 50 10 20 20 16.6 16.6 16.6 10

;'
July JO, 1911 Influence of Grading on Value of Fine Aggregate 267
TABLE II .-Proportion of artificially graded sands--continued
PropOrtions, Equivalent mechanical analysis-per centbetween-
Laboratory No. IX-inch
10 and i20 and 30 and 40 and Un<kTC. M. F. andNo. 10.
20. 30. 4°· 5°. No·fo.
----------------Per ct. Pe1' ct. Per ct.
24··,··· '.. ,', ......... 40 60 a 20 20 20 20 20 0
25·,· ................. 3° 0 7° IS IS 0 0 0 7°26 ................ , ... 3° 10 60 IS IS 3·3 3·3 3·3 6027··· ................. 3° 20 5° 15 15 6.6 6.6 6.6 5°28., .................. 3° 30 40 15 IS 10 10 10 4°29···················· . 30 40 3° IS IS 13·3 13·3 13· 3 30
3°··················· . 3° 50 20 IS IS 16.6 16.6 16.6 203 1 .................... 30 60 10 IS 1$ 20 20 20 10
32 ., .................. 20 0 80 10 10 0 0 0 80
33···············,··· . 20 10 7° 10 10 3·3 3·3 3·3 7°34··················· . 20 20 60 10 10 6.6 6.6 6.6 0035··· ................. 20 3° 5° 10 10 10 10 10 5036 .................... 20 4° 40 10 10 13·3 13·3 13· 3 40
37··· ............ " ... 20 50 30 10 10 16.6 16.6 16.6 3038 .................... 20 60 20 10 10 20 20 20 20
39··················· . 20 70 10 10 10 23·3 23·3 23·3 10
4°··················· . 20 80 0 10 10 26.6 26.6 26.6 0
41 .................... 10 0 9° 5 5 0 0 a go42 ........ ,., ......... 10 10 80 5 5 3·3 3·3 3·3 80
43··················· . 10 20 70 5 5 6.6 6.6 6.6 7°44··················· . 10 30 60 5 5 10 10 10 60
45··················· . 10 40 5° 5 5 13·3 13·3 13· 3 5°46 .................... 10 5° 40 5 5 16.6 16.6 16.6 4°47·········,········· . 10 60 3° 5 5 20 20 20 3°48 .................... 10 70 20 5 5 23·3 23·3 23·3 20
49··················· . 10 80 10 5 5 26.6 26.6 26.6 10
5°·,················· . 0 0 100 0 0 0 0 0 100
51 .................... 0 10 9° 0 0 3·3 3·3 3·3 9°52 ... " ............... 0 20 80 0 0 6.6 6.6 6.6 80
53······· .............. 0 30 70 0 0 10 10 10 7°54················· ".'. 0 40 60 0 0 13·3 13·3 13·3 6055· ................... 0 50 50 0 0 16.6 16.6 16.6 5°56 .................... 0 60 40 0 0 20 20 20 4057· ................... a 7° 3° 0 0 23·3 23·3 23·3 3058 ... , ............ , ... 0 80 20 0 0 26.6 26.6 26.6 20
59·,················· . 0 90 10 0 0 30 3° 30 1060 .................... 0 100 0 0 0 33·3 33·3 33·3 0
HARDNESS TESTS
Specimens for the hardness tests were prepared by drilling I-inch coresthrough the center of the 2-inch cylinders and drying them thoroughlyin a hot-air oven. They were tested then for hardness in the samemanner as the hardness of rock is obtained, as described above, byholding the ends of the specimens against a revolving steel disk uponwhich quartz sand was fed as the abrasive. The specimens wereweighed carefully before and after 1,000 revolutions of the disk, and the·loss in weight was used as an index of the hardness of the mortar. Theresults of the hardness tests on all the sand mixtures studied are shown
989760-17-5
268 Journal at Agricultural Research. Vol. x. NO.5
\.b~
/ ../"\1\,eq,
. I 70 k-~Il;--:lIr-----\'
""".it 6",...-----;'t----,~~~~;I 5CIr;----ji;-----7t(----*"--¥----\
,.,f 4o~~-~-~-_¥_-~-..:l/__~l
IJ.vti:' Jot;------'r-~-~--¥---*--~-4:
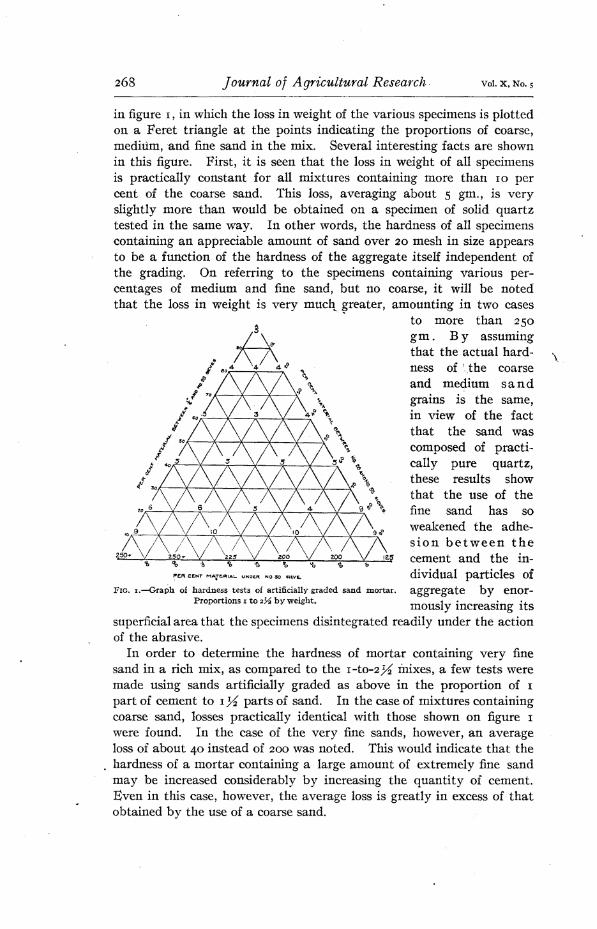
in figure I, in which the loss in weight of the various specimens is plottedon a Feret triangle at the points indicating the proportions of coarse,medium, "and fine sand in the mix. Several interesting facts are shownin this figure. First, it is seen that the loss in weight of all specimensis practically constant for all mixtures containing more than 10 percent of the coarse sand. This loss, averaging about 5 gm., is veryslightly more than would be obtained on a specimell of solid quartztested in the same way. In other words, the hardness of all specimenscontaining an appreciable amount of sand over 20 mesh in size appearsto be a function of the hardness of the aggregate itself independent ofthe grading. On referring to the specimens containing various percentages of medium and fine sand, but no coarse, it will be notedthat the loss in weight is very mucq, greater, amounting in two cases
" to more than 250
gm . B y assumingthat the actual hardness of ',,the coarseand medium sandgrains is the same,in view of the factthat the sand wascomposed of practically pure quartz,these results showthat the use of thefine sand has soweakened the adhesion between thecement and the individual particles of
FIG. I.-Graph of hardness tests of artificially graded sand mortar. aggregate by enor-Proportions I to 2~ by weight. l·· ·mous y InCreasIng Its
superficial area that the specimens disintegrated readily under the actionof the abrasive.
In order to determine the hardness of mortar containing very finesand in a rich mix, as compared to the I-to-2U mixes, a few tests weremade using sands artificially graded as above in the proportion of I
part of cement to I~ parts of sand. In the case of mixtures containingcoarse sand, losses practically identical with those shown on figure I
were found. In the case of the very fine sands, however, an averageloss of about 40 instead of 200 was noted. This would indicate that the
. hardness of a mortar containing a large amount of extremely fine sandmay be increased considerably by increasing the quantity of cement.Even in this case, however, the average loss is greatly in excess of thatobtained by the use of a coarse sand.

]UlY30,I91 7 Influence of Grading on Value of Fine Aggregate 269
100
100
10 zo ~ 40 60 60
PCR 'C£NT SAND OVE.R .2,0 SI£.VE..
,-,
o
" . HARDNE.5S-' Sand Mortars
Showinq eff~et of GrQdinq orSand.
Aqe-7days in waterMix - 1:2Y2. by Weight.-
-J5'
J
8 ~
20
HARDNE.SS5Qnd Mortor5 '
ShoWIng effect t?f r:, Cement I
In MOLAge -7day5 tn water.
COarse Concrete 5and Used.
~
1;1' * ~H5 ~ j;' ~
="
., :: ~-..... v =-"'~I
~ ~~
S ~ I
Pc.A GE.NT CE:.MC,NT IN MIX.
PIG. 3.-eurve of hardness tests of natural concrete sand mortars.
:>lJu::oo2I
In figure 2 the results of the I-tO-2.% mortar tests are shown plottedon rectangular coordinates with the percentage of sand over 20 mesh asabscissre and the loss in weight per 1,000 revolutions as ordinates. Eachpoint plotted represents the average of the results on all values obtainedoriginally with the percentage of coarse sand as indicated. For instance,the average of all combinat~ons of mediumand fine sand with 20
'S'per cent coarse showed ~
a loss of 6 gm., and this ,Ivalue is plotted on the
~
curve. This graph xishows the great effect
of coarse sand on the itJ·
hardness of mortar. ~,
'T h e correspondingcurve (not shown) forthe hardness of I-tO-
FIG. 2.-Curve of hardness tests of artificially graded sand mortar.l.u mortars was foundto be practically identical, except that the average loss for mortars containing no percentage of sand over 20 mesh was 40 insteadof 200.
Figure 3 shows the results of a number of hardness tests made on asertes of mortar specimens, in which the grading of the sand remained
constant and the percentage of cementvaried. In these teststhe unscreened Potomac River sand, similar in quality to theartificially g r ad e dsands, was used. Itwill be seen. that thehardness values of themortar specimens areall greater than neatcement. Further ...more, there is very
little difference in the loss in weight between the 1-tO-1, 1-tO-1 X, l-tO-2,
and l-to-3 mixes, all of which show about the same hardness as wasobtained with the artificially graded coarse sands.. The somewhatgreater loss sustained by the l-to-4 mortar specimen, no doubt, is dueto the very lean mix,which allowed the mortar to disintegrate under thetest in much the same way as npted above for very fine sand.

27° Journal of Agricultural Research
TOUGHNESS TESTS
Vol. X J NO.5
Toughness tests were made on 2- by 2-inch cylinders, using the Pageimpact machine for testing < rock. The procedure was similar to thatemployed in the standard rock test, except that a 2-inch instead of aI-inch cylinder and a U instead of a 2 kgm. hammer were used. Thetest consisted of a I-cm. fall of the ha~mer for the first blow, followedby a 2-cm. fall, etc., until the cylinder was fractured. The height ofblow at failure in centimeters was used as ap indication of the relativetoughness of the mortar. The results of tests are plotted in figure 4,using the Feret triangle. Each result plotted is the average of threetests. An inspection of the diagram shows at once that considerablevariation in toughness may be obtained, owing to differences in sand
grading, but that, ingeneral, toughness in~
creases with the per~
centage of coarse sandin the mix. The contour lines, which boundareas of equal toughness, show in a generalway the relative resistance to impact developed by the use of different mixtures. Thearea of maximumtoughness is seen at thetop of the triangle andincludes sand having
~ ctNT HAT~"IAL,. ""af\ NO.50 StCt'C.. from 60 to 90 per centFIG. 4.-Graph of toughness tests of artificially graded sand mortar. of coarse, from 0 to 20
Proportions I to 2'" by weight.per cent of medium,
and from 5 to 35 per cent of fine material. The area of minimum toughness,as would be expected, lies toward the lower left-hand comer and includesthe very fine sands. It maybe noted also that, with a given percentageof coarse sand, say 50, the highest results were obtained when the proportions of medium and fine sand were about equally divided. On theother hand, for a given percentage of either medium or fine sand, thetoughness appears to increase as the proportion of coarse sand increases.In general, it would seem that the toughness of a cement mortar increaseswith the amount' of coarse sand present in the aggregate up to the limitof maximum toughness, which, for this mix appears to be obtained witha sand having about 80 per cent of coarse, 10 per cent of medium, and 10
per cent of fine material. The general effect of coarse sa.nd on toughnessis shown clearly in figure 5, which is replotted from the results shown

July 30_ 1917 Infiuence of Grading on Value 0t Fine Aggregate 27 1
P~A CE.NT C01EI"lT IN MI)(.
fO zo ,",0 4Q ~ 60 70 eQ $0 100
TOOGHNE:S550nd Mort'ors
.5howJ"9 .ffe.ct of %Cement .in M~x.
Age - 14 OcJY5 in Wot~~Coarse ConCf"ete Sand Used•.
V ~
.."PV
-I~
in figure 4 in the same way as the results of the hardness tests previouslyreferred to.
A series of tests made with the view of determining the effect ofrichness of mix on the toughness of cement mortar are shown, for comparison, , in figure 6. The results are plotted with the percentage ofcement as abscissre and toughness as ordinates. Each plotted resultis the average of ninet~~. Theseresuhsare ~.~~~~~~~~~~~~~~~~~~
of interest in showing gthe large increase in ; a
¥g~ .,,-J~~
toughness produced by 3"l~ TOUGHNE55
increasing the cement ~ 1Zt.7t--+-':'"f---t-"'-'+--+--+---+~ Sand Mortar~content. This increase ~ ~. .~owtng .~:~~ or. Grading of
lD ~ Age -7 0c:Jy$ in Water.appears to be practi- ~~JO MiX -1:Z.}ibvWelaht.
cally proportional to the 8pereentageofcementup ~ ~~~~~.~~~~.~~~~~~~~~~~
10 20 30· 40 W' 60 '. ,70 00 80 100
to a I-tO-I mix, after PEft'CC!"IT: :It'NO pYEI\.~M~H.
which the addition of FIG. s·-Curve of toughness tests of artificially graded san:d mortar.
more cement affects the toughness very little. In other words, a neatcement briquette is no tougher than one composed of equal parts ofcement and a typical concrete sand, which, in turn, shows twice theresistance to impact of one containing only 20 per cent. Inasmuch asthis sand was very well graded and contained only 35 per cent of voids,it is obvious that a considerable excess of cement over that required to
fill the voids is requiredto reach the conditionof maximum toughness.In other words, theseresults present an experimental verificationof the theory. which requires the use of a richmix in the surface of aconcrete pavement, es-
FrG. 6.-Curve of toughness tests of natural concrete sand mortar. peciallyas has been seen
by reference to the hardness test shown in figure 3 that the hardnessof a rich I-tO-IU' mix is practically the same as a I-to-3 and greaterthan a I-to-4 mix.
TENSION AND COMPRESSION TnSTS
The results of the tension and compression tests are shown in figures7 and 8. They were made in the usual way on standard briquettes and2 by 2 inch cylinders. Each value in tension is the average of six tests,

2j2 Journal of Agricultural Research Vol. x, NO.5
and each value in compression the average of three tests. The averagetotal variation in individual results of each set was 10 per cent for tension
and 5 per cent for compression. The re suI t sshow graphically theenormous va ri a tionwhich may be obtainedin both the tensile andcompressive strength ofmortar by reason ofvariations in the grading ofthe sand. The contourlines are much moreregular than those showing variations in toughness. The followingpoints may be noted:
TSNSIoN.-Sand sshowing maximum re
FIG. 7.-Graph of tension tests of artificially graded sand mortars. suIts in tension are comProportions I to 2~ by weight.
posed of from 60 to 80per cent coarse, 0 to 20 per cent medium, and 10 to 30 per cent fine,whereas the weakest sands are those composed of from 0 to 10 per centcoarse, 0 to 20 per centmedium, and 80 to 100
per cent fine. A sandcomposed of 100 percent coarse is 35 percent stronger than onecomposed of mediumonly and-So per centstronger than one composed of fine only, butis nearly 40 per centweaker than the sandof maximum strength(70-10-20). The totalvariation in strength is250 pounds per squareinch, or 54· per centfrom the average of FIG. B.-Graph of compression tests of artificially "graded sand mortars.
Proportions I to 2~ by weight~the 60 detenninations.
COMPRESsIoN.-Sands showing maximum results in compression arecomposed of from 60 to 80 per cent coarse, 0 to 20 per cent medium an,d10 to 30 per cent fine, the same limits as for tension. A sand composed

July 30, I91 7 Influence at Gradi'ng on Value of Fine Aggregate 273
.-0 ...
~~ '~V V .........
V V Tf".N5ILE: .5TRf:NGTH5and Mortars
ShowIng effect C1f Grading atSand.
Mix - t:Z)i by Wt.
.0 to ,30 0 :;0. 60 70 80 :10 100·
, ........
//" !'-.--....c
...... / CRU5HING 5TRf:NGTH
~r'""and Mortar.,5
~Showin9 effec1' of Grading of
Sand;MIx - 1:2}7, by Wt.
a1000.J
of 100 per cent coarse is 95 per cent stronger than one composed of fineonly, but is 35 per cent weaker than the strongest sand (70-0-30). Thetotal variation in strength is 2,505 pounds per square inch, ot 100 percent from the average of 60 determinations.
In figures 9 and 10 the results of the tension' and compression tests arereplotted on rectangular coordinates to show the effect of the coarse sandC}i inch to No. 20 mesh) on the strength of the mortar. The most interestingfeature about thesecurves, a pa rt fromtheir regularity, is the i 300
very great variation ~
in strength shown, es- i ,"00
«pecial1y in compres- ~
sian. Thus, without : tOO
considering either the oJ
very coarse or very fine 0
sand, which would be PUt ceNT SAND O\lUl .ZO MUH.
used rarely in actual FIG. 9 ..~urve of tension tests of artificially graded sand mortars.
construc.tion, the variations, in strength are still large. Let it be assumed, for instance, that a specification calls for a sand which shallshow from 20 to S0 per cent retained on the No. 20 sieve. The results ofthese tests show a possible variation in c011lpression of from 1,200 to 2,000
pounds per square inch for sands fulfilling this requirement. They showalso that much higher strength may be obtained in the mortar by the useof coarser sands up to as high as 70 per cent retained on a 20-mesh sieve.
It is realized, of course,that such coarse sandsseldom are met within practice and, if theywere, would not beused' in ordinary workwhere a considerableamount of fine materialis needed to produce
peA ceNT aAND oveR ·2.0 M~H. workability. It mustFIG. Io.-Curveof compression tests of artificially graded sand mortars. be borne in mind, how-
ever, that concrete-pavement construction is not ordinary work on account of the severity and variety of the destructive forces encountered.It has been the custom to meet this condition by increasing the amountof cement to about 40 per cent of the mortar in a I-to-5 mix, and,while this is good practice, it seems reasonable to suppose that a stillgreater resistance to these destructi,,"'e agencies would be obtained byincreasing the amount of the coarse sand which takes this wear (the,Xi:' inch to 20-mesh material) over that which is usually considered good

274 Journal of Agricultural Res~arck Vol. x~ NO.5
practice. This would seem to be allowable, especially in view of thelarge excess of cement that is always used. When one considers that alarge proportion of the wearing surface of a concrete pavement is composed of mortar, the danger of using a fine sand, with subsequent weakening of the matrix, is apparent.
In the foregoing discussion it is realized that but few naturally occurringconcrete sands are as coarse as those making the strongest mortars, according to these tests. Neither has the fact been overlooked that thebestmortar, when combined with stone or gravel, without reference to itsgrading, will not necessarily produce the best concrete. A poorly gradedcoarse aggregate will unquestionably require more mortar than will awell-graded one. Likewise, a coarse aggregate containing a large amountof small stone will allow the use of a somewhat finer sand than when thelarger-sized stones predominate. When it is considered, however, thatthe mortar in concrete forms a matrix by which the larger stones are heldin place, that this matrix occupies nearly one-half the total voiume of theconcrete, and, finally, that its strength and toughness are undoubtedlyinfluenced to a large degree by the grading of the sand, the discussionbecomes of practical value. So important does it become that it mighteven be considered practical to use a graded rather than a naturallyoccurring concrete sand ·in such important work as concrete-road construction if by so doing the life of the pavement can be prolonged.
ADDITIONAL COPIESOF TIDS PUBLICATION MAY BE PROCURED noM.
THE SUPERINTENDENT OF DOCUMENTS
GOVERNMENT PRINTING OFFICE
WASHINGTON, D. C.
AT
25 CENTS PER COpySUBSCRIPTION PRICE, $3.00 PER YEAR
A