influence of certain socio …shodhganga.inflibnet.ac.in/bitstream/10603/7095/13/13_chapter 3.pdffor...
TRANSCRIPT
CHAPTER III
METHODOLOGY
3.1 Method Adopted
3.2 Variables of the Study
3.3 Sample Selected for the Study
3.4 Tools Used for the Collection of Data
3.5 Description of the Tools
3.6 Procedure for Data Collection
3.7 Statistical Techniques Adopted

Chapter III Methodology 92
METHODOLOGY
Educational research is the process of arriving at dependable
solution to problems through planned and systematic collection,
analysis and interpretation of data. Research methods are of utmost
importance in a research process. It occupies a decisive role in any
kind of research, as the validity and reliability of the findings depends
upon the methods adopted. The success of any research depends
largely upon the availability of the data and the suitability of the
method. By indicating the significance of methodology, Barr (1953)
pointed out that ‘The vehicle of the research cannot perform its
function without it, since it is methodology which lays out the way in
which research is to be carried out and outlines the detailed
description of research variables and procedures’. Research methods
describe the various steps of the plan of attack to be adopted in
solving the research problem such as the manner in which the
problem is formulated, the definition of terms, the choice of subjects
for investigation, the validation of data- gathering tools, collection of
data, analysis and interpretation of data and the process of inferences
and generalizations (Koul, 1997).
A suitable method helps the researcher to explore the diverse
stands of the study and adequately measure them so as to satisfy the
requirements and thus it is the means to an end.

Chapter III Methodology 93
This chapter is devoted to the description of the method of
investigation followed in the study. The method adopted, tools used,
description of tools, sample selected, procedure for data collection and
statistical techniques adopted for analyzing the data have also been
discussed in this chapter.
3.1 Method Adopted
The method adopted should always be valid, reliable and
appropriate to the nature of the problem under investigation and the
kind of data that the problem demands.
The study being the Influence of Certain Socio-Psychological
Factors on the Vocational Skill Attainment of Orthopaedically
Handicapped Adolescents, the Investigator has selected Normative
Method, in which Survey is the technique adopted for the collection of
data. The word normative is used because surveys are frequently
made for the purpose of ascertaining which is normal or typical
condition or practice.
The normative survey method is that method of investigation,
which attempts to describe and interpret what exist at present in the
form of conditions, practices, process, effects, attitudes, beliefs etc. It
is concerned with some phenomena that are typical or normal
conditions.
According to Good and Scates (1954), the term ‘Survey’
indicates the gathering of evidences relating to current conditions.

Chapter III Methodology 94
Different types of surveys help to establish the status of the
phenomenon under investigation. The purpose is to survey the
present conditions, understand relationships, and base future action
on the findings. Surveys can be confined to fact-finding on large
number of areas or they can be complex and sophisticated in design
providing accurate findings. Adoption of the survey method in the
present study helped the researcher to collect proper data from an
adequate number of Vocational Training Centres for Handicapped in
Kerala.
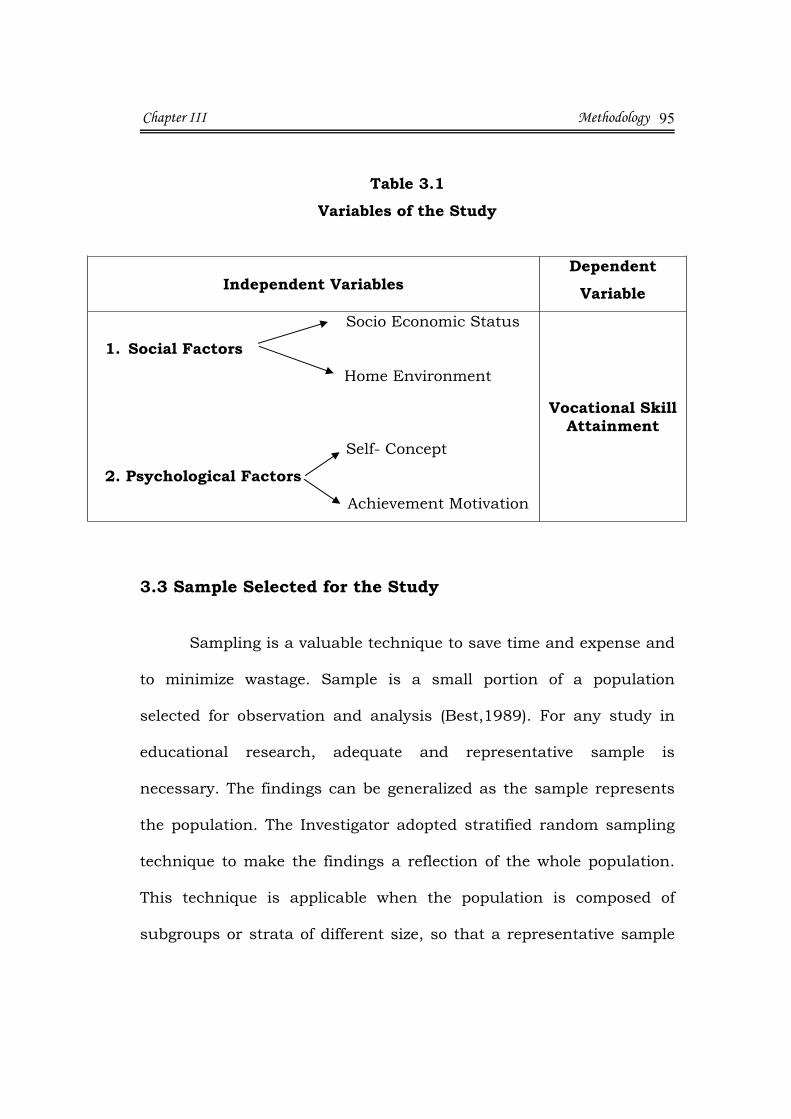
3.2 Variables of the Study
The study has been conceived with Vocational Skill Attainment
as dependent variable and the following Socio-Psychological Factors
as independent variables - (1) Social Factors has been operationalised
as the sum of scores of two factors viz, Socio-Economic Status (S.E.S)
and Home Environment (H.E) and (2) Psychological Factors has been
operationalised as the sum of scores of two factors viz, Self-Concept
(S.C) and Achievement Motivation (A.M).
Chapter III Methodology 95
Table 3.1 Variables of the Study
Independent Variables Dependent
Variable
Socio Economic Status
1. Social Factors Home Environment
Self- Concept
2. Psychological Factors
Achievement Motivation
Vocational Skill Attainment
3.3 Sample Selected for the Study
Sampling is a valuable technique to save time and expense and
to minimize wastage. Sample is a small portion of a population
selected for observation and analysis (Best,1989). For any study in
educational research, adequate and representative sample is
necessary. The findings can be generalized as the sample represents
the population. The Investigator adopted stratified random sampling
technique to make the findings a reflection of the whole population.
This technique is applicable when the population is composed of
subgroups or strata of different size, so that a representative sample
Chapter III Methodology 96
must contain individuals drawn from each category or stratum in
accordance with the size of sub-groups.
The Investigator at first carried out a preliminary trial on a few
Orthopaedically Handicapped Adolescents undergoing training in
typewriting in vocational training centres to get an idea about the
availability of the students to be selected for the study. At present
there are about 52 Vocational Training Centres for Orthopaedically
Handicapped in Kerala run by Government, Private and Voluntary
Organizations. The Investigator had selected the sample only from
Government Vocational Training Centers and from those institutions
which receive grant-in-aid from the Government. Such institutions
follow certain norms and regulations to admission, minimum
qualifications for an entry in the particular vocation, age limit,
duration of the course, examination procedures and certificate
issuance etc. The Investigator personally visited the Vocational
Training Centres and found that there are lot of opportunities for
Orthopaedically Handicapped in vocational skill training. Book
Binding, Typewriting, Stitching, Carpentry etc. are the courses
provided to them. Since majority of the orthopaedically handicapped
trainees are engaged in typewriting and also because of the fact that
the Investigator herself is qualified in the particular skill, it was
decided to select 200 Orthopaedically Handicapped Adolescents who
had selected typewriting as their vocation, from nine Vocational

Chapter III Methodology 97
Training Centres for Handicapped located in five districts of Kerala
viz., Trivandrum, Pathanamthitta, Ernakulam, Thrissur and
Kozhikode. A list of such Vocational Training Centres are given in
Table 3.2.
Table 3.2
List of Vocational Training Centres for the Handicapped Selected
for the Study
Sl.No.
Name of the Vocational Training Centres
Types of Management
Locality
1. Vocational Training Centre, Poojappura,Trivandrum.
Govt: Urban
2. Vocational Training Centre, Mayanad, Kozhikode.
Govt: Rural
3. Bethaniya Rehabilitation Centre for the Disabled Women, Kumarapuram, Trivandrum.
Aided Urban
4. Karthika Nair Smarak Samithi for Handicapped,Vallamkulam,Pathanamthitta.
Aided Rural
5. Santhigiri Rehabilitation Institute Thodupuzha, Idukki.
Aided Rural
6. The Kerala Rehabilitation for the Physically Affected, Kripa’s Province Home, Erumathala, Ernakulam.
Aided Rural
7. Alphonsa Home for Physically Handicapped Girls, Vadakkancherry, Thrissur.
Aided Rural
8. Sneha Bhavan Society, Irinjalakkuda,Thrissur.
Aided Urban
9. Santhi Bhavan Social Centre, Chalakkudy, Thrissur.
Aided Rural

Chapter III Methodology 98
The selected subjects were between the age group of 15 and 20
years. They were matched with regard to the degree of handicap, type
of vocational skill selected for training, age, intelligence, sex etc. Other
criteria for selecting them was determined as follows.
The children suffering from limb problem or lame or leg affected
either inborn or due to any disease or accident were taken from
different Vocational Training Centres for the Handicapped for the
study. Only students with mild handicap (below40%) were taken for
the present study. Their handicap was only in the lower part of the
body, i.e; from hip onwards. Except this mild handicap, they are
completely fit like normals. Only the Orthopaedically Handicapped
identified by orthopaedic surgeons regarding the degree of disability
(below 40%) were selected for the present study. The categorization of
orthopaedic disability according to the extent and severity are
presented in Table 3.3.
Table 3.3
Categorization of Degree of Disability
Category Degree of Disability
Mild
Moderate
Severe
Profound
< 40%
40% and above
70% and above
100%
Chapter III Methodology 99
The Vocational Training Centres provide two years training for
the typewriting course. On completion of the two years training, they
become proficient in the vocation. At the end of the course, trainees
also have to appear for the Kerala Government Technical Examination
(K.G.T.E.). The selected samples had already completed two years
training and were qualified for appearing the final examination.
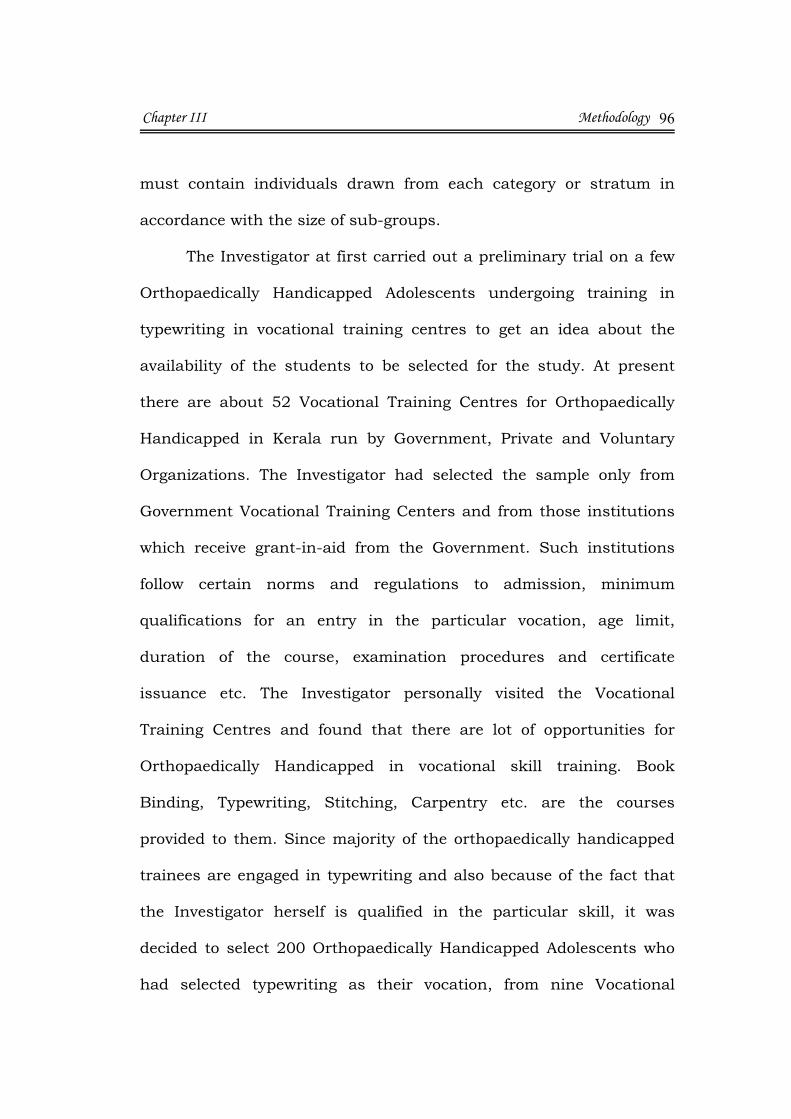
The total sample divided on the basis of sex and locality is given
below.
Table 3.4
Break-up of total sample selected on the basis of Sex and
Locality
LocalitySex Rural Urban
Total
Boys 65 35 100
Girls 65 35 100
Total 130 70 200
Proportionate weightage given to each strata such as rural and
urban is 2:1, and boys and girls is 1:1. These ratios show that for
each student in an urban institution, two students were selected from
a rural institution, and for every boy one girl was taken. Distribution
of the sample based on sex and locality of the institutions are
presented in Figure 3.1.

Chapter III Methodology 100
Figure 3.1
Distribution of the Sample based on Sex and Locality of the
Institutions
Figure 3.1 shows that 130 students (65%) were selected from
rural-based training centres and 70 students (35%) from urban-based
training centres. Equal number of boys and girls were selected as the
sample. From rural areas 65 boys and 65 girls were selected.
Similarly,35 boys and 35 girls were selected from the urban centres.
The rural and urban sample was distinguished on the basis of
the locality of the training centres and not on the basis of the place of
residence of the students. Those Vocational Training Centres which
Chapter III Methodology 101
are situated under panchayath administration were grouped as rural
and those under municipal administration were treated as urban.
3.4 Tools Used for the Collection of Data
Factual materials unknown so far are necessary for every
study. They can be obtained from many sources - direct or indirect.
Selection of suitable instruments or tools are also of vital importance
in every research study. According to Best (1989), “Like the tools in
the carpenter’s box, each research tool is appropriate in a given
situation to accomplish particular purpose.” For the purpose of
quantification of data related to the study, the following tools which
are prepared by the Investigator and also borrowed have been used.
I Vocational Skill Attainment Tests
1.Speed Test in Typewriting
2. Test for Typing Official Matters
3. Theoretical Awareness Test in Typewriting
4. Test for Identifying and Operating Parts of Typewriter
II Socio- Economic Status Scale
III To measure Home Environment, the following tools were used.
1. Family Environment Index Inventory
2. Family Cultural level Rating Scale
3. Home Learning Facility Inventory
4. Family Acceptance of Education Rating Scale.
Chapter III Methodology 102
IV Kerala Self-Concept Scale
V Kerala Scale of Achievement Motivation.
3.5 Description of the Tools
The detailed information about the tools used for collecting data
relevant for the present study are given below.
3.5.I Vocational Skill Attainment Tests For the purpose of the present study, the Investigator had
selected only one vocational skill, viz, skill in Typewriting and had
prepared four tests for measuring the subject’s skill in Typewriting. As
per the directions given by the experts, the Vocational Attainment
Tests is divided into four sections and four separate tests were
prepared to know the attainment of Orthopaedically Handicapped
Adolescents in the particular skill. Among them, two were for
measuring the speed, accuracy and neatness in typing the ordinary
and official matters. The remaining two tests were for measuring the
subject’s awareness about the typewriting and also for assessing his
or her skill in identifying and operating parts of the typewriter.
Vocational Skill Attainment refers to the level of student’s
aggregate performance in the particular vocation (Typewriting in the
present study) and it is determined by the marks obtained by the
students in the particular test meant for the purpose. So the
Investigator had prepared the following tests to measure the same.

Chapter III Methodology 103
(i) Speed Test in Typewriting
Preparation and Scoring
This was intended to test the accuracy, speed and neatness of
the work executed by the candidate. The Investigator personally
visited many Vocational Training Centres for consultation with
experts in the field. Investigator got immense help from the Director,
Kerala Government Technical Examination (K.G.T.E.), Trivandrum
regarding the preparation of the test. The test was prepared under the
guidelines given by the experts in the field. (List of experts attached in
Appendix XIX) and also with the help of K.G.T.E. rules and
regulations. General instruction was given to the candidates in the
Speed Test in Typewriting. The test contains a paragraph of 1500
strokes. The maximum marks for the paper was 100 and the
minimum for pass was 40. The speed test was of 10 minutes
duration. The paper was valued with the help of the scheme of
valuation prepared by the Investigator herself under the guidelines
followed by the K.G.T.E. The marks were awarded on the basis of the
prescribed chart.
The scheme of valuation contained 7 general instructions and
19 nature of mistakes that can be occurred while attempting Speed
Test in Typewriting. A chart showing the scoring procedure of the
Speed Test in Typewriting was also prepared by the Investigator in
which the total number of strokes, number of mistakes allowed, and

Chapter III Methodology 104
the marks corresponding to each mistake were clearly mentioned. The
students with zero mistake score the maximum of 100 marks and the
students who make mistakes above 125 would get zero marks and the
students with upto 75 mistakes can score pass mark of 40. The
student who makes mistakes above 75 will be considered failed in the
test. A copy of the Speed Test, Scheme of Valuation and the Chart for
Scoring are given in the Appendices I, II, & III respectively.
(ii) Test for Typing Official Matters
Preparation and Scoring
The test was intended to measure the subject’s efficiency in
typing official matters in proper form. It was prepared under the
guidelines given by the experts and also with the help of K.G.T.E rules
and regulations. The general instructions were given in the question
paper. The question paper contained 3 types of questions which the
candidate is expected to answer.
(i) Retype the given incorrect statements in proper form which
carries 35 marks.
(ii) Type the given ‘Government Order’ in proper form by making
necessary corrections. This question also carries 35 marks.
(iii) Type the given ‘Display’ in proper form with governmental
borders. It carries 30 marks
The maximum marks for this paper also was 100 and the
minimum for pass was 40. The time allotted for the test was one hour.

Chapter III Methodology 105
The paper was valued with the help of the scheme of valuation
prepared by the Investigator under the guidelines followed by the
K.G.T.E. Failure to expand abbreviation, displacement of figures, bad
centering of headings, failure to indent or uneven indentation of
paragraphs, failure to type in the capital letters wherever indicated,
failure to underline headings wherever indicated etc. may be
considered as mistakes. Proportionate marks may be given for
incomplete answers. If the matter in each question is typed in the
proper form, three marks may be given. Five marks is set apart for
neatness and marks for neatness shall not be awarded to a candidate
who have secured less than 40 marks.
A copy of the test and scheme of valuation are given in the
Appendices IV and V respectively.
Tryout
A tryout of the ‘Speed Test in Typewriting’ and ‘Test for Typing
Official Matters’ were made on a sample of 10 Orthopaedically
Handicapped Adolescents selected from one Vocational Training
Centre for Handicapped at Vallamkulam to find out practical
difficulties if any in the administration of these tests. Try out helped
the Investigator to remove the vague and difficult words from the
content in ‘Speed Test’ and difficult and ambiguous questions from
the ‘Test for Typing Official Matters’. Necessary modifications have

Chapter III Methodology 106
been made in these tests after the tryout. Also, the number of
questions were reduced after the tryout.
Validity and Reliability of the ‘Speed Test in Typewriting’ and
‘Test for Typing Official Matters’
Validity
All possible measures were adopted to establish the validity and
reliability of these tests used for the study. But it is not possible to
adhere to statistical procedure for measuring Speed Test in
Typewriting and Test for Typing Official Matters which cannot be
subjected to Item Analysis. It is not possible to drop any question as it
is either difficult or easy because only the speed in typing and
efficiency in typing official matters are evaluated here.
The content of these tests is so simple that the candidate can
easily type it. The Investigator therefore relied mostly on non-
statistical procedures to determine the validity of the Speed Test in
Typewriting and Test for Typing Official Matters.
Due care was taken to meet the requirements of these tests.
Efforts were made to prepare the content in the ‘Speed Test’ and ‘Test
for Typing Official Matters’ and it was done in consultation with
experts (Instructors in different Vocational Training Centres) in the
field.

Chapter III Methodology 107
Construct validity of ‘Speed Test in Typewriting’ and ‘Test for
Typing Official Matters’ was ensured by giving a simple paragraph and
content. Moreover, pilot testing of these tests also helped to establish
the validity. Thus utmost care was taken by the Investigator to see
that the ‘Speed Test in Typewriting’ and ‘Test for Typing Official
Matters’ used for the study had content and construct validity.
Reliability
The Reliability of the ‘Speed Test in Typewriting’ and ‘Test for
Typing Official Matters’ was established by using the test-retest
method. A sample of 15 Orthopaedically Handicapped Adolescents
was used for the purpose. In the test-retest method, both of these
tests were administered twice on the same sample with an interval of
two weeks each. The scores of the ‘Speed Test in Typewriting’ and
‘Test for Typing Official Matters’ of individuals, conducted twice in two
weeks intervals were found out. Karl Pearson’s product moment
coefficient of correlation between the two scores of these tests were
calculated. The test –retest reliability coefficients thus obtained for the
‘Speed Test in Typewriting’ is 0.60 and ‘Test for Typing Official
Matters’ is 0.53.
(iii) Theoretical Awareness Test in Typewriting
Preparation and Scoring
The questions were prepared by the Investigator in consultation
with the instructors and experts in the field and included 20 objective

Chapter III Methodology 108
type items in the test. Each question carries one mark. Maximum
mark for the test is 20 and the time duration of the test was decided
to be 30 minutes. Necessary instructions were given at the
appropriate place in the question paper. The test was aimed at
measuring the theoretical awareness of the student in typewriting.
The paper was valued with the help of scoring key prepared by the
Investigator under the guidance and supervision of the experts in the
field.
Marks should be given for correct and complete answers only.
Proportionate marks may not be given for incomplete answers. A copy
of the test and scoring key are given in the Appendices VI (a), VI (b) &
VII (a), VII (b) respectively.
(iv) Test for Identifying and Operating parts of Typewriter
Preparation and Scoring
Since the test preparation demanded vast experience in the
field, with the support and help of experts, the Investigator was able
to prepare 20 items for measuring the ability to identify different parts
of the typewriter and to perform its functions. A question paper
consisting of 20 items with maximum of 30 marks was prepared by
giving necessary directions in the introductory part. The questions
from 1 to 10 measure the ability of the students in identifying parts of
the typewriter and they carry 1 mark each. Considering the difficulty

Chapter III Methodology 109
level, the questions from 11 to 20 were given 2 marks each. They
measure the ability of the students to perform its functions. A scheme
of valuation was also prepared by the Investigator with the assistance
of experts in the field. The scoring was done according to the Scoring
Key prepared for the purpose. A sample test and scheme of valuation
are given in the Appendices VIII (a), VIII (b) & IX (a), IX (b) respectively.
Tryout
The tryout of the draft tests for item analysis was conducted on
a sample of 40 Orthopaedically Handicapped Adolescents from 4
Vocational Training Centres for Handicapped at Trivandrum,
Ernakulam, Thrissur and Kozhikode districts. Enough time was given
so as to enable all the students to complete the tests. The sample split
up for the tryout is given in Table 3.5.
Table 3.5
Sample Split-up for the Tryout
Sl.No. Institutions No. of students
1 V.T.C Poojappura, Trivandrum 8
2 The Kerala Rehabilitation for the
Physically Handicapped, Eranakulam
12
3 Sneha Bhavan Society, Irinjalakuda 10
4 V.T.C , Mayanad, Kozhikode 10
Total 40

Chapter III Methodology 110
Item Analysis
The process of Item Analysis helped to identify items with high
discriminating power and optimum difficulty level. The quality of each
item was determined by analysing two important characteristics of the
items such as difficulty index and discriminating power. Based on the
scores obtained, response sheet of the students were arranged in
descending order from the highest to the lowest. The responses of the
top scoring 27% of sheets and the bottom scoring 27% were used for
item analysis. Items having difficulty index between 0.20 and 0.80
and discriminating power above 0.20 were selected for the final tests.
Validity and Reliability of ‘Theoretical Awareness Test in
Typewriting’ and ‘Test for Identifying and Operating parts of
Typewriter’
Validity
The tests were constructed keeping in view the weightages given
for the content area and objectives on one hand and expert’s
comments and opinions on the other and they were treated as valid
tests. Construct validity of these tests were assured by giving easy
and clear items. Pilot study of these tests also helped to establish the
validity.
Reliability
The reliability of the tests were established by using split- half
method. A sample of 20 Orthopaedically Handicapped Adolescents

Chapter III Methodology 111
from 2 Vocational Training Centres at Trivandrum and
Pathanamthitta Districts were used for the purpose. Here the odd
numbered items were treated as one half of the test and scored
separately and the even numbered items were treated as another half
and scored. Then the scores of the halves were correlated and the
reliability of the tests were found to be 0.64 and 0.58 respectively.
3.5.2 Socio-Economic Status Scale
In the present study, the Kerala Socio – Economic Status Scale
developed by Nair (1978) was used with slight modifications. The
scoring scheme suggested for income was revised to catch up with
rising cost of living, as income increases.
The SES scale was used to measure three dimensions of Socio –
Economic Status, viz., Education, Occupation and Income level of the
head of the family. (Appendix X)
Education: Classification and Weightage
On the basis of education, people were classified into seven
categories. For people with professional or Post- Graduate degrees a
score of ten is given. In the case of people with bachelor’s degree like
B.A., B.Sc., a score of eight; for people with education upto higher
secondary or pre-degree, a score of five; for people who have studied
upto S.S.L.C., a score of four; people who have studied upto middle
school (Std VII), a score of two; people who have completed lower

Chapter III Methodology 112
primary, a score of one; and people who are illiterate is given zero
score.
Occupation: Classification and Weightage
People were classified into six categories on occupational basis
as high professional, semi- professional, skilled, semi-skilled,
unskilled and unemployed.
High professionals
This group consists of individuals who have very high education
and are engaged in decision making process, laying down policies and
executing them like Doctors, Engineers, Lawyers, Principals of
colleges, Readers, Professors, Bank Managers, Business Executives,
University Officials, Head of Research Organization, Head of
Department of Govt., big Land Holders, Secretaries, and Assistant
Secretaries to Govt., State or District Level Officers, Chief Executives
of quasi governmental body etc. For this category a weightage of 10
score is given.
Semi-Professionals
This group consists of occupations which require college
education. Here job is of routine nature. This group includes
Lecturers, Chemists, Teachers, Officers at sub–district level, Public
Health Workers, Superintendent of any govt. office, Contractors, Sub-
Inspector of Police, Excise Inspector, Sub-Registrars. For this category
a weightage of 8 score is given.

Chapter III Methodology 113
Skilled workers
This group consists of workers who have a long period of
training in complicated tasks. Mechanics, Fitters, Electricians,
Drivers, Painters, Photographers, Masons, Carpenters, Document
Writers, Advocates, Clerks, Head Constables of Police and Village
Officers can be included in this category. A weightage of 7 score is
given for this category.
Semi-Skilled workers
This group includes occupations which require some training
on the part of the persons - Shopkeepers, Attenders, Farmers, Small
Scale Merchants, and Police Constables come under this category.
The weightage given to this category is a score of 4.
Unskilled Workers
All persons who are doing work which involves neither
education nor training belong to the unskilled group. The watchman,
Labourer, Peon and Coolie belong to this category. A score of 2 is
given to this category.
Unemployed
The unemployed includes persons who are unemployed
irrespective of their education or training. Zero weightage is given to
this category.

Chapter III Methodology 114
Income : Classification and weightage
On the basis of monthly income also, people were classified into
six categories. For the group having monthly income Rs.8,000/- and
above, a score of 10 is given. For the group having monthly income in
the range of Rs.4,351/- to Rs. 8,000/- a score of 8; of Rs.3,451/- to
Rs.4,350/- a score of 6; and of Rs.2601/- to Rs.3450/- . a score of 4
and of Rs. 1751/- to Rs. 2600/-, a score of 2 is given . For the group
having monthly income of Rs.1,750/- and below, a score of 1 is given.
The weightage given to the various categories are consolidated and
presented in Table 3.6.
Table 3.6 Weightage Given to Items in the SES Scale
Sl.No.
Education Weight-age
Occupation Weight-age
IncomePer
month.Rs.
Weight-age
1. Master’s degree, Professional Degree and above
10 Professional 10 Above8,000
10
2. Bachelor’s Degree 8 Semi-Professional
8 4351-8000
8
3. Pre-Degree, Pre-University
5 SkilledWorkers
7 3451-4350
6
4. S.S.L.C 4 Semi Skilled Workers
4 2601-3450
4
5. Upto Std. VIII 2 UnskilledWorkers
2 1751-2600
2
6. Literate (Completed Lower Primary)
1 Unemployed 0 Below1750
1
7. Illiterate Weight -age 0 - - - -

Chapter III Methodology 115
Computation of SES of the Families of Students
Full weightage is given to the head of the family /father /
mother. Half the credit is given to the other parent. If the elder
sister/brother’s education, occupation or income is higher than that
of parents, one point weightage is given and a maximum of two points
if both the sister and brother are higher in education, occupation or
income. If the sister or brother is unmarried or staying with the family
after marriage a one point weightage is given.
The total of the scores obtained for the three dimensions of
socio-economic status designated above yielded a composite score for
each member. The sum of the composite score obtained for all the
members in the family was taken as the SES of the family. The
maximum score of 48 is fixed for a student as the SES score of his
family.
3.5.3 To measure Home Environment of the Students, ‘Family
Environment Index Inventory’, ‘Family Cultural Level
Rating Scale’, ‘Home Learning Facility Inventory’ and
‘Family Acceptance of Education Rating Scale’ are used
(i) Family Environment Index Inventory
The 14 statements of the scale rate the cultural level and
environmental background of the pupil’s family neighbourhood. There
are again, three possible answers for each statement, viz., ‘Many’,
‘Few’ and ‘None’. The pupil is required to make a tick mark in the

Chapter III Methodology 116
appropriate box. Three scores are allotted to ‘Many’ two to ‘Few’ and
one to ‘None’.
Reliability and Validity
The scale has been validated against rating by specialists. Forty
five households occupied by forty five respondents were independently
rated by a team of three social researchers. They rated the family
environment by observing the surroundings and rating each on a five
point scale. The ratings were converted into scores using conventional
procedure. The scores assigned by the three members were arranged
and used as the external criterion. A product moment correlation of
0.47 was obtained showing that the scale is a reasonably valid
instrument for measuring ‘family environment’. The split-half
reliability (N=79) was 0.66, again showing that it is a reasonably
reliable instrument.
A specimen copy of the test is given in Appendix XI.
(ii) Family Cultural Level Rating Scale
This Scale helps to evaluate the cultural background of the
pupil’s family. There are 18 statements, of which, for the first 8
statements, three alternatives, viz., ‘Many’, ‘Few’ and ‘None’ are given
and for the remaining ten statements, three other alternatives, viz;
‘Always’ , ‘Sometimes’ and ‘Never’ are given . The pupils are to choose
one alternative and mark a tick in the box. The scoring is done by
allotting the points to the ‘Many/Always’ response, two points for

Chapter III Methodology 117
‘Few/Sometimes’ response and one point for every ‘None/Never’
response.
Reliability and Validity
The validity and reliability of the test is reported in the test
manual. The test has been validated by correlating it with the Kerala
Socio-Economic Scale for a sample of secondary school pupils. The
coefficient of correlation is 0.38 (N = 47). The split half reliability of
the test was estimated on a sample of 84 school pupils. The test
indicated a relatively high degree of reliability (0.83.)
A specimen sample of the test is given in Appendix XII.
(iii) Home Learning Facility Inventory
This inventory helps to know the various home facilities that the
parents arrange for learning of their children. The 18 questions are to
be answered by marking ‘Yes’ or ‘No’ in the respective column. One
score each is given for a ‘Yes’ response and none for a ‘No’ response.
Reliability and Validity
The validity of the inventory has been answered in terms of the
definition and representation given to the concept under
measurement (construct and concurrent validity). A crude form
external validation is also reported. The scores of the inventory was
correlated with total class achievement of 85 pupils of standard X in a
selected secondary school. The correlation obtained was 0.41. The
split-half reliability coefficient of the test (worked out using the
Chapter III Methodology 118
sample used for the external validation study reported above) was
0.69. Thus the test on the whole is a reasonably valid and reliable
instrument for measuring the construct of ‘home learning facility’
under Kerala condition. A copy of the test is given in Appendix XIII.
(iv) Family Acceptance of Education Rating Scale
This tool helps to note the extent to which the parents accept
the educational work of their children and their interest in the
children’s progress. There are 16 statements and three possible
responses viz., ‘Always’, ‘Sometimes’ and ‘Never’. The students are to
make a tick mark in the appropriate box. Three points are awarded to
a tick mark ‘Always’, two for ‘Sometimes’ and one for ‘Never’.
Reliability and Validity
The authors of the scale claim validity in terms of the
procedures adopted for developing the scale, and in terms of the
results of the external validation study conducted by them. Apart
from the fact that the sixteen items has been selected by a select
panel of twenty judges from a list of 100 items presented to them, the
test has been validated against two external criteria. The co-efficient
of correlation of the scores on the rating scale with total class
achievement (marks obtained by pupils in a generalized achievement
test in six school subjects is 0.39. The study used 123 pupils of
standard X. Another validity used the same sample. The scores of the
scale were correlated with the scores on another standardized scale

Chapter III Methodology 119
viz; ‘Scale of Attitude Towards Academic Work’. The correlation in this
case was 0.44. The split-half reliability of the scale using a sub-
sample (N = 54) of the above sample was estimated as 0.73. These
values show that the scale is a reasonably valid and reliable
instrument for the purpose of the present study. A copy of the scale is
given in Appendix XIV.
3.5.4 Self Concept Scale
The variable was measured using the Kerala Self Concept Scale,
standardized by Nair (1976). This Scale is a self-report inventory,
standardized for cultural samples from South India. The test contains
sixty items grouped in pairs and divided into two sections A and B.
For each item in Section A, there is an equivalent item in Section B.
The subjects are asked to enter their responses by marking against
any one of its five entries marked ‘A’ , ‘B’, ‘C’,’D’, or ‘E’ in the response
sheet. Here ‘A’ stands for ‘strongly agree’, ‘B’ stands for ‘Agree’, ‘C’
stands for ‘Neutral’, ‘D’ stands for ‘Disagree’ and ‘E’ for ‘strongly
Disagree’. The score for each item in section A is compared with score
in section B. The difference is computed using appropriate
procedures.
Each item in section A represents an individual’s perception of
ideal self. Two examples are given below from section A.
(i) I wish, if my parents had been the most influential people
in our locality.

Chapter III Methodology 120
(ii) I wish, if I could be the most popular student in my class.
The matching items in Section B for these two items are the
following
(i) My parents are the most influential people in our locality.
(ii) I am the most popular student in my class.
Item ‘1’ in Section A represents the concept of the individual
with respect to the influence that his parents can wield in the locality.
Item ‘I’ in Section B represents the actual concept of the individual
about actual influence that his parents wield in the society. The
individual by ticking in one of the five response categories (A,B,C,D,E)
is getting a score for his perception of the ideal self and real self. The
responses for each item can be scored according to the scheme given
below.
Rating : A B C D E
Score : 5 4 3 2 1
Theoretically the score for the ‘ideal self’ cannot exceed the
score for the ‘real self’. When the difference is small, it represents a
higher self-concept as compared with larger difference. The maximum
possible difference is 4. This represents the lowest score of an item
with respect to self-concept. Each difference is subtracted from four
(the maximum possible difference) to obtain a positive self-concept
score for each item. This procedure helps to express a higher self
concept in terms of higher scores and vice versa.
Chapter III Methodology 121
All the item scores are summated to obtain the total score of the
whole test.
Reliability and validity
The test manual provides evidence of the test’s reliability and
validity. The reliability of the scale has been established in two
methods - the split-half reliability co-efficient for the scale, as reported
in the test manual, is 0.74 (N=100) and the test- retest reliability co-
efficient for the scale is 0.83 (N=56).The co-efficient quoted above
indicates that the scale is a reasonably valid and reliable instrument
for measuring the self concept.
The validity of the scale has been estimated against a ‘Semantic
Differential Sale’ of Self concept (translated version of the Osgood
model developed for another research study) as external criterion. The
resulting correlation was 0.48 (N=56) showing that the scale is a
reasonably valid measure of self-concept. Sample test and Scoring
Sheet are given in Appendix XV and XVI respectively.
3.5.5 Kerala Scale of Achievement Motivation
The Kerala Scale of Achievement Motivation developed by Nair
(1976) is standardized for the secondary school students and college
students in Kerala. The scale measures the achievement motivation
by a self report of the subject. There are 60 items in the scale in the
form of statements. Some items in the scale for getting the opinion of
the subjects about the attitude of the parents, friends and others

Chapter III Methodology 122
towards his or her achievement. The items in the scale are related to
the subject’s own view about achievement, the different ways adopted
for achieving the goal, opportunities for doing things extra ordinary,
being a leader in different activities. The scale thus on the whole
measures the subject’s power to initiate, direct and sustain
achievement-oriented behaviour. For each statement the subject is
required to respond by selecting and marking any one of the three
responses Yes (Y) undecided (U) and No (N) on the response sheet
supplied. The score will be Y3, U2 and N1 for positive items and Y1,
U2, and N3 for negative items. There is no time limit for the test.
Two illustrative items are :
(i) What others think of me won’t be an obstacle to my success
in life.
(ii) I feel tired when I have to perform very important things.
Reliability and validity
The test-retest reliability of the scale is 0.73 (N=56) and the
split-half reliability co-efficient for the scale is 0.82. The test has been
validated against the total achievement of students of Secondary
School classes as external criterion. Details of validity are:-
With School marks of standard VIII as external criterion,
validity is 0.33 (N=47).
With School marks of standard IX as external criterion, validity
is 0.44(N=38).

Chapter III Methodology 123
With School marks of standard X as external criterion, validity
is 0.39 (N=42).
A copy of the Sample Test and a Scoring Sheet are given in the
Appendix XVII and XVIII respectively.
3.6 Procedure for Data Collection
The Investigator obtained adequate copies of all the tools and
the response sheets for the collection of data. The Investigator visited
the selected vocational training institutions and contacted the
principals and instructors for getting permission and co-operation for
collection of data.
After establishing rapport with students, Investigator had
explained the purpose of study and assured them that their data
would be maintained under strict confidence and would be used only
for the research purpose.
The ‘Vocational Skill Attainment Test’ to measure the Vocational
Skill Attainment of the students; ‘Socio-Economic Status Scale’ to
measure Socio Economic Status; ‘Family Environment Index
Inventory’, ‘Family Cultural Level Rating Scale’, ‘Home Learning
Facility Inventory’, and ‘Family Acceptance of Education Rating Scale’
to measure Home Environment; ‘Self-Concept Scale’ to measure self-
concept ; and ‘Achievement Motivation Scale’ to measure Achievement
Motivation of the students were distributed among the
Orthopaedically Handicapped Adolescents. Adequate instructions

Chapter III Methodology 124
were given in making the response. However, those who have difficulty
in understanding the items or mode of responding to them were
assisted by the Investigator. Response sheets were provided and
allotted sufficient time to make the responses. Every precaution was
taken to make the study valuable and reliable.
3.7 Statistical Techniques Adopted
The objectives of the study warranted the use of the following
statistical techniques in analyzing the data
1. Arithmetic Mean (A.M)
A.M = A+ CNfd
where;
A= Assumed Mean
f = Frequency of each class
d = deviation of scores from assumed mean
c = class interval
N= Total frequency (Kaul, 1997)
2. Standard Deviation ( )
= c 22
Nfd
Nfd
where;
c= class interval
d= deviation of each score from assumed mean
f= frequency of each class
N= total sample (Kaul, 1997)

Chapter III Methodology 125
3. Classificatory Techniques
The important variables were classified into three groups under
the following conditions.
Groups Classification
High Above (M+ )
Average Between (M + ) to (M- )
Low Below (M- )
Where
M= Mean
= standard deviation of the independent variables
(Garrett, 1981)
4. Analysis of Variance
Analysis of variance is an effective technique that permits the
comparison of the mean of small groups at a time and see whether
they differ significantly from each other. It is affective way to
determine whether the means of more than two samples are too
different to attribute sampling error. Analysis of variance makes it
possible to determine whether more than two means differ
significantly or not. The details of the procedure of one-way analysis
of variance are the following.

Chapter III Methodology 126
The first step used is to find the sum of the squared deviation of
each person’s scores from the mean of all the subjects (X). This is
known as the total sum of squares (SST) and is found by using the
formula:
SST =2
2
Nx
x
The next step is to divided the total sum of squares in two
groups (1) between group (ssb) and (2) within groups (ssw)
SSb is found using the formula:
SSb = NX
nX
nX 22
2
22
1
1 ..................
Where
n1, n2 are the sizes of the groups to be compared and N is the
number of subjects for all the groups combined.
The within groups sum of squares (SSw) is calculated using the
formula:
SSw = SST – SSb
The mean square variance between (MSb) and mean square
variance within (MSw) are then calculated using the formula:
F = dfwSSwdfbMSb
MSwMSb
//
Where
dfb = n-1
dfw = N-n

Chapter III Methodology 127
The significance of an F- ratio is assessed with respect to the
table of F with (n-1, N-n) degrees of freedom for a particular level of
significance. If, for a required level of significance, the obtained value
of F is higher than the tabled value of F, then the difference between
group means is considered significant for that level of significance.
(Best and Kahn,1995)
5. Scheffe’s F Test
In this test, F’s are calculated for all the paired groups using the
formula:
F =
21
212
2
21
NNNNMSw
XX
Where
X = Mean of the first group
2X = Mean of the second group
= Mean square within groups 2MSw
N1 = Total number of the first group
N2 = Total number of the second group
Then (K-1) F, where K is the number of groups under study and
F is the tail value obtained for the general F test calculated. If the F
value is greater than (K-1) F, then the difference between mean scores
is significant for the groups under comparison. If the calculated F
value is less than (K-1) F then the difference is not significant.

Chapter III Methodology 128
The Scheffe’s method was adopted as it is more rigorous than
other multiple comparison methods with regard to type I error. It also
leads to fewer significant differences. Further it is easy to apply this
test. It uses the readily available F test and the criterion it employs in
the evaluation of the null hypothesis is simple and readily
understood. It is not seriously affected by violations of the
assumptions of normality and homogeneity of variance unless these
are gross. Further it can be used for making any comparison the
investigator wishes to make.
6. Test of Significance of Means
2
22
1
21
21.
NN
MMRC
Where
M1 = Mean of the first group
M2 = Mean of the second group
1 = Standard deviation of the first group
2 = Standard deviation of the second group
N1 = Total sample of the first group
N2 = Total sample of the second group (Mangal, 2002)
7. Karl Pearson’s Product Moment Coefficient of Correlation (r)
In order to estimate the extent of relation between the criterion
and associate variables the technique of Pearson’s Product Moment

Chapter III Methodology 129
Coefficient of Correlation was used. For this the data was processed
into respective bivariate frequency distribution.
The Pearson’s coefficient of correlation is calculated using the
formula:
r = 2222 )( . )(
)( )(YYNXXN
YXXYN
Where
X = sum of the X scores
Y = sum of the Y scores
X2 = sum of squared X scores
Y2 = sum of the squared Y scores
XY = sum of the products of paired X and Y scores
N = number of paired scores.
The coefficients are verbally interpreted by the following
conventions:
i) ‘r’ from 0.00 to 0.20 denotes indifferent or negligible
relationship.
ii) ‘r’ from 0.20 to 0.40 denotes low correlation present but
of slight.
iii) ‘r’ from 0.40 to 0.70 denotes substantial or marked
relationship.
iv) ‘r’ from 0.70 to 1.00 denotes high to very high
relationship. (Garrett, 1981)

Chapter III Methodology 130
8. Test of Significance of ‘r’
The obtained ‘r’ is tested to find whether it is significant or not
using ‘t’ distribution developed by Fisher.
t = 212r
Nr where,
r= coefficient of correlation
N = size of the sample
Degree of freedom is N-2. If the value for ‘t’ is greater than the
table value for N-2 degrees of freedom of a given level of significance,
the relation is said to be significant at that level.
9. Significant Difference between two ‘r’s
Computation of critical ratio for testing the significance of
difference between correlation coefficients, was calculated by using
the formula,
C.R = ErSZZ
.21
Where
Z1 and Z2 are the Fisher’s coefficients
S.Er = Standard Error
S.Er = )3(
1)3(
1
21 NN
where
N = sample size (Garrett, 1981)
Chapter III Methodology 131
10. Multiple Regression Equation
This part of the analysis was directed towards developing an
equation for predicting attainment of typewriting skill using the
predictor variables. The regression equation is
Y = a+ b1x1 + b2x2 + b3 x3 + b4x4 +E
Where
x1 = score of Socio Economic Status
x2 = score of Home Environment
x3 = score of Self-Concept
x4 = score of Achievement Motivation
Y = score of Vocational Skill Attainment
E = random disturbance term
a – is a constant
b1 – regression coefficient of Socio Economic Status
b2 – regression coefficient of Home Environment
b3 – regression coefficient of Self –Concept
b4 - regression coefficient of Achievement Motivation
a, b1, b2, b3 and b4 are estimated using Ordinary Least Squares
(OLS) method.
(Garrett, 1981)