influence of bed patchiness, slope, grain hiding, and form drag on
TRANSCRIPT

Influence of bed patchiness, slope, grain hiding, and formdrag on gravel mobilization in very steep streams
Joel S. Scheingross,1 Eric W. Winchell,2,3 Michael P. Lamb,1 and William E. Dietrich2
Received 30 July 2012; revised 21 March 2013; accepted 25 March 2013.
[1] Steep streams are a major portion of channel networks and provide a link to transportsediment from hillslopes to lower gradient rivers. Despite their importance, key unknownsremain, perhaps foremost of which is evaluating in steep streams empirical laws forfluvial sediment transport developed for low-gradient rivers. To address this knowledgegap, we painted sediment in situ over 3 years to monitor incipient sediment motion andsediment-patch development in five small (drainage areas of 0.04–2 km2) and steep(slopes of 5–37%) tributaries of Elder Creek, California, United States. We found thatchannel beds organized into size-sorted sediment patches which displayed active fluvialtransport of gravel annually, consistent year-to-year patch median grain sizes, partialtransport of bed material, and significantly higher values of critical Shields stress forincipient sediment motion compared to that observed for lower gradient rivers. The highcritical Shields stresses (up to �0.5 for the median grain size) agree within a factor of ~3 totheoretical predictions which account for slope-dependent hydraulics, grain hiding, andsediment patches. For grains of approximately the same size as the roughness length scale,slope-dependent hydraulics and bed patchiness are the dominant controls on critical Shieldsstress values, while grain hiding is important for grains larger or smaller than the roughnesslength scale. Form drag exists in our monitored tributaries but has a smaller influence than theabove effects. Our field observations show fluvial processes contribute to sedimentmobilization in steep channels which are often considered to be dominated by debris flows.
Citation: Scheingross, J. S., E.W.Winchell, M. P. Lamb, andW. E.Dietrich (2013), Influence of bed patchiness, slope, grainhiding, and form drag on gravel mobilization in very steep streams, J. Geophys. Res. Earth Surf., 118, doi:10.1002/jgrf.20067.
1. Introduction
[2] Sediment-transport dynamics and rates in steepstreams are important for routing sediment from hillslopesto river networks [Grant et al., 1990; Montgomery andBuffington, 1997; Benda et al., 2005; Cui and Parker,2005; Wiele et al., 2007], aquatic habitat quality [Lisle,1989; Buffington et al., 2004;Montgomery, 2004], and land-scape evolution modeling [Dietrich et al., 2003; Tucker andHancock, 2010]. Nonetheless, the role of fluvial processes inconveying sediment through steep channels has receivedlittle study relative to lower gradient channels (S< 1%,where S is channel bed slope) and may differ in importantways [Comiti and Mao, 2012]. For example, in steep
streams workers have emphasized the effects of grainhiding, form drag, slope-dependent incipient-motion crite-rion, partial transport, and bed-sediment-size patchiness onsediment transport [e.g., Church and Hassan, 2002; Lambet al., 2008a; Mao et al., 2008; Recking, 2009; Yageret al., 2012a; 2012b]. In addition, recent work has shown thatfluvial transport in steep streams can account for a large por-tion of the total sediment flux [e.g., Gomi and Sidle, 2003;Mao and Lenzi, 2007; Yager et al., 2012a], yet others haveargued that periodic debris flows are primarily responsiblefor transporting sediment in streams with slopes greater thanabout 10% [e.g., Stock andDietrich, 2003; Stock andDietrich,2006]. Uncertainty about the dominant processes in steepchannels remains, in part, due to a paucity of field data.[3] Accurate predictions of sediment transport in steep
streams require knowledge of the conditions for incipientsediment motion, which is often calculated using a criticalShields stress (t*c) [Shields, 1936]:
t�c ¼ tcrs � rð ÞgD (1)
where tc is the bed shear stress at incipient motion, rs is thedensity of sediment, r is the density of water, g is accelera-tion due to gravity, and D is particle diameter. In low-gradient gravel-bed rivers, a constant value of t*c� 0.045has been shown to accurately predict the conditions forsediment motion [e.g., Buffington and Montgomery, 1997].
1Division of Geological and Planetary Sciences, California Institute ofTechnology, Pasadena, California, USA.
2Department of Earth and Planetary Science, University of California,Berkeley, California, USA.
3Now at Department of Geological Sciences and Institute of Arctic andAlpine Research, University of Colorado, Boulder, USA.
Corresponding author: J. S. Scheingross, Division of Geological andPlanetary Sciences, California Institute of Technology, Pasadena, CA91125, USA. ([email protected])
©2013. American Geophysical Union. All Rights Reserved.2169-9003/13/10.1002/jgrf.20067
1
JOURNAL OF GEOPHYSICAL RESEARCH: EARTH SURFACE, VOL. 118, 1–20, doi:10.1002/jgrf.20067, 2013

In steep streams (e.g., S> 5%), however, a constant value oft*c may not be appropriate. For example, some theoreticalmodels for incipient sediment motion predict t*c decreaseswith slope due to the increased component of gravity inthe downstream direction [e.g., Wiberg and Smith, 1987].Yet, flume data at slopes up to 47% show that criticalShields stresses increase with channel gradient [e.g., Ashidaand Bayazi, 1973; Mizuyama, 1977; Bathurst et al., 1984;Prancevic et al., 2011]. Field data on incipient motion arelimited for streams with S> 5% but also show an increasein critical Shields stress with increasing slope up toS = 14% [e.g., Mueller et al., 2005; Lenzi et al., 2006; Maoand Lenzi, 2007;Mao et al., 2008]. Recent models show thatthe critical Shields stress may increase with channel slopedue to changes in local flow velocity and turbulent fluctua-tions as the flow depth to grain size ratio decreases [Lambet al., 2008a; Recking, 2009]. Others suggest that increasedform drag due to the presence of immobile morphologicstructures results in larger t*c with increasing channel slope[e.g., Buffington and Montgomery, 1999; Nitsche et al.,2011; Ferguson, 2012; Yager et al., 2012a].[4] Predicting incipient motion and bedload transport in
steep channels is further complicated by the organizationof the channel bed into distinct sediment patches [e.g., Paolaand Seal, 1995; Dietrich et al., 2006; Yager et al., 2012b].Patches are sediment-size-sorted areas on the bed whichlikely form through feedbacks between bed topography,shear stress distribution, and sediment transport [Nelsonet al., 2009; Nelson et al., 2010]. For example, Yager et al.[2012a] showed that standard models for bedload transportdeveloped in low-gradient streams over-predict transport ratesby an order of magnitude in steep streams (S=9.8–17%)because the models did not account for patches of immobilegrains. Since the critical Shields stress is sensitive to the ratioof grain size to the local bed roughness [Wiberg and Smith,1987], the presence of patches has led workers to argue thatpatches with different grain-size distributions within thesame river reach are mobilized at different bed shear stresses[e.g., Paola and Seal, 1995]. The mobilization of relativelyfiner patches at lower bed shear stresses leads to reach-widepartial transport of sediment (i.e., a portion of the grain-sizedistribution present on the channel bed is absent in thebedload) [Paola and Seal, 1995; Yager et al., 2012b]. Whilesome have argued that grains within a single patch are all mo-bilized at the same critical shear stress [Paola and Seal, 1995],field data from steep streams suggests individual patches expe-rience partial transport, with a preference for mobilizing finergrains [Yager et al., 2012b]. At the individual particle scale,grain mobilization is a function of both the grain weight andgrain size relative to roughness on the bed. Relatively coarsegrains weigh more than fine grains but also protrude furtherfrom the bed and are thus subject to increased drag and lowerfriction angles [e.g., Einstein, 1950; Egiazaroff, 1965;Wibergand Smith, 1987; Kirchner et al., 1990]. These competingeffects, termed grain hiding, likely influence the mobilizationof distinct grain sizes from individual patches.[5] In steep streams, accurate incipient-motion predictions
likely require quantification of the extent of bed patchiness,grain hiding, form drag, and slope-dependent hydraulics.There is a general paucity of data on critical Shields stressfor channels with S> 5%, and no study has attempted toquantify the influence of patchiness, grain hiding, form drag,
and slope-dependent hydraulics together in a field setting.This lack of data has led many modelers to treat steepchannels with the same semi-empirical expressions(e.g., t*c� 0.045) developed for lower gradient gravel-bedrivers [Sklar and Dietrich, 2004; Whipple, 2004; Lambet al., 2008b; Tucker and Hancock, 2010; Tsai et al., 2012].[6] Here we present results from monitoring sediment
mobilization via painting sediment patches and tracking themovement of individual grains in five steep (S=5–37%)tributary reaches of Elder Creek, California, United States.We use our monitoring data to calculate critical Shieldsstresses and to quantify the effects of bed patchiness, grainhiding, form drag, and slope-dependent hydraulics via com-parison to theory that allows isolation of these variables. Inthis paper, we first introduce the study area and describe thestudy reaches. Second, we present methods on monitoringhydraulics and sediment transport, including surveyingchannel geometry, field measurements of flow hydraulics,modeling bed shear stress with a non-uniform flow algo-rithm, and documenting grain mobilization via repeatsurveys of marked tracer particles and patches. Third, wediscuss results from monitoring, including measured flowdischarges and velocities, grain mobilization from patches,and travel distances of marked particles. Fourth, we presentanalysis of our data to calculate form drag and criticalShields stresses, and examine controls on incipient motion.Finally, we discuss the implications of our analysis forpredicting grain entrainment and sediment transport insteep streams.
2. Study Area and Monitored Tributaries
[7] Elder Creek is a small (drainage area of 16.8 km2)tributary of the South Fork Eel River located in northernCalifornia, United States (Figure 1). The stream hosts aU.S. Geological Survey hydrologic benchmark station nearits mouth with continuous discharge records from 1967 to2013. The local lithology consists of interbedded arkosicsandstone and argillite of the Coastal FranciscanBelt [Jayko et al., 1989]. The area has a Mediterraneanclimate with annual average precipitation of approximately~2m/yr, the vast majority of which falls as rain betweenthe months of December and March [Mast and Chow,2000]. Elder Creek watershed is located entirely withinthe University of California’s Angelo Coast RangeReserve and has been free of grazing, logging, mining,and other disturbances since 1959 (the basin had onlylimited logging during the late nineteenth and early twen-tieth centuries) [Mast and Chow, 2000]. While there areno records of modern debris flows within the catchment,debris flows have been active in the area in the Holocene[Scheingross et al., 2008], and many tributaries are incisedinto debris flow fans near their junction with the main stemof Elder Creek. Cosmogenic dating of modern streamsediment yields basin average erosion rates for Elder Creekof 0.16–0.18mm/yr [Fuller et al., 2009].[8] We monitored five tributaries of Elder Creek over
three water years from September 2007 to July 2010. Inorder to examine effects of slope and roughness onsediment motion, we chose reaches spanning a range ofchannel gradients from 5 to 37% and median particlediameters of 57 to 155mm. These reaches range in
SCHEINGROSS ET AL.: GRAVEL MOBILIZATION IN STEEP CHANNELS
2

drainage area from 0.04 to 2 km2, bankfull depths from0.13 to 0.3m, and bankfull widths from 1.1 to 4.1m(Figures 1 and 2 and Table 1). Study reaches 2 and 4are located in channels near the apex of debris flow fanswhich are deposited over a strath terrace of Elder Creek;the other reaches (1, 3, and 5) are located in channelizedvalleys. For each tributary, we selected short, straightreaches (~20–50m in length) for monitoring. All moni-tored reaches were mantled with coarse sediment, includ-ing boulders. There is no exposure of bedrock in thechannel beds within any of the study reaches, and bedrockchannel beds are rarely exposed in the Elder Creek tribu-taries in general. Sediment on the surface of monitoredreaches is organized into distinct size-sorted patches. Thesteepest channels examined here (reaches 1 and 2, slopesof 37% and 18%, respectively) have a cascading morphol-ogy (in the sense of Montgomery and Buffington [1997])and include isolated areas of soil development and leaflitter accumulation within channels (Figures 2a and 2b);lower gradient channels have more pronounced step-poolmorphology but also include short cascading reaches(Figures 2c, 2d, and 2e).
3. Methods
[9] Calculating critical Shields stresses for gravel entrain-ment in steep streams requires characterization of channelgeometry, flow hydraulics, bed roughness, and sedimenttransport. In this section, we first describe our methods tosurvey channel geometry and grain-size distributions. Nextwe discuss our methods for measuring flow hydraulics and
calibrating a flow algorithm to estimate bed shear stress.Finally we describe our methods for documenting sedimenttransport.
3.1. Channel Geometry
[10] We surveyed channel geometry with high-resolutionground-based light detection and ranging (LiDAR) in reaches2 and 4; in the remaining three reaches, we surveyed longitu-dinal profiles and cross-sections with a stadia rod and handlevel. Points along longitudinal profiles were surveyed at highdensities to capture breaks in slope due to steps, pools, andother structures. Despite large changes in local slope along alongitudinal profile, channel cross-sectional shape remainedfairly constant over several meters (Figure 2); therefore, wespaced cross-section surveys approximately every 2m inreaches 1 and 3 and every 4m in reach 5.
3.2. Flow Hydraulics
[11] We measured stream discharge and reach averagevelocity for six flow events in reaches 2 and 4 (Table 2)using the salt dilution method, whereby salt is injected intoa stream as a tracer and discharge is estimated assumingconservation of the tracer mass [Elder et al., 1990; Hudsonand Fraser, 2005]. This method is advantageous over thetraditional slug-injection method as it yields the same resultsfor injection of both dry salt and salt dissolved into solution.For each measurement, we injected salt at a distance of 7 to10 channel widths upstream of a conductivity meter. Thislength scale is near the low end of observed mixing lengthsin mountain streams [Day, 1977a] and was chosen to avoidlarge pools and backwater areas where water could stagnate
!
!
!
!
!
445000 446000 447000 448000
4396
000
4397
000
4398
000
S < 0.01S = 0.01 - 0.04S = 0.04 - 0.10S = 0.10 - 0.15S > 0.15
Study Reach
1 km
Figure 1. Airborne laser swath mapping (1m2 resolution) derived shaded relief map showing the ElderCreek watershed and the location of the five tributary reaches studied (white circles with numbered boxes).The stream network is color coded by channel slope (S) calculated over channel lengths with 10m changein elevation; note the vast majority of the channel network exists at slopes greater than 15%. UTM coor-dinates are displayed along figure borders. Inset shows outline of California with star indicating approx-imate location of the study site.
SCHEINGROSS ET AL.: GRAVEL MOBILIZATION IN STEEP CHANNELS
3

and compromise the reliability of the measurement [Elderet al., 1990; Moore, 2003]. A single conductivity probe wasplaced at the center of the channel, and we manually recordedstream conductivity ensuring a minimum of 25 measurements
to accurately characterize the passing salt wave [Day, 1977b].Conductivity was converted to salt concentration using alaboratory-measured calibration coefficient in stream water.We additionally calculated reach-averaged stream velocity
Table 1. Reach-Averaged Hydraulic Geometry and Basic Characteristics of Monitored Reachesa
ReachDrainage Area
(km2)Local Slope
(%)Bankfull Depth
(m)Bankfull Width
(m)D16
(mm)D50
(mm)D84
(mm)D84-mobile
(mm)
1 0.04 37 0.13 1.1 10 57 133 452 0.12 18 0.15 1.5 21 97 279 1453 0.55 7b 0.15 3.5 15 101 286 1434 0.84 9 0.30 4.1 23 155 446 197
5 (Misery Creek) 2.0 5 0.28 3.5 11 72 201 90
aD16, D50, and D84, are the 16th, median, and 84th percentile grain sizes, respectively, for reach-averaged pebble counts (including steps and immobilegrains). D84-mobile is the 84th percentile grain size for reach-averaged pebble counts of mobile sediment.
bThis reach features a ~1m alluvial step. The local slope below the step is 5%, and the local slope above the step is 9%.
FlowFlow
Flow
Flow
(a) (b)
(c) (d)
(e)
Figure 2. Field photographs of study reaches. (a) Reach 1; (b) reach 2, circled staff gage is 1m long; (c)reach 3, channel width indicated by white line in foreground is ~2m; (d) reach 4, note circled 1.2 cm widewhite measuring tape stretched parallel to stream for scale; and (e) reach 5 (Misery Creek), note person(circled, crouching) for scale. Figures 2b and 2d show near bank full conditions. Vertical, white PVCpipes house pressure transducers and crest stage gages measuring water depth.
SCHEINGROSS ET AL.: GRAVEL MOBILIZATION IN STEEP CHANNELS
4

based on the travel time from salt injection to the center ofmass of the passing salt wave (i.e., the “centroid velocity”[Calkins and Dunne, 1970]).[12] For one discharge measurement (reach 2, 17 February
2009), we recorded the time of peak conductivity followingsalt injection but did not make sufficient manual conductiv-ity measurements to accurately characterize the shape of thepassing salt wave. For this reach only, we calculated reach-averaged velocity using the time from salt injection to peakconductivity (i.e., the “peak velocity” of Calkins and Dunne[1970]) and estimated discharge in the reach as Q=Uwh,where Q is water discharge, U is reach-averaged flow veloc-ity, and w and h are reach-averaged width and flow depth,respectively, measured in the field.[13] In addition to measurements of flow hydraulics, we
instrumented each study reach with a pressure transducermeasuring atmospheric and total (atmospheric plus water)pressure at 15min intervals and a crest stage gage (placedadjacent to the pressure transducer and built to U.S.Geological Survey standards [Holmes et al., 2001]) tomeasure peak water stage. These instruments allowedestimation of flow hydraulics for periods when we wereunable to make manual measurements.
3.3. Modeling Bed Shear Stress
[14] In low-gradient streams, bed shear stress is often esti-mated assuming steady, uniform flow (i.e., t =rgRS, wheret is bed shear stress and R is the hydraulic radius); however,these assumptions may be invalid in the steep streams exam-ined here which have flow cascading over steps and chutes.
Instead, we used a non-uniform flow algorithm, HEC-RAS(Hydrologic Engineering Center River Analysis System,available at http://www.hec.usace.army.mil/software/hec-ras/), to estimate bed shear stress. HEC-RAS has been usedsuccessfully by others in channels with S> 1% [e.g., Churchand Hassan, 2002; Thompson and Croke, 2008] and isconvenient to use as it can model transcritical flow. HEC-RAS should be used with caution for S> 10% (reaches 1and 2) where the gradually varied flow and hydrostaticassumptions used in the model may be invalid (U.S. ArmyCorps of Engineers, 2010, pg. 2-20 to 2-21); however, avail-able codes for rapidly varying, nonhydrostatic flows do notexist, to our knowledge. Here we describe the proceduresfor calibration of our flow algorithm with manuallymeasured flow depths, velocities, and discharges.[15] Channel geometry for HEC-RAS was taken from our
field surveys where each survey point in the long profile wasused as a node (i.e., cross-section) within the model(Figure 3). In reaches 1, 3, and 5, we did not survey across-section at each node within the longitudinal profileand instead used the surveyed cross-section associated withthe nearest node as the input to HEC-RAS based on ourobservation that variations in cross-section geometry wassmall over the scale of ~2–4m compared to changes inriver-bed elevation. This resulted in a high density of nodeswithin HEC-RAS sufficient to capture steps and other breaksin slope which affect flow hydraulics (Figure 3 and Table 3).For all modeling, we set the upstream and downstream bound-ary conditions to critical depth based on the observations ofsteps and overspilling flow [e.g., Rouse, 1936]. We theniterated with changing the flow resistance (i.e., Manning’s n)to minimize the misfit between our manually measured flowdepths and HEC-RAS predicted flow depths (Figure 3), withall other parameters set to their default values (e.g., expansionand contraction coefficients set to 0.3 and 0.1, respectively).[16] We estimated the critical shear stress for sediment
transport from patches assuming sediment was mobilizedat the peak flow prior to sediment recovery. HEC-RASparameter settings were the same as described above (i.e.,critical upstream and downstream boundary conditions, andall other parameters set to default values). We iterated withchanging both discharge and Manning’s n in HEC-RAS untilmodeled flow depths matched (within 5%) flow depths
Table 2. Reach-Averaged Flow Hydraulic Measurementsa
Reach Date Discharge (m3/s) U (m/s) h (m)
2 17 Feb 2009 0.0006 0.033 0.032 23 Feb 2009 0.014 0.19 0.0852 24 Feb 2009 0.030 0.25 0.092 3 Mar 2009 0.013 0.16 0.084 24 Feb 2009 0.19 0.32 0.214 3 Mar 2009 0.14 0.19 -
aU and h are measured reach-averaged flow velocity and flow depth,respectively. Measurements made on 24 February 2009 represent nearbankfull discharge.
0 5 10 15 20 25 30 35 40−3.5
−3
−2.5
−2
−1.5
−1
−0.5
0
0.5
Distance (m)
Ele
vatio
n (m
)
Bed ElevationModeled Water SurfaceDepth Measurement
14 16 18 20 22 24 26 28 30
−3.5
−3
−2.5
−2
−1.5
−1
−0.5
Distance (m)
(a) (b)
Figure 3. Comparison of modeled water surface to flow-depth measurements. HEC-RAS modeling forthe (a) 3 March 2009 event in reach 2 and (b) the 24 February 2009 event in reach 4. See Table 2 formanual flow measurements in each event.
SCHEINGROSS ET AL.: GRAVEL MOBILIZATION IN STEEP CHANNELS
5

measured with stage recorders and the predicted Manning’s nmatched the Darcy-Weisbach friction factor, f, predicted byFerguson [2007] (where f and Manning’s n can be related bydefinition by n= [R2/3S1/2]/[u*(8/f )
1/2], and u* is the reach-averaged shear velocity defined as u*= (t/r)
0.5). For all casesbut patch 1a in reach 1, local stress was estimated from thecross-section nearest the patch of interest. For patch 1a inreach 1 (the steepest reach, S= 37%), the flow was cascadingbetween two cross-sections with locally changing channelgradient. Due to the complex flow for this case, we reportthe shear stress for both bounding cross-sections as a measureof possible variability.
3.4. Monitoring Sediment Transport
[17] Within each reach, we selected individual sediment-size-sorted patches to monitor for grain mobilization andmarked patches (via spray painting) in place. Patches weretypically ~0.5 by 0.5m in areal extent, and we attempted
to select patches with apparently mobile sediment, avoidingareas of the bed with lichen development or stronglyinterlocked grains. For reaches 1–4, we selected patcheswithin the channel thalweg in order to minimize the influ-ence of cross-channel variations in flow due to bars, walldrag, and other morphologic structures. Furthermore, weavoided pools or other areas subject to plunging flow andsecondary currents. Perennial flow in reach 5 made it impos-sible to paint patches in situ within the thalweg; instead wepainted emerged patches as close to the thalweg as possibleat the end of summer when flow depth was lowest.[18] To compare transport of mobile gravel in active patches
to reach-wide transport, we additionally marked (via spraypainting) an average of 10 individual cobbles and bouldersper reach, spanning a range of intermediate grain diameters(D= 90 to 450mm). Repeat photographs of cobble andboulder position were used to determine mobilization ofthese larger grains.
Table 4. Transport Data for Patches in Specific Sediment-Transport Eventsa
Reach Patch Storm D1meter (mm) Dmax (mm)Number of
Grains RecoveredNumber of Grains<1m from Patch ks (mm) tmax (Pa)
1 1a Winter 2007/2008 37 54 127 49 15.9 1781 1a 24 Feb 2009 7 10 28 27 12.5 3291 1a Winter 2009/2010 21 30 15 15 11.5 1942 2a Winter 2007/2008 38 112 100 15 50.2 1242 2a 24 Feb 2009 18 19 11 11 30.4 952 2a Winter 2009/2010 - 20 10 0 38.3 1062 2b Winter 2007/2008 61 90 90 7 36.7 2032 2b 25 Dec 2008 21 25 19 19 50.3 1082 2b 24 Feb 2009 89 115 125 44 50.3 1722 2b Winter 2009/2010 - 110 58 5 52.4 1853 3a Winter 2007/2008 - 76 114 3 25.1 1043 3a 14 Nov 2008 14 20 27 27 33.6 123 3a 25 Dec 2008 19 30 116 79 33.6 193 3a 24 Feb 2009 57 70 126 13 33.6 283 3a Winter 2009/2010 - 52 51 0 25.0 523 3c Winter 2007/2008 - 72 26 4 58.8 1193 3c 25 Dec 2008 16 20 8 8 62.7 303 3c 24 Feb 2009 26 45 109 100 62.7 393 3c Winter 2009/2010 - 48 60 1 40.2 654 4a Winter 2007/2008 - 25 8 1 64.1 2044 4a 24 Feb 2009 11 90 79 57 85.6 1764 4a Winter 2009/2010 - 40 9 2 53.4 2095 5a Winter 2007/2008 - 48 10 0 38.6 935 5a 24 Feb 2009 24 35 48 29 33.3 475 5a Winter 2009/2010 - 32 3 0 34.5 825 5b Winter 2007/2008 33 45 51 10 14.1 535 5b 24 Feb 2009 22 30 71 11 13.5 215 5b Winter 2009/2010 - 130 11 3 19.4 44
aD1meter is the mean grain size of the recovered tracer particles deposited within 1m downstream of the patch, where “-” indicates five or less grains werecollected within 1m of the patch and 1m estimates were not made. Dmax is maximum grain size recovered from a given patch in a given storm event. ks isthe geometric mean grain size of the patch from where moved grains originated. tmax is HEC-RAS calculated peak shear stress used in calculating criticalShields stress. Listing of individual storm dates (e.g., 24 Feb 2009) indicates measurements were made for a specific storm event. Listing of a season(e.g., Winter 2007/2008) indicates measurements integrate multiple storm events over an entire season, with the peak observed discharge event assumedto have transported all the sediment.
Table 3. Spacing of HEC-RAS Channel Geometry
ReachModeled ReachLength (m)
Number of LongitudinalProfile Nodes
Number of UniqueSurveyed Cross-sections
Average NodeSpacing (m)
1 16.4 30 8 0.552 16.6 39 39 0.433 16.1 18 9 0.894 34.3 20 20 1.72
5 (Misery Creek) 19.8 16 7 1.24
SCHEINGROSS ET AL.: GRAVEL MOBILIZATION IN STEEP CHANNELS
6

[19] We monitored sediment motion over three fieldseasons. Mobilized grains from painted patches served asparticle tracers and were recovered when found during andafter storm events, allowing measurements of the particledistance traveled and diameters of mobilized particles. Dur-ing the 2008/2009 winter, we made field visits to documentsediment motion before, after, and during every storm. In theother two seasons of monitoring, our results came from fieldmeasurements made at the end of the rainy season (Table 4).[20] We measured the grain-size distribution of painted
patches using photographs. This allowed us to measureparticle sizes without disturbing the position of grains onthe bed. We employed a grid-by-number approach and setgrid spacing equal to the maximum grain size present withinthe painted patch, which gives results similar to bulk-volumemeasurements [Bunte and Abt, 2001]. Given the smallareal extent of the patch (~0.25m2) and large grains (upto 150mm), the total number of particles per countaveraged ~25 grains. We measured the short axis ofparticles and multiplied the axis length by a factor of 1.07to account for the fact that the true median axis is not alwaysexposed in the photographic image [Bunte and Abt, 2001].Grain-size distributions for photographic pebble countswere comparable with field measurements of particleintermediate axes made using the grid-by-number methodfor select patches (Figure 4). We additionally measuredreach-averaged grain-size distribution spanning the fullchannel reach (including steps and immobile grains within
the bed) using grid-by-number sampling of 100–200 grainsper reach (Table 1).[21] Recovery of painted tracer particles from patches was
limited by burial of grains, potential loss downstream wheretributaries join Elder Creek, wearing away of paint, and thefact that painting in situ did not allow marking the undersideof grains. We counted the painted grain-number densityfrom photographs taken immediately after spray painting(i.e., before transport), and measured the patch area absentof painted grains from photographs taken the following sum-mer after transport had ceased to estimate the number oftransported grains (Figure 5). We compared this estimatewith the total number of recovered grains (Table 4) to calcu-late percent recovery from a patch for a given water year.For cases where aggradation occurred within a patch, thismethod underestimates the true recovery rate; thus, recoverypercents reported here are minimum estimates. Recoveryrates varied from approximately 2 to 85%; low recoveryrates were generally associated with fine patches that experi-enced significant mobility (and hence were more prone toburial and loss downstream).
4. Field Monitoring Results
[22] In this section, we report field results on flow hydrau-lics and sediment transport. Sediment-transport results arereported in two subsections including painted-patch grain-size evolution and particle travel distance. The flow hydraulicand sediment-transport data presented here are used to calcu-late critical Shields stress for grain entrainment in section 5.
4.1. Flow Hydraulics
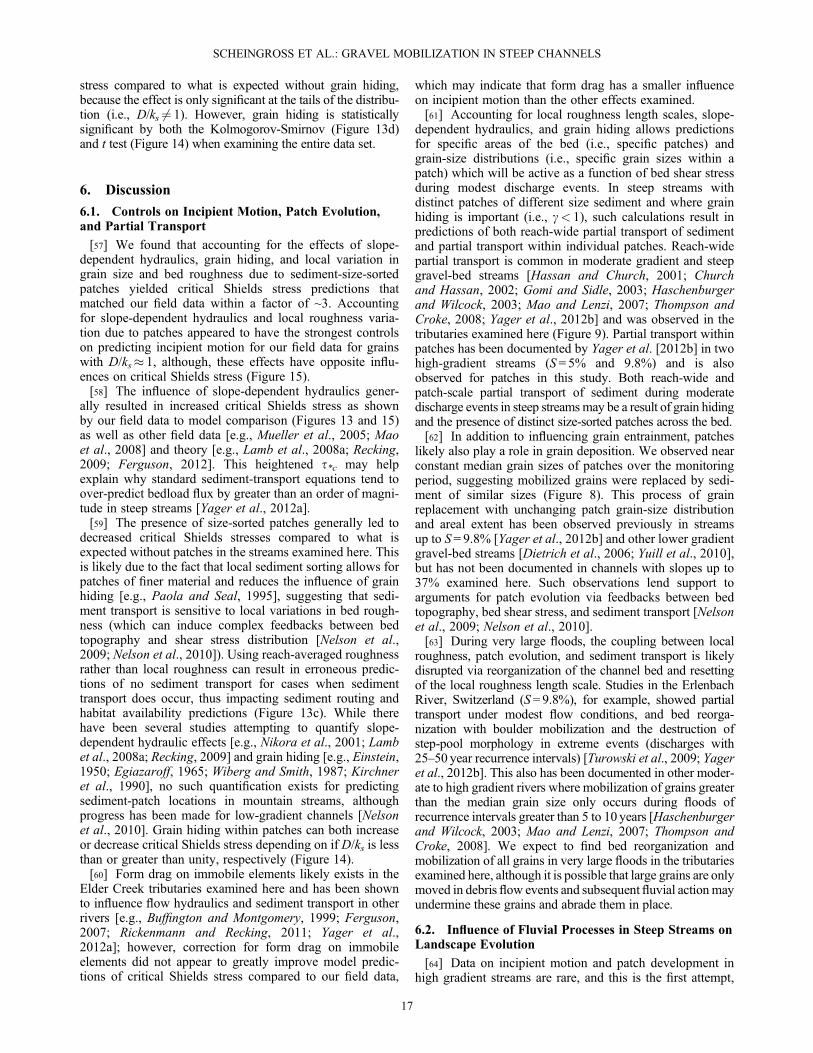
[23] Flow in all study reaches responded to winter storms(Figure 6). Two of the five tributaries had ephemeral flow(reaches 1 and 2, which experienced flow lasting hours todays following storms but no sustained winter base flow),two showed intermittent flow (reaches 3 and 4, whichexperienced winter base flow for the majority of the rainyseason), and one had perennial flow (reach 5). For theephemeral and intermittent streams, flow events were gener-ally longer and had larger peak-stage heights at the end ofthe winter season rather than the beginning. This is likelydue to flow events early in the winter season raising thegroundwater table and (for the intermittent streams) creatingwinter base flow.[24] Peak discharges during the study period were rela-
tively modest (the largest flood occurred in the 2007/2008winter with a recurrence interval of 1.8 years on ElderCreek). Measured peak discharges ranged from 0.03m3/sfor reach 2 to 0.19m3/s for reach 4 (Table 2). Measured peakreach-averaged velocity was 0.25 and 0.32m/s and reach-averaged flow depth was 8.5 and 21 cm for reaches 2 and4, respectively. These flow depths are of similar magnitudeto the measured reach-averaged median grain size (Table 1),and both mobile and immobile particles were often emergentfrom the flow at peak discharge (Figure 2b).[25] We evaluated the performance of our HEC-RAS
modeling by comparing the modeled water surface elevationto observed water surface elevations (Figure 3) and bycomparing the ratio ofU/u* to f predicted by Ferguson [2007]
0
0.5
1a)
100 101 1020
0.5
1b)
Grain diameter (mm)
Cum
ulat
ive
frac
tion
finer
Field Count
Photo Count
Figure 4. Comparison of field- and photo-based grid-by-number pebble counts for (a) reach 5, patch 5b and (b)reach 4, patch 4a. Median grain sizes generally agree withinless than a factor of 2, and there is no systematic bias towardoverpredicting or underpredicting grain-size distributionswith the photograph-based method. Differences in manualand photograph counts should be expected as the exactgrains counted in each method were not the same, and theuse of a grid-by-number method over a small area limitsthe total number of grains counted.
SCHEINGROSS ET AL.: GRAVEL MOBILIZATION IN STEEP CHANNELS
7
U
u�¼ 8
f
� �1=2
¼ a1a2 R=D84ð Þa21 þ a22 R=D84ð Þ 5=3ð Þh i 1=2ð Þ (2)
where a1 = 6.5, a2 = 2.5 as suggested by Ferguson [2007],and D84 is the grain size for which 84% of the reach-widebed is finer. We found reasonable agreement between U/u*and R/D84 (Figure 7), suggesting that HEC-RAS accuratelycaptures flow hydraulics and that f increases with decreasedflow depth to roughness ratios for the streams in which wemeasured discharged. HEC-RAS modeled values of reach-averaged hydraulic radius, velocity, and bed shear stress,ranged from 0.05 to 0.34m, 0.2 to 1.1m/s, and 105 to406 Pa, respectively (Table 5).
4.2. Sediment Mobilization and Preservation of Patches
[26] Despite modest discharges during the study period,eight of the nine painted patches experienced grain mobiliza-tion annually. Field visits before and after storm eventsshowed that sediment movement occurred during largedischarge events in the middle to the end of the rainy seasonwhen stage heights were high. Intensive monitoring inwinter 2008/2009 showed that transport from the patch inreach 1 was limited to a single storm event, two storm eventsproduced sediment transport from the patch in reach 4,three storm events produced transport from patches in reach2, and reach 3 experienced transport from patches in
multiple events (reach 5 was not visited during storms dueto inaccessibility).[27] Repeat pebble counts of painted patches show that
patch median grain size (D50) remained fairly constant(generally within a factor of 3) over the study period for allcases (Figure 8). However, when coarsening or fining didoccur, these trends were often reflected in multiple patchesacross a reach suggesting a reach-wide change in grain size.
c)c) d)d)
a)a)
25 cm25 cm 25 cm25 cm
b)b)
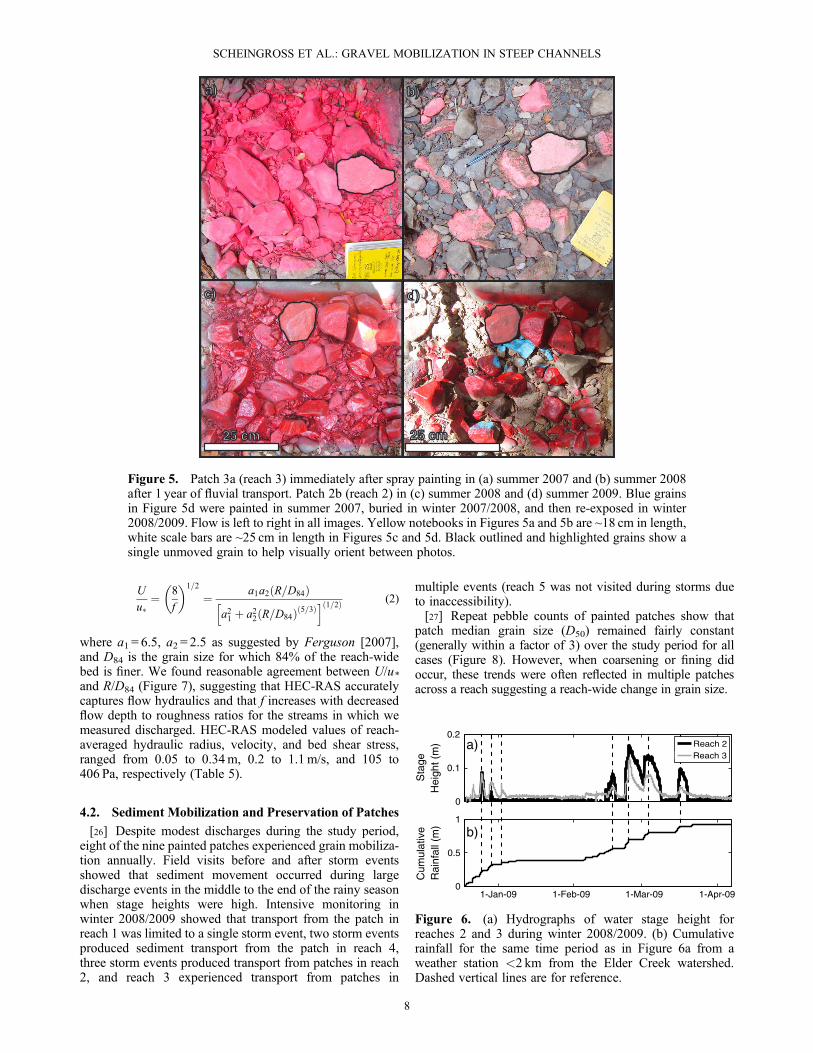
Figure 5. Patch 3a (reach 3) immediately after spray painting in (a) summer 2007 and (b) summer 2008after 1 year of fluvial transport. Patch 2b (reach 2) in (c) summer 2008 and (d) summer 2009. Blue grainsin Figure 5d were painted in summer 2007, buried in winter 2007/2008, and then re-exposed in winter2008/2009. Flow is left to right in all images. Yellow notebooks in Figures 5a and 5b are ~18 cm in length,white scale bars are ~25 cm in length in Figures 5c and 5d. Black outlined and highlighted grains show asingle unmoved grain to help visually orient between photos.
0
0.1
0.2
Sta
ge
a)
1-Jan-09 1-Feb-09 1-Mar-09 1-Apr-090
0.5
1
b)
Hei
ght (
m)
Cum
ulat
ive
Rai
nfal
l (m
)
Reach 2 Reach 3
Figure 6. (a) Hydrographs of water stage height forreaches 2 and 3 during winter 2008/2009. (b) Cumulativerainfall for the same time period as in Figure 6a from aweather station <2 km from the Elder Creek watershed.Dashed vertical lines are for reference.
SCHEINGROSS ET AL.: GRAVEL MOBILIZATION IN STEEP CHANNELS
8

[28] Despite mobilization of gravel in patches, a largefraction of the bed was observed to be stationary over thestudy period both within painted patches and in the reachesas a whole. For patches with regular grain mobilization,the largest grains available in a patch were rarely moved(Figure 9), thus providing evidence that the patches experi-enced partial transport. For example, 75% of transportevents from individual patches failed to move grains largerthan half the diameter of the maximum grain size presentwithin the patch (Figure 9). Of the 50 individually paintedcobbles and boulders, only six cobbles moved. These weregenerally among the smaller grains (D< 150mm) and werenot interlocked. Transport distances for these painted
cobbles and boulders were short (0.2–1m). The lack ofmovement of large cobbles and boulders suggests that thetributaries underwent reach-wide partial transport ofsediment. Reach-wide partial transport was additionallydocumented in reach 2 where a small dam designed to trapsediment deployed in the 2008/2009 winter collected4.3 kg of sediment and showed that the maximum grain sizethat moved through the reach (70mm) was less than thereach-averaged median grain size (97mm).
4.3. Particle Travel Distance
[29] Particle travel distance is a function of both grain weightand the grain size relative to the bed (as smaller particles aremore likely to become trapped behind larger particles [e.g.,Einstein, 1950]). In a compilation of worldwide streams,Church and Hassan [1992] found an inverse relationshipbetween particle size and distance traveled, and other more re-cent studies [e.g.,Wilcock, 1997; Ferguson and Wathen, 1998;Lenzi, 2004; Hodge et al., 2011] have found similar trends. Aninverse trend between particle size and distance transported isexpected if grain weight is the dominant control on particletravel distance; however, preferential trapping of smaller parti-cles within a bed composed of larger grains can cause devia-tions from this trend [e.g., Kirchner et al., 1990]. Church andHassan [1992] noted that distance transported may dependstrongly on grain weight for particles with D/D50> ~2,whereas particles with D/D50< ~2 have a higher likelihoodof being trapped within the bed of coarser grains, and thereforetheir distance traveled may depend less on grain weight.[30] Data on transport distance for all recovered grains (i.e.,
all patches with mobile sediment) in this study show a slightinverse relationship between travel distance and grain sizeand general agreement with the shape of the Church andHassan [1992] relationship but a systematic offset to lowervalues of the normalized travel distance (Figure 10). Data inFigure 10 suggest that smaller particles were transportedslightly farther than larger particles in our studied reaches.Note that Church and Hassan [1992] normalized grain sizeby D50 of the bed subsurface and that we normalize by D50
10−1 10010−1
100
Reach 2 Reach 4 Ferguson, 2007
R/D84
U/u*
Figure 7. Comparison of the HEC-RAS iterated values ofU/u* to those predicted by Ferguson [2007] (equation (2)) asa function of R/D84. U, u*, and R are the reach-averaged flowvelocity, shear velocity, and hydraulic radius, respectively,as predicted by HEC-RAS. D84 is the grain size for which84% of the bed is finer (i.e., the reach-averaged D84).Horizontal and vertical error bars show standard error ofthe mean, error is smaller than the symbol where no errorbars are shown.
Table 5. Reach-Averaged Flow Hydraulic Data for Specific Sediment-Transport Eventsa
Reach Storm tT (Pa) U (m/s) R (m) R/D84-mobile tfd/tT Power Law Cm tfd/tT Mean Cm tfd/tT VPE Cm
1 Winter 2007/2008 199 0.50 0.08 1.78 0.77 0.72 0.891 24 Feb 2009 239 0.30 0.05 1.00 0.89 0.92 0.921 Winter 2009/2010 222 0.34 0.05 1.21 0.86 0.89 0.912 Winter 2007/2008 256 0.48 0.12 0.82 0.68 0.80 0.752 25 Dec 2008 150 0.20 0.06 0.44 0.83 0.94 0.872 24 Feb 2009 216 0.37 0.10 0.67 0.75 0.87 0.762 Winter 2009/2010 233 0.42 0.11 0.73 0.74 0.85 0.773 Winter 2007/2008 185 0.86 0.32 2.24 0.37 0.12 0.733 14 Nov 2008 231 0.22 0.09 0.59 0.90 0.95 0.903 25 Dec 2008 202 0.28 0.11 0.78 0.85 0.91 0.873 24 Feb 2009 172 0.33 0.14 0.95 0.79 0.86 0.853 Winter 2009/2010 164 0.51 0.20 1.39 0.63 0.65 0.794 Winter 2007/2008 388 0.72 0.26 1.33 0.70 0.71 0.844 24 Feb 2009 406 0.53 0.20 1.01 0.79 0.85 0.854 Winter 2009/2010 388 0.75 0.27 1.37 0.68 0.68 0.835 Winter 2007/2008 107 1.05 0.34 3.83 0.14 �1.27 0.715 24 Feb 2009 108 0.48 0.20 2.22 0.71 0.53 0.895 Winter 2009/2010 105 0.91 0.30 3.35 0.25 �0.74 0.74
atT , U, and R are reach-averaged bed shear stress, flow velocity, and hydraulic radius calculated with HEC-RAS. D84-mobile is the 84th percentile reach-averaged mobile grain size, and tfd/tT is fractional form drag for the power law, mean, and VPE Cm methods (section 5.1). Listing of individual storm dates(e.g., 24 Feb 2009) indicates measurements were made for a specific storm event. Listing of a season (e.g., Winter 2007/2008) indicates measurementsintegrate multiple storm events over an entire season, with the peak observed discharge event assumed to have transported all the sediment.
SCHEINGROSS ET AL.: GRAVEL MOBILIZATION IN STEEP CHANNELS
9

of the bed surface. This difference in normalization mayexplain the systematic offset between the data presented hereand the Church and Hassan [1992] relationship because thesurface of the reaches examined in this study were in mostcases armored. Despite increased probability of trapping smallgrains for D/D50< 2, we still observed an overall inverse rela-tionship between grain size and particle transport distance. Theincreased travel distance of small particles allows for replace-ment of gravel within patches by similar sized grains whichmay be sourced from distances several meters upstream.
5. Analysis
[31] In this section, we present an analysis of oursediment-transport data in order to estimate critical Shieldsstress for incipient motion and compare our calculatedShields stress values to theoretical models. We then useflow hydraulic data to estimate form drag and attempt toquantify individually the effects of form drag, slope-dependent hydraulics, bed patchiness, and grain hidingon critical Shields stress.
5.1. Critical Shields Stress
[32] Determining the exact timing of incipient motionfor a given particle is difficult. Since no universal metric isused to define the onset of incipient motion [Buffingtonand Montgomery, 1997], we calculated critical Shieldsstresses using two different approaches to avoid biasesassociated with a single technique. First, we used a flowcompetence approach and assumed the largest transportedgrain moved at the peak observed bed shear stress (tmax)[Andrews, 1983]. With this assumption, equation (1) canbe rewritten as
t�c ¼ tmax
rs � rð ÞgDmax(3)
where Dmax is the largest grain observed to move from agiven patch for a given storm event (or integration ofmultiple storms). This approach is frequently used in fieldstudies of motion in streams with moderate to steep slopes[e.g., Church and Hassan, 2002; Lenzi et al., 2006; Maoet al., 2008; Thompson and Croke, 2008].[33] Second, we estimated t*c by assuming that all
transported grains deposited within 1m of the patch fromwhich they originated were at incipient motion duringthe flood peak. For this method, we calculated the criticalShields stress as
t�c ¼ tmax
rs � rð ÞgD1meter(4)
where D1meter is the mass weighted geometric mean graindiameter of all particles (always >5 grains) recovered within1m downstream of the patch from which they originated.We refer to the second approach as the “one-meter method.”The one-meter method is similar to the particle displacementapproach which is often used in steep streams [e.g., Lenziet al., 2006; Mao et al., 2008]; however, we were unableto measure subgrain-diameter movement (as required forthe particle displacement approach) since grains must moveout of the painted patch in order to observe definitive move-ment. Note that even though we had low recovery rates ofgrains transported from patches, estimates ofDmax andD1meter
are likely accurate as large grains (i.e., Dmax) are easier to see,less likely to be buried, and travel shorter distances than finegrains (Figure 10). Recovery rates of grains deposited nearthe patch (i.e., D1meter) should be high as these grains come
2007 2008 2009 2010
10
Reach 1
2007 2008 2009 201010
1
102
101
102
Reach 2
2007 2008 2009 2010
Reach 3
2007 2008 2009 201010
1
102
Year
Reach 4
2007 2008 2009 2010
101
102
Reach 5
Year
Year
D50
(mm
)D
50 (m
m)
8
30
6
2b
2b3c
5b
5a
3a
Figure 8. Median grain size (D50) and 95% confidence intervals [Bunte and Abt, 2001] for individualpatches examined in this study. Each plot represents a different studied reach, and each line series withina plot is a unique patch for the given reach (noted by patch label where appropriate, i.e., “2b” is patch 2bfrom Table 4).
SCHEINGROSS ET AL.: GRAVEL MOBILIZATION IN STEEP CHANNELS
10

from a small area which was thoroughly searched. For both theflow competence and one-meter methods, we estimated tmax
locally using the modeled bed shear stress given by HEC-RAS (section 3.3, Table 4), which reflects shear stress spenton both mobile and immobile elements (i.e., the total shearstress).[34] Neither of the above approaches provides a perfect
measure of the conditions for incipient motion. The flowcompetence approach assumes that the largest grain recov-ered was mobilized at the highest calculated bed shear stress(and therefore that smaller grains are mobilized at lowershear stresses than larger grains, a condition that generallyexists for gravel-bed streams [Parker, 2008]) and is onlyvalid for cases where the largest grains in the patch remainstationary (i.e., partial transport of the patch, which wasmet in this study). Wilcock [1992] notes that flow compe-tence estimates are subject to large errors as they are basedon an extreme value of the transport grain-size distribution.Similarly, since the flow competence approach uses only asingle grain to estimate critical Shields stress, the conditionsfor mobilization may largely be a function of local pocketgeometry, protrusion, interaction with surrounding grains(e.g., locked in place or free to move), and other local condi-tions at the grain scale [e.g., Kirchner et al., 1990].[35] The one-meter method uses the geometric mean grain
diameter of all particles recovered, thus averaging overgrain-scale heterogeneity inherent with the flow competencemethod. However, the one-meter approach assumes thatgrains at incipient motion are transported shorter distancesthan grains at high transport stages [e.g., Wiberg and Smith,1985]. While this is consistent with our data in general(Figure 10), in some cases, the stopping location of a grainmay be a function of the transported grain size relative to thelocal roughness on the bed [e.g., Dietrich et al., 2006] or afunction of the transported grain size itself [e.g., Church andHassan, 1992], which may introduce error in this method.
[36] Our inferred critical Shields stress values for particlesthat moved are similar for both the flow competence andone-meter methods and vary over 2 orders of magnitudefrom ~0.02 to 2. The majority of t*c estimates have valuesgreater than what is typically assumed for gravel-beddedrivers (i.e., t*c = 0.045). Large variations in critical Shieldsstresses may result from slope-dependent hydraulic effects[e.g., Mueller et al., 2005; Lamb et al., 2008a; Recking,2009], grain hiding, [Einstein, 1950; Egiazaroff, 1965;Wiberg and Smith, 1987], form drag on nonmobile struc-tures [Yager et al., 2007; Yager et al., 2012a], and the pres-ence of sediment patches [Yager et al., 2012b], all of whichexist in the steep streams examined here. These are eachevaluated in section 5.4 using a force-balance model.
5.2. Comparison to Critical Shields Stress Models
[37] We compared our field-estimated critical Shieldsstresses to the theoretical relationships proposed by Wibergand Smith [1987] and Lamb et al. [2008a] (which givessimilar results to Recking [2009]), as well as the empiricalrelationships proposed by Mueller et al. [2005] andFerguson [2012]. Wiberg and Smith [1987] proposed aforce-balance model which predicts grain motion for coarsegrains primarily as a function of the grain size relative to thelocal roughness (i.e., D/ks, where D is the grain size of inter-est, and ks is the local channel roughness for large particleReynolds numbers). This model predicts that t*c decreaseswith increasing slope due to the additional component ofgravity in the downstream direction. Lamb et al. [2008a]modified the Wiberg and Smith [1987] model to includeslope-dependent hydraulic effects and fractional form drag,resulting in a prediction of increasing t*c with slope. For thissection, we set fractional form drag to zero in the Lamb et al.[2008a] model (the influence of form drag is examined insection 5.4). Mueller et al. [2005] predict a positive linearrelationship between t*c (for the median particle size) andslope based on a fit to field data for slopes up to S = 0.05.
10-2
10-2
10-1
10-1
100
100
101
101
Church and Hassan, 1992
This study
Fit by Church and Hassan, 1992
D/D50
L/L D
50
Figure 10. Binned relative grain size moved versus rela-tive distance traveled for tracer pebbles in this study (blackdiamonds) and other studies (gray squares). Error bars are1 geometric standard deviation of binned data. Solid blackline is prediction from Church and Hassan [1992]. L is thetravel distance of a single particle, LD50 is the expected traveldistance of the median grain size based on a power law fit tothe data, D is the grain size of the moved particle, and D50 ismedian grain size of the surface (this study) or subsurface[Church and Hassan, 1992].
0 0.2 0.4 0.6 0.8 10
0.05
0.1
0.15
0.2
0.25
0.3
Pro
babi
lity
Max grain size moved
Max grain size present
Figure 9. Probability distribution of the maximum grainsize moved from a patch for a given storm event relative tothe maximum grain size available in the patch formovement. These data integrate all observed transportevents for each individual patch over the 3 year study period.
SCHEINGROSS ET AL.: GRAVEL MOBILIZATION IN STEEP CHANNELS
11

Ferguson [2012] attributes the heightened t*c with increasingslope entirely to form drag.[38] We evaluated the ability of each model to predict our
field data by performing a two-sample Kolmogorov-Smirnovtest of the log-transformed field-estimated and model-predicted critical Shields stress data. The Kolmogorov-Smirnov test assesses the null hypothesis that two populationsof values belong to the same distribution. In our case, rejectionof the null hypothesis indicates a statistical difference betweenthe field-estimated versus model-predicted critical Shieldsstress distributions, which we interpret to mean the model inquestion does a poor job of predicting critical Shields stress.The Kolmogorov-Smirnov test is advantageous to other good-ness of fit measures (e.g., r2 or residual sum of squares) as itexamines the full cumulative distribution function and is thusless sensitive to a single outlier, and it is designed for smallsample sizes [Zar, 1999].[39] The models described above differ widely in their
ability to match our calculated critical Shields stresses(Figure 11). The Wiberg and Smith [1987] model tends tounderpredict critical Shields stresses, which is likely a result
of the steep slopes examined here for which the model pre-dicts decreased Shields stress due to the increased compo-nent of gravity in the downstream direction (Figure 11a).Both the Mueller et al. [2005] and Ferguson [2012] modelspredict critical Shields stress for the median grain size onlyand thus do not match well our data of grains both smallerand larger than the median size (Figures 11b and 11c). Thedistribution of critical Shields stresses predicted by theWiberg and Smith [1987], Mueller et al. [2005], andFerguson [2012] models are statistically different fromthe distribution of our field-estimated values by theKolmogorov-Smirnov test (for all three models p< 0.001).[40] The Lamb et al. [2008a] relationship is the only model
for which we cannot reject the null hypothesis of theKolmogorov-Smirnov test, and the predicted critical Shieldsstresses are generally within a factor of 3 of the field data(Figure 11d). The factor of 3 in scatter is observed in otherstudies as well, including controlled flume experiments, andcan arise from the stochastic nature of turbulent flow andsediment transport alone [e.g., Mizuyama, 1977; Kirchneret al., 1990; Buffington and Montgomery, 1997]. The data
10−2 10−1 100 101
10−3
10−2
10−1
100
Mueller et al [2005], p < 10-14
Ferguson [2012], p < 10-3
Wiberg and Smith [1987], p < 10-10
Lamb et al [2008a], p = 0.19
pre
dict
ed
field-estimated
Factor of three
1:1Dmax
D1meter
(a) (b)
(c) (d)
10−3
10−2
10−1
100
pre
dict
ed
10−2 10−1 100 101
field-estimated
Figure 11. Comparison of theoretical and empirical predictions to field-estimated critical Shields stresses(t*c). Theories examined include (a) Wiberg and Smith [1987], (b) Mueller et al. [2005], (c) Ferguson[2012], and (d) Lamb et al. [2008a]. In all plots, dashed line is 1:1 line, and solid lines show factor of 3deviation from 1:1 line. Open squares and gray circles are Shields stresses calculated using the flow compe-tence (Dmax) and one-meter (D1meter) methods, respectively. For Ferguson [2012] predictions, all constantswere set to recommended values in Ferguson [2012], D84 was set to D84-mobile, D50 was set to the D50 ofthe local patch in question, and the HEC-RAS calculated reach-averaged hydraulic radius was used in placeof flow depth. For both theWiberg and Smith [1987] and Lamb et al. [2008a] predictions, fractional form dragwas set equal to zero. Results of the two-sample Kolmogorov-Smirnov test comparing field-estimated versusmodel-predicted Shields stress distributions are displayed for each plot, p< 0.05 indicates distributions arestatistically different at the 5% significance level.
SCHEINGROSS ET AL.: GRAVEL MOBILIZATION IN STEEP CHANNELS
12

consistency with the Lamb et al. [2008a] model suggests thatslope-dependent hydraulic effects, local channel roughness,and grain hiding affect incipient sediment motion.
5.3. Form Drag
[41] In steep streams, the presence of large immobilegrains and particle clusters leads to a reduced portion ofthe total shear stress available to act on the mobile sediment[e.g., Brayshaw et al., 1983; Wiberg and Smith, 1991;Buffington and Montgomery, 1999; Millar, 1999; Yageret al., 2007; Yager et al., 2012a]. We accounted for thisreduced shear stress on mobile grains by calculating a“fractional form drag,” tfd/tT, where tfd is the bed shearstress spent on immobile morphologic structures and tT isthe total bed shear stress. We calculated fractional form dragfollowing Yager et al. [2012a] as
tfdtT
¼ 1� tmtT
¼ 1� 0:5rCmU2
tT(5)
where tm is the shear stress on the mobile grains and Cm isthe drag coefficient for mobile sediment. We used resultsfrom the HEC-RAS modeling to solve for the reach-averaged tT (section 3.3 and Table 5). Drag coefficients formobile sediment are not well known; thus, we estimatedCm with three different methods to check for consistency.[42] The first two methods use hydraulic data reported by
Marcus et al. [1992] for a steep mountain stream. FollowingYager et al. [2012a], we assumed tT = tm in the data ofMarcus et al. [1992] based on the observation of minimalboulders, steps, and other structures, and calculated Cm
from 15 separate flow measurements using a normal-flowapproximation for tT so that
Cm ¼ 2tTrU2
¼ 2u�U
� �2¼ 2gRS
U 2(6)
[43] Note that the channel studied by Marcus et al. [1992]likely has some form drag on immobile structures, and ourestimates of Cm from this data should be consideredmaximum values. These Cm estimates vary as a function ofR/D84, although the data are scattered. This scatter causedYager et al. [2012a] to adopt a constant value of Cm,
Cm ¼ 0:44 (7)
[44] Which is an average of the mobile drag coefficientscalculated from the Marcus et al. [1992] data. We used boththe mean Cm value and also fit a power law to the data (here-after referred to as the “power law Cm” method),
Cm ¼ 0:57 R=D84�mobileð Þ�0:96 (8)
with r2 = 0.42 and where D84-mobile is the reach-averagedgrain size for which 84% of mobile sediment is finer.Equation (8) allowed calculations of a flow-depth dependentmobile drag coefficient for sediment-transport events inthis study, where reach-averaged R was obtained fromHEC-RAS, and D84-mobile was calculated from our reach-averaged pebble counts ignoring all grains larger than themaximum observed mobile particle for a given reach (basedon painted particle tracer data) (Table 1).[45] In addition to the two techniques described above, we
also calculated Cm using the variable power equation (VPE)of Ferguson [2007] (hereafter referred to as the “VPE Cm”method) following methods similar to those proposed byRickenmann and Recking [2011] for flow resistancepartitioning. We set D84-mobile as the roughness length scale,
0
0.2
0.4
0.6
0.8
1
Pla
ne B
ed
Woo
d P
oor R
iffle
Woo
d R
ich
Riff
le
Ste
p-po
ol
Fra
ctio
nal
For
m D
rag,τ
/ τ
Yager etal, 2012aMontgomery, 1999
Buffington andThis Study
VP
E C
m
Pow
er-la
w C
m
Mea
n C m
Figure 12. Box and whisker plots of fractional form drag (tfd/tT) from different morphology channels inBuffington and Montgomery [1999] and from this study; solid gray box shows range of form drag calcu-lated from Yager et al. [2012a]. For this study, we report fractional form drag ranges using the VPE, powerlaw, and mean Cm methods (see text for details). Boxes bound the data between the 25th to 75th percentilevalues, the line within the box is the data median, and whiskers show data extent.
SCHEINGROSS ET AL.: GRAVEL MOBILIZATION IN STEEP CHANNELS
13

solved for the Darcy-Weisbach friction factor, f, andestimated Cm directly by substituting equation (2) into (6).This last method is independent of the Marcus et al.[1992] measurements, is based on a large compilation offlow resistance data, and has been shown to accuratelypredict flow resistance in steep streams [Rickenmann andRecking, 2011], although its application to form drag ratherthan flow resistance has not been tested directly.[46] In our monitored tributaries tfd/tT ranged from 0.14 to
0.90, 0.12 to 0.95, and 0.71 to 0.92 with mean values of0.65, 0.74, and 0.81 for Cm estimated with the power law,mean, and VPE methods, respectively (Figure 12 andTable 5). Note that equation (7) (i.e., mean Cm) producedtwo outliers with tfd/tT< 0, which were ignored as negativefractional form drag cannot exist. The results are similarbetween the three different methods, with all methods
predicting large values of form drag and overlappinginterquartile ranges (Figure 12).[47] We compared our calculated fractional form drag in
the Elder Creek tributaries to other streams using datafrom Buffington and Montgomery [1999] and Yager et al.[2012a]. We calculated tfd/tT from data reported byBuffington and Montgomery [1999] using the differencebetween the observed median grain sizes and the mediangrain sizes expected for a channel with no form drag. tTwas calculated assuming uniform flow (i.e., tT= rghS,where h is the reach-averaged flow depth and was used inplace of hydraulic radius which was not reported), tfd wascalculated using the observed grain-size distribution on thebed, tfd = t* c(rs� r)gD50 (which assumes that the mediangrain size is set by a representative bed shear stress), andt*c was set to 0.03 as suggested by Buffington and
10−2
10−1
100
101
10−2 10−1 100 101
τ *c p
redi
cted
10−2
10−1
100
101
τ *c p
redi
cted
τ*c field-estimated10−2 10−1 100 101
τ*c field-estimated
Reach scale roughness (k
s = D
50-reach), p < 10-5
Lamb et al [2008a], p = 0.93
No grain hiding (D/ks = 1),
p = 0.04
No slope-dependenthydraulics,
p < 10-3
DmaxD1meter
(a) (b)
(c) (d)
1:1
Factor of three
Figure 13. Comparison of model-predicted to field-estimated critical Shields stress (t*c) examining theeffects of slope-dependent hydraulics, bed patchiness, and grain hiding. (a) Lamb et al. [2008a]predictions which include the effects of slope-dependent hydraulics, form drag, grain hiding, and patches.(b) Form drag modified Wiberg and Smith [1987] model which includes form drag, patches, and grainhiding effects, but does not include slope-dependent hydraulics. (c) Lamb et al. [2008a] model predictions(where the reach-averaged D50 was used as the roughness length scale rather than the patch D50) whichincludes form drag, slope-dependent hydraulics, and grain hiding effects, but does not include the effectof bed patchiness. (d) Lamb et al. [2008a] model predictions (with D/ks= 1) which includes form drag,patches, and slope-dependent hydraulics effects, but does not include grain hiding effects. For all predic-tions, fractional form drag was set to 0.5; in Figures 13a, 13b, and 13d the patch D50 was used as theroughness length scale, ks. In all plots, dashed line is 1:1 line, and solid lines show factor of 3 deviationfrom 1:1 line; open squares and gray circles are Shields stress calculated using the flow competence (Dmax)and one-meter (D1meter) methods, respectively. Results of the two-sample Kolmogorov-Smirnov testcomparing field-estimated versus model-predicted Shields stress distributions are displayed for each plot;p< 0.05 indicates distributions are statistically different at the 5% significance level.
SCHEINGROSS ET AL.: GRAVEL MOBILIZATION IN STEEP CHANNELS
14

Montgomery [1999]. To calculate fractional form drag fromYager et al. [2012a], we digitized data reporting total shearstress (tT) and shear stress on mobile sediment (tT� tfd)(their figure appendix 1d for variable Cm) and calculated adischarge-dependent range of fractional form drag.[48] The range of tfd/tT from approximately 0.1 to 0.9 in
the Elder Creek tributaries is comparable to (although largerthan) the fractional form drag we calculated from the data ofYager et al. [2012a] (0.53< tfd/tT< 0.80) for a stream of9.8% gradient and to data from Buffington and Montgomery[1999] (0.27< tfd/tT< 0.95) on lower gradient streams withS= 0.2–2.7% (Figure 12). While the lower limit of the tfd/tTrange is smaller in the Elder Creek tributaries compared toother studies, we note that the 25th percentile values of tfd/tTare greater than 0.65 for all three methods, similar to the rangeof values reported by Yager et al. [2012a]. Larger values offractional form drag in the Elder Creek tributaries and theYager et al. [2012a] data may be expected due to the presenceof immobile steps and boulders as opposed to the plane bedand pool-riffle sequences analyzed by Buffington and Mont-gomery [1999]. Our range of calculated form drag is also com-parable to that required for the Lamb et al. [2008a] criticalShields stress model to best match their field data compilation(tfd/tT approximately 0.4 to 0.8, in their Figure 10).
5.4. Relative Influence of Form Drag, Channel Slope,Patches, and Grain Hiding on Critical Shields Stress
[49] In this section, we use our field data and the modelsof Wiberg and Smith [1987] and Lamb et al. [2008a] toinvestigate the influence of form drag, slope, bed patchiness,and grain hiding on critical Shields stress values. While thereexist a number of theoretical and empirical models to predict
critical Shields stress (discussed above), we use the Wibergand Smith [1987] and Lamb et al. [2008a] models becausethey provide a framework to isolate the effects of form drag,channel slope, grain hiding, and bed patchiness independently.5.4.1. Influence of Form Drag[50] Our field-estimated critical Shields stresses use HEC-
RAS modeled total bed shear stress and thus include any formdrag present within the channel. To assess the form drag influ-ence, we compared field-estimated critical Shields stresses tomodel predictions which account for form drag by settingtfd/tT in the Lamb et al. [2008a] model to values calculatedusing the mean (i.e., equation 7), power law (i.e., equation 8),and VPE Cm methods (section 5.3). We also set tfd/tT to aconstant value of tfd/tT=0.5 which best matches the field andflume data collection of Lamb et al. [2008a], as well astfd/tT=0 for the sake of comparison. For all four form dragparameterizations, as well as the case of no form drag, we can-not reject the null hypothesis of the Kolmogorov-Smirnov testat the 5% significance level (p values of 0.07, 0.12, 0.19,0.30, and 0.93 for the mean Cm, power law Cm, tfd/tT=0,VPE Cm, and tfd/tT=0.5 form drag parameterizations, respec-tively). This result implies that it may be possible to explainthe field-estimated critical Shields stress values with or withoutthe inclusion of form drag, and thus, the influence of form drag
10−1 100 10110−1
100
101
γ = 0.51
γ = 0Size
Equal
γ = 1Threshold
Dmax
:
D1meter
:
Inde
pend
ence
D/ks
Figure 14. Calculated critical shear stress (tc) normalizedby shear stress for D =D50 = ks of the patch surface (tks)versus sediment size (D) normalized by the roughness lengthks for both flow competence and 1m data. Here D is Dmax
for flow competence data and D1meter for the one-metermethod, and ks is the mass weighted geometric mean graindiameter of the surface of the patch from which thegrain originated. The solid line is a best fit to all the log-transformed data (tc/tks= (D/ks)
1�0.51), r2 = 0.26. The g valueof 0.51 is statistically distinct from an equal threshold ofmotion (i.e., g = 1, t test, p = 0.002). Also labeled are linesof equal threshold and size independence.
0.1
1
10
No
slope
−dep
ende
nt
hydr
aulic
s
No
form
dra
gN
o gr
ain
hidi
ng
(D/k s
= 1
)Rea
ch sc
ale r
ough
ness
(k s =
D50
-rea
ch)
*c-f
ield
*c
-mod
el
Figure 15. Box and whisker plots of the ratio of field-estimated (t*c-field) to model-predicted (t*c-model) criticalShields stress (t*c). Boxes bound the data between the 25thto 75th percentile values, the line within the box is thedata median, and whiskers show data extent. Dashed lineat t*c-field/t*c-model = 1 separates effects which increase(t*c-field/t*c-model> 1) and decrease (t*c-field/t*c-model< 1)critical Shields stress. For all model predictions, fractionalform drag was set to 0.5, and the patch median grain sizewas used as the roughness length scale, unless otherwisespecified. Model predictions used include the Wiberg andSmith [1987] theory (“no slope-dependent hydraulics”), Lambet al. [2008a] theory with fractional form drag set to zero (“noform drag”), Lamb et al. [2008a] theory with D/ks=1 (“nograin hiding”), and Lamb et al. [2008a] theory where thereach-averaged D50 was used as the roughness length scalerather than the patch D50 (“reach scale roughness”).
SCHEINGROSS ET AL.: GRAVEL MOBILIZATION IN STEEP CHANNELS
15

may be small compared to other factors which influence criticalShields stress (i.e., grain hiding, bed patchiness, and slope-dependent hydraulics discussed below). Setting fractional formdrag to a constant value of tfd/tT=0.5 visually appears to matchthe field data well (Figure 13a), and we use this value for theremainder ofmodel calculations; however, using other form dragparameterizations does not change the main points of this paper.5.4.2. Influence of Hydraulics at Steep Slopes[51] Changes in the flow velocity structure, turbulent fluc-
tuations, and grain emergence at low flow depth to bed-roughness ratios lead to increased t*c for steep slopes [Lambet al., 2008a; Recking, 2009]. To isolate these slope-dependenteffects on critical Shields stress, we compared our results tomodel predictions of Wiberg and Smith [1987] which doesnot include these effects. Following the methodology ofLamb et al. [2008a], we added a fractional form drag term(tfd/tT=0.5) to the Wiberg and Smith [1987] model so thatdifferences between the Lamb et al. [2008a] and Wiberg andSmith [1987] models reflect only the inclusion of slope-dependent flow hydraulics and grain emergence in the former.TheWiberg and Smith [1987] model tends to underpredict thefield-estimated critical Shields stress values and is statisticallydistinct from the distribution of field data (p=0.0002 in atwo-sample Kolmogorov-Smirnov test, Figure 13b). Thisimplies that incipient sediment motion is influenced byslope-dependent hydraulics.5.4.3. Influence of Patches and Local Roughness[52] The agreement between calculated andmodeled critical
Shields stresses in Figure 13a was achieved in part because ofthe field identification of individual, size-sorted sedimentpatches used to define the local roughness scale of the bed(i.e., ks). Because steep streams include both relatively mobilefine gravel and less mobile cobbles and boulders [e.g., Yageret al., 2012a;b], using reach-averaged median grain size(D50-reach) as the roughness length scale (i.e., ks=D50-reach)as opposed to local median grain size of the patch (D50-patch)as the roughness length scale (i.e., ks=D50-patch) can lead topredictions of no sediment motion due to artificially inflatedcritical Shields stresses. To illustrate this point, we comparedLamb et al. [2008a] model predictions of critical Shieldsstresses to our data using patch- versus reach-averaged mediangrain size as the bed-roughness length scale, with tfd/tT= 0.5.Setting ks=D50-reach tends to over-predict critical Shieldsstress and results in statistically distinct distributions of fieldand model data (p< 10�5, two-sample Kolmogorov-Smirnov test, Figure 13c), while using ks=D50-patch does not(p=0.93, two-sample Kolmogorov-Smirnov test, Figure 13a).These results imply that initial sediment motion in steepchannels is influenced by local roughness controlled by bedsurface patchiness.5.4.4. Influence of Grain Hiding[53] We compared our calculated t*c values to those
predicted by the Lamb et al. [2008a] model with D/ks = 1(i.e., ignoring grain hiding) versus D/ks set equal to the valuemeasured in the field. For both cases, we set tfd/tT = 0.5 andused a two-sample Kolmogorov-Smirnov test to evaluatemodel performance. A model without grain hiding can leadto both overprediction and underprediction of t*c dependingon if D/ks is less than or greater than unity, respectively. Thiseffect is illustrated in Figure 13d, where model predictionswith D/ks= 1 are approximately evenly distributed aboveand below the 1:1 line. The distribution of critical Shields
stresses predicted with D/ks = 1 are statistically distinct atthe 5% significance level from the field-estimated Shieldsstresses (where D/ks is allowed to vary, p = 0.037), implyingthat including grain hiding within patches influences initialmotion in our dataset.[54] We also examined the influence of relative grain size
using a hiding function [e.g., Parker, 2008],
tctks
¼ D
ks
� �1�g
(9)
where tc is the critical shear stress for the grain size ofinterest, tks is the critical shear stress for D= ks, and g isa nondimensional constant that describes the relative impor-tance of hiding effects on grain mobilization. Following theterminology of Parker [2008], we refer to the case wheng = 0 as “size independence” (the critical shear stress to mo-bilize grains is linearly proportional to grain diameter;hence, there are no hiding effects) and when g = 1 as “equalthreshold” (hiding effects dominate causing all grains tomove at the same critical shear stress).[55] We estimated g using our field data to find a best fit to
equation (9). We used HEC-RAS modeling to estimatetc (tmax in Table 4) and calculated tks using the Lamb et al.[2008a] model (with tfd/tT= 0.5). We found g= 0.51 basedon a linear best fit to our log-transformed incipient-motiondata (Figure 14). The data are scattered (r2 = 0.26), but ourg value of 0.51 is statistically distinct from equal thresholdof motion (i.e., g= 1) based on a t test (p = 0.002). Thebest-fit g value is lower than other values reported in highgradient streams by Mao et al. [2008] (0.79 and 0.64) andYager et al. [2012a] (g = 0.62) and is also lower than datacompiled by Parker [2008], which shows a mean value ofg = 0.79� 0.16 (mean� standard deviation) on modestsloping gravel-bed streams (S=1–1.5%). This low g valueindicates a reduced influence of hiding effects in steep streamsand suggests that small grains are relatively easier to transportthan large grains, ultimately leading to the preference ofmobilization of distinct size classes during a given flow event.A preference to transport smaller grains (i.e., D/ks< 1) issupported by our observations of particle transport distances(Figure 10) and partial transport (Figure 9) and leads toincreased t*c values compared to assuming that the mediangrain size will be mobilized (i.e., D/ks=1).5.4.5. Summary of Dominant Effects on Initial Motion[56] We examined the net effect of form drag, slope-
dependent hydraulics, bed patchiness, and grain hidingby calculating the ratio of the field-estimated (t*c-field)to model-predicted (t*c-model) critical Shields stress (Figure 15).Effects which increase critical Shields stress result int*c-field/t*c-model> 1, while effects which decrease criticalShields stress result in t*c-field/t*c-model< 1. We took themedian t*c-field/t*c-model value as a proxy for the general degreeto which a specific effect increases or decreases critical Shieldsstress according to the model. Slope-dependent hydraulics andform drag generally led to increased critical Shields stresscompared to what is expected without these effects (mediant*c-field/t*c-model of 2.9 and 1.8, respectively). Size-sortedpatches caused reduction of critical Shields stress by a factorof 2.3 (median t*c-field/t*c-model of 0.44) compared to what isexpected without patches. For our field data, grain hiding didnot cause a substantial change in the median critical Shields
SCHEINGROSS ET AL.: GRAVEL MOBILIZATION IN STEEP CHANNELS
16
stress compared to what is expected without grain hiding,because the effect is only significant at the tails of the distribu-tion (i.e., D/ks 6¼ 1). However, grain hiding is statisticallysignificant by both the Kolmogorov-Smirnov (Figure 13d)and t test (Figure 14) when examining the entire data set.
6. Discussion
6.1. Controls on Incipient Motion, Patch Evolution,and Partial Transport
[57] We found that accounting for the effects of slope-dependent hydraulics, grain hiding, and local variation ingrain size and bed roughness due to sediment-size-sortedpatches yielded critical Shields stress predictions thatmatched our field data within a factor of ~3. Accountingfor slope-dependent hydraulics and local roughness varia-tion due to patches appeared to have the strongest controlson predicting incipient motion for our field data for grainswith D/ks� 1, although, these effects have opposite influ-ences on critical Shields stress (Figure 15).[58] The influence of slope-dependent hydraulics gener-
ally resulted in increased critical Shields stress as shownby our field data to model comparison (Figures 13 and 15)as well as other field data [e.g., Mueller et al., 2005; Maoet al., 2008] and theory [e.g., Lamb et al., 2008a; Recking,2009; Ferguson, 2012]. This heightened t*c may helpexplain why standard sediment-transport equations tend toover-predict bedload flux by greater than an order of magni-tude in steep streams [Yager et al., 2012a].[59] The presence of size-sorted patches generally led to
decreased critical Shields stresses compared to what isexpected without patches in the streams examined here. Thisis likely due to the fact that local sediment sorting allows forpatches of finer material and reduces the influence of grainhiding [e.g., Paola and Seal, 1995], suggesting that sedi-ment transport is sensitive to local variations in bed rough-ness (which can induce complex feedbacks between bedtopography and shear stress distribution [Nelson et al.,2009; Nelson et al., 2010]). Using reach-averaged roughnessrather than local roughness can result in erroneous predic-tions of no sediment transport for cases when sedimenttransport does occur, thus impacting sediment routing andhabitat availability predictions (Figure 13c). While therehave been several studies attempting to quantify slope-dependent hydraulic effects [e.g., Nikora et al., 2001; Lambet al., 2008a; Recking, 2009] and grain hiding [e.g., Einstein,1950; Egiazaroff, 1965; Wiberg and Smith, 1987; Kirchneret al., 1990], no such quantification exists for predictingsediment-patch locations in mountain streams, althoughprogress has been made for low-gradient channels [Nelsonet al., 2010]. Grain hiding within patches can both increaseor decrease critical Shields stress depending on if D/ks is lessthan or greater than unity, respectively (Figure 14).[60] Form drag on immobile elements likely exists in the
Elder Creek tributaries examined here and has been shownto influence flow hydraulics and sediment transport in otherrivers [e.g., Buffington and Montgomery, 1999; Ferguson,2007; Rickenmann and Recking, 2011; Yager et al.,2012a]; however, correction for form drag on immobileelements did not appear to greatly improve model predic-tions of critical Shields stress compared to our field data,
which may indicate that form drag has a smaller influenceon incipient motion than the other effects examined.[61] Accounting for local roughness length scales, slope-
dependent hydraulics, and grain hiding allows predictionsfor specific areas of the bed (i.e., specific patches) andgrain-size distributions (i.e., specific grain sizes within apatch) which will be active as a function of bed shear stressduring modest discharge events. In steep streams withdistinct patches of different size sediment and where grainhiding is important (i.e., g< 1), such calculations result inpredictions of both reach-wide partial transport of sedimentand partial transport within individual patches. Reach-widepartial transport is common in moderate gradient and steepgravel-bed streams [Hassan and Church, 2001; Churchand Hassan, 2002; Gomi and Sidle, 2003; Haschenburgerand Wilcock, 2003; Mao and Lenzi, 2007; Thompson andCroke, 2008; Yager et al., 2012b] and was observed in thetributaries examined here (Figure 9). Partial transport withinpatches has been documented by Yager et al. [2012b] in twohigh-gradient streams (S = 5% and 9.8%) and is alsoobserved for patches in this study. Both reach-wide andpatch-scale partial transport of sediment during moderatedischarge events in steep streamsmay be a result of grain hidingand the presence of distinct size-sorted patches across the bed.[62] In addition to influencing grain entrainment, patches
likely also play a role in grain deposition. We observed nearconstant median grain sizes of patches over the monitoringperiod, suggesting mobilized grains were replaced by sedi-ment of similar sizes (Figure 8). This process of grainreplacement with unchanging patch grain-size distributionand areal extent has been observed previously in streamsup to S = 9.8% [Yager et al., 2012b] and other lower gradientgravel-bed streams [Dietrich et al., 2006; Yuill et al., 2010],but has not been documented in channels with slopes up to37% examined here. Such observations lend support toarguments for patch evolution via feedbacks between bedtopography, bed shear stress, and sediment transport [Nelsonet al., 2009; Nelson et al., 2010].[63] During very large floods, the coupling between local
roughness, patch evolution, and sediment transport is likelydisrupted via reorganization of the channel bed and resettingof the local roughness length scale. Studies in the ErlenbachRiver, Switzerland (S=9.8%), for example, showed partialtransport under modest flow conditions, and bed reorga-nization with boulder mobilization and the destruction ofstep-pool morphology in extreme events (discharges with25–50 year recurrence intervals) [Turowski et al., 2009; Yageret al., 2012b]. This also has been documented in other moder-ate to high gradient rivers where mobilization of grains greaterthan the median grain size only occurs during floods ofrecurrence intervals greater than 5 to 10 years [Haschenburgerand Wilcock, 2003; Mao and Lenzi, 2007; Thompson andCroke, 2008]. We expect to find bed reorganization andmobilization of all grains in very large floods in the tributariesexamined here, although it is possible that large grains are onlymoved in debris flow events and subsequent fluvial actionmayundermine these grains and abrade them in place.
6.2. Influence of Fluvial Processes in Steep Streams onLandscape Evolution
[64] Data on incipient motion and patch development inhigh gradient streams are rare, and this is the first attempt,
SCHEINGROSS ET AL.: GRAVEL MOBILIZATION IN STEEP CHANNELS
17

to our knowledge, to document field-based critical Shieldsvalues for streams with S> 14%. While it is often assumedthat steep streams are dominated by debris flow processes[e.g., Stock and Dietrich, 2003; Stock and Dietrich, 2006],we found that fluvial processes active at moderate gradientgravel-bed streams (S� 1–5%) occurred in the steep streamsexamined here (S> 5%); although often only a select frac-tion of the bed was mobilized as the reaches experiencedpartial transport of sediment. These results show that fluvialprocesses play a key role in transporting gravel downstreamduring storms in very steep channels (at least up to 37%slope), with implications for sediment routing models andhabitat assessment for aquatic organisms (which often havedistinct relationships with the local substrate [e.g., Lisle,1989]).[65] While our results show that fluvial sediment transport
occurs, it is difficult to assess the relative importance offluvial versus debris flow processes over landscape evolu-tion timescales in our study area. Almost all of the tributariesjoining Elder Creek are incised into debris flow fans, whichoften have boulders larger than 1m in diameter. Theseentrenched channels with imbricated cobbles suggest thatfluvial processes entrain and transport material from debrisflow deposits (and gravel entering the river between debrisflow events) to lower gradient streams within the ElderCreek watershed. Fluvial and debris flow processes likelyoccur over different time scales in the tributaries monitoredhere, with fluvial mobilization of gravel on an annual basisand intermittent debris flow activity occurring over centuriesto millennia [Scheingross et al., 2008].
7. Conclusions
[66] We monitored mobilization of sediment in five small(drainage areas of 0.04 to 2 km2) and steep (S=5–37%) tribu-taries of Elder Creek, CA. Our results show that smaller grainstended to travel further distances than larger grains, and sedi-ment patches tended to maintain near-constant median grainsizes temporally. There was partial transport of sediment bothreach-wide and within individual patches, indicating that largeportions of the bed (usually composed of large grains) areimmobile during modest flow conditions. Flow resistancewas similar to that predicted by Ferguson [2007], where theDarcy-Weisbach friction factor increased with increasing rela-tive roughness. Using three different methods to calculateform drag on immobile elements, we found that form dragon immobile structures accounted for approximately 80% ofthe total bed stress, with the remaining 20% of the total bedstress available for sediment transport. Field-estimated valuesof the Shields stress at incipient motion range from 0.02 to 2and agree with theoretical predictions within a factor of ~3when slope-dependent changes in flow hydraulics, sediment-size-sorted patches, and grain hiding effects were taken intoaccount. We saw no improvement of model predictions whenincluding the effect of form drag, suggesting that form drag in-fluences critical Shields stress less than the other effects exam-ined. Slope-dependent hydraulics and the presence of patcheshad the strongest (although opposite) influence on incipientmotion, resulting in increased and decreased t*c, respectively.For grains smaller or larger than the roughness length scale,grain hiding influenced incipient motion. Larger grains tended
to move at higher shear stresses leading to partial transportboth within patches and reach-wide.[67] Our results suggest that accounting for the effects
of local variation in roughness due to patches, slope-dependent hydraulics, and grain hiding allows for predictionof both specific patches that will be active and for theapproximate grain-size distribution mobilized from patchesas a function of bed shear stress. Such predictions offeran improvement over traditional methods (i.e., assumingt*c� 0.045 and that all grains are mobilized at the sametime) and should be useful for sedimentation engineering,stream restoration efforts, and predictions of aquatic habitatavailability. In very steep channels, often considered to bedominated by debris flows, our results show that fluvialsediment transport occurs even for modest flows withimplications for sediment routing and landscape evolution.
Notation
Cm drag coefficient for mobile sediment[dimensionless].
D grain size [L].D16, D50, D84 grain size for which 16, 50, and 84%,
respectively, of the grain-size distributionis finer [L].
D50-patch grain size for which 50% of the grain-sizedistribution of a patch is finer [L].
D50-reach grain size for which 50% of the grain-sizedistribution reach-wide is finer [L].
D84-mobile grain size for which 84% of the mobilesediment reach-wide is finer [L].
D1meter mass weighted geometric mean graindiameter of particles transported< 1m froma patch [L].
Dmax maximum grain size moved from apatch [L].
f Darcy-Weisbach friction factor [dimensionless].g acceleration due to gravity [L T�2].h reach-averaged flow depth [L].ks roughness length scale [L].L tracer particle travel distance [L].
LD50 Expected travel distance for a grain withthe median diameter grain size based on apower law fit to L versus D [L].
R reach-averaged hydraulic radius [L].S channel gradient [dimensionless].U reach-averaged flow velocity [L T�1].u* bed shear velocity [L T�1].g hiding function constant [dimensionless].r fluid density [ML�3].rs sediment density [ML�3].t bed shear stress [ML�2 T�2].
tmax bed shear stress at peak-stage height[ML�2 T�2].
tc critical bed shear stress [ML�2 T�2].tfd bed shear stress borne on immobile
morphologic structures [ML�2 T�2].tks critical bed shear stress for the median grain
size [ML�2 T�2].tm shear stress borne on the mobile sediment
[ML�2 T�2].
SCHEINGROSS ET AL.: GRAVEL MOBILIZATION IN STEEP CHANNELS
18

tT total bed shear stress [ML�2 T�2].t*c critical bed Shields stress [dimensionless].
t*c-field field-estimated values of critical bedShields stress [dimensionless].
t*c-model model-predicted values of critical bedShields stress [dimensionless].
[69] Acknowledgments. Support for this work came from the NationalCenter for Earth-Surface Dynamics, NASA BioMars Grant to W.E.D., theCharles H. Ramsden Endowed Fund to J.S.S., and NSF EAR-0922199 grant toM.P.L. J.S.S.was partially supported by a NSF Graduate Research Fellowship.We thank Toby Minear for assistance with terrestrial LiDAR scanning. Airbornelaser swath mapping data were provided by the National Center for AirborneLaser Mapping. Jonathan Perkins, Peter Nelson, Kathleen Swanson, JasperOshun, Eric Kleinsasser, Alessandro Uccelli, Sam Peach, Ben Mackey, ColinPhillips, Evan Scheingross, Matt Stuckey, and Clark Winchell assisted with fieldwork.We thank Peter Steel for facilitating land access and logistical support at theUniversity of California’s Angelo Coast Range Reserve. This manuscript greatlybenefited from constructive reviews byDieter Rickenmann, André Zimmermann,and an anonymous reviewer, as well as editing by Alexander Densmore and JohnPitlick.
ReferencesAndrews, E. D. (1983), Entrainment of gravel from naturally sorted riverbedmaterial, Geol. Soc. Am. Bull., 94(10), 1225–1231.
Ashida, K., and M. Bayazi (1973), Initiation of motion and roughness offlows in steep channels, Int. Assoc. Hydraul. Res. Proc. 15th Congr.,Istanbul, Turkey, 1, 475–484.
Bathurst, J. C., H. H. Cao, and W. H. Graf (1984), Hydraulics and sedimenttransport in a steep flume. Data from the EPFL study, Rep. 64, Institute ofHydrology, Wallingford, Oxon, England.
Benda, L., M. A. Hassan, M. Church, and C. L. May (2005), Geomor-phology of steepland headwaters: The transition from hillslopes tochannels, J. Am. Water Resour. Assoc., 41(4), 835–851.
Brayshaw, A. C., L. E. Frostick, and I. Reid (1983), The hydrodynamicsof particle clusters and sediment entrainment in coarse alluvialchannels, Sedimentology, 30(1), 137–143, doi:10.1111/j.1365-3091.1983.tb00656.X.
Buffington, J. M., and D. R. Montgomery (1997), A systematic analysisof eight decades of incipient motion studies, with special reference togravel-bedded rivers, Water Resour. Res., 33(8), 1993–2029, doi:10.1029/96WR03190.
Buffington, J. M., and D. R. Montgomery (1999), Effects of hydraulicroughness on surface textures of gravel-bed rivers, Water Resour. Res.,35(11), 3507–3521, doi:10.1029/1999WR900138.
Buffington, J. M., D. R. Montgomery, and H. M. Greenberg (2004), Basin-scale availability of salmonid spawning gravel as influenced by channeltype and hydraulic roughness in mountain catchments, Can. J. Fish.Aquat. Sci., 61(11), 2085–2096, doi:10.1139/f04-141.
Bunte, K., and S. R. Abt (2001), Sampling surface and subsurface particle-size distributions in wadable gravel- and cobble-bed streams for analysesin sediment transport, hydraulics, and streambed monitoring, Rep. RMRS-GTR-74, United States Department of Agriculture, Rocky MountainResearch Station, Fort Collins, CO.
Calkins, D., and T. Dunne (1970), A salt tracing method for measuringchannel velocities in small mountain streams, J. Hydrol., 11, 379–392.
Church, M., and M. A. Hassan (1992), Size and distance of travelof unconstrained clasts on a streambed, Water Resour. Res., 28(1),299–303, doi:10.1029/91WR02523.
Church, M., and M. A. Hassan (2002), Mobility of bed material in HarrisCreek, Water Resour. Res., 38(11), 1237, doi:10.1029/2001wr000753.
Comiti, F., and L. Mao (2012), Recent advances in the dynamics of steepchannels, in Gravel-Bed Rivers: Processes, Tools, Environments, editedby M. Church, P. M. Biron, and A. G. Roy, Wiley-Blackwell, Chichester,353-377.
Cui, Y. T., and G. Parker (2005), Numerical model of sediment pulses andsediment-supply disturbances in mountain rivers, J. Hydraul. Eng.-Asce,131(8), 646–656, doi:10.1061/(asce)0733-9429(2005)131:8(646).
Day, T. J. (1977a), Field procedures and evaluation of a slug dilutiongauging method in mountain streams, J. Hydrol. New Zealand, 16(2),113–133.
Day, T. J. (1977b), Observed mixing lengths in mountain streams,J. Hydrol., 35(1–2), doi:10.1016/0022-1694(77)90081-6.
Dietrich, W. E., D. G. Bellugi, L. S. Sklar, J. D. Stock, A. M. Heimsath, andJ. J. Roering (2003), Geomorphic transport laws for predicting landscape
form and dynamics, in Prediction in Geomorphology, edited by P. R.Wilcock, and R. Iverson, American Geophysical Union, WashingtonDC, 103-132.
Dietrich, W. E., P. A. Nelson, E. Yager, J. G. Venditti, M. P. Lamb, andL. Collins (2006), Sediment patches, sediment supply, and channelmorphology, in River, Coastal and Estuarine Morphodynamics, RCEM2005, edited by G. Parker, and M. H. Garcia, pp. 79–90, Taylor andFrancis/Balkema, The Netherlands.
Egiazaroff, I. V. (1965), Calculation of non-uniform sediment concentra-tions, J. Hydraul. Eng., 91(4), 225–248.
Einstein, H. A. (1950), The bedload function for sediment transport inopen channel flows, Rep. Technical Bulletin no. 1026, US Departmentof Agriculture, Washington DC.
Elder, K., R. Kattelmann, and R. Ferguson (1990), Refinements in dilutiongauging for mountain streams, in Hydrology in mountainous regions,I—hydrological measurements; the water cycle, Proceedings of twoLausanne Symposia, IAHS Publication no. 193.
Ferguson, R. (2007), Flow resistance equations for gravel- and boulder-bedstreams, Water Resour. Res., 43, W05427, doi:10.1029/2006wr005422.
Ferguson, R. I. (2012), River channel slope, flow resistance, and gravelentrainment thresholds, Water Resour. Res., 48, W05517, doi:10.1029/2011wr010850.
Ferguson, R. I., and S. J. Wathen (1998), Tracer-pebble movement along aconcave river profile: Virtual velocity in relation to grain size and shearstress, Water Resour. Res., 34(8), 2031–2038, doi:10.1029/98WR01283.
Fuller, T. K., L. A. Perg, J. K. Willenbring, and K. Lepper (2009), Fieldevidence for climate-driven changes in sediment supply leading to strathterrace formation, Geology, 37, 467–470, doi:10.1130/g25487a.1.
Gomi, T., and R. C. Sidle (2003), Bed load transport in managed steep-gradient headwater streams of southeastern Alaska, Water Resour. Res.,39(12), 1336, doi:10.1029/2003wr002440.
Grant, G. E., F. J. Swanson, and M. G. Wolman (1990), Pattern and originof stepped-bed morphology in high-gradient streams, western Cascades,Oregon, Geol. Soc. Am. Bull., 102(3), 340–352, doi:10.1130/0016-7606(1990)102< 0340:paoosb> 2.3.co;2.
Haschenburger, J. K., and P. R. Wilcock (2003), Partial transport in anatural gravel bed channel, Water Resour. Res., 39(1), 1020, doi:10.1029/2002wr001532.
Hassan, M. A., and M. Church (2001), Sensitivity of bed load transport inHarris Creek: Seasonal and spatial variation over a cobble-gravel bar,Water Resour. Res., 37(3), 813–825, doi:10.1029/2000WR900346.
Hodge, R. A., T. B. Hoey, and L. S. Sklar (2011), Bed load transport inbedrock rivers: The role of sediment cover in grain entrainment, translation,and deposition, J. Geophys. Res., 116, F04028, doi:10.1029/2011jf002032.
Holmes, R. R., Jr., P. J. Terrio, M. A. Harris, and P. C. Mills (2001), Intro-duction to field methods for hydrologic and environmental studies, USGeological Survey Open-file report 01-50, Urbana, Illinois.
Hudson, R., and J. Fraser (2005), Introduction to salt dilution gauging forstreamflow measurement part IV: The mass balance (or dry injection)method, Streamline Watershed Manag. Bull., 9(1), 6–12.
Jayko, A. S., M. C. Blake, R. J. McLaughlin, H. N. Ohlin, S. D. Ellen, andH. M. Kelsey (1989), Reconnaissance geologic map of the Covelo 30- by60-minute quadrangle, northern California, Rep. Miscellaneous FieldStudies Map MF-2001, scale 1:100,000, United States Geological Survey,Washington, DC.
Kirchner, J. W., W. E. Dietrich, F. Iseya, and H. Ikeda (1990), The variabilityof critical shear-stress, friction angle, and grain protrusion in water-workedsediments, Sedimentology, 37(4), 647–672.
Lamb, M. P., W. E. Dietrich, and J. G. Venditti (2008a), Is the criticalshields stress for incipient sediment motion dependent on channel-bedslope?, J. Geophys. Res., 113, F02008, doi:10.1029/2007jf000831.
Lamb, M. P., W. E. Dietrich, and L. S. Sklar (2008b), A model for fluvialbedrock incision by impacting suspended and bed load sediment,J. Geophys. Res., 113, F03025, doi:10.1029/2007jf000915.
Lenzi, M. A. (2004), Displacement and transport of marked pebbles,cobbles and boulders during floods in a steep mountain stream, Hydrol.Process., 18(10), 1899–1914, doi:10.1002/hyp.1456.
Lenzi, M. A., L. Mao, and F. Comiti (2006), When does bedloadtransport begin in steep boulder-bed streams?, Hydrol. Process., 20(16),3517–3533, doi:10.1002/hyp.6168.
Lisle, T. E. (1989), Sediment transport and resulting deposition in spawninggravels, north coastal California, Water Resour. Res., 25(6), 1303–1319,doi:10.1029/WR025i006p01303.
Mao, L., and M. A. Lenzi (2007), Sediment mobility and bedload transportconditions in an alpine stream, Hydrol. Process., 21(14), 1882–1891,doi:10.1002/hyp.6372.
Mao, L., G. P. Uyttendaele, A. Iroume, and M. A. Lenzi (2008), Field basedanalysis of sediment entrainment in two high gradient streams located inalpine and Andine environments, Geomorphology, 93(3–4), 368–383,doi:10.1016/j.geomorph.2007.03.008.
SCHEINGROSS ET AL.: GRAVEL MOBILIZATION IN STEEP CHANNELS
19

Marcus, W. A., K. Roberts, L. Harvey, and G. Tackman (1992), Anevaluation of methods for estimating Mannings-n in small mountainstreams, Mt. Res. Dev., 12(3), 227–239.
Mast, M. A., and D. W. Chow (2000), Environmental characteristicsand water-quality of hydrologic benchmark network stations in theWestern United States, Rep. 1173-D, United States Geological Survey,Washington, DC.
Millar, R. G. (1999), Grain and form resistance in gravel-bed rivers,J. Hydraul. Res., 37(3), 303–312.
Mizuyama, T. (1977), Bedload transport in steep channels, Ph.D. dissertationthesis, Kyoto University, Kyoto, Japan.
Montgomery, D. R. (2004), Geology, geomorphology, and the restorationecology of salmon, GSA Today, 14(11), 4–12.
Montgomery, D. R., and J. M. Buffington (1997), Channel-reach morphologyin mountain drainage basins, Geol. Soc. Am. Bull., 109(5), 596–611.
Moore, R. D. (2003), Introduction to salt dilution gauging forstreamflow measurement: Part 1, Streamline Watershed Manag. Bull.,7(4), 20–23.
Mueller, E. R., J. Pitlick, and J. M. Nelson (2005), Variation in the referenceshields stress for bed load transport in gravel-bed streams and rivers,Water Resour. Res., 41, W04006, doi:10.1029/2004WR003692.
Nelson, P. A., W. E. Dietrich, and J. G. Venditti (2010), Bed topographyand the development of forced bed surface patches, J. Geophys. Res.,115, F04024, doi:10.1029/2010jf001747.
Nelson, P. A., J. G. Venditti, W. E. Dietrich, J. W. Kirchner, H. Ikeda,F. Iseya, and L. S. Sklar (2009), Response of bed surface patchiness toreductions in sediment supply, J. Geophys. Res., 114, F02005, doi:10.1029/2008jf001144.
Nikora, V., D. Goring, I. McEwan, and G. Griffiths (2001), Spatially aver-aged open-channel flow over rough bed, J. Hydraul. Eng.-Asce, 127(2),doi:10.1061/(asce)0733-9429(2001)127:2(123).
Nitsche, M., D. Rickenmann, J. M. Turowski, A. Badoux, and J. W. Kirchner(2011), Evaluation of bedload transport predictions using flow resistanceequations to account for macro-roughness in steep mountain streams,WaterResour. Res., 47, W08513, doi:10.1029/2011wr010645.
Paola, C., and R. Seal (1995), Grain-size patchiness as a cause of selectivedeposition and downstream fining, Water Resour. Res., 31(5), 1395–1407,doi:10.1029/94WR02975.
Parker, G. (2008), Transport of gravel and sediment mixtures, in Sedimen-tation engineering processes, measurements, modeling, and practice,edited by M. H. Garcia, American Society of Civil Engineers.
Prancevic, J. P., M. P. Lamb, and B. M. Fuller (2011), Assessing the slopedependency of the critical shields stress in very steep streams usinglaboratory flume experiments, abstract EP21C-0708, paper presented at2011 Fall Meeting, AGU, San Francisco, Calif. 5–9 Dec.
Recking, A. (2009), Theoretical development on the effects of changingflow hydraulics on incipient bed load motion, Water Resour. Res., 45,W04401, doi:10.1029/2008wr006826.
Rickenmann, D., and A. Recking (2011), Evaluation of flow resistance ingravel-bed rivers through a large field data set, Water Resour. Res., 47,W07538, doi:10.1029/2010wr009793.
Rouse, H. (1936), Discharge characteristics of the free overfall, Civ. Eng.,6(4), 257–260.
Scheingross, J. S., J. K. Willenbring, and W. E. Dietrich (2008), Erosionrates and debris flow history reconstruction: A comparison of carbonand cosmogenic nuclide dating techniques, Eos Trans. AGU, 89(53), FallMeet. Suppl., Abstract H51D-0852.
Shields, A. (1936), Anwendung der aehnlichkeitsmechanik und derturbulenzforschung auf die geschiebebewegung,Mitt.Preuss. Versuchsanst.Wasserbau Schiffbau, 26(26).
Sklar, L. S., and W. E. Dietrich (2004), A mechanistic model for riverincision into bedrock by saltating bed load, Water Resour. Res., 40,W06301, doi:10.1029/2003wr002496.
Stock, J., and W. E. Dietrich (2003), Valley incision by debris flows:Evidence of a topographic signature, Water Resour. Res., 39(4), 1089,doi:10.1029/2001wr001057.
Stock, J. D., and W. E. Dietrich (2006), Erosion of steepland valleys by debrisflows, Geol. Soc. Am. Bull., 118(9–10), 1125–1148, doi:10.1130/b25902.1.
Thompson, C., and J. Croke (2008), Channel flow competence andsediment transport in upland streams in southeast Australia, Earth Surf.Process. Landforms, 33(3), 329–352, doi:10.1002/esp.1558.
Tsai, V. C., B. Minchew, M. P. Lamb, and J.-P. Ampuero (2012), Aphysical model for seismic noise generation from sediment transport inrivers, Geophys. Res. Lett., 39, L02404, doi:10.1029/2011gl050255.
Tucker, G. E., and G. R. Hancock (2010), Modelling landscape evolution,Earth Surf. Process. Landforms, 35(1), 28–50, doi:10.1002/esp.1952.
Turowski, J. M., E. M. Yager, A. Badoux, D. Rickenmann, and P. Molnar(2009), The impact of exceptional events on erosion, bedload transportand channel stability in a step-pool channel, Earth Surf. Process.Landforms, 34(12), 1661–1673, doi:10.1002/esp.1855.
Whipple, K. X. (2004), Bedrock rivers and the geomorphology of activeorogens, Annu. Rev. Earth Planet. Sci., 32, 151–185, doi:10.1146/annurev.earth.32.101802.120356.
Wiberg, P. L., and J. D. Smith (1985), A theoretical-model for saltatinggrains in water, J. Geophys. Res., 90(NC4), 7341–7354, doi:10.1029/JC090iC04p0734.
Wiberg, P. L., and J. D. Smith (1987), Calculations of the critical shear-stress for motion of uniform and heterogeneous sediments,Water Resour.Res., 23(8), 1471–1480, doi:10.1029/WR023i008p01471.
Wiberg, P. L., and J. D. Smith (1991), Velocity distribution and bed rough-ness in high-gradient streams, Water Resour. Res., 27(5), 825–838,doi:10.1029/90wr02770.
Wiele, S. M., P. R. Wilcock, and P. E. Grams (2007), Reach-averagedsediment routing model of a canyon river, Water Resour. Res., 43,W02425doi:10.1029/2005wr004824.
Wilcock, P. R. (1992), Flow competence—A criticism of a classic concept,Earth Surf. Process. Landforms, 17(3), 289–298, doi:10.1002/esp.3290170307.
Wilcock, P. R. (1997), Entrainment, displacement and transport of tracergravels, Earth Surf. Process. Landforms, 22(12), 1125–1138,
Yager, E. M., J. W. Kirchner, and W. E. Dietrich (2007), Calculating bedload transport in steep boulder bed channels, Water Resour. Res., 43,W07418, doi:10.1029/2006wr005432.
Yager, E. M., W. E. Dietrich, J. W. Kirchner, and B. W. McArdell (2012a),Prediction of sediment transport in step-pool channels, Water Resour.Res., 48, W01541, doi:10.1029/2011wr010829.
Yager, E. M., W. E. Dietrich, J. W. Kirchner, and B. W. McArdell (2012b),Patch dynamics and stability in steep, rough streams, J. Geophys. Res.,117, F02010, doi:10.1029/2011jf002253.
Yuill, B., M. Nichols, and E. Yager (2010), Coarse bed material patchevolution in low-order, ephemeral channels, Catena, 81(2), 126–136,doi:10.1016/j.catena.2010.02.002.
Zar, J. H. (1999), Biostatistical Analysis, 4th ed., pp. 475-483, Prentice Hall,Upper Saddle River, New Jersey.
SCHEINGROSS ET AL.: GRAVEL MOBILIZATION IN STEEP CHANNELS
20