inflight and ground-based simulation of handling qualities ... · inflight and ground-based...
TRANSCRIPT
NASA
m m e
c2 U
< c/) 4 z
CONTRACTOR
REPORT
LOAN COPY: RETURN TO AFWL (WLIL-2)
KIRTLAND AFB, N MEX
INFLIGHT AND GROUND-BASED SIMULATION OF HANDLING QUALITIES OF VERY LARGE AIRPLANES IN LANDING APPROACH
by Phili$~ M. Condit, Luddie G. Kimbrel, and Robert G. Root
Prepared by
BOEING COMPANY
Seattle, Wash.
for Ames Research Center
NATIONAL AERONAUTICS AND SPACE ADMINISTRATION . WASHINGTON, D. C. . OCTOBER 1966
https://ntrs.nasa.gov/search.jsp?R=19660029515 2018-09-02T02:28:48+00:00Z

TECH LIBRARY KAFB, NM
Ollb025b NASA CR-635
INFLIGHT AND GROUND-BASED SIMULATION OF HANDLING QUALITIES
OF VERY LARGE AIRPLANES IN LANDING APPROACH
By Philip M. Condit, Laddie G. Kimbrel, and Robert G. Root
Distribution of this report is provided in the interest of information exchange. Responsibility for the contents resides in the author or organization that prepared it.
Prepared under Contract No. NAS 2-3224 by BOEING COMPANY
Seattle, Wash.
for Ames Research Center
NATIONAL AERONAUTICS AND SPACE ADMINISTRATION
For sale by the Clearinghouse for Federal Scientific and Technical Information Springfield, Virginia 22151 - Price $2.50

FOREWORD
This report was prepared under Contract NASB-3224 between The Boeing Company, Seattle, Washington, and the National Aeronautics and Space Adminis- tration. The NASA project monitor was Hervey C. Quigley and the NASA project pilot was Robert C. Innis.
The authors gratefully acknowledge the invaluable help of the NASA and Boeing Company personnel associated with this project.
iii

CONTENTS
Page
SUMMARY ........................... 1
INTRODUCTION ; ........................ 1 NOMENCLATURE ........................ 2 SIMULATION SYSTEMS ..................... 7
Ground-Based Flight Simulator ................ 7 Inflight Simulator ...................... I)
TEST PROCEDURES ........................ 13 Ground-Based Flight Simulator ................ 14 Inflight Simulator. ...................... 1 6
RESULTS AND DISCUSSION ................... 19 Lateral Control ....................... 19 Longitudinal Stability and Control ............... 32
CONCLUSIONS AND RECOMMENDATIONS ............. 39 ATT’ENDTS A ......................... 41 APPENDIX B ......................... 4.7
APPENDIX C ......................... 41) REFERENCES ......................... lil
V
INFLIGHT AND GROUND-BASED SIMULATION OF
HANDLING QUALITIES OF VERY LARGE
AIRPLANES IN LANDING APPROACH
By Philip M. Condit, Laddie G. Kimbrel, and Robert G. Root
SUMMARY
A ground-based and inflight piloted simulator program was conducted utilizing the NASA-Ames moving base transport simulator, and the Boeing 367-80 variable stability airplane. The study examined several of the problem areas associated with handling qualities of large transport airplanes in the landing approach.
With lateral-directional dynamics augmented to provide satisfactory STOL handling qualities, it was found that pilot opinion was more influenced by roll response sensitivity, as measured by the roll response obtained for a given wheel input, than by total roll control power. Having selected configurations with good roll performance sensitivity, an improvement in pilot opinion was obtained with an increase in roll damping. The longitudinal evaluation indicated that pilot opinion was dependent on both pitching moment sensitivity and lift due to elevator motion.
INTRODUCTION
The next few years should see the introduction of very large, transport- category aircraft into military and civilian aviation. Inherent in these aircraft are handling qualities problems associated with inertias considerably larger than those experienced to date. It is difficult to provide these large aircraft with handling characteristics that satisfy criteria developed for small aircraft. This investiga- tion was undertaken in order to improve the understanding of several of the im- portant problem areas of these airplanes in the landing approach flight regime. In particular, attention was directed to the factors that define required levels of lateral and longitudinal control.
The study covered both lateral and longitudinal airplane characteristics. The lateral investigation covered control power, control sensitivity, rolling mode time constant, wheel force gradient, and control system response time. The longitudinal study examined pitch control sensitivity, lift due to control, static stability, pitch damping, and lift curve slope.
The study had two phases: a ground-based simulator study and an inflight simulation. The ground-based effort was designed to cover a wide range of vari- ables and thus to indicate the important trends and areas for the inflight simulation. The inflight simulation served to verify the results of the ground-based tests.
1
This report presents the pilot ratings obtained from the lateral control and longitudinal control and stability parameters studied for the landing approach. These data were analyzed in terms of several existing handling qualities parameters as well. as in terms of other parameters developed in the course of data analysis; however, no attempt was made at a comprehensive comparison with other sources or the development of definitive criteria.
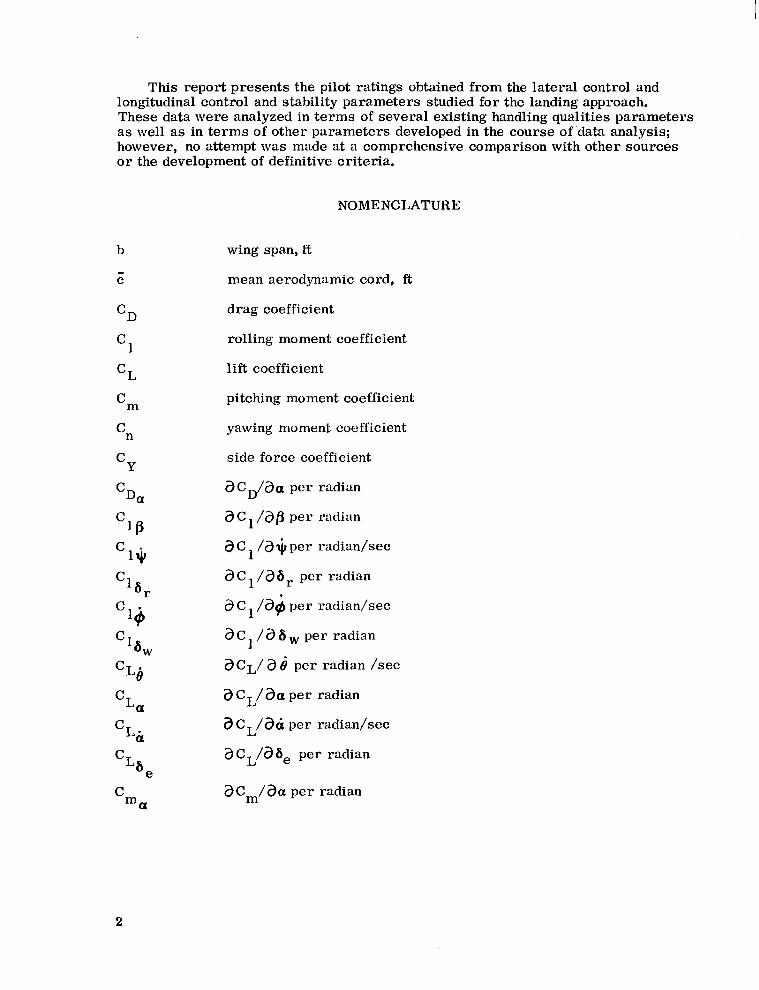
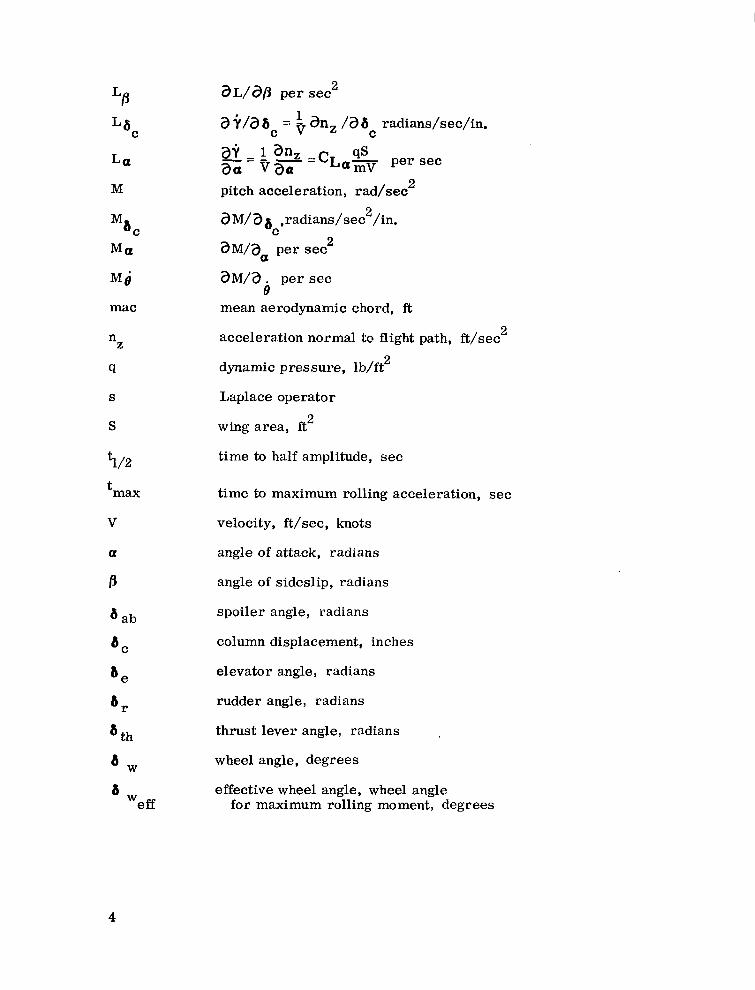
NOMENCLATURE
b
c
cD
c1
cL
‘rn
‘n
C Y
cDa
“B
clljI
% r “14
% W
CL8
cLa
CL&
cL6 e C
ma
wing span, ft
mean aerodynamic cord, ft
drag coefficient
rolling moment coefficient
lift coefficient
pitching moment coefficient
yawing moment coefficient
side force coefficient
aC,/aa per radian
3 C /a/3 per radian 1
a C 1 /a $ per radian/set
aC 1 /aa, per radian .
a C 1 /a$ per radian/set
aC, /a6 w per radian
aCL/ a e per radian /set
a C,/aa per radian
a C,/adr per radian/set
a CL/aae per radian
aC,/& per radian

C me a
c md
cmbe
cm. 1H
cnB Cn l
+
‘nli)
cn6 a C
“6 r
cyP
cY- 9
cY+
cy* a (+ar d
E. in
EO
FS
FW
g
h
iH
Ixx I YY
I zz I xz L
a Cm/ah per radianjsec
aCm/ a 6 per radian/set
&m/a6e per radian
aCm/aiH per radian
aCn/afl per radian
&2,/a+ per radian/set
&2,/a * per radian/set v
aC,/as a per radian
aC,/a 6, per radian
&2,/3/3 per radian
&,/a+ per radian/set
&,/a+ per radian/set
& /a6 per radian y a
aC,/as, per radian
offset distance, ft
input, volts
output ( volts
column force, pounds
wheel force, pounds
acceleration due to gravity, ft/sec’
height above ground, ft
horizontal stabilizer angle, degrees
moment of inertia about X axis, slug-ft2
moment of inertia about Y axis, slug-ft2
moment of inertia about Z axis, slug-ft2
cross product of inertia, slug-ft2
roll acceleration, radians/sec2
33 La
C
La
M
Mb
Ma
Mi mat
n Z
4
S
S
5/z
t max
V velocity, ft/sec, knots
a
P
6 ab
8,
8e
‘r
‘th
6,
6 Weff
aL/@ per sec2
3 +/a bc = $ an, /a 6 radians/set/in. C
39 _ 1 an, a;-vacr=
cL qs a- per set
pitch acceleration, rad/sec2
%/a& ,radians/sec2/in.
aM/aa ‘per sec2
aM/a8, per set
mean aerodynamic chord, ft
acceleration normal to flight path, ft/sec2
dynamic pressure, lb/ft2
Laplace operator
wing area, ft 2
time to half amplitude, set
time to maximum rolling acceleration, set
angle of attack, radians
angle of sideslip, radians
spoiler angle, radians
column displacement, inches
elevator angle, radians
rudder angle, radians
thrust lever angle, radians
wheel angle, degrees
effective wheel angle, wheel angle for maximum rolling moment, degrees
4
rR
On
0
1
2
-80
LT
max
NB
SS
damping ratio,
pitch rate, radians/set
pitch acceleration, radians/sec2
longitudinal flight path angle, radians
longitudinal flight path angle rate, radians/set
rolling mode time constant (negative inverse of the characteristic equation root), se’conds
roll angle, radians, degrees
roll rate, radians/set
roll acceleration, radians/sec2
yaw rate, radians/set
undamped natural frequency, radians/set
Subscripts
initial or trim value
in the 1st second
in the first two seconds
inflight simulator terms (refers to 367-80 airplane)
simulated “Large Transport” airplane terms
maximum
nose boom
steady state
5
SIMULATION SYSTEMS
Ground-Based Flight Simulator
The ground-based flight simulator used for these studies was the Ames Re- search Center moving-base transport simulator with a color television visual display. The visual scene, projected to simulate daylight flying, was produced by the Ames Research Center landing-approach color-image generator. The simu- lation solved the six-degrees-of-freedom equations of motion of the airplane and presented the solutions in cab motions, instrument readings, and visual display changes. Linearized aerodynamic coefficients were used in the equations of motion. The airplane ground effects were not included in the simulation.
The simulator utilized a transport-type cab with conventional seating, instru- mentation, and controls for two pilots. The left hand seat was used for these tests. A hydraulic feel system was used to set control system force gradients. The general layout of the cockpit and instrument panel is shown in Fig. 1. The following instruments were provided:
Airspeed indicator Altimeter Rate of climb indicator Angle of attack indicator Angle of sideslip indicator Turn and slip indicator Compass Attitude display Localizer and glide slope error indicators (ILS)
Motion of the cab was controlled by three linear hydraulic servo actuators. These were operated differentially or synchronously for three degrees of freedom: roll, pitch, and heave (vertical). The roll axis of motion was scaled down so that a simulated roll angle of 10 degrees produced 5 degrees of cab roll motion. This reduced the side force due to bank angle that appeared to the simulator pilot as a spurious side force in a steady coordinated turn. Correct roll angles were dis- played on the instruments and visual scene. A tabulation of the moving-base trans- port simulator physical characteristics is given in Appendix A.
The visual scene was produced by a closed-circuit color television system which utilized a scale landscape model including roads, buildings, and fields, as well as the runway to which the approaches were conducted. A color television camera was positioned by electric servos controlled by the simulation computer. The landscape model, camera, and mount system are shown in Fig. 2. The land- scape model covered an area 2.5 miles wide and 9 miles long. Descent through a cloud layer was simulated by obliterating the picture above a preselected altitude. The tabulated physical characteristics of the visual display system are given in Appendix A. The pilot’s outside view was limited to the visual TV scene by blocking out appropriate windows. Figure 3 presents an overall view of the cab including the TV screen and the TV projector.
7

Figure 1. - NASA-Ames Moving Base Simulator Flight Deck
Figure 2. - TV Camera System with Model Runway and Landscape
8

Figure 3. - NASA-Ames Moving Base Transport Simulator
Inflight Simulator
The inflight simulation system is conveniently divided into three subsystems for discussion purposes: the basic 367-80 airplane, the flight deck controls, and instrumentation and simulation equipment.
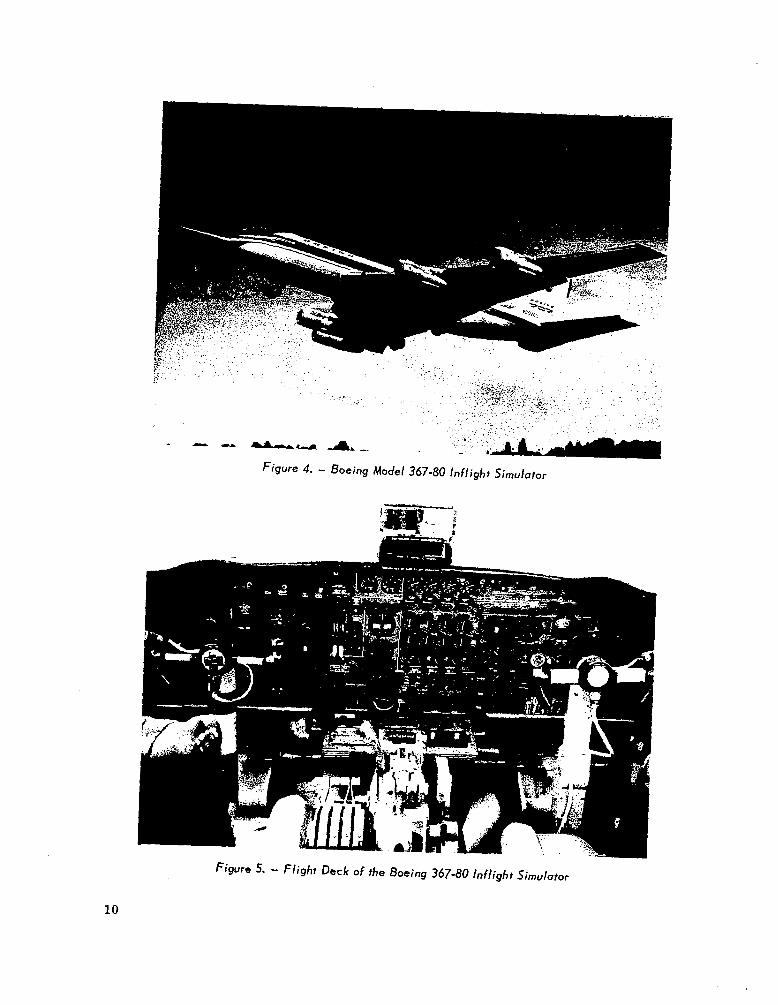
Basic 367-80 Airplane. - The airplane used for the inflight phase of the simulation program was the Boeing Model 367-80, shown in Fig. 4. A more de- tailed description of this airplane-will be found in Appendix B. The 367-80 air- plane was equipped as a variable stability airplane to simulate transport category aircraft. In the simulation configuration, five of the six degrees of freedom were con- trolled; late’ral acceleration was not modified. An additional discussion of the variable stability capability of the 36’7-80 may be found in Ref. 1.
Flight Deck. -The flight deck of the 367-80 equipped for simulation is shown in Fig. 5. The left-hand seat was occupied by the safety pilot. The right-hand or evaluation pilot’s station was equipped with a cockpit instrument system similar to that on present generation transports. The following basic display was provided:
9
10
Figure 5. - Flight Deck of the Boeing 367-80 lnflight Simulator

Airspeed indicator Altimeters (barometric and radar) Instantaneous rate of climb indicator Angle of attack indicator Angle of sideslip indicator Compasses (gyro, radio, ADF, and VOR) Collins FD-108 flight director and integrated instrument system Normal acceleration indicator Control deflection and force indicators Simulation limit lights.
The flight director displayed bank and pitch attitudes, and gave command in- formation for VOR/ILS capture and tracking, altitude hold, and heading hold, Basic ILS error data were also displayed. The pilots used the flight director for most of the approaches flown during the program.
The evaluation pilot’s control motions were converted to electrical signals by position transducers. The longitudinal column feel was produced by a mechanical detent to provide a breakout force and by an adjustable linear hydraulic spring. The lateral wheel force was produced by a fixed linear mechanical spring and a centering detent. Thrust control was by means of a single lever on the evaluation pilot’s left side. Rudder control was by means of the basic 367-80 control system with the simulation signals superimposed upon the pilot input by means of a series servo.
The evaluation pilot had trim capability for all three axes. A switch on the pilot’s wheel provided electrical series longitudinal trim, and a knob on the center pedestal provided electrical series lateral trim. Directional trim was through the normal 367-80 mechanical parallel trim on the center pedestal.
Simulation Equipment and Technique. - Computation for the simulation was performed on an 84-amplifier general purpose analog computer. The technique adopted for the simulation was essentially an open loop compensation technique in which the response of the airplane to a disturbance or command was modified by modulation of the airplane control surfaces. This response-feedback technique has the advantage of utilizing low loop gains in contrast to the analog model following system which must use high gain to achieve comparable performance. The rotational motions, pitch, roll, and yaw, were driven by the elevator, the lateral control (ailerons and spoilers), and the rudder, respectively. Lift was controlled by symmetrical motion of the spoilers, and drag by the engine thrust modulators. Control system dynamics were included in the analog computer. An example of the derivation of the control command equations is detailed in Appendix B.
Previous work indicated that because the 367-80 closely matched the geometry and flight speed of the simulated airplanes, the lack of aerodynamic side force control did not detract significantly from the simulation. No attempt was made to modify the basic 367-80 ground effect.
11
The following fundamental assumptions were made for the mechanization of the 367-80 as a variable stability airplane:
Linear aerodynamic derivatives and equations of motion (Function generators in the analog computer were adjusted to compensate known 367-80 nonlinearities. )
Constant gross weight and center of gravity Instantaneous control surface response Nonturbulent environment.
A more detailed discussion of the limitations of the inflight simulation may be found in Appendix B.
12
TEST PROCEDURES
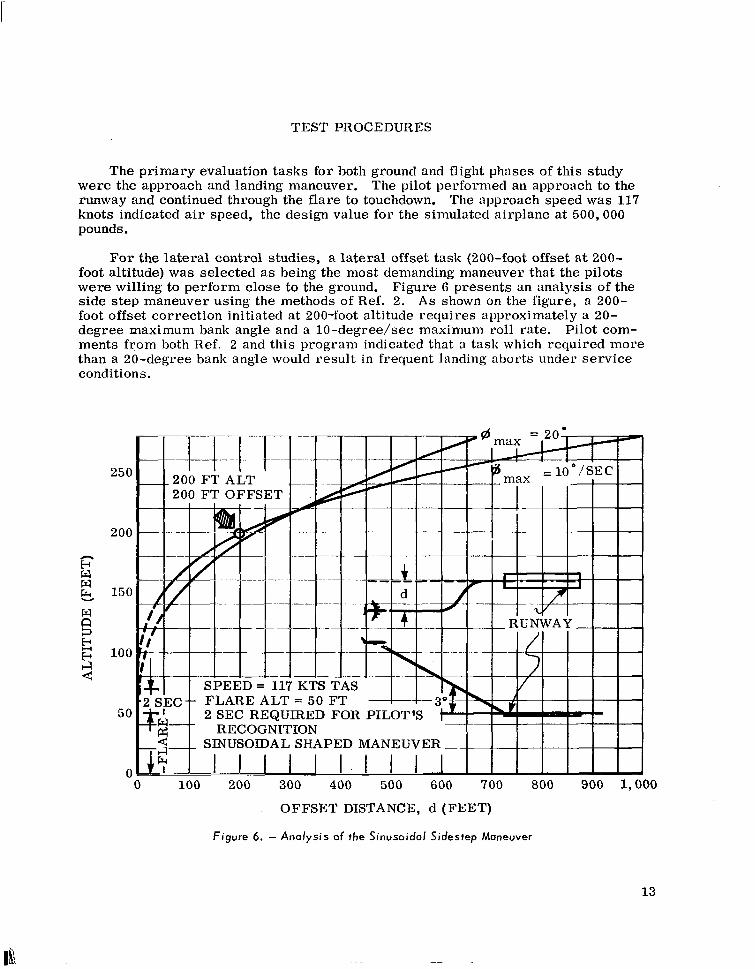
The primary evaluation tasks for both ground and flight phases of this study were the approach and landing maneuver. The pilot performed an approach to the runway and continued through the flare to touchdown. The approach speed was 117 knots indicated air speed, the design value for the simulated airplane at 500,000 pounds.
For the lateral control studies, a lateral offset tnsk (200-foot offset at 200- foot altitude) was selected as being the most demanding maneuver that the pilots were willing to perform close to the ground. Figure 6 presents an analysis of the side step maneuver using the methods of Ref. 2. As shown on the figure, a 200- foot offset correction initiated at 200-foot altitude requires approximately a 20- degree maximum bank angle and a lo-degree/set maximum roll rate. Pilot com- ments from both Ref. 2 and this program indicated that a task which required more than a 20-degree bank angle would result in frequent landing aborts under service conditions.
-LLLLl-. A..-- 1 --_ IL7 SPEED = 11’7 KTS TAS FLARE ALT = 50 FT 2 SEC REQUIRED FOR PILOT’S I I I
RECOGNITION I i i 1 SINUSOIDAL SHAPED MANEUVER _
I I I I Ill I.1 I 200 300 400 500 600 700 800 900 1,000
OFFSET DISTANCE, d (FEET)
Figure 6. - Analysis of the Sinusoidal Sidestep Maneuver
13
Glide slope intercept from horizontal flight, glide slope tracking, and the landing flare were the significant longitudinal tasks.
Parameter variations around the basic configuration detailed in Appendix C were studied. The lateral parameters studied were control sensitivity, control power, rolling mode time constant, wheel force gradient, and the effect of control system response time. The longitudinal parameters studied were pitch control sensitivity, lift due to control, static stability, pitch damping, and lift curve slope. Column force gradient was not a variable. The ranges of the variables that were covered in the ground-based and flight simulations are shown in Table I. In order to evaluate only control requirements, the basic airplane was configured to meet the turn entry, aileron yaw, and yaw-due-to-roll-rate requirements for satis- factory STOL handling qualities indicated in Ref. 3.
Ground-Based Flight Simulator
The flight task used in the ground-based simulator was the landing approach and flare to touchdown. The pilots were allowed to fly as many approaches as they thought necessary to evaluate a configuration. After initial familiarization the pilots, in most cases, found one visual and one ILS approach adequate. The simulation was initiated approximately 6 miles from the runway threshold at an altitude of 1,000 feet and carried through to touchdown.
The ground-based simulation was checked for its validity prior to pilot evaluation using standard analog frequency and damping checks in conjunction with responses to control pulses which were compared against previously computed digital solutions. Documentation showing the measured characteristics of each configuration is presented in Appendix C.
In order to assess the effects of external disturbances on the roll control. some of the configurations were flown introduced to the simulator as a by filtering the output of a white function:
in simulated turbulence. The turbulence was rolling moment, angle of attack, and sideslip angle noise generator through the following transfer
Eo’E* in = 0. $s+l The gains were adjusted to give a peak rolling acceleration of 0.15 rad/sec2,
with peaks of approximately 3 degrees in angle of attack and sideslip. This tur- bulence simulation was designed primarily to produce severe roll upsets with mild a and fi excursions.
14

TABLE I
PARAMETER RANGES USED IN GROUND-BASED AND INFLIGHT SIMULATIONS
Parameter Ground-based Inflight
simulator simulator Units
(Ma4 (Min)
Effective wheel 8 90 30 angle Weff
Control power Lmax 1.0 0.05
Rolling mode time constant
TR 1.59 0.6
Control system tmax 0.75 0 response time
Pitch control +o. 0646 +o. 0141 sensitivity
Mb C
Lift due to control
L8c +o. 004 -0.0059
Lift curve La +o. 925 +O. 302 slope
Static stability M, -1.47 +O. 245
Pitch damping MB -1.17 -0.242
(Ma-@
50
0.43
1.14
1.4
+O. 0625
-0.0001
+O. 645
-1.40
-1.17
(Min)
30 deg
0.15 rad/sec2
0.36 set
0.7 set
+O. 0167 rad/sec2/in.
-0.00635 rad/sec/in.
+o. 497
-0.13
-0.59
/set
/set 2
/set

Inflight Simulator
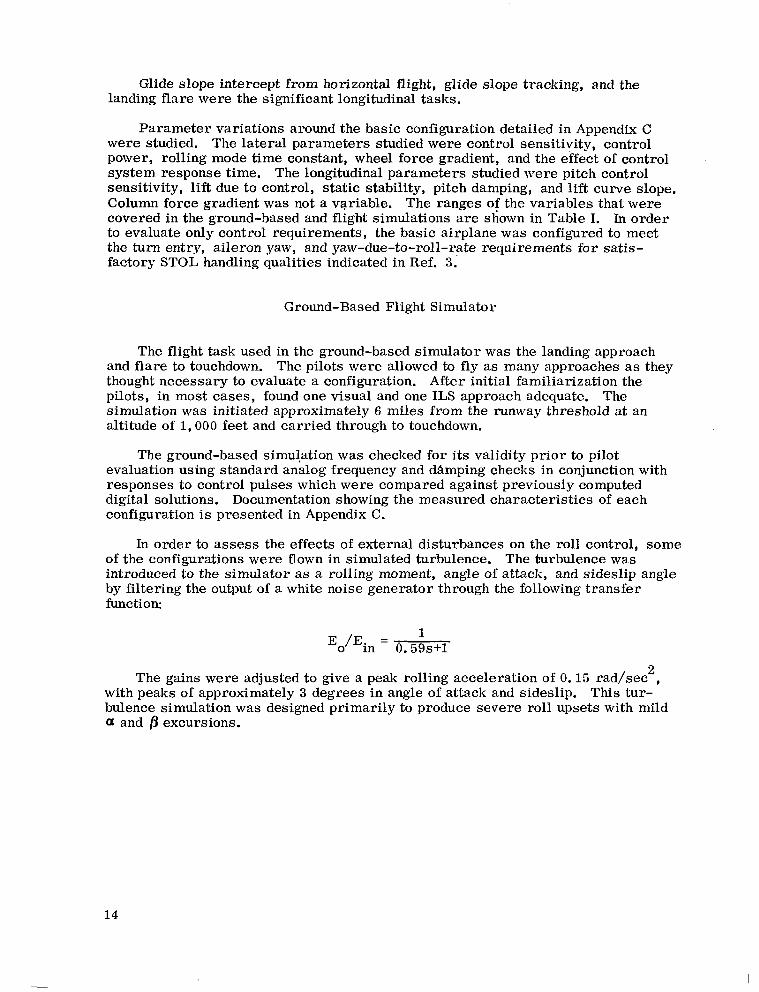
The maneuvers used in flight were divided into three main categories: con- figuration check, documentation of the configurations, and pilot evaluation maneu- vers. Prior to any documentation or evaluation on a given flight, the configuration was checked using a standard pulse input to each control surface and a step input to the electrical throttle. The pulses were artificially generated in the computer. The airplane response was recorded and compared to’ the precalculated theoretical response of the simulated airplane (Fig. 7). The difference between test and theory indicates the combined effects of atmospheric turbulence and system uncertainties.
Having established total system response within acceptable tolerances by means of the configuration check maneuvers, several important characteristics were re- corded in the documentation maneuvers. The lateral-directional documentation used the rate reversal technique of Ref. 3 to measure control power and sensitivity, isolated from other effects. The documentation maneuvers also included wheel steps from an initial bank angle to measure roll rate response and steady sideslips to measure static lateral-directional characteristics.
Longitudinal documentation used a pitch rate reversal maneuver similar to the lateral technique for measuring control power and sensitivity. A column step from steady level flight and a windup turn provided measurement of the pitch response and maneuvering characteristics. A moderate speed change from trim gave the static stability data. The documentation was completed by pilot excitation of the oscillatory modes of motion (short period, phugoid, and dutch roll) for measurement of period and damping.
The pilot evaluation maneuvers were the most important part of the program. They included both standardized control tests and actual landings. For evaluation of lateral control, the pilot performed heading changes of 5 degrees and 20 degrees, an S-turn, and a full wheel step. On lateral evaluation landings, a 200- foot lateral offset to the right of the runway centerline was programmed into the flight director. The pilot started the correction to the runway at an altitude of about 200 feet. Longitudinal pilot evaluation tasks consisted of a step column input, and pitch attitude changes of 5 degrees and 10 degrees in minimum time. One or two actual landings, including a simulated instrument approach, were per- formed with each configuration.
Four pilots participated in the ground-based evaluation while two evaluated the airborne simulation. All pilots were professional flight test pilots with recent experience in evaluation of handling qualities parameters for both inflight and ground-based simulations.
16
2
B (DEG) ’
-2
-4
(DEG/SEC)
4
4 2 (DEG/SEC) o
-2
-10
8, -5 LT 0
PEG) I 0 4 8 12 16 20 24 28 32
TIME (SECONDS)
Figure 7. - Comporison of Flight and Computed Responses to a Rudder Pulse
17

I
RESULTS AND DISCUSSION
This investigation studied several problem areas for the large transport air- plane in the landing approach. Although limited in scope, sufficient data were obtained to indicate significant trends for several important handling qualities criteria, The results are presented in the form of numerical pilot ratings of lateral control and longitudinal stability and control.
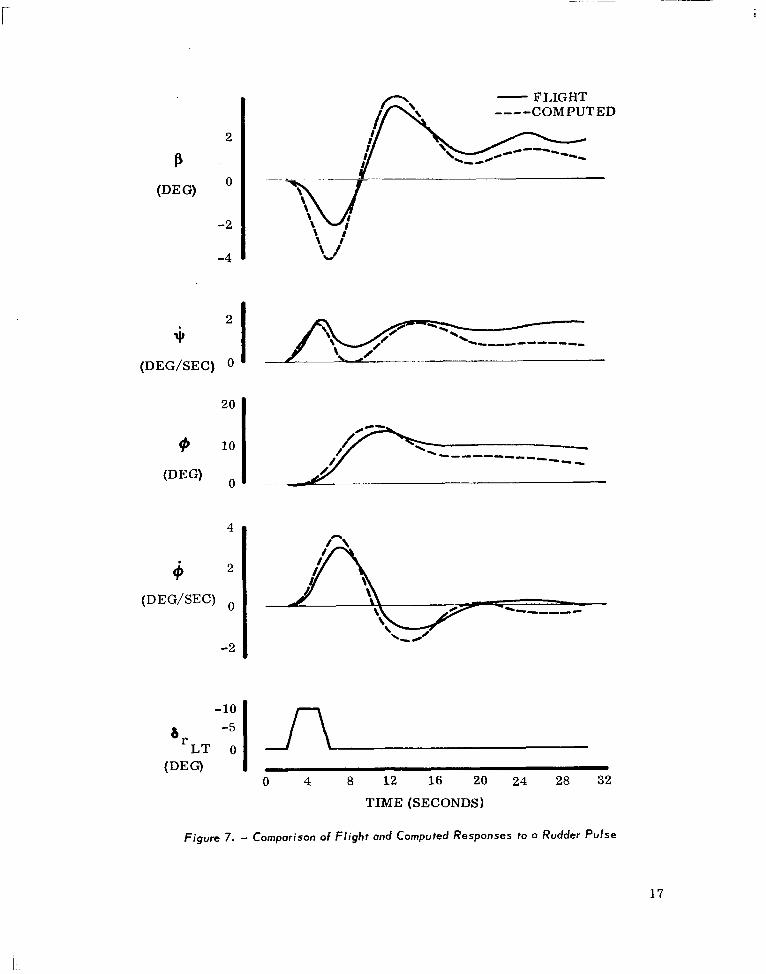
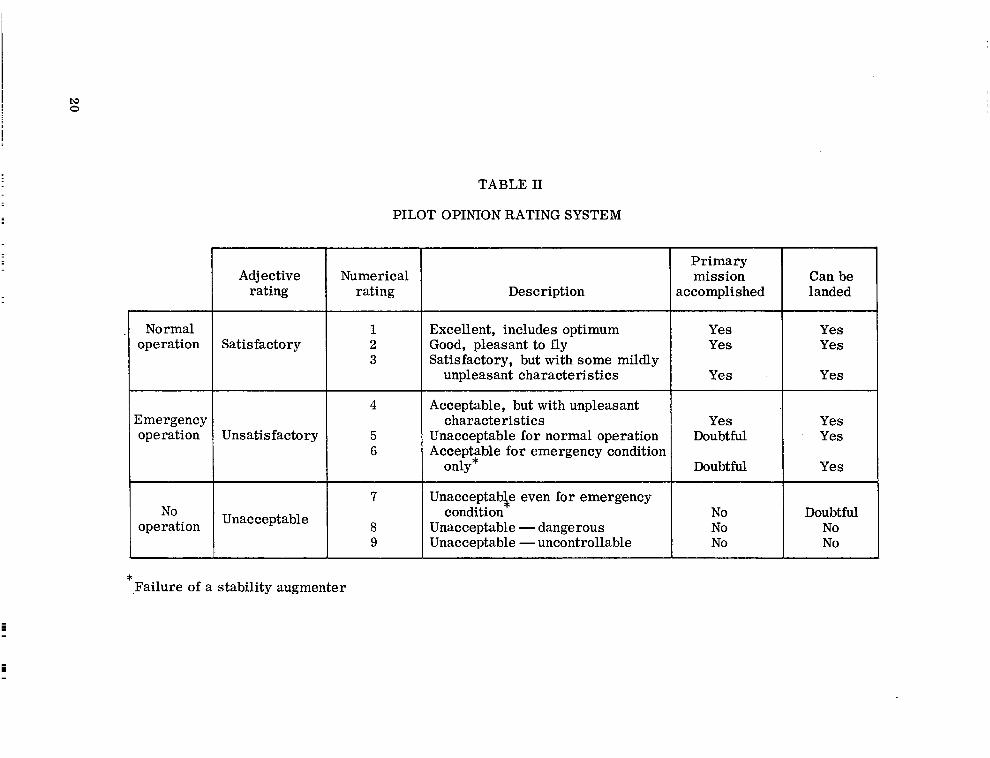
The pilots rated the handling qualities using the Cooper pilot rating system of Ref. 4 as summarized in Table II. Their opinions are presented as average ratings whcrc more than one evaluation was available.
T..tlernl Control
The lateral control study was primarily concerned with the roll control sen- sitivity and roll power. The use of a nonlinear control system with capability to change both L,,, and 6 weff allowed independent variation of sensitivity and con- trol power, Ivithout changing the physical wheel stops as shown in Fig. 8. The wheel stops ( bWm7 ) were & 90 degrees for the ground simulation and f 75 degrees for the inllight slniaation and were not changed during the test.
The effects of the rolling mode time constant, wheel forces, and control sys- tem rcsponso time were also evaluated.
Roll Control. - Maximum hank angle in the first second after initiation of wheel deflection (+I ) has been suggested as a figure of merit for roll control systems (Ref. 5). &%titative use of this parameter requires specification of the method of calculation. The assumption of a single degree of freedom for airplane roll response allows a simple computation of roll acceleration, steady state roll rate, and roll time constant. However, as indicated in Fig. 9, when coupling with other degrees of freedom and substantial nonlinear characteristic exist, the roll response can be altered significantly. Accordingly, to avoid errors arising from the use of the single degree of freedom approximation, the values of+I in this study were obtained from direct measurements of the actual air$%e
used re-
sponse with rudder pedals fixed.
The variation of pilot rating with +Imnx for both ground-based and inflight evaluations is shown in Fig. 10. In the aggregate, the data show considerable scatter. Fifty per cent of the data are within + 0.4 units of the mean and 90 per cent are within f 0.9 units (Cooper scale). Lines of constant effective wheel angle ( 6 1v ff) faired through the data improve the correlation and suggest that the pilot is ra mg the bank angle response per wheel deflection or roll response sensitivity. f If the data shown in Fig. 10 are presented in terms of the sensitivity parameter 9 l/h w Where 6 w < 6 we,f), the four lines of constant wheel angle transform
to the single line shown in Fig. 11. As plotted in Fig. 11, 50 per cent of the data are within f 0.2 units and 90 per cent within f 0.6 units of the mean. The signi- cance of this parameter is indicated by the fact that a constant pilot rating of 3 was
19
i I i
to 0
Adjective Numerical rating rating
Normal operation Satisfactory
1 Excellent, includes optimum 2 Good, pleasant to fly 3 Satisfactory, but with some mildly
unpleasant characteristics
Emergency operation Unsatisfactory
No operation Unacceptable
TABLE II
PILOT OPINION RATING SYSTEM
Description
4 Acceptable, but with unpleasant characteristics
5 Unacceptable for normal operation 6 Acceptable for emergency condition
only*
7 UnacceptabLe even for emergency condition
8 Unacceptable - dangerous 9 Unacceptable - uncontrollable
Primary mission
accomplished
Yes Yes
Yes
Yes Doubtful
Doubtful
No No No
Can be landed
Yes Yes
Yes
Yes Yes
Yes
Doubtful No No
* Failure of a stability augmenter
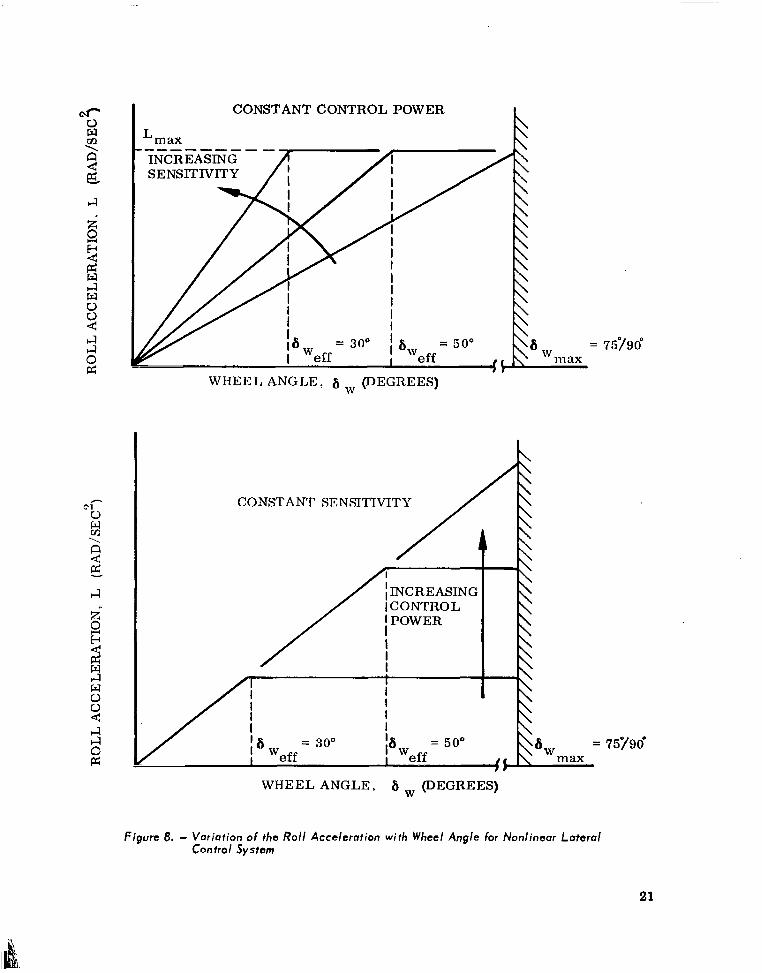
CONSTANT CONTROL POWER
L max .--_----- - INCREASING SENSITIVITY /!
Is = 300 i I Weff I %Veff = 50”
1 tc WHEEL ANGLE, 6 ,~ (DEGREES)
CONSTANT SENSITIVITY
/ t
ICONTROL
6, = 75y90°
m ax
6, = 75796
max
WHEEL ANGLE, 6 w (DEGREES)
Figure 8. - Variation of the Roll Acceleration with Wheel Angle for Nonlinear Lateral Control Svstem
21

WHEEL ANGLE, 6 w ----CALCULATED (ONE DEGREE OF
FREEDOM, LINEAR)
- MEASURED ON TEST AIRPLANE
ROLL RATE, 4 I 0
CALCULATED,’ 7-
I 0~ / / / MEASURED
/
ROLL ANGLE, #
0
--
TIME (SECONDS)
Figure 9. - Response to a Lateral Control Input for Fixed Rudder Pedal
22
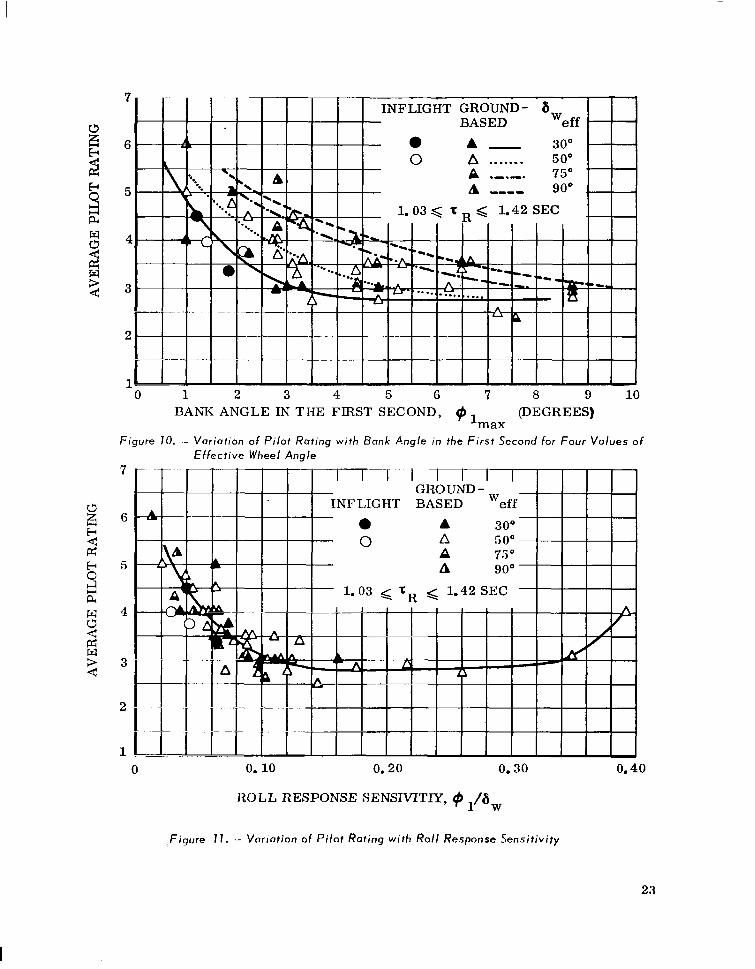
-0 1 2 3 4 5 G 7 8 9 10 BANK ANGLE IN THE FIRST SECOND, q 1 (DEGREES)
max Figure 70. - Variation of Pilot Rating with Bank Angle in the First Second for Four Values of
Effective Wheel Angle
FLIGHT BASED
0 0.10 0.20 0.30 0.40
ROLL RESPONSE SENSIVITm, + l/Q
, Fiqure I I. - Variation of Pilot Rating with Roll Response Sensitivity
23

obtained. Thes%a$ata are included in Tables III and IV of Appendix C.
An adequate evaluation of the nonlinear control system characteristics must include a task for which the pilot demands full lateral control. Figure 12 shows a typical time history of pilot’s wheel motions for the 200-foot sidestep maneuver just prior to touchdown. Most of the lateral commands on the ILS approach were well within the linear range; however, the severity of required offset maneuver gave the pilot the opportunity to evaluate the nonlinear wheel characteristics. As shown, the pilot used wheel angles from stop to stop, well beyond 6 weff for which there was no increased rolling moment. There were no adverse pilot comments on the wheel nonlinearity, either for the ground-based or inflight simulators.
Figure 13 indicates that the addition of turbulence to the ground-based evalua- tion task did make the expected shift in pilot rating. Pilot opinion was degraded about 0.5 units on the rating scale for satisfactory control sensitivity. For lower sensitivity there was a more rapid degradation of pilot opinion than was found in smooth air.
Rolling Mode Time Constant. - The rolling mode time constant ( t used as a handling qualities parameter. Computation of 7 R from the t %
) has been ree-degree-
of-freedom quartic characteristic equation provides a better approximation to the airplane roll response than that provided by the one-degree-of-freedom analysis. Accordingly, the values of 7R presented in this report are the negative inverse of the rolling mode root of the characteristic equation. An increase in roll damping (which may be accomplished by means of stability augmentation) reduces the time constant.
Consistent with previous observations, pilot comments indicated that there was an improvement in handling qualities with increased roll damping. The im- provement was seen as an ability to stop roll rate at a selected bank angle with less overshoot. This effect is indicated in Fig. 14 which is a time history of two 20-degree heading changes as documented in the inflight simulator. The upper two curves indicate a high level of wheel activity required to stabilize bank angle with a large roll time constant. The lower pair of curves show the reduction in os- cillatory wheel motion accompanying a decrease in roll time constant. The pre- cision of bank angle control was increased and the pilot rating improved from 3.4 to 2.9.
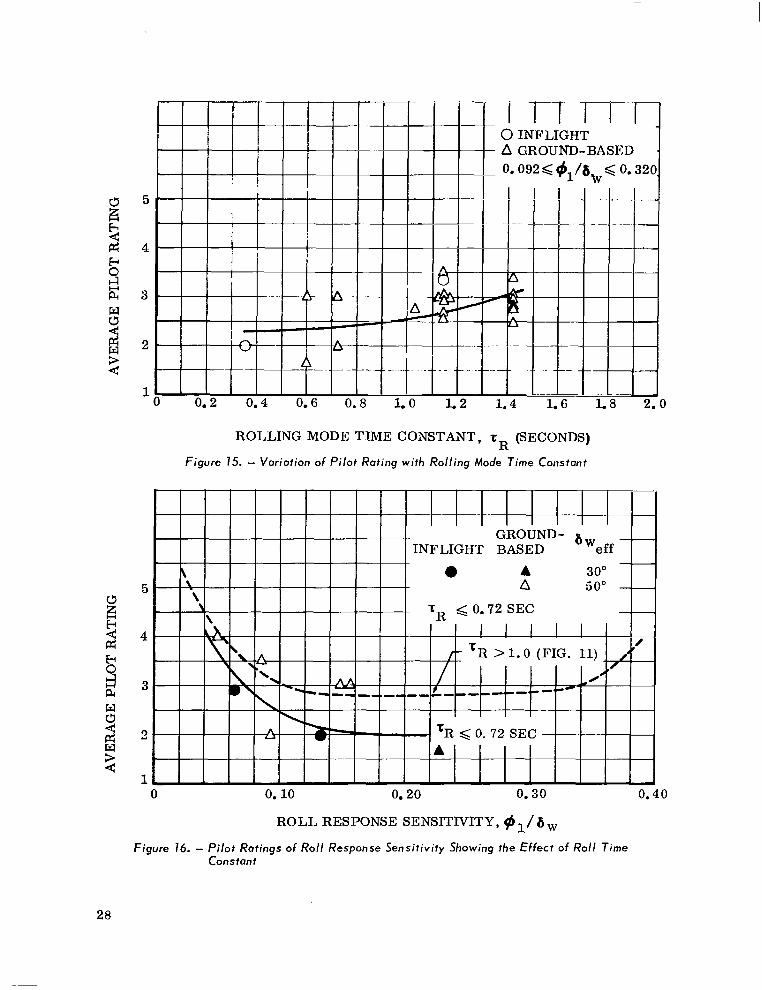
Figure 15 shows the improvement in pilot rating for decreasing values of roll time constant. The variation of roll response sensitivity (@l/6 w) used in this evaluation was 0.092 to 0.32. As shown on Fig. 11, the pilot rating does not change for this range of sensitivities.
The effects of a short roll time constant on the pilot rating of roll response sensitivity (Fig. 16) indicate the same trends with regard to optimum sensitivity as for the longer time constant case. The overall improvement is about 1.0 on the Cooper scale.
24

7:
3(
(
-3(
-75
L
PILOT RATING 3.4 &/a, = 0.063
41 = 1.9”
LEFT WHEEL
0 1 SEC -7-T
-
/ -
-
--- --.----... .-_-_ I
Figure 12. - Time History of Wheel Motion During Sidestep Maneuver
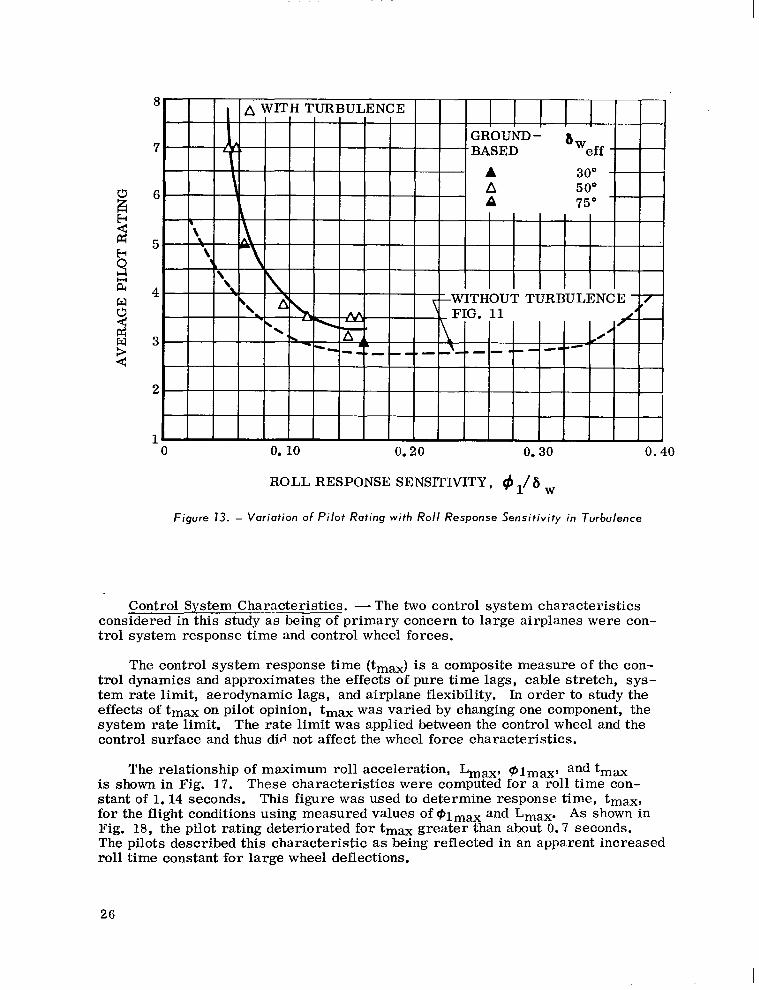
8 i WITH TURBULENCE I I I I I I
GROUND - A --_ 7
6
4 HOUT TURBULEN
0 0. 10 0.20 0.30 0.40
ROLL RESPONSE SENSITIVITY, 4 1/” w
Figure 13. - Variation of Pilot Rating with Roll Response Sensitivity in Turbulence
Control System Characteristics. - The two control system characteristics considered in this study as being of primary concern to large airplanes were con- trol system response time and control wheel forces.
The control system response time (tmax) is a composite measure of the con- trol dynamics and approximates the effects of pure time lags, cable stretch, sys- tem rate limit, aerodynamic lags, and airplane flexibility. In order to study the effects of tmax on pilot opinion, tmax was varied by changing one component, the system rate limit. The rate limit was applied between the control wheel and the control surface and thus did not affect the wheel force characteristics.
The relationship of maximum roll acceleration, Lmax, @Imax, and t,, is shown in Fig. 17. These characteristics were computed for a roll time con- stant of 1.14 seconds. This figure was used to determine response time, tmax, for the flight conditions using measured values of @Imax and Lmax. As shown in Fig. 18, the pilot rating deteriorated for tmax greater than about 0.7 seconds. The pilots described this characteristic as being reflected in an apparent increased roll time constant for large wheel deflections.
26
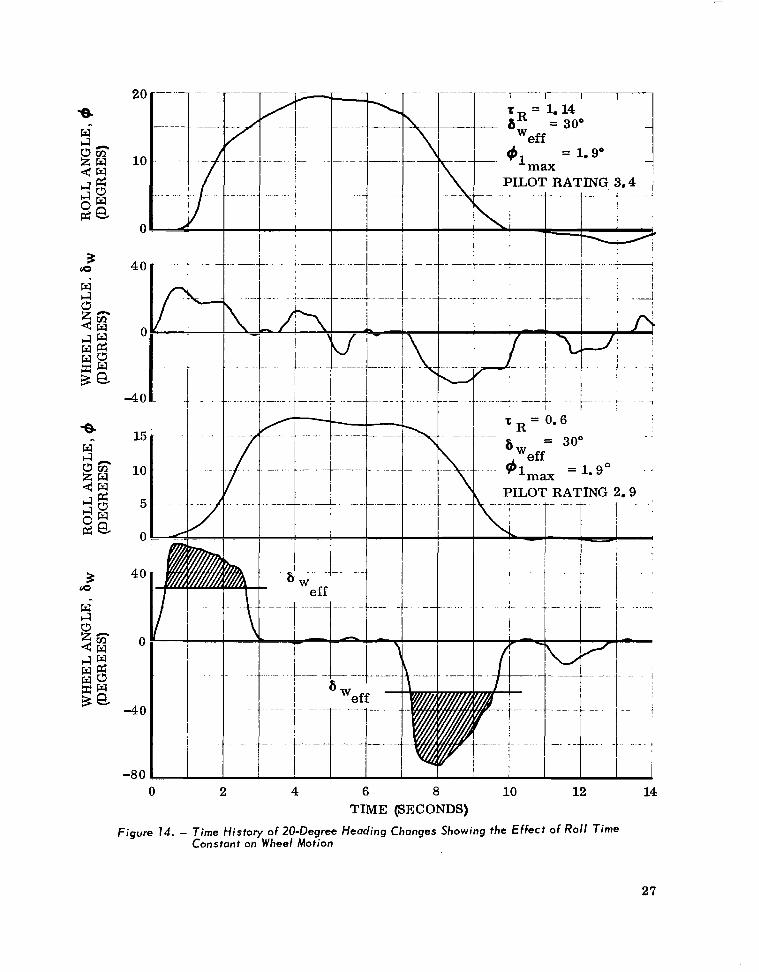
20 --.-
10.
1 0. -
40. -.
0 k
r -40
PILOT RATmG 3.4 / _ ..- .._._. _.... _ _- . . ..I ---.
.-
.._-- -. I
PILOT RATING 2.9 --.-.--. , .’
I 1- I
_ ~~.. I I T I I I I
-80
0 2 4 6 8 10 12 14 TIME (SECONDS)
Figure 74. - Time History of 20-Degree Heading Changes Showing the Effect of Roll Time Constant on Wheel Motion
27
5 I L-- I
i j -/ i.ri
- I I I I ri
0 INFLIGHT A GROUND-BASED 0.092 < $/&, <
I 0.320
1 0 0.2 0.4 0.6 0.8 1.0 1.2 1.4 1.6
Ia 1.8 2.0
ROLLING MODE TIME CONSTANT, rR (SECONDS)
Figure 15. - Variation of Pilot Rating with Rolling Mode Time Constant
GROUND- bw INFLIGHT BASED eff
5
4
3
2
A
1, 0 0.10 0.20 0.30 0.40
ROLL RESPONSE SENSITIVITY, 9 1/ 6 w
Figure 16. - Pilot Ratings of Roll Response Sensitivity Showing the Effect of Roll Time Constant
28

0 1 2 3 4 5 6 7
MAXIMUM BANK ANGLE IN THE FIRST SECOND d1 (DEGREES) max
Figure 17. - Relationship of Roll Acceleration, Roll Response, and Control System Response Time
The effect of wheel force gradient on pilot opinion is presented in Fig. 19 as evaluated by one pilot. The lower limit of wheel force gradient was not defined in these tests. The pilot indicated that the lateral control forces would be dictated, to a large extent, by longitudinal control forces, and that the force gradient used in flight (0.2 lb/deg) and on the ground-based simulator (0.28 lb/deg) for most of the tests provided good force harmony between the wheel and column. The wheel breakout force was held constant for all tests at approximately 4 pounds to give positive centering.
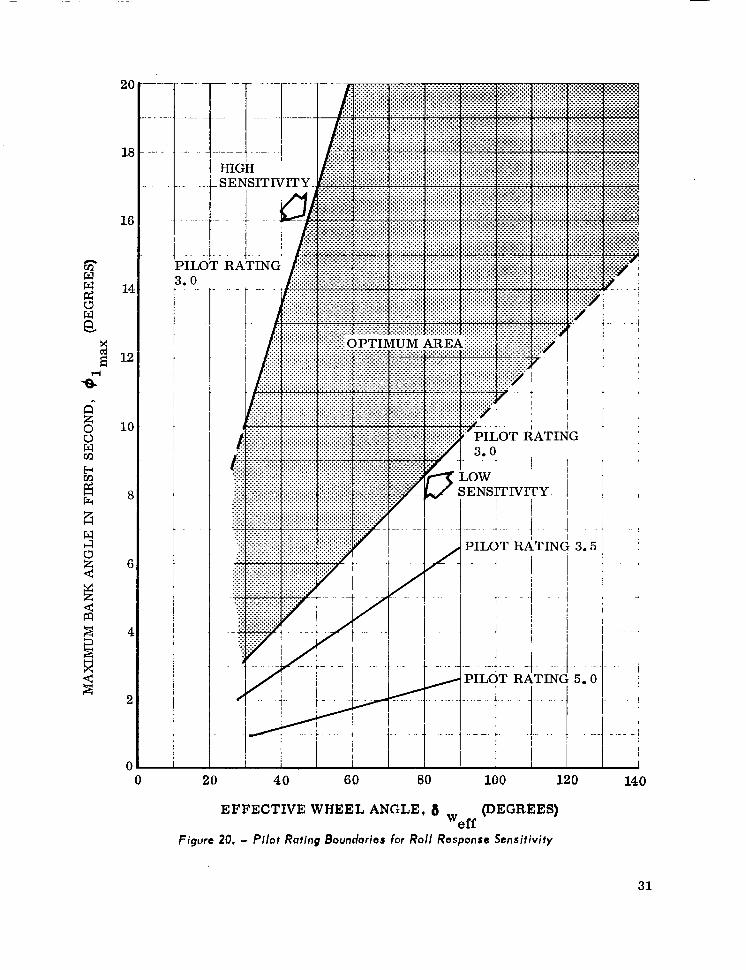
Lateral Control Criteria. -Among the roll control criteria proposed in previous studies are maximum bank angle in the first second (@I ax), maximum bank angle after two seconds ($2max), steady state roll rate (+ssr maximum roll acceleration (Lmax), and roll time constant (r ). Over the range of values tested in this investigation, roll response sens%vity as measured by $~1/6 w correlated well with pilot opinion.
Figure 20 presents this criterion in terms of pilot rating boundaries showing an area for satisfactory sensitivity (pilot rating of 3 or better). The boundaries for minimum elmax and minimum b we
F were not determined in these tests. This
omission is not serious since, for prac ma1 aircraft, there are other requirements which demand certain values of lateral control power. As the requirements for #lrnzi
“I decrease, these other requirements establish the criterion for the lateral
contra power.
29

0 0.2 0.4 0.6 0.8 1.0 1.2 1.4 1.6 1.8 2.0
CONTROLSYSTEMRESPONSETIME, tmax (SECONDS)
Figure 18. - Variation of Pilot Roting with Control System Response Time
GROUND- INFLIGHTBASED
6-., 0 A ?‘6,x, 0.063 0.083
1.14 1.42 5 TR= I BREAKOUT FORCE=4LB
1-1 4
-0 0.1 0.2 0.3 0.4 0.5 0.6 0.7 0.8 0.9 1.0
WHEELFORCEGRADIENT(LB/DEG)
Figure 79. - Variation of Response Time with Wheel Force Gradient
30
10
8
.:.- PILOT
6
1 1
2Q 40 60 80 100 120
EFFECTIVE WHEEL ANGLE, 8 Weff
(DEGREES)
Figure 20. - PIlot Rating Boundaries for Roll Response Sensitivity
4 I
’ .- --I- -
2
0 0
31
Longitudinal Stability and Control
In previous studies of large airplane handling qualities (for example, .Ref. 6), pilots have commented adversely on “sluggish” response. The basis of this comment has not been fully understood. Accordingly, in an attempt to provide an understanding of the factors involved, variations in the following parameters were examined: pitch control sensitivity, lift due to control deflection, pitching moment due to angle of attack, pitching moment due to pitch rate, and lift due to angle of attack.
Control force gradient was not a variable in the program; however, pilots were given an opportunity to choose a level of control force they considered satis- factory. The column force gradient was selected as 6 lb/in. on the inflight simulator and set at 4.5 and 6 lb/in. on the ground-based simulator. Both simu- lators used a centering detent with a nominal 4-pound breakout force.
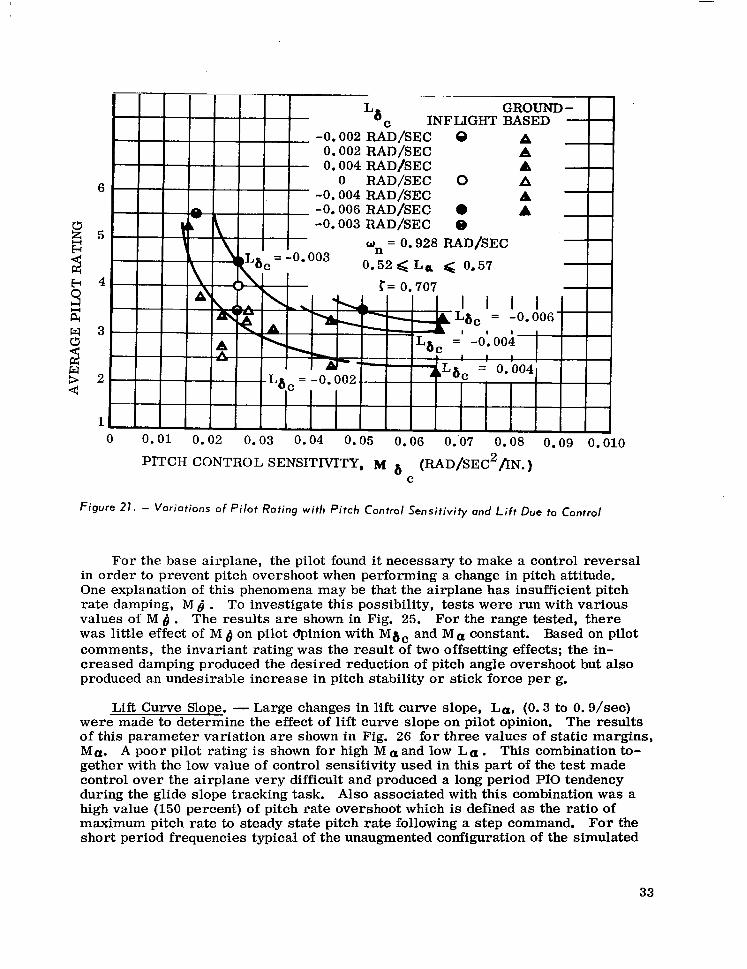
Longitudinal Control Sensitivity. - In the longitudinal evaluation, pilot opinion was strongly influenced by control column sensitivity as measured by pitch accel- eration per unit control column deflection, Ma . pitch control sensitivity is shown in Fig. 21 wi -En
The variation in pilot rating with several values of lift due to con-
trol deflection. rad/sec2/in.
There is a rapid deterioration in pilot opinion for Ma, below 0.03
Lift Due to Control Deflection. - For airplanes with low values of short period frequency, it has been shown that flight path dynamic response is adversely affected by the lift loss associated with conventional aft control surfaces (Ref. 6). Figure 22 shows the lag in flight path response produced by lift due to control de- flection, Lhc. Increasing the loss of lift due to control motion results in a deg- radation of pilot opinion as shown in Fig. 21. The differences in pilot rating due to La are seen to be significant, particularly at low values of Ma,. The de- sirabi ity of including this affect in defining a longitudinal control criteria is -7. developed in a later section of this report.
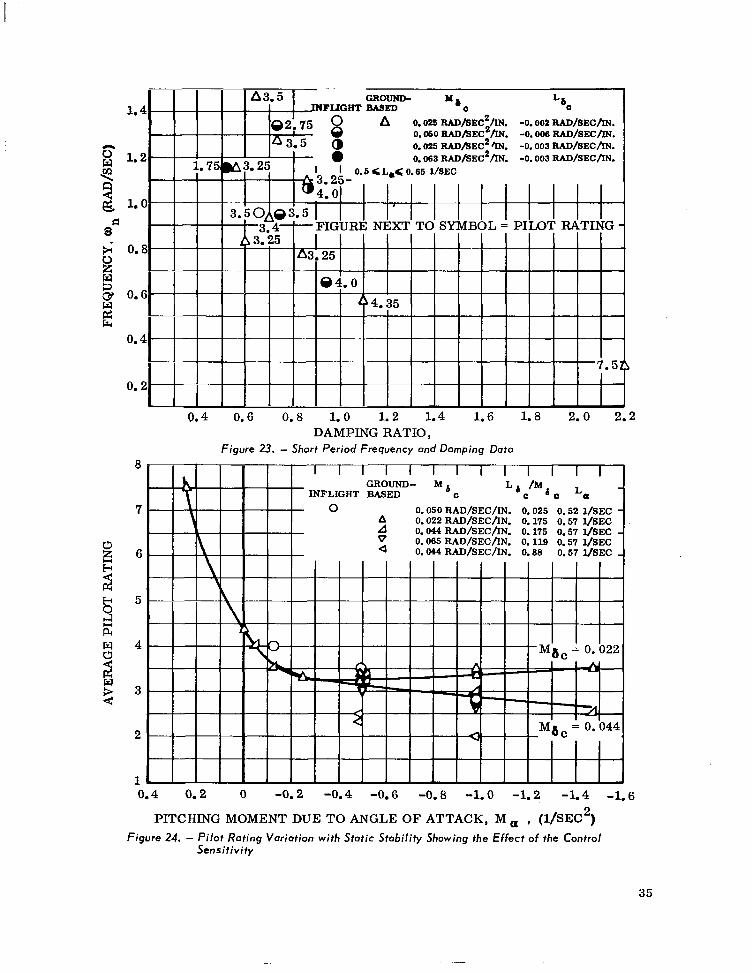
Static Stability and Damping. - The effect of short period dynamics on pilot opinion has traditionally been presented on the frequency-damping plane. Figure 23 shows pilot rating in this manner; however, iso-opinion lines have not been drawn because of inconsistencies in the data. These inconsistencies stem largely from variations of the control parameters L(lc and Mac that occurred in this series. The strong effect of these terms is shown in Fig. 21. While the range of pilot ratings affected by La and M 6 was not large for the frequency damping variations, it does appear &at the co%rol parameters will modify pilot opinion.
A wide range of values of M (Z was evaluated to assess the effect of static stability with approximately constant total damping, 5 on. The data presented in Fig. 24 show that for constant M&, Mar has little effect on pilot opinion except for low or negative static margins. Increasing static stability improved the pilot rating except in the case of low control sensitivity. This latter trend may be ex- plained by the high stick forces (a maximum of 194 lb/g) and reduced capability to maneuver for this case.
32
-
6
L8 GROUND - C INFLIGHT BASED I
-0.002 RAD/SEC 0 0.002 RAD/SEC 0.004 RAD/SEC
-0. :04 RAD/SEC 0 RAD/SEC
-0.006 RAD/SEC l -0.003 RAD/SEC 8
W = 0.928 RAD/SEC 003 n
0.52<LQ < 0.57
r= 0.707
2 A A
:
Ililll Ill Ill I I II 0 0.01
11 0.02 0.03 0.04 0.05 0.06 0:07 0.08 0.09 0.01
PITCH CONTROL SENSITIVITY, M 6 (RAD/SEC2fiN.) C
Figure 21. - Variations of Pilot Rating with Pitch Control Sensitivity and Lift Due to Control
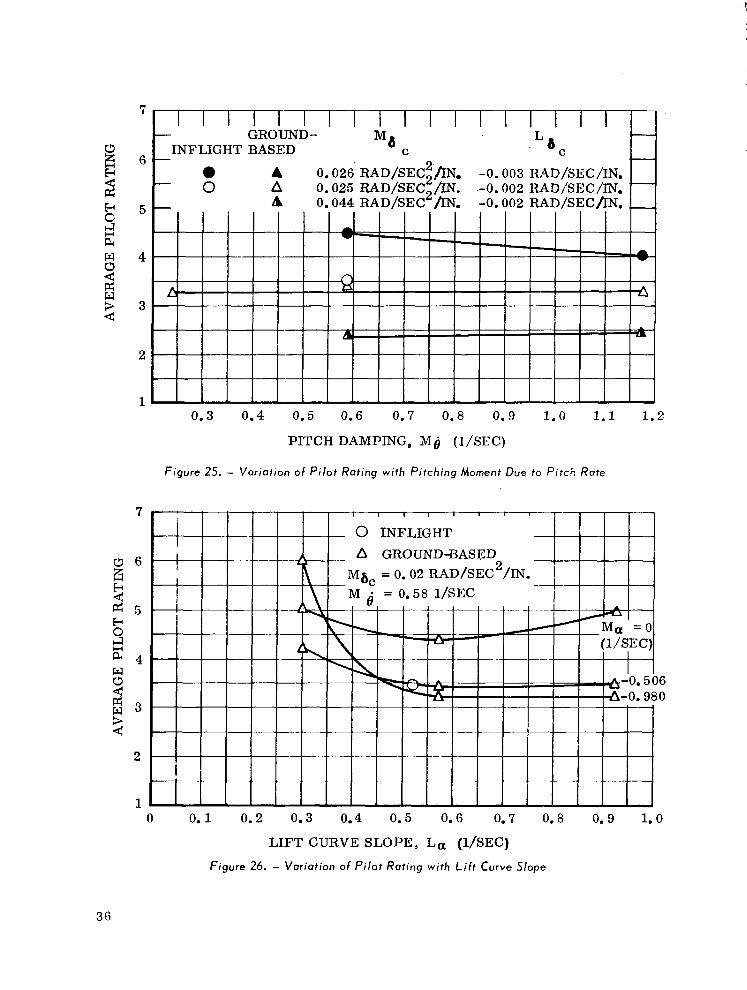
For the base airplane, the pilot found it necessary to make a control reversal in order to prevent pitch overshoot when performing a change in pitch attitude. One explanation of this phenomena may be that the airplane has insufficient pitch rate damping, Mb . To investigate this possibility, tests were run with various values of M ,j . The results are shown in Fig. 25. For the range tested, there was little effect of M 4 on pilot Upinion with Mbc and Ma constant. Based on pilot comments, the invariant rating was the result of two offsetting effects; the in- creased damping produced the desired reduction of pitch angle overshoot but also produced an undesirable increase in pitch stability or stick force per g.
Lift Curve Slope. - Large changes in lift curve slope, La, (0.3 to 0. S/set) were made to determine the effect of lift curve slope on pilot opinion. The results of this parameter variation are shown in Fig. 26 for three values of static margins, Ma. A poor pilot rating is shown for high M a and low La. This combination to- gether with the low value of control sensitivity used in this part of the test made control over the airplane very difficult and produced a long period PI0 tendency during the glide slope tracking task. Also associated with this combination was a high value (150 percent) of pitch rate overshoot which is defined as the ratio of maximum pitch rate to steady state pitch rate following a step command. For the short period frequencies typical of the unaugmented configuration of the simulated
33

airplane, large overshoot was not a problem. With the exception noted, it appears that lift curve slope had little effect on pilot opinion for the range of M, testecl.
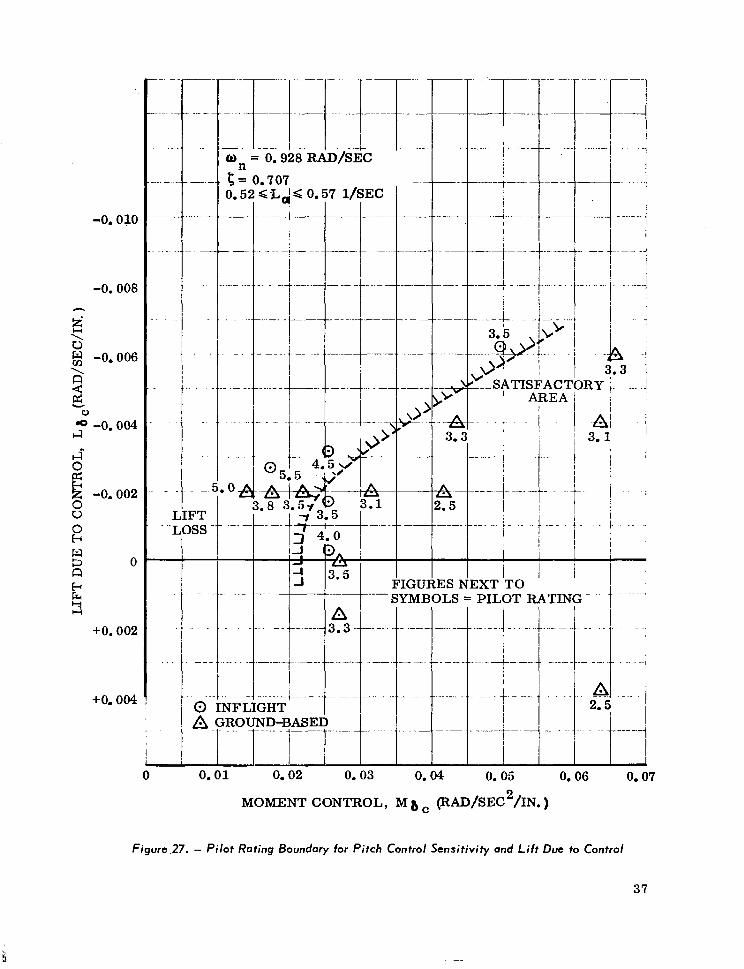
Longitudinal Control Criteria. -The development of definitive criteria for longitudinal control characteristics was beyond the scope of this program; however, analysis of the data indicated that, as for the lateral case, the control sensitivity Ma ;(as well as the related variable L$ c) was important to longitudinal handling qualities. Figure 27 presents the pilot rating data for various values of M 6 c and La c for the basic frequency and damping. Although there were insufficient data to describe adequately the satisfactory boundary, the trends are apparent. Signifi- cantly, the curves indicate that as La c increases above a moderate level, increased Ma c will be necessary for adequate control. As noted, the boundary shown applies to the case represented by the basic airplane dynamics. For other stability characteristics the boundary may shift.
COLUMN DISPLACEMENT, 6,
0’ LONGITUDINAL FLIGHT LONGITUDINAL FLIGHT PATH ANGLE RATE, Y PATH ANGLE RATE, Y
/ / / /
/ / LONGITUDINAL LONGITUDINAL / / FLIGHT PATH FLIGHT PATH / / ANGLE, Y ANGLE, Y
-- -- L& =o L& =o
- BAS: AIRPLANE - BAS: AIRPLANE 1 1 2 2 CONFIGURATION CONFIGURATION
TIME (SECONDS) TIME (SECONDS)
Figure 22. - Example of Flight Path Response to Elevotor Input Showing the Effect of Lift Loss Due to Control Deflection
34
0.
iL.CO.65 l/SEC
III II II III
0.4 0.6 0.8 1.0 1.2 1.4 1.6 1.8 2.0 2.2 DAMPING RATIO,
Figure 23. - Short Period Frequency and Damping Doto
8
7 O.O50RAD/SEC/IN. 0.52 l/SEC O.O22RAD/SEC/IN. 0.57 l/SEC 0.044 RAD/SEC/IN. 0.57 l/SEC 0.065 RAD/SEC/IN. 0.57 l/SEC
6 0.044 MD/SEC/IN. 0.66 0.57 l/SEC
5
3
2
1 I III I Ill I 11 11 l I l l l I 5.4 0.2 0 -0.2 -0.4 -0.6 -0.8 -1.0 -1.2 -1.4 -1.6
PITCHING MOMENT DUE TO ANGLE OF ATTACK, M a , (1/SEC2)
Figure 24. - Pilot Roting Variation with Static Stability Showing the Effect of the Control Sensitivity
35
GROUND- FLIGHT BASED
6
4
3
a 2
l/ 0.3 0.4 0.5 0.6 0.7 0.8 0.9 1.0 1.1 1.2
PITCH DAMPING, Mb (l/SIX)
Figure 25. - Variation of Pilot Rating with Pitching Moment Due to Pitch Rote
I I I I
0 INFLIGHT A GROUND-BASED
= 0.02 RAD/SEC2/IN.
4
3 I I I I I I I I I
0 0.1 0.2 0.3 0.4 0.5 0.6 0.7 0.8 0.9 1.0
LIFT CURVE SLOPE, La (l/SEC)
Figure 26. - Variation of Pilot Rating with Lift Curve Slope
36
-0. OJO
-0.008
‘4 w -0.006
9 E. 0” Gl -0.004 .
s E -0.002 8 iz w Ei 0
F4 2
+o. 002
+o. 004
i
.
..- .- - __ -..-
.
I-
LI: F1 -Los!
1 .-
I.
--
.._ _
Od
= 0.928 RAD/SEC
-- 2G.LdGO.57 l/SEC .._... -.-i-.---.
YFI
‘-- I----I SYMBOLS = PILOT RATING - .-----
..--- ..~._.
0 0.01 0.02 0.03 0.04 0. 05 0.06 0.07
MOMENT CONTROL, M 8 c (RAD/SEC2/IN. )
Figure.27. - Pilot Rating Boundary for Pitch Control Sensitivity and Lift Due to Control
37
CONCLUSIONS AND RECOMMENDATIONS
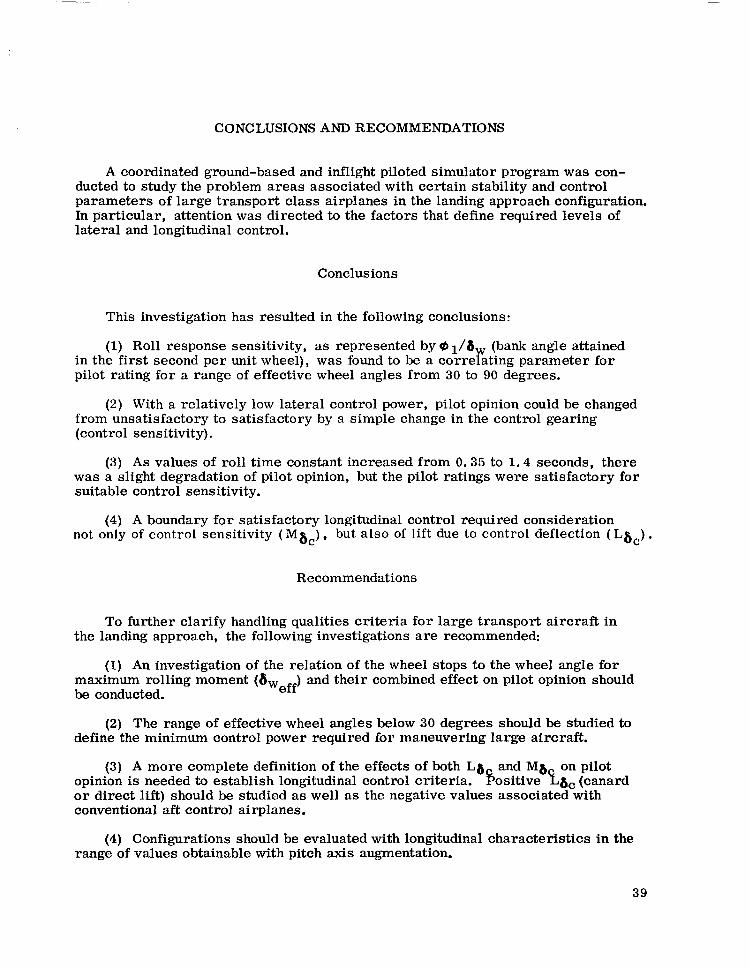
A coordinated ground-based and inflight piloted simulator program was con- ducted to study the problem areas associated with certain stability and control parameters of large transport class airplanes in the landing approach configuration. In particular, attention was directed to the factors that define required levels of lateral and longitudinal control.
Conclusions
This investigation has resulted in the following conclusions:
(1) Roll response sensitivity, as represented by Q ,/a, (bank angle attained in the first second per unit wheel), was found to be a correlating parameter for pilot rating for a range of effective wheel angles from 30 to 90 degrees.
(2) With a relatively low lateral control power, pilot opinion could be changed from unsatisfactory to satisfactory by a simple change in the control gearing (control sensitivity).
(3) As values of roll time constant increased from 0.35 to 1.4 seconds, there was a slight degradation of pilot opinion, but the pilot ratings were satisfactory for suitable control sensitivity.
(4) A boundary for satisfactory longitudinal control required consideration not only of control sensitivity (Mac), but also of lift due to control deflection ( Lbc).
Recommendations
To further clarify handling qualities criteria for large transport aircraft in the landing approach, the following investigations are recommended:
(1) An investigation of the relation of the wheel stops to the wheel angle for maximum rolling moment (6 Weff) and their combined effect on pilot opinion should be conducted.
(2) The range of effective wheel angles below 30 degrees should be studied to define the minimum control power required for maneuvering large aircraft.
(3) A more complete definition of the effects of both Lb and Mb on pilot opinion is needed to establish longitudinal control criteria. b ositive ?.& (canard or direct lift) should be studied as well as the negative values associated with conventional aft control airplanes.
(4) Configurations should be evaluated with longitudinal characteristics in the range of values obtainable with pitch axis augmentation.
39
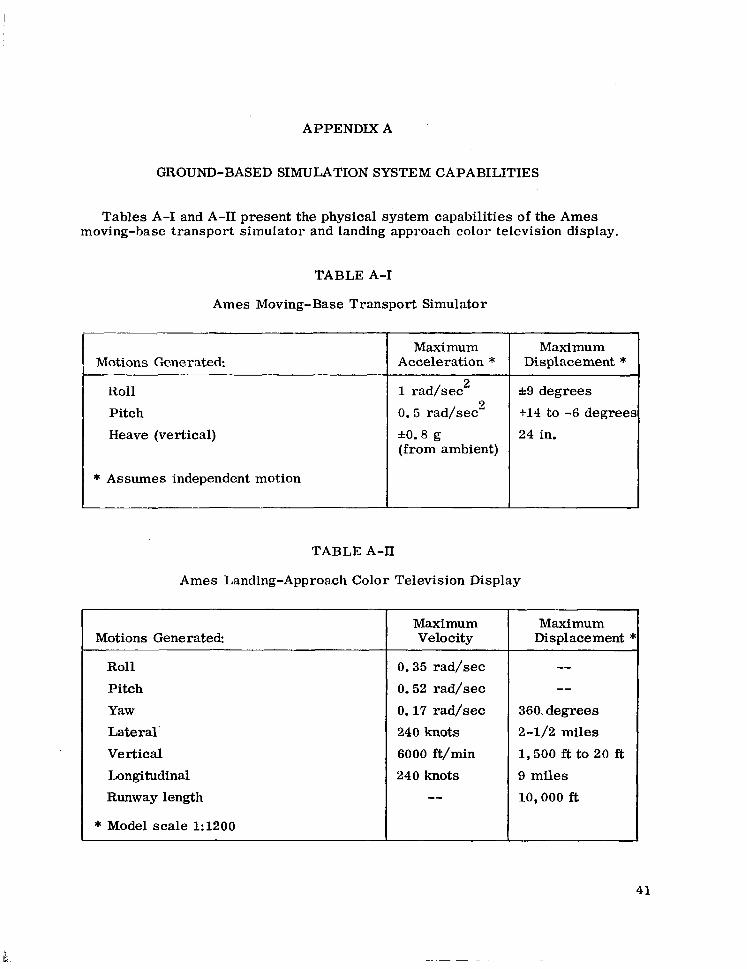
APPENDIX A
GROUND-BASED SIMULATION SYSTEM CAPABILITIES
Tables A-I and A-II present the physical system capabilities of the Ames moving-base transport simulator and landing approach color television display.
TABLE A-I
Ames Moving-Base Transport Simulator
Motions Generated:
it011
Pitch Heave (vertical)
* Assumes independent motion
Maximum Acceleration *
1 rad/sec2 0.5 rad/sec2
*O. 8 g (from ambient)
Maximum Displacement *
A9 degrees +14 to -6 degree
24 in.
TABLE A-II
Ames Landing-Approach Color Television Display
Motions Generated:
Roll
Pitch
Yaw Lateral’ Vertical Longitudinal Runway length
* Model scale 1:1200
Maximum Velocity
0.35 rad/sec
0.52 rad/sec 0.17 rad/sec 240 knots 6000 ft/min 240 knots
--
Maximum Displacement :
-- --
360, degrees 2-l/2 miles 1,500 ft to 20 ft. 9 miles 10,000 ft
*
A
41

APPENDIX B
DESCRIPTION OF THE INFLIGHT SIMULATOR
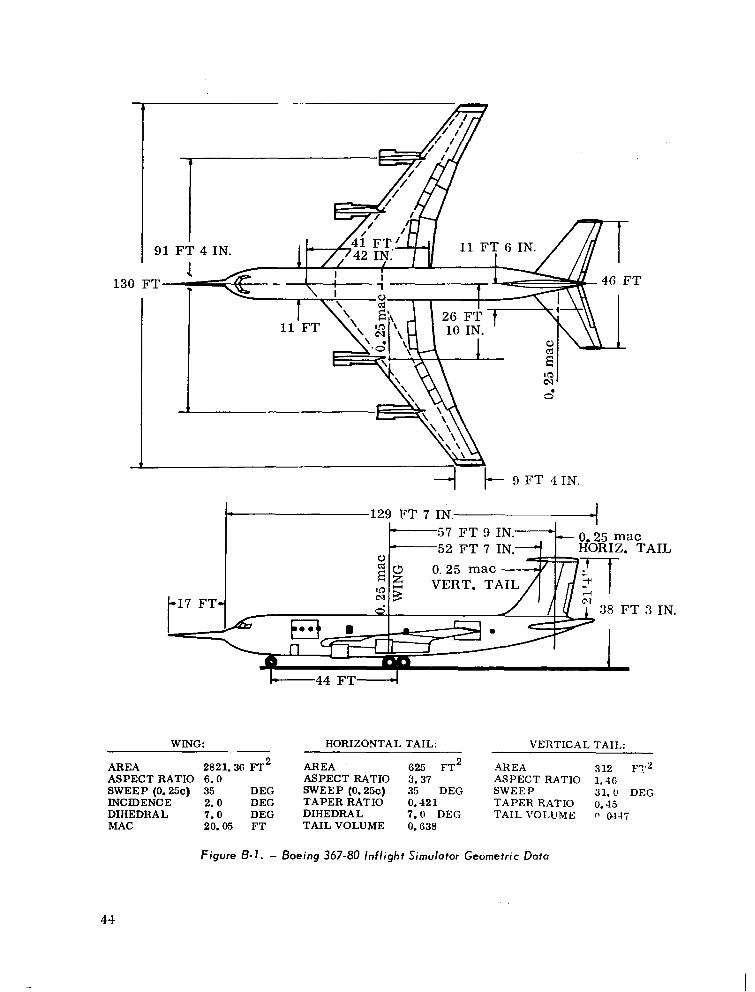
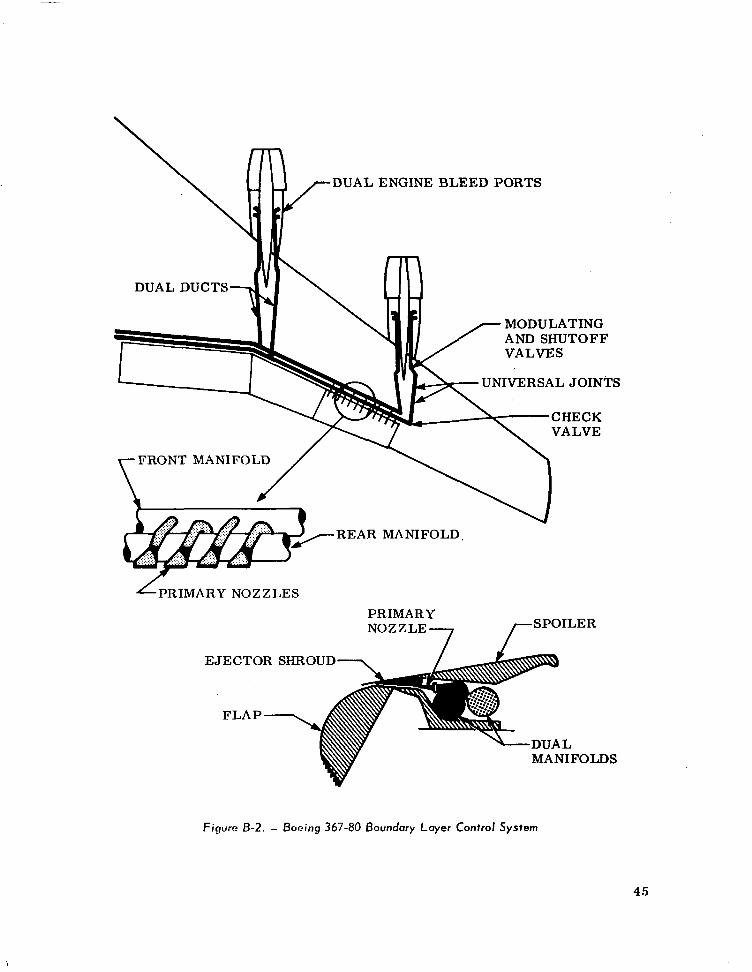
The Boeing Model 367-80 is the prototype of the C/KC-135 jet transport/ tanker airplanes and the ‘707 series commercial transptirts. The 367-80 has been used as a development test bed for improved flap systems, autopilot devices, and other airplane equipment. A two-view drawing and basic specifications are pre- sented in Fig. B-l. As flown in this program, the 367-80 was equipped with fixed leading edge slats on the outboard section, Krueger flaps on the inboard section, and boundary layer control (BLC) trailing edge flaps. The BLC flaps are large chord with single pivot hinges. High pressure engine bleed air is blown over the upper surface of the flaps. The BLC system is shown in Fig. B-2 and discussed in detail in Ref. 7. This system was used during the program to simulate the high roll power and low roll time constant configuration. All other characteristics remained essentially unchanged from the base lateral configuration. The longi- tudinal BLC configuration was also documented.
Example of Control Command Derivation. Figure B-3 indicates the variables used in the computation of the control commands. The magnitudes of the elec- trical commands to the surfaces were obtained from precalculated differences between the response of the basic 367-80 airplane and the response of the simulated airplane. The calculations were based on the known stability and control de- rivatives of the 367-80 and the predicted derivatives of the simulated airplane.
Figure B-4 shows a simplified block diagram of the elevator system. The derivation of the elevator command equation illustrates the method used for each control surface. The first step is the requirement that all center of gravity accelerations, both linear and rotational, be identical for the 367-80 and the simulated airplane. Thus, for the pitch axis
. . . . ‘-80 = e LT
Expanding this simple identity using a summation of pitching moments results in the following equation:
I q. SC
IYY -8(
cM %h %h
cMa AU
‘M ,i fi
‘M 6 8,
‘MAP AV
‘M 6e 6e
cM 8 8
ah - ab
cl0 se =I I IYY
LT
-80
b Mgth
8 t.1
cMa Aa
cM& ti
CMi i
‘“Av AV
‘Mb be m e LT
43
4 /- ~FT~IN.
b-.129 FT 7 IN.-- mat
IZ. TA
nz4 z$s I VERT. TAIL/1 j/ ; r
8 FT 3 I I AT - I 2 I- - l e l -* I
WING: HORIZONTAL TAIL: VERTICAL TAIL:
AREA 2821.36 FT2 AREA G25 FT’ -4REA 312 f-T2
ASPECT RATIO 6.0 ASPECT RATIO 3.37 ASPECT RATIO 1.4G SWEEP (0.25~) 35 DEG SWEEP (0.25~) 35 DEG SWEEP 31.U DEG INCIDENCE 2.0 DEG TAPER RATIO 0.421 TAPER RATIO 0.43 DIHEDRAL 7.0 DEG DIHEDRAL 7.0 DEG TAIL \‘OLUME 0 0447 MAC 20.05 FT TAIL VOLUME 0.638
JL
IN.
Figure B-7. - Boeing 367-80 lnflight Simulator Geometric Doto
45
/-DUAL ENGINE BLEED PORTS
DUAL DUCTS
MODULATING AND SHUTOFF
UNIVERSAL JOINTS
FRONT MANIFOLD
REAR MANIFOLD.
LPRIMARY NOZZLES PRIMARY NOZZLE7LER
EJECTOR SHROUD\
FLAP
-DUAL MANIFOLDS
Figure B-2. - Boeing 367-80 Boundary Layer Control System
45

&i, LT
THRUST ‘thLT
I COLUMN
RUDDER PEDAL brLT 6
WHEEL WLT 1
beLT All
‘ANGLE OF ATTACK SIDE SLIP ANGLE AIRSPEED PITCH RATE ROLL RATE YAW RATE ALTITUDE
L
AIRBORNE COMPUTER
+ ELEVATOR
+ THRUST
-+ SPEEDBRAKES
+ RUDDER
b WHEEL
COMMAND SIGNAI
INTERFACE CONSOLE
u
Figure B-3. - Simplified Diagram of the Computation System
SAFETY EVALUATION PILOT PILOT
AIRPLANE VARIABLES
FEEL SYSTEM
9 POSITION TRANSDUCER
TRANSFER VALVE
CONTROL VALVE -
lL!Jz$
MODULATING PISTON
Figure B-4. - Simplified Block Diagram of Elevator System
46
--- __.
s %8() * th,8()
6 6, - 1 ab
- ( 6”k8() -80 -80 cM -
6, cM Mar
I -80 ’ a LT a-80 - 1”
ci LT cM
'-80 . -
6 LT 'M- )e
d-80
6 6
e LT e LT
6 t11 LT 6th LT
-
A’ 1,T cM Av-82Av
w 1 Simil;tr ~OI~II~I:III~~S C:;II~ 1~: (Ici~ivc~cl I’oi’ llw S(j7-80 rudder, wheel, thrust, and
spoi lc I,‘.
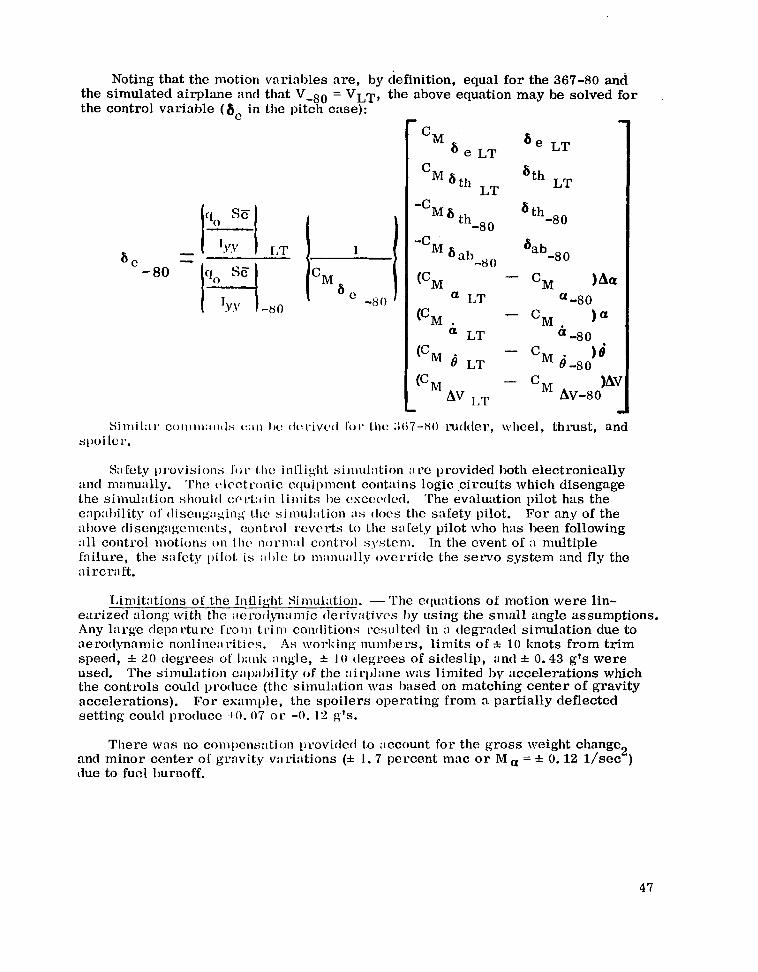
Noting that the motion variables are, by definition, equal for the 367-80 and the simulated airplane and that V -80 = VLT, the above equation may be solved for the control variable (6, in the pitch case):
‘I
S;~Cety I)rovisions l’or I.hc: inllight silllul;ltion :IW provided both electronically and m:lnu:illy. The olcctronic equipment contains logic .circuits which disengage the simul;ltion shoultl cr L’~:I in limits be c~scccclctl. The evaluation pilot has the c:lp:il)ility ol’ tliseng:lgin; I.IIc simul;llion ;IS tlocs the safety pilot. For any of the above tliscngxl?;cmcnts, control reverts to lhe safety pilot who has been following iill control motions on 111~ norni~tl control system. In the event of ;i multiple failure, the s:iTcty l)ilot. is ;~l)lc to rn;~nu;~lly ovcrritle the servo system and fly the Grcraft.
Limitations of the Inflight Si mulation. - The erlu:ltions of motion were lin- earized along with the ;ierotl~y~~amic tleriv:ttivts I)y using the small angle assumptions. Any large rlepn rturc l’rom t 1-i m contlitions rcsulterl in ;1 degraded simulation due to aerodynamic nonline;i ritics. As working nunil)ers, limits off 10 knots from trim speed, f 20 tleyrees 0l I);tnli ;Itigle, f 10 tlegrees of sideslip, and f 0. 43 g’s were used. The simul~~tion c;~lxll)ility of the ;~iq)l;ine ~1s limited bv accelerations which the controls could produce (the simukltion was based on matching center of gravity accelerations). For example, the spoilers operating from a partially deflected setting could protlucc +O. 07 or -0. 12 g’s.
There was no com~)ens:~tion ~)rovitletl t.o account for the gross weight change2 and minor center of gravity wrk~tions (3 I. 7 percent mnc or M, = f 0.12 l/set ) due to fuel l)urnoff.
47

The response characteristics of the control surfaces affected the accuracy of the simulation, This limitation included the frequency response of the servo sys- tem plus any nonlinearities in the linkages, and the effects of ail-loads. Signal accuracy from the aircraft sensors was important since these signals mere fed directly into the computer to form the commands for the control surfaces. Meas- urement of the significant variables such as angle of attack, sideslip angle, and airspeed was vital to the simulation accuracy. The important sensors were calibrated previously over the flight range used. The aircraft response to a standardized control input provided an overall check of total system response.
The 367-80 simulation system was not designed to produce accurate simulation in a turbulent environment. This factor made it necessary to fly the simulation in relatively calm air (gusts less than i 1 degree in a or f 2 degrees in P ). Because control positions were a strong function of the aircraft motion variables, gusty conditions would have resulted in errors. These errors would be due primarily to physical separation of the sensor from the actual surface position. For example, a vertical gust first encountered by the nose-boom-mounted angle- of-attack sensor would feed a signal to the spoilers to change the lift and the elevator to correct the pitching moment. A finite time later the gust would reach the wing and later the tail, resulting in a motion which would not be the correct gust response of the simulated airplane.
48

APPENDIX C
CONFIGURATION DESCRIPTIONS
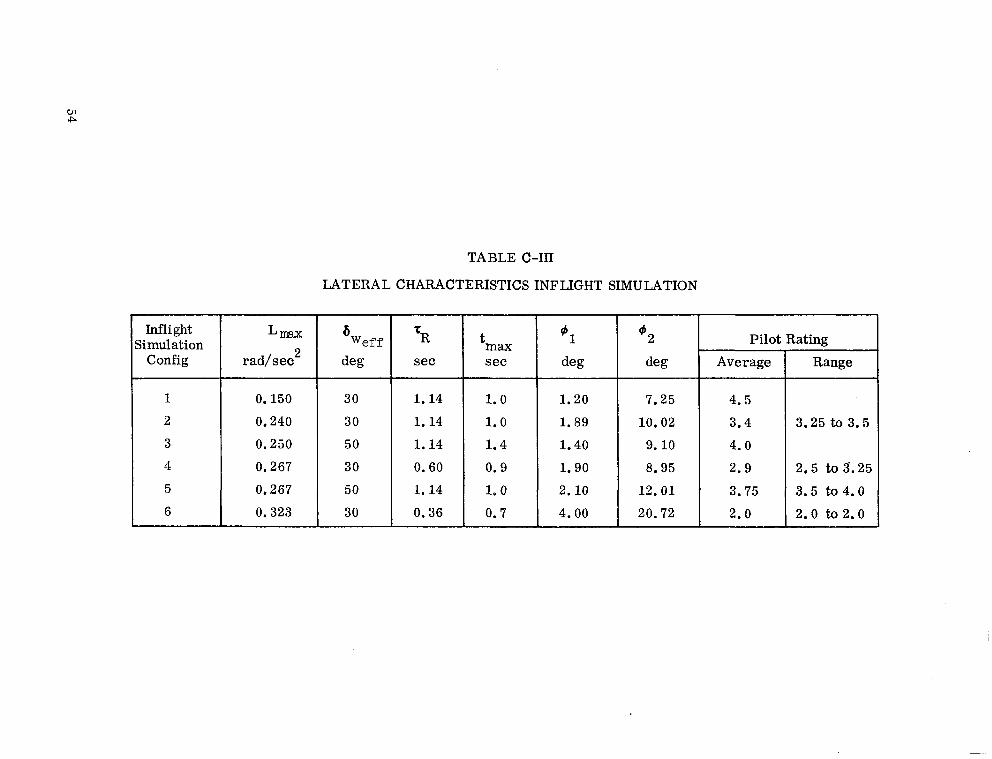
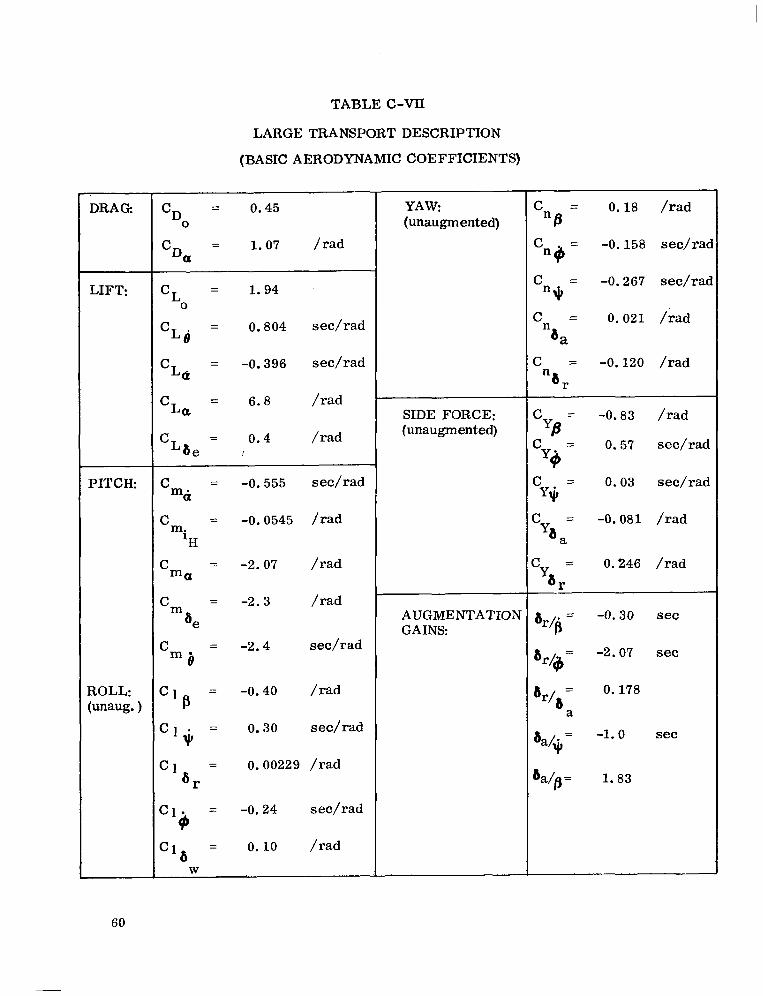
Tables C-I and C-II present the longitudinal characteristics of the configurations evaluated on the airborne and ground-based simulators, Tables C-III and C-IV present the later characteristics. Representative large transport physical char- acteristics and aerodynamic coefficients for the base configuration are shown in Table C-V. Characteristics which were not varied significantly during the study are presented in Tables C-V and C-VI.
49

Inflight Simulation
:onfiguration
TABLE C-I
LONGITUDINAL CHARACTERISTICS INFLIGHT SIUMLATION
La
l/set
0.497 0.521 0.521 0.521 0.521 0.521. 0.521 0.552 0.645
M, I126
l/sec2 l/set
-0.128 -0.587 -0.506 -0.587 -0.506 -0.587 -0.506 -0.587 -0.506 -0.587 -0.506 -0.587 -0.506 -1.174 -1.012 -1.174 -1.398 -0.598
Mb
rad/sec2'in .
.0504 -.00635 26 0.650 0.942 4.0
.0167 -.00262 128 0.907 0.703 5.5
.0252 -.00010 76 0.907 0.703 4.0
.0252 -.00164 81 0.907 0.703 3.5
.0252 -.00313 83 0.907 0.703 4.5
.0504 -.00625 42 0.907 0.703 3.5
.0252 -.00316 144 1.071 0.865 4.0
.0504 -.00635 91 1.330 0.725 2.75
.0625 -.00276 50 1.14 0.525 1.75
L6, rj$
rad/sec/in.
1.5 to 2.0
*Windup turn slope at R = 1.0
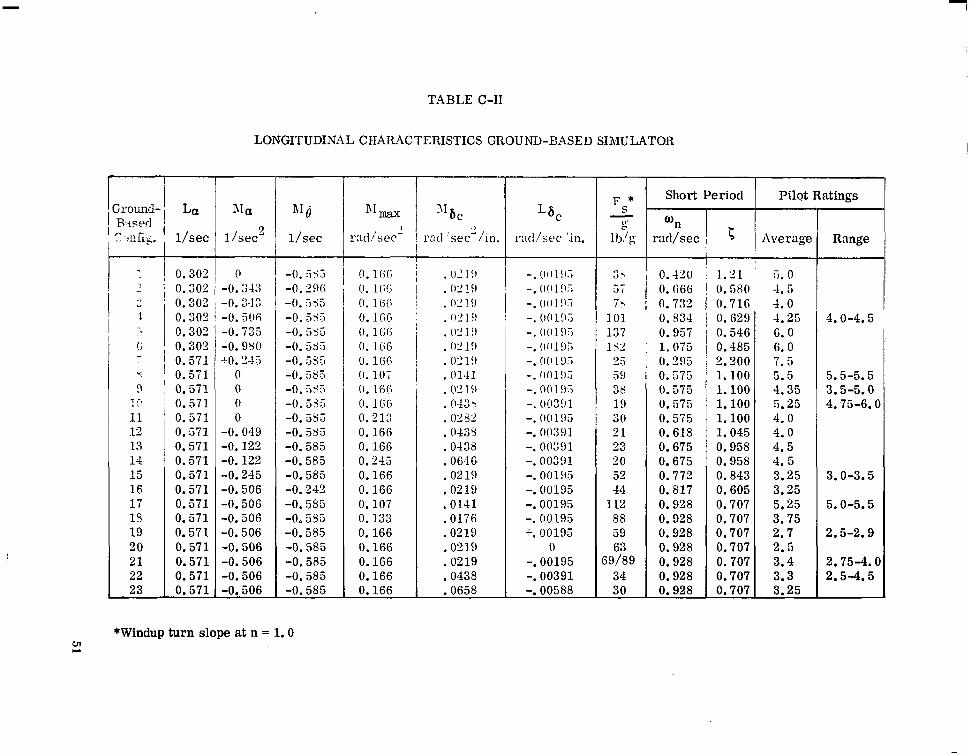
TABLE C-II
LONGITUDINA4L CHARACTERISTICS GROUND-BASED SIMULATOR
fiIa
1 /se2 Range
.!
f\ 1 r. L.,
11 12 13 14 15 16 17 19 19 20 21 22
0.302 0.302 0.302 0.302 0.302 0.302 0.571 0.571
0 -0.34;: -0.340 -0.506 -0.735 -0.980 +o. 245
0 0 0 0
-0.049 -0.122 -0.122 -0.245 -0.506 -0. SOG -0.506 -0.506 -0.506 -0.506 -0.506 -0.506
. (I,’ 1’1 - *
. w19
. (I“ 10 - I
. 02 1 !I
. (I” 10 - I
. WI!)
. 0” 10 - .
.0141
. 0'2 19
. 043s
. (j2Q
. 0435
.0433
.0646
.0219
.0219
.0141
.0176
.0219
.0319
.0219
.0438
i - . (II II ‘1-l . . -* (l!ll!)rJ -. (rrrl!,: -. 0111!1> -. 0019~ -* orll:,~ -. (I(1 1 !,I: -. lbl)l!lJ -. CIOl!FJ -. 003!ll -. 0019J -. 00391 -. 00391 -. 00391 -. 00195 -. 00195 -. 00195 -. 00195 +. 00195
0 -. 00195 -. 00391 -.00588
>‘i 7>
101 137 19 3 .- A 3 59 38 19 30 21 23 20 52 44
112 88 59
69%9 34 30
0. 666 0.722 0.534 0.957 1.075 0.295 0.575 0. 575 0.575 0.575 0.61s 0.675 0.675 0.772 0.817 0.928 0.928 0.928 0.928 0.928 0.928 0.928
0. 1 lx O.lGG 0. 16Ci 0. 1 ii6 0.1(X 0. 10; 0. 166 0. lG(i 0.213 0.166 0.166 0.245 0.166 0.166 0.107 0.133 0.166 0.166 0.166 0.166
-0. 555 -0. 335 -0.5r5 -0. 55.5 -0.~35 -0. 53s -0. .cJ35 -0. 535 -0.5s: -0.585 -0.585 -0.585 -0.585 -0.242 -0.585 -0.535 -0.585 -0.585 -0.585 -0.585 -0.585
0. 716 4.0 0. 629 4.25 0. 546 G. 0 0.485 6.0 2.200 7.5 1.100 5.5 1.100 4.35 1.100 5.25 1.100 4.0 1.045 4.0 0.958 4.5 0.958 4. 5 0.843 3.25 0.605 3.25 0.707 5.25 0.707 3.75 0.707 2.7 0.707 2.5 0.707 3.4 0.707 3.3 0.707 3.25
4.0-4.5
5.5-5.5 3.5-5.0 I 4.75-6.0
3.0-3.5
5.0-5.5
2.5-2.9
2.75-4.0 2.5-4.5
: 0.571 0.571 0.571 0.571 0.571 0.571 0.571 0.571 0.571 0.571 0.571 0.571 0.571 0.571 0.571
I
L 23 0.166 .0658
*Windup turn slope at n = 1.0 m w

fround- Based Zonfig.
La
l/set
24 0.571 25 0.571 26 0.571 27 0.571 28 0.571 29 0.571 30 0.571 31 0.571 32 0.571 33 0.571 34 0.571 35 0.571 36 0.571 37 0.571 38 0.571 39 0.571 40 0.571 41 0.571 42 0.571 43 0.571 44 0.925 45 0.925 46 0.925 47
j 48 0.925 0.925
/I 49 0.925
TABLE C-II-Continued
LONGITUDINALCHARACTERISTICSGROUND-BASEDSIMULATOR
Ma MB l/sec2 l/set
Mmax M& Lb rad/sec2 rad/sec2/in. rad/sec/in.
-0.506 -0.585 0.240 -0.506 -0.585 0.240 -0.506 -0.585 0.245 -0.506 -0.585 0.245 -0.506 -0.585 0.245 -0.506 -0.585 0.332 -0.506 -1.173 0.166 -0.506 -1.173 0.166 -0.506 -1.173 0.245 -0.506 -1.173 0.332 -0.980 -0.585 0.166 -0.980 -0.585 0.166 -0.980 -0.585 0.245 -0.980 -0.585 0.332 -0.980 -1.173 0.166 -0.980 -1.173 0.166 -0.980 -1.173 0.245 -1.470 -1.173 0.166 -1.470 -1.173 0.166 -1.470 -1.173 0.332 0.098 -0.585 0.166 0 -0.245 0.107 0 -0.585 0.107 0 -0.585 0.166
-0.122 -0.245 0.166 -0.122 -0.585 0.166
.0316
.0273
.0273 0646
:0646 .0439 .0219 .0438 .0273 .0439 .0219 .0438 .0646 .0439 .0219 .0438 0438
:0219 .0438 .0438 .0219 .0141 .0141 .0219 .0219 .0219
-.00195 47/60 0.928 0.707 +.00165 62 0.928 0.707
0 66 0.928 0.707 +.00391 26 0.928 0.707 -.00391 29 0.928 0.707 -.00195 33 0.928 0.707 -.00195 110 1.089 0.865 -.00391 55 1.089 0.865 -.00165 112 1.089 0.865 -.00195 53 1.089 0.865 -.00195 102 1.151 0.569 -.00391 51 1.151 0.569 -.00391 43 1.151 0.569 -.00195 47 1.151 0.569 -.00195 148 1.290 0.733 -.00391 74 1.290 0.739 -.00391 96 1.290 0.739 -.00195 194 1.466 0.645 -.00391 97 1.466 0. 645 -.00195 85 1.466 0.645 -.00195 35 0.660 1.24 -.00195 25 0.520 1.195 -.00195 60 0.695 1.115 -.00195 38 0.695 1.115 -.00195 20 0.635 1.040 -.00195 43 0.805 1.000
FS*
T-
lb/g
r Short Period
0 n rad/sec 5
Pilot Ratings
Average
3.1 3.25 3.5 2.25 3.1 2;33 3.25 3.25 3.25 2.5 3.25 2.0 2.75 2.0 3.5 3.0 2.65 3.5
Range
3.0-3.25
2.0-2.5 3.0-3.25 2.0-2.5
3.0-3.5
2.0-3.25
2.5 3.5 6.5 7.1 5.75 5.0 4.5 3.5
5.5-7.5 5.75-8.5 5.0-6.5
1
3.0-4.0 /
*Windup turn slope at n = 1.0

TABLE C-II - Concluded
LONGITUDINAL CHARACTERISTICS GROUND-BASED SIRIULATOR
hIa
l/sec2
-0.245 -0.245 0.107 -0.245 -0.585 0,107 -0.24.5 -0.585 0.166 -0.506 -0.245 0.107 -0.506 -0.585 0.166 -0.506 -0:585 0.166 -0.506 -0.585 0.245 -0.980 -0.585 0.166 -0.980 -0.585 0.166
31 fj
l/set
3’6 C Lb
ratl/sec’/in. rad ‘scc,‘in.
. 0141
.0141
.0438
. 0141
.0219
. 0434 0646
:0219 .0438
-. 00195 38 0.725 -. OOl!KJ 74 0.833 -. 00391 30 0.883 -. 00195 53 0.882 -. 0019FJ 56 1.036 -. 00:191 28 1.036 -. 00301 24 1.036 -. 00193 75 1.242 -, 00391 38 1.242
FS* T 6
lb/g
Short Period Pilot Ratings I
% racl/sec 5 Avemge ( Range 1
0.920 0.930 0.930 0.762 0.799 0.799 0.799 0.668 0.668
I 1
*Windup turn slope at n = 1.0
Infli ght limulation Config
Lmax
rad/sec2
6 Weff
de
TR set
t max set
@l &2
deg deg r Pilot Rating I
Average
1 0.150 30 1.14 1.0 1.20 7.25 4.5 2 0.240 30 1.14 1.0 1.89 10.02 3.4 3 0.250 50 1.14 1.4 1.40 9.10 4.0 4 0.267 30 0.60 0.9 1.90 8.95 2.9 5 0.267 50 1.14 1.0 2.10 12.01 3.75 6 0.323 30 0.36 0.7 4.00 20.72 2.0
TABLE C-III
LATERAL CHARACTERISTICS INFLIGHT SIMULATION

-
TABLE C-IV
LATERAL CIIARACTERISTICS GROUND-BASED SIMULATION
JJlWi rad/sec2
Ground- Based config
1 .05 2 .05 3 .05 4 0.10 5 0.10 6 0.10 7 0.10 8 0.125 9 0.125
10 0.15 11 0.15 12 0.15 13 0.15 1% 0.15 14 0.15 15 0.15 1% 0.15 16 0.15 17 0.15 18 0.15 19 0.15 20 0.15 21 0.16 2lg 0.16 22 0.20 23 0.20 24 0.20
tEvaluated with turbulence
bW eff
deg
30 1.14 0.10 1.0 4.0 0.28 4.0 50 1.14 0.10 1.0 4.0 0.28 5.0 90 1.14 0.10 1.0 4.0 0.28 6.0 30 1.14 0.20 1.9 6.6 0.28 5.0 30 1.42 0.10 2.2 6.8 0.28 3.75 50 1.14 0.20 1.9 6.6 0.28 4.75 50 1.42 0.10 2.2 6.8 0.28 4.5 50 1.42 0.10 2.8 9.0 0.28 4.0 90 1.42 0.10 2.8 9.0 0.28 5.25 30 1.14 0.10 3.0 12.0 0.28 3.0 30 1.14 0.20 2.8 10.0 0.19 3.0 30 1.42 0.10 3.3 10.9 0.28 3.0 50 0.72 0.20 2.5 8.0 0.28 4.0 50 0.72 0.20 2.5 8.0 0.28 7. o* 50 1.03 0.18 3.0 9.2 0.28 4.0 50 1.14 0.20 2.8 10.0 0.28 3.7 50 1.14 0.20 2.8 10.0 0.28 7. o* 50 1.42 0.10 3.3 10.9 0.28 3.6 50 1.42 0.18 3.1 10.2 0.28 3.5 50 1.42 0.30 2.7 9.4 0.28 4.0 50 1.59 0.20 3.1 12.0 0.28 4.5 75 1.14 0.20 2.8 10.0 0.28 4.3 50 1.59 0.20 3.3 12.9 0.28 4.35 50 1.59 0.20 3.3 12.9 0.28 7.75* 50 1.03 0.18 3.9 12.3 0.28 3.4 50 1.42 0.10 4.4 14.2 0.14 3.0 50 1.42 0.10 4.4 14.2 0.21 3.1
rR set
t max set
% 42 deg deg
% lb/d:g
1: Pilot Ratings Average Range
4.5 to 5.0
2.5 to3.5
3.0 to4.0 5.5* to a. 5* 3.25 to 4.0
4.0 to4.5 2.75 to 6.0 7.0 to8.5*
1
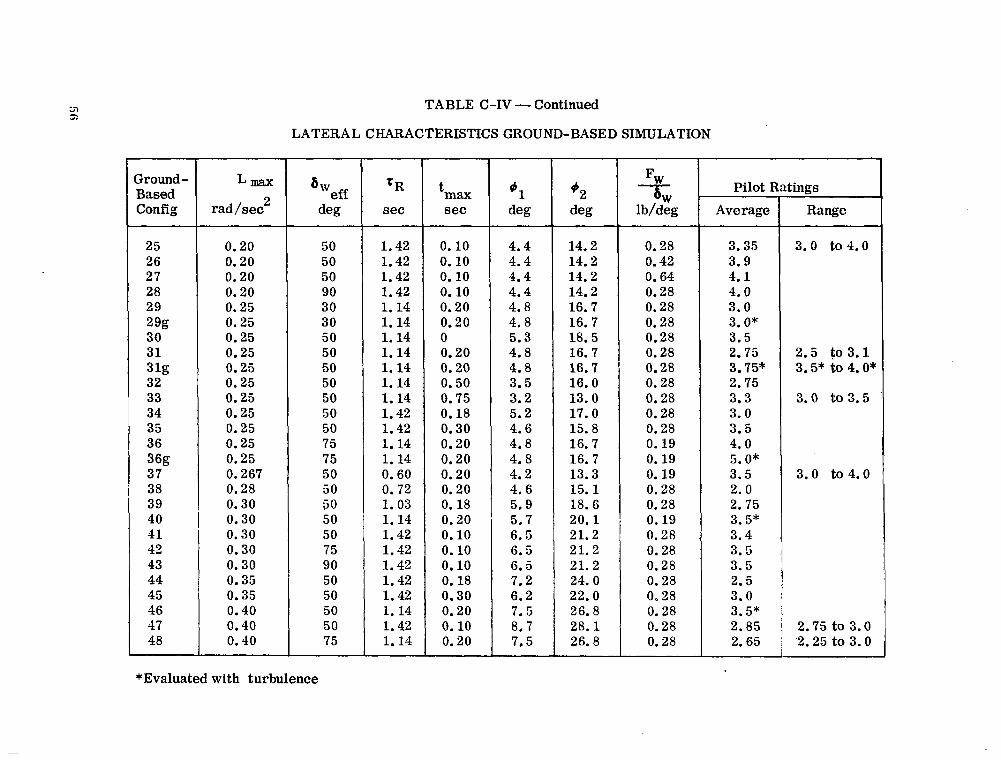
TABLE C-IV - Continued
LATERAL CHARACTERISTICS GROUND-BASED SIMULATION
Ground- Based Config
25 26 27 28 29 2% 30 31 3lg 32 33 34 35 36 36g 37 38 39 40 41 42 43 44 45 46 47 48
LEELX
rad/sec2
0.20 0.20 0.20 0.20 0.25 0.25 0.25 0.25 0.25 0.25 0.25 0.25 0.25 0.25 0.25 0.267 0.28 0.30 0.30 0.30 0.30 0.30 0.35 0.35 0.40 0.40 0.40
b “eff I deg
50 50 50 90 30 30 50 50 50 50 50 50 50 75 75 50 50 50 50 50 75 90 50 50 50 50 75
1.42 1.42 1.14 1.14 1.14 1.14 1.14 1.14 1.14 1.42 1.42 1.14 1.14 0.60 0.72 1.03 1.14 1.42 1.42 1.42 1.42 1.42 1.14 1.42 1.14
t max set
0.10 4.4 14.2 0.10 4.4 14.2 0.10 4.4 14.2 0.10 4.4 14.2 0.20 4.8 16.7 0.20 4.8 16.7 0 5.3 18.5 0.20 4.8 16.7 0.20 4.8 16.7 0.50 3.5 16.0 0.75 3.2 13.0 0.18 5.2 17.0 0.30 4.6 15.8 0.20 4.8 16. 7 0.20 4.8 16.7 0.20 4.2 13.3 0.20 4.6 15.1 0.18 5.9 18.6 0.20 5.7 20.1 0.10 6.5 21.2 0.10 6.5 21.2 0.10 6.5 21.2 0.18 7.2 24.0 0.30 6.2 22.0 0.20 7.5 26.8 0.10 8.7 28.1 0.20 7.5 26.8
91 ++2 deg deg
Fw b, lb/deg
0.28 0.42 0.64 0.28 0.28 0.28 6.28 0.28 0.28 0.28 0.28 0.28 0.28 0.19 0.19 0.19 0.28 0.28
I I
0.19 0.28 0.28 0.28 0.28 0.28 0.28 0.28 0.28
Pilot I Average Range
3.35 3.9 4.1 4.0 3.0 3. o* 3.5 2.75 3.75* 2.75 3.3 3.0 3.5 4.0 5. o* 3.5 2.0 2.75 3.5* 3.4 3.5 3.5 2.5 3.0 3.5* 2.85 2.65
atings
3.0 to4.0
2.5 to3.1 3.5* to 4.0*
3.0 to3.5
3.0 to4.0
2.75 to 3.0 2.25 to 3.0
*Evaluated with turbulence
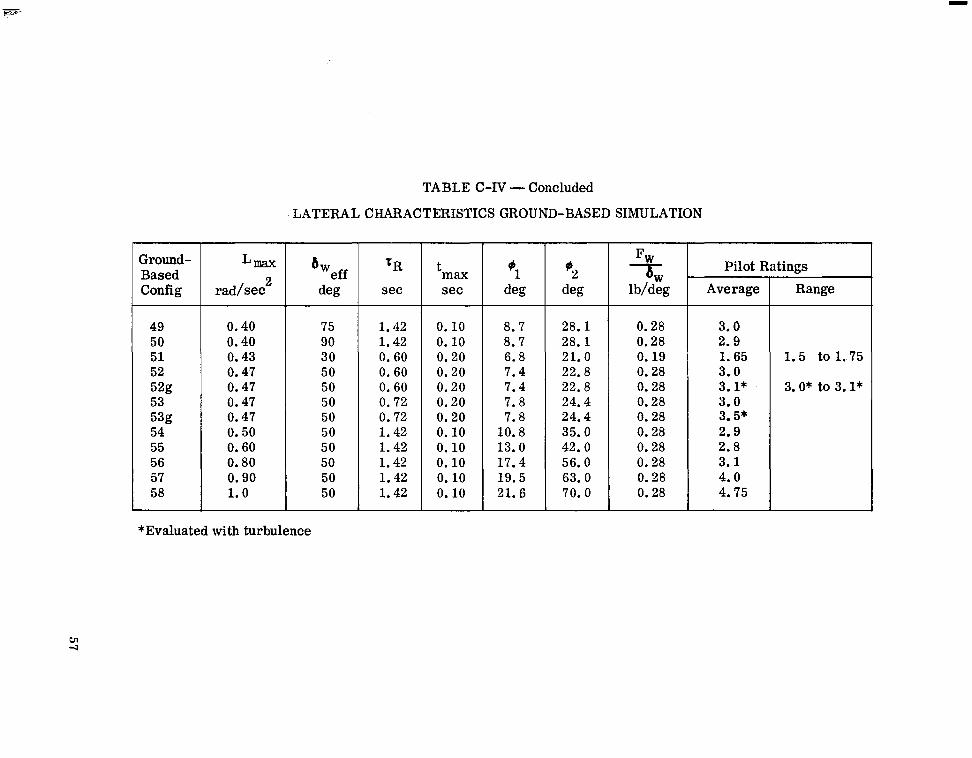
TABLE C-IV - Concluded
LATERAL CHARACTERISTICS GROUND-BASED SIMULATION
Ground- Based Config
LWC
rad/sec2 ‘“eff de
TR set
t max set
FW
8, 1 b/deg
49 0.40 75 1.42 0.10 8.7 28.1 0.28 3.0 50 0.40 90 1.42 0.10 8.7 28.1 0.28 2.9 51 0.43 30 0. 60 0.20 6.8 21.0 0.19 1.65 52 0.47 50 0. 60 0.20 7.4 22.8 0.28 3.0 52g 0.47 50 0. 60 0.20 7.4 22.8 0.28 3.1* 53 0.47 50 0. 72 0.20 7.8 24.4 0.28 3.0 5% 0.47 50 0.72 0.20 7.8 24.4 0.28 3.5* 54 0.50 50 1.42 0.10 10.8 35.0 0.28 2.9 55 0.60 50 1.42 0.10 13.0 42.0 0.28 2.8 56 0.80 50 1.42 0.10 17.4 56.0 0.28 3.1 57 0.90 50 1.42 0.10 19.5 63.0 0.28 4.0 58 1.0 50 1.42 0.10 21.6 70. 0 0.28 4.75
*Evaluated with turbulence
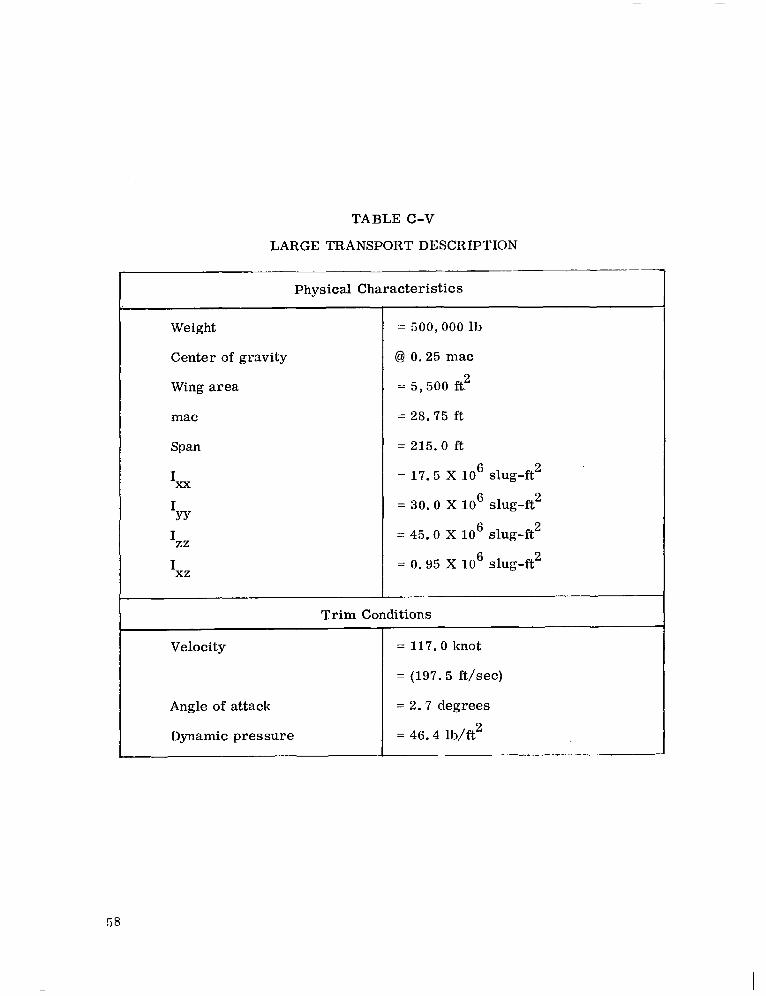
Weight
Center of gravity
Wing area
mat
Span
1xx I YY
I zz I xz
TABLE C-V
LARGE TRANSPORT DESCRIPTION --~ ___
Physical Characteristics
= 500,000 113
@ 0.25 mat
= 5,500 ft?
= 28.75 ft
= 215.0 ft
= 17.5 x lo6 slug-ft2
= 30.0 x lo6 slug-ft2
= 45.0 x lo6 slug-ft2
= 0.95 x lo6 slug-ft2
Trim Conditions
Velocity
Angle of attack
Dynamic pressure
= 117.0 knot
= (197.5 ft/sec)
= 2.7 degrees
= 46.4 lb/ft2
58

TABLE C-VI
SIMULATED LARGE TRANSPORT DYNAMIC CHARACTERISTICS (BASE CONFIGURATION)
Short period
Phugoid
Dutch roll
Spiral
Rolling mode
0 n = 0.93 rad/sec
c= 0.71
“n = 0.18 rad/sec c= 0.14
% = 0.50 rad/sec c= 0.33
q/3= 1.3
t l/2 =20 set
TR = 1.1 set
59
II
DRAG:
LIFT:
PITCH:
ROLL: Wwit. )
TABLE C-VII
LARGE TRANSPORT DESCRIPTION
(BASIC AERODYNAMIC COEFFICIENTS)
CD = 0.45 0
‘D, = 1.07 /rad
CL0 = 1.94
cLB = 0.804 sec/rad
CL& = -0.396 sec/rad
CIA= = 6.8 /rad
‘Lb, = ios4 /rad
c = -0.555 sec/rad rn. a cm = -0.0545 /rad
iH
c = -2.07 ma /rad
c = -2.3
mse
/rad
c = -2.4 sec/rad m* e
Cl = B
-0.40 /rad
Cl * VI
Cl 6,
= 0.30
= 0.00229
set/ rad
/rad
Cl. = -0.24 sec/rad +
Cl = 8
0.10 /rad
W
YAW: (unaugmented)
SIDE FORCE: (unaugmented)
AUGMENTATION GAINS:
c = “0
0.18 /rad
cnb= -0.158 sec/rac
‘n+ = -0.267 sec/rai
c =
x3 0.021 /rad
c = -0.120 /rad
nhr
zyB-
-0.83 /rad
Y+ = 0.57 sec/rad
c = Y$
0.03 sec/rad
z =
yaa -0.081 /rad
0.246 /rad
b/b = -0.30 set
b/+= -2.07 set
6r/a = 0.178
a
aa/+ = -1.0 set
ha/p = 1.83
GO

1. W. M. Eldridge, and H. L. Inflight Dynamic: Simulator, Mechanics Panel, May 1966.
2. D.‘ H. Perry, W. G. A. Port, and J. C. Morrell, A Flight Study of the, Side- step Maneuver During Landing, R &. M No. 3347, British A. R. C. , 1964.
3. Seth B. Anderson, Hervey C. Quigley, and Robert C. Innis, Stability and ’ ’ Control Considerations for STOL Aircraft, (Preprint) No. 65-175, American Institute of Aeronautics and Astronautics, October, 1965.
4. George E. Cooper, “Understanding and Interpreting Pilot Opinion, ” Aeronautical Engineering Review, Vol. 16, No. 3, March 1957, pp 47-51 and 56.
5. G. A. Patterson and LCDR W. Spangenberg, The Provision of Adequate Lateral Control Power for Landing Approach Conditions, AGARD Report Number 419, January, 1963.
6. W. J. Kehrer: Longitudinal Stability and Control of Large Supersonic Aircraft at Low Speeds, (Preprint) No. 64-586, International Council of the Aeronautical Sciences, August, 1964.
7. L. B. Gratzer and T. J. O’Donnell, “Development of A BLC High-Lift System for High-Speed Airplanes,” Journal of Aircraft, Vol. 2, No. 6, November-December 1965, pp 477-484.
REFERENCES
Crane, Use of A Large Jet Transport as an (Preprint) 28th Meeting of the AGARD Flight
NASA-Langley, 1966 CR-635
I$
61