inflation monitor, july 2011 - sbp.org.pk · ii issn 1992-8327 (print) issn 1992-8335 (online) the...
TRANSCRIPT

Inflation Monitor
December 2013
State Bank of Pakistan
Statistics & DWH Department

ii
ISSN 1992-8327 (print)
ISSN 1992-8335 (online)
The analysis in this document is based on data
Provided by Pakistan Bureau of Statistics (PBS), for domestic inflation
analysis
Retrieved from IMF & World Bank websites for global inflation analysis
http://www.sbp.org.pk/publications/inflation_Monitor

Contents Page
1. Inflation in Brief ………………………………………………… 1
2. City- wise Inflation …………………………………….................... 7
3. Income Group- wise Inflation …………………………………………………. 8
4. Weighted Contribution ………………………………………………… 10
5. Inflation Diffusion Index ………………………………………………… 11
6. Domestic Commodity Prices ………………………………………………… 12
7. Global Commodity Prices ………………………………………………… 12
8. Seasonal Adjustment in CPI ………………………………………………... 13
Annexure A
Table A1 CPI Inflation by Groups 17
Table A2 Distribution of Price Changes (YoY) of CPI Basket 17
Table A3 Top and Bottom 15 Contributors to CPI Inflation (YoY) 18
Table A3.1 Top and Bottom 15 Contributors to CPI Inflation (MoM) 19
Table A3.2 Top Fifteen Contributors to CPI Inflation (YoY) 20
Table A3.3 Top Ten Contributors to CPI Food Inflation (YoY) 21
Table A3.4 Top Ten Contributors to CPI Non-Food Inflation (YoY) 22
Table A4 Distribution of Price Changes (YoY) - Selected CPI Items 23
Table A5 City-wise CPI Inflation by Income Groups 24
Table A6 City- wise CPI Inflation (YoY) 25
Table A7 Income Group-wise Inflation 26
Table A8 SPI Item-wise Price Movements 27
Table A9 Distribution of Price Changes (YoY)-WPI Items 28
Table A10 Consumer Price Index Numbers by Major Groups and Selected
Commodities 29-30
Table A11 Wholesale Price Index Numbers by Major Groups and Selected Commodities 31-32
Table A12 Price Indices 33
Table A13 International Commodity Prices/ Indices 34
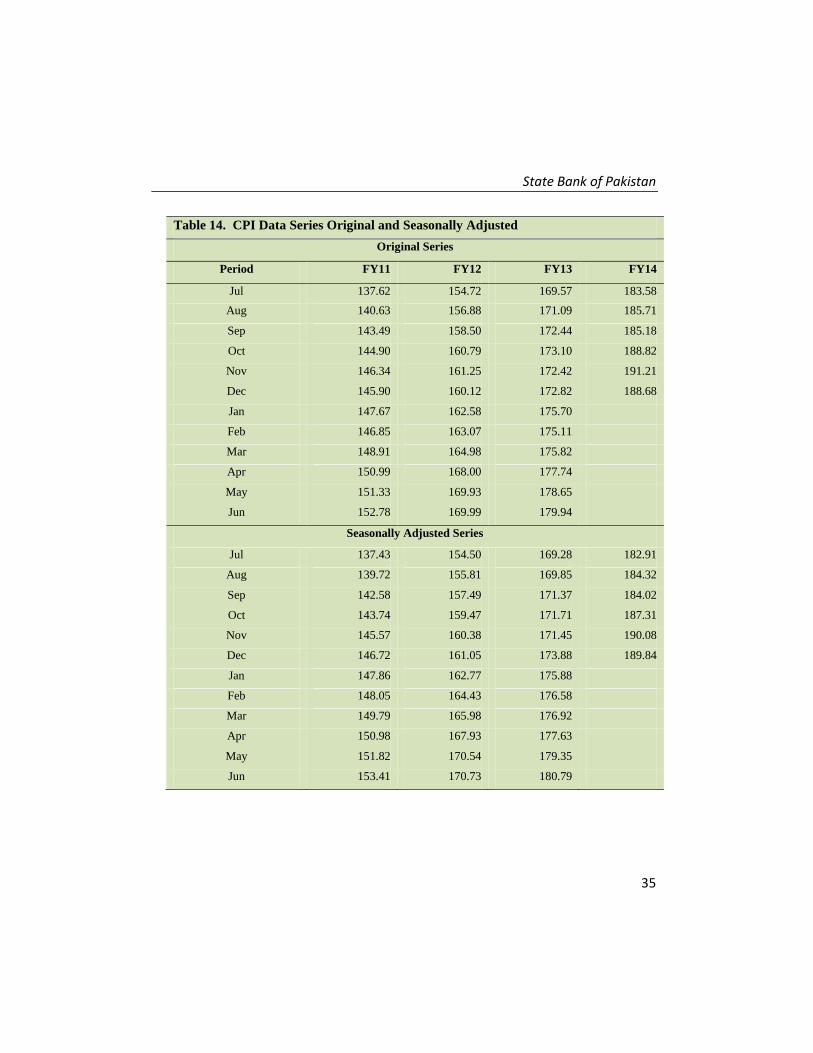
Table A14 CPI Data Series- Original and Seasonally Adjusted 35
Table A15 CPI Food Data Series- Original and Seasonally Adjusted 36
Table A16 CPI Monthly & Average Seasonal Factors 37
Table A17 CPI Food Monthly & Average Seasonal Factors 37
Table A18 CPI Month-on-Month % Change- Original & Seasonally Adjusted 38
Table A19 CPI Food Month-on-Month % Change- Original & Seasonally Adjusted 39
Figure A1 CPI Non-food Inflation 40
Figure A2 Frequency Distribution of Price Changes of CPI Items 41
Figure A3 Frequency Distribution of Price Changes of WPI Commodities 42
Figure A4 Group- wise/ overall Inflation Diffusion Index and Respective/ Overall YoY
Inflation 43
Annexure B Technical Notes 44-47

Inflation Monitor, December 2013
iv
Team Leader
Behzad Ali Ahmad Sr. Joint Director
Team Members
Muhammad Ashfaq Assistant Director
Syed Salman Bukhari Assistant Director

State Bank of Pakistan
1
Review
Inflation in Brief
1. Headline CPI inflation (2007-08=100) is recorded at 9.2 percent on year-on-
year basis in December 2013 as compared to 10.9 percent in the previous
month and 7.9 percent in the corresponding month of last year.
2. CPI inflation on month-on-month basis is recorded at -1.3 percent in
December 2013 as compared to 1.3 percent in the previous and 0.2 percent
during the corresponding month of last year. Seasonally adjusted month-on-
month CPI inflation is recorded at -0.1 percent in December 2013 compared
to 1.5 percent in the previous month.
3. Core inflation (trimmed) on year-on-year basis decreased to 8.7 percent in
December 2013 compared to 9.2 percent in the previous and corresponding
month of last year.
4. On month-on-month basis, the Core inflation (trimmed) remained at the level
of 0.4 percent in December 2013 and in previous month while it was 0.3
percent in the corresponding month of last year.
5. Non-food, non-energy inflation measured by CPI Core (NFNE) on year-on-
year basis decreased to 8.2 percent in December 2013 compared to 8.5
percent in the previous month. It was 9.8 percent in the corresponding month
of last year.
6. Core NFNE inflation on month-on-month basis decreased to 0.2 percent in
December 2013 as compared to 0.4 percent in the previous month. A 0.5
percent increase in Core NFNE index was observed in December 2012.
7. WPI inflation on year-on-year basis decreased to 8.9 percent in December
2013 when compared to 10.4 percent a month earlier. During December
2012, WPI inflation was recorded at 9.6%.
Inflation Monitor, December 2013
2
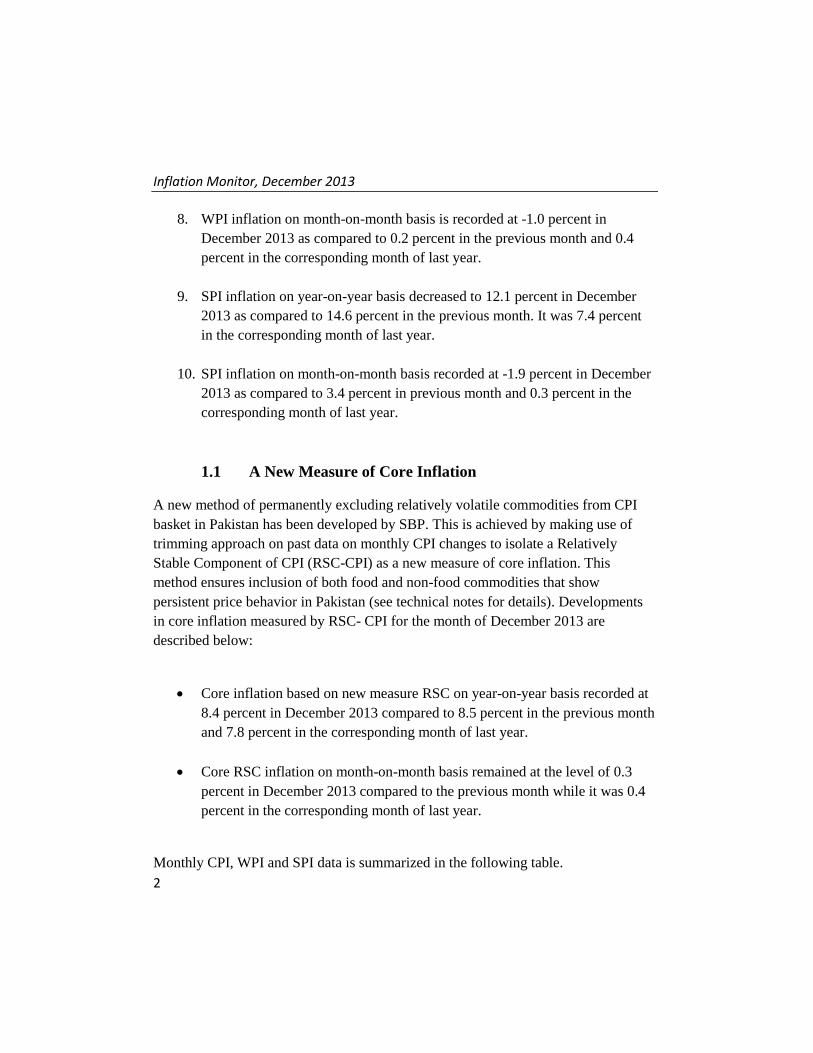
8. WPI inflation on month-on-month basis is recorded at -1.0 percent in
December 2013 as compared to 0.2 percent in the previous month and 0.4
percent in the corresponding month of last year.
9. SPI inflation on year-on-year basis decreased to 12.1 percent in December
2013 as compared to 14.6 percent in the previous month. It was 7.4 percent
in the corresponding month of last year.
10. SPI inflation on month-on-month basis recorded at -1.9 percent in December
2013 as compared to 3.4 percent in previous month and 0.3 percent in the
corresponding month of last year.
1.1 A New Measure of Core Inflation
A new method of permanently excluding relatively volatile commodities from CPI
basket in Pakistan has been developed by SBP. This is achieved by making use of
trimming approach on past data on monthly CPI changes to isolate a Relatively
Stable Component of CPI (RSC-CPI) as a new measure of core inflation. This
method ensures inclusion of both food and non-food commodities that show
persistent price behavior in Pakistan (see technical notes for details). Developments
in core inflation measured by RSC- CPI for the month of December 2013 are
described below:
Core inflation based on new measure RSC on year-on-year basis recorded at
8.4 percent in December 2013 compared to 8.5 percent in the previous month
and 7.8 percent in the corresponding month of last year.
Core RSC inflation on month-on-month basis remained at the level of 0.3
percent in December 2013 compared to the previous month while it was 0.4
percent in the corresponding month of last year.
Monthly CPI, WPI and SPI data is summarized in the following table.
State Bank of Pakistan
3
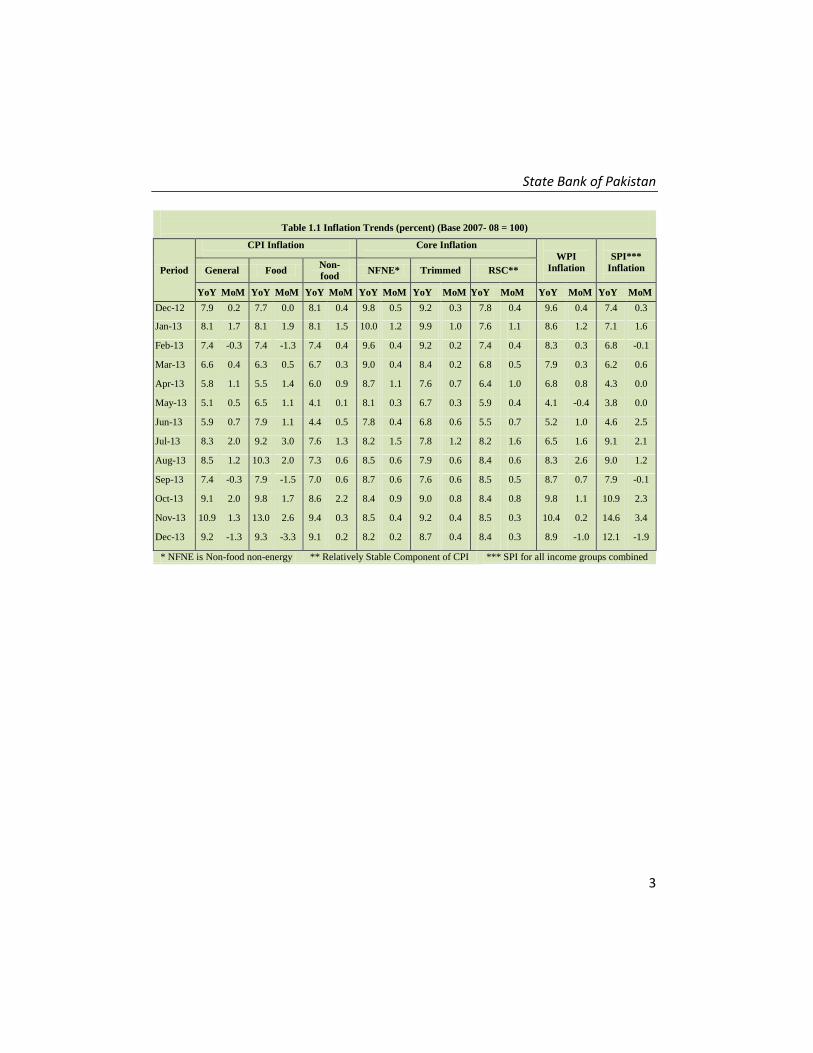
Table 1.1 Inflation Trends (percent) (Base 2007- 08 = 100)
Period
CPI Inflation
Core Inflation
WPI
Inflation
SPI***
Inflation
General Food
Non-
food NFNE* Trimmed RSC**
YoY MoM YoY MoM YoY MoM YoY MoM YoY MoM YoY MoM YoY MoM YoY MoM
Dec-12 7.9 0.2 7.7 0.0 8.1 0.4 9.8 0.5 9.2 0.3 7.8 0.4 9.6 0.4 7.4 0.3
Jan-13 8.1 1.7 8.1 1.9 8.1 1.5 10.0 1.2 9.9 1.0 7.6 1.1 8.6 1.2 7.1 1.6
Feb-13 7.4 -0.3 7.4 -1.3 7.4 0.4 9.6 0.4 9.2 0.2 7.4 0.4 8.3 0.3 6.8 -0.1
Mar-13 6.6 0.4 6.3 0.5 6.7 0.3 9.0 0.4 8.4 0.2 6.8 0.5 7.9 0.3 6.2 0.6
Apr-13 5.8 1.1 5.5 1.4 6.0 0.9 8.7 1.1 7.6 0.7 6.4 1.0 6.8 0.8 4.3 0.0
May-13 5.1 0.5 6.5 1.1 4.1 0.1 8.1 0.3 6.7 0.3 5.9 0.4 4.1 -0.4 3.8 0.0
Jun-13 5.9 0.7 7.9 1.1 4.4 0.5 7.8 0.4 6.8 0.6 5.5 0.7 5.2 1.0 4.6 2.5
Jul-13 8.3 2.0 9.2 3.0 7.6 1.3 8.2 1.5 7.8 1.2 8.2 1.6 6.5 1.6 9.1 2.1
Aug-13 8.5 1.2 10.3 2.0 7.3 0.6 8.5 0.6 7.9 0.6 8.4 0.6 8.3 2.6 9.0 1.2
Sep-13 7.4 -0.3 7.9 -1.5 7.0 0.6 8.7 0.6 7.6 0.6 8.5 0.5 8.7 0.7 7.9 -0.1
Oct-13 9.1 2.0 9.8 1.7 8.6 2.2 8.4 0.9 9.0 0.8 8.4 0.8 9.8 1.1 10.9 2.3
Nov-13 10.9 1.3 13.0 2.6 9.4 0.3 8.5 0.4 9.2 0.4 8.5 0.3 10.4 0.2 14.6 3.4
Dec-13 9.2 -1.3 9.3 -3.3 9.1 0.2 8.2 0.2 8.7 0.4 8.4 0.3 8.9 -1.0 12.1 -1.9
* NFNE is Non-food non-energy ** Relatively Stable Component of CPI *** SPI for all income groups combined

Inflation Monitor, December 2013
4
Fig 1.1: Summary of Price Inflation
-4
-3
-2
-1
0
1
2
3
4
5
7
9
11
13
15
De
c-1
2
Jan
-13
Feb
-13
Mar
-13
Ap
r-1
3
May
-13
Jun
-13
Jul-
13
Au
g-1
3
Sep
-13
Oct
-13
No
v-1
3
De
c-1
3
a: CPI
-4
-3
-2
-1
0
1
2
3
4
0
4
8
12
16
20
De
c-1
2
Jan
-13
Feb
-13
Mar
-13
Ap
r-1
3
May
-13
Jun
-13
Jul-
13
Au
g-1
3
Sep
-13
Oct
-13
No
v-1
3
De
c-1
3
e: WPI
-4
-3
-2
-1
0
1
2
3
4
0
4
8
12
16
20
De
c-1
2
Jan
-13
Feb
-13
Mar
-13
Ap
r-1
3
May
-13
Jun
-13
Jul-
13
Au
g-1
3
Sep
-13
Oct
-13
No
v-1
3
De
c-1
3
f: SPI
-4
-3
-2
-1
0
1
2
3
4
5
7
9
11
13
15
De
c-1
2
Jan
-13
Feb
-13
Mar
-13
Ap
r-1
3
May
-13
Jun
-13
Jul-
13
Au
g-1
3
Sep
-13
Oct
-13
No
v-1
3
De
c-1
3
b: CPI Food YoY MoM (RHS)
-4
-3
-2
-1
0
1
2
3
4
5
7
9
11
13
15
De
c-1
2
Jan
-13
Feb
-13
Mar
-13
Ap
r-1
3
May
-13
Jun
-13
Jul-
13
Au
g-1
3
Sep
-13
Oct
-13
No
v-1
3
De
c-1
3
c: NFNE
-4
-3
-2
-1
0
1
2
3
4
5
7
9
11
13
15
De
c-1
2
Jan
-13
Feb
-13
Mar
-13
Ap
r-1
3
May
-13
Jun
-13
Jul-
13
Au
g-1
3
Sep
-13
Oct
-13
No
v-1
3
De
c-1
3
d: 20% Trimmed Mean

State Bank of Pakistan
5
Fig 1.2:Movements in Price Indices (percent)
5
7
9
11
13
15
De
c-1
1
Jan
-12
Feb
-12
Mar
-12
Ap
r-1
2
May
-12
Jun
-12
Jul-
12
Au
g-1
2
Sep
-12
Oct
-12
No
v-1
2
De
c-1
2
Jan
-13
Feb
-13
Mar
-13
Ap
r-1
3
May
-13
Jun
-13
Jul-
13
Au
g-1
3
Sep
-13
Oct
-13
No
v-1
3
De
c-1
3
a: CPIYoY 12mma
0
4
8
12
16
20
24
De
c-1
1
Feb
-12
Ap
r-1
2
Jun
-12
Au
g-1
2
Oct
-12
De
c-1
2
Feb
-13
Ap
r-1
3
Jun
-13
Au
g-1
3
Oct
-13
De
c-1
3
d: WPI
0
4
8
12
16
20
24
De
c-1
1
Feb
-12
Ap
r-1
2
Jun
-12
Au
g-1
2
Oct
-12
De
c-1
2
Feb
-13
Ap
r-1
3
Jun
-13
Au
g-1
3
Oct
-13
De
c-1
3
e: SPI
5
7
9
11
13
15
b: NFNE
5
7
9
11
13
15
c: 20% Trimmed Mean

Inflation Monitor, December 2013
6
Fig 1.3:Movements in Price Indices -MoM ( percent)
-4
-2
0
2
4
De
c-1
0
Feb
-11
Ap
r-1
1
Jun
-11
Au
g-1
1
Oct
-11
De
c-1
1
Feb
-12
Ap
r-1
2
Jun
-12
Au
g-1
2
Oct
-12
De
c-1
2
Feb
-13
Ap
r-1
3
Jun
-13
Au
g-1
3
Oct
-13
De
c-1
3
a: CPI
-4
-2
0
2
4
b: NFNE
-4
-2
0
2
4
c: 20% Trimmed Mean
-4
-2
0
2
4
De
c-1
0
Mar
-11
Jun
-11
Sep
-11
De
c-1
1
Mar
-12
Jun
-12
Sep
-12
De
c-1
2
Mar
-13
Jun
-13
Sep
-13
De
c-1
3
d: WPI
-4
-2
0
2
4
De
c-1
0
Mar
-11
Jun
-11
Sep
-11
De
c-1
1
Mar
-12
Jun
-12
Sep
-12
De
c-1
2
Mar
-13
Jun
-13
Sep
-13
De
c-1
3
e: SPI
State Bank of Pakistan
7
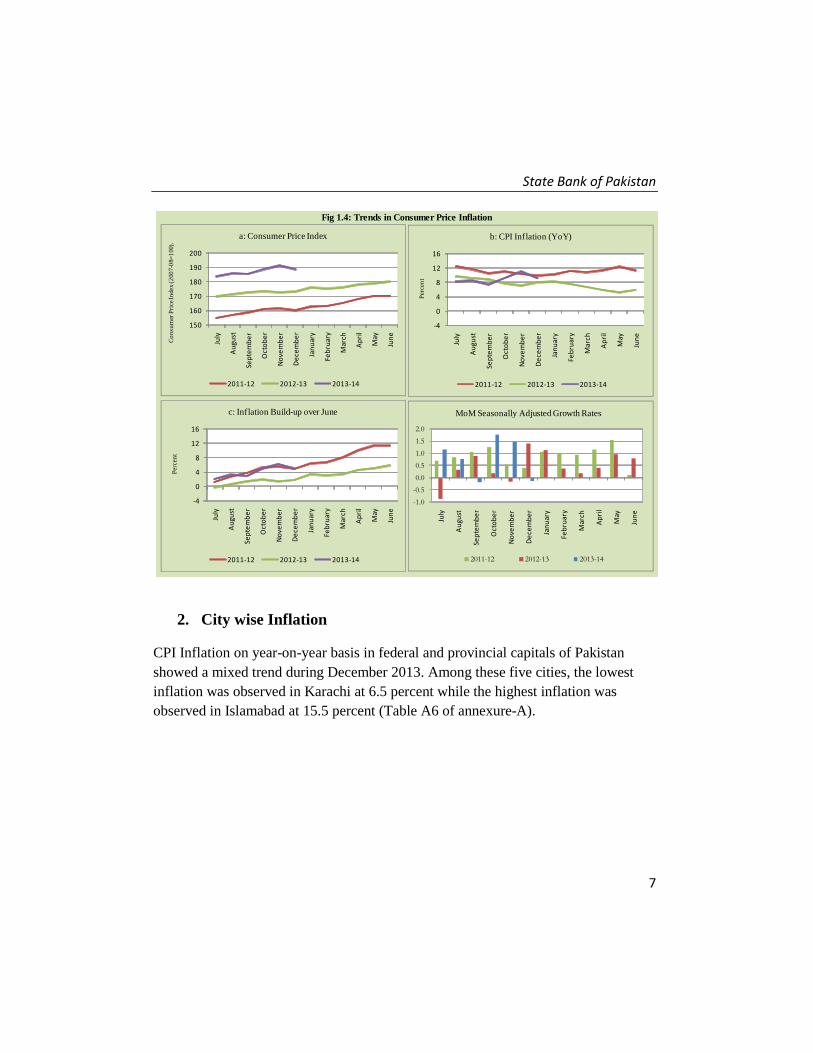
2. City wise Inflation
CPI Inflation on year-on-year basis in federal and provincial capitals of Pakistan
showed a mixed trend during December 2013. Among these five cities, the lowest
inflation was observed in Karachi at 6.5 percent while the highest inflation was
observed in Islamabad at 15.5 percent (Table A6 of annexure-A).
Fig 1.4: Trends in Consumer Price Inflation
150
160
170
180
190
200
July
Au
gust
Sep
tem
be
r
Oct
ob
er
No
vem
be
r
De
cem
be
r
Jan
uar
y
Feb
ruar
y
Mar
ch
Ap
ril
May
Jun
e
Co
nsu
mer
Pri
ce I
ndex
(2
00
7-0
8=
100).
a: Consumer Price Index
2011-12 2012-13 2013-14
-4
0
4
8
12
16
July
Au
gust
Sep
tem
be
r
Oct
ob
er
No
vem
be
r
De
cem
be
r
Jan
uar
y
Feb
ruar
y
Mar
ch
Ap
ril
May
Jun
e
Per
cen
t
b: CPI Inflation (YoY)
2011-12 2012-13 2013-14
-4
0
4
8
12
16
July
Au
gust
Sep
tem
be
r
Oct
ob
er
No
vem
be
r
De
cem
be
r
Jan
uar
y
Feb
ruar
y
Mar
ch
Ap
ril
May
Jun
e
Per
cen
t
c: Inflation Build-up over June
2011-12 2012-13 2013-14
-1.0
-0.5
0.0
0.5
1.0
1.5
2.0
July
Au
gust
Sep
tem
be
r
Oct
ob
er
No
vem
be
r
De
cem
be
r
Jan
uar
y
Feb
ruar
y
Mar
ch
Ap
ril
May
Jun
e
MoM Seasonally Adjusted Growth Rates
2011-12 2012-13 2013-14
Inflation Monitor, December 2013
8
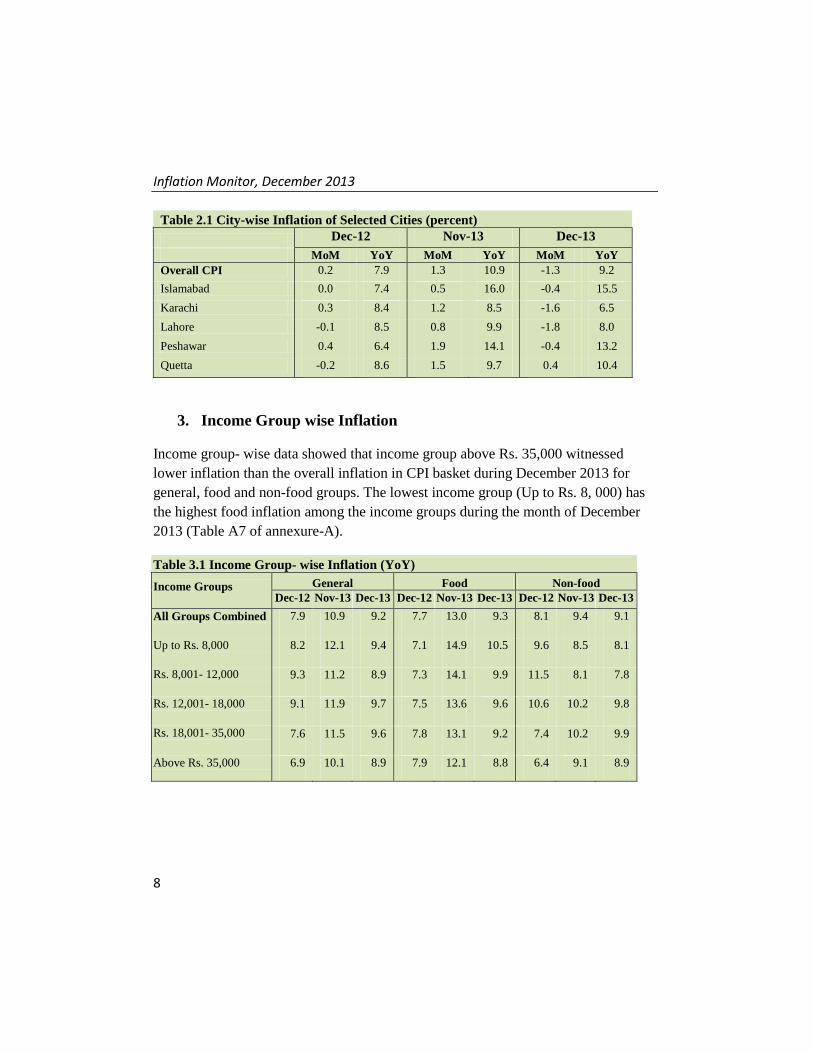
Table 2.1 City-wise Inflation of Selected Cities (percent)
Dec-12 Nov-13 Dec-13
MoM YoY MoM YoY MoM YoY
Overall CPI 0.2 7.9 1.3 10.9 -1.3 9.2
Islamabad 0.0 7.4 0.5 16.0 -0.4 15.5
Karachi 0.3 8.4 1.2 8.5 -1.6 6.5
Lahore -0.1 8.5 0.8 9.9 -1.8 8.0
Peshawar 0.4 6.4 1.9 14.1 -0.4 13.2
Quetta -0.2 8.6 1.5 9.7 0.4 10.4
3. Income Group wise Inflation
Income group- wise data showed that income group above Rs. 35,000 witnessed
lower inflation than the overall inflation in CPI basket during December 2013 for
general, food and non-food groups. The lowest income group (Up to Rs. 8, 000) has
the highest food inflation among the income groups during the month of December
2013 (Table A7 of annexure-A).
Table 3.1 Income Group- wise Inflation (YoY)
Income Groups
General Food Non-food
Dec-12 Nov-13 Dec-13 Dec-12 Nov-13 Dec-13 Dec-12 Nov-13 Dec-13
All Groups Combined 7.9 10.9 9.2 7.7 13.0 9.3 8.1 9.4 9.1
Up to Rs. 8,000 8.2 12.1 9.4 7.1 14.9 10.5 9.6 8.5 8.1
Rs. 8,001- 12,000 9.3 11.2 8.9 7.3 14.1 9.9 11.5 8.1 7.8
Rs. 12,001- 18,000 9.1 11.9 9.7 7.5 13.6 9.6 10.6 10.2 9.8
Rs. 18,001- 35,000 7.6 11.5 9.6 7.8 13.1 9.2 7.4 10.2 9.9
Above Rs. 35,000 6.9 10.1 8.9 7.9 12.1 8.8 6.4 9.1 8.9

State Bank of Pakistan
9
Fig 3.1: Income Group- wise Inflation
0
5
10
15
De
c-1
2
Jan
-13
Feb
-13
Mar
-13
Ap
r-1
3
May
-13
Jun
-13
Jul-
13
Au
g-1
3
Sep
-13
Oct
-13
No
v-1
3
De
c-1
3
a: CPI Overall Inflation (YoY)
All Groups combined Upto Rs. 8,000 Above Rs. 35,000
0
5
10
15
De
c-1
2
Jan
-13
Feb
-13
Mar
-13
Ap
r-1
3
May
-13
Jun
-13
Jul-
13
Au
g-1
3
Sep
-13
Oct
-13
No
v-1
3
De
c-1
3
b: CPI Food Inflation (YoY)
0
5
10
15
De
c-1
2
Jan
-13
Feb
-13
Mar
-13
Ap
r-1
3
May
-13
Jun
-13
Jul-
13
Au
g-1
3
Sep
-13
Oct
-13
No
v-1
3
De
c-1
3
c: CPI Non-Food Inflation (YoY)

Inflation Monitor, December 2013
10
4. Weighted Contribution
The weighted contribution of food group in the overall inflation decreased to 42.35
percent during December 2013 from 50.12 percent in November 2013. It was 40.58
percent in December 2012.
The weighted contribution of non-food group showed increase to touch 57.65 percent
in December 2013 from 49.88 percent in November 2013.
Table 4.1 Weighted Contribution to CPI Inflation (YoY)
Period Food
Clothing &
Footwear
Housing, Water,
Elect, Gas &
Other Fuel Transport Education Others
Dec-12 40.58 14.29 13.76 8.43 4.39 18.56
Jan-13 41.94 13.53 11.88 10.07 4.20 18.38
Feb-13 41.59 15.24 12.70 8.00 3.93 18.53
Mar-13 40.11 14.02 14.27 7.14 4.58 19.89
Apr-13 39.66 15.99 16.52 1.30 4.17 22.36
May-13 52.66 17.82 4.28 -0.34 4.91 20.67
Jun-13 55.58 17.03 3.84 3.09 4.46 15.99
Jul-13 46.72 13.37 20.20 5.27 3.25 11.19
Aug-13 50.74 13.02 19.40 1.98 3.35 11.51
Sep-13 44.97 14.90 22.53 0.16 3.91 13.52
Oct-13 45.18 11.62 26.61 2.68 3.37 10.55
Nov-13 50.12 9.70 22.42 6.24 2.76 8.76
Dec-13 42.35 10.02 26.60 7.26 3.33 10.44

State Bank of Pakistan
11
5. Inflation Diffusion Index
Table 5.1 Inflation Diffusion Index - based on MoM change
Dec-12 Jan-13 Feb-13 Mar-13 Apr-13 May-13 Jun-13 Jul-13 Aug-13 Sep-13 Oct-13 Nov-13 Dec-13
General 49.6 51.4 37.9 39.1 40.9 44.5 48.4 58.0 53.5 51.4 53.9 49.7 50.0
Food & Non-Alcoholic Beverages
33.0 49.6 15.2 22.5 23.9 34.6 50.4 53.5 39.8 36.3 57.4 49.6 41.1
Alcoholic Beverages &
Tobacco
83.3 33.3 0.0 0.0 0.0 33.3 100.0 100.0 16.7 66.7 50.0 -33.3 66.7
Clothing & Footwear 89.8 72.9 84.7 59.3 67.8 67.8 55.9 76.3 76.3 83.1 78.0 83.1 76.3
Housing, Water, Elect, Gas & other Fuels
38.9 66.7 22.2 33.3 58.3 16.7 50.0 66.7 41.7 33.3 61.1 44.4 25.0
Furnishing & Household Equip. Maintenance etc
76.8 63.8 53.6 68.1 69.6 78.3 76.8 78.3 85.5 78.3 82.6 85.5 89.9
Health 23.1 30.8 17.9 15.4 23.1 20.5 10.3 17.9 28.2 10.3 17.9 15.4 20.5
Transport 37.2 44.2 46.5 27.9 14.0 27.9 32.6 53.5 39.5 53.5 48.8 30.2 34.9
Communication 50.0 66.7 16.7 8.3 16.7 33.3 16.7 58.3 33.3 16.7 16.7 25.0 16.7
Recreation & Culture 20.5 28.2 25.6 25.6 35.9 30.8 28.2 33.3 41.0 33.3 23.1 20.5 33.3
Education 25.0 6.3 25.0 75.0 25.0 43.8 43.8 50.0 68.8 56.3 25.0 0.0 37.5
Restaurant & Hotels 100.0 83.3 100.0 66.7 50.0 83.3 66.7 100.0 100.0 100.0 83.3 83.3 100.0
Miscellaneous 65.7 51.4 51.4 57.1 54.3 60.0 57.1 60.0 65.7 74.3 40.0 62.9 57.1
NFNE 55.3 52.7 45.9 45.6 49.1 49.4 47.9 58.6 58.6 55.9 51.8 52.4 53.3
See annexure B (Technical Notes) for the definition of Inflation Diffusion Index.

Inflation Monitor, December 2013
12
6. Domestic Commodity Prices
Table 6.1 Inflation in Domestic CPI Food Commodities
Sr.
No
Item Unit
Dec-12 Nov-13 Dec-13
YoY MoM YoY MoM YoY MoM
1 Wheat 10 Kg 10.31 2.78 27.35 3.82 30.87 5.62
2 Wheat Flour Bag 10 Kg 10.34 0.87 25.32 2.46 26.27 1.64
3 Rice Basmati Sup. Qlty. Kg 21.61 1.36 16.87 0.83 16.04 0.65
4 Pulse Masoor (Washed) Kg -5.74 -0.52 13.37 1.37 18.34 3.85
5 Pulse Moong (Washed) Kg -12.36 0.15 10.56 2.30 17.07 6.05
6 Pulse Mash (Washed) Kg -9.73 -0.40 -2.25 0.80 -0.62 1.27
7 Pulse Gram Kg 44.45 -0.89 -30.41 -0.85 -29.24 0.78
8 Vegetable Ghee (Loose) Kg 0.80 -0.19 -1.28 1.35 -0.17 0.93
9 Sugar Refined Kg -2.74 -1.30 10.38 7.42 1.69 -9.07
10 Milk Fresh (Unboiled) Ltr 11.89 0.66 6.77 0.36 6.56 0.46
11 Tea- Tapal Danedar 200 Gm 9.98 0.00 22.75 -0.51 22.13 -0.51
12 Beef With Bone Av. Qlty. Kg 7.04 0.16 3.40 0.09 3.48 0.24
13 Mutton Av. Qlty. Kg 6.64 0.05 6.94 0.00 7.51 0.59
14 Chicken Farm Broiler (Live) Kg 14.44 10.95 4.56 -5.94 7.34 13.89
15 Eggs Farm Doz 26.53 8.41 -3.68 11.06 -4.74 7.21
16 Potatoes Kg 21.97 -6.62 116.89 44.51 48.79 -35.94
17 Onion Kg -30.58 -20.55 72.83 12.33 78.24 -18.07
18 Tomatoes Kg -35.53 -0.58 216.48 75.81 46.97 -53.83
19 Ginger Kg 1.52 -5.78 63.47 6.89 63.24 -5.91
20 Garlic Kg 13.80 4.69 11.93 1.75 14.49 7.08
7. Global Commodity Prices
Table 7.1 Changes in Major Global Indices (percent)
Item/ Group
Dec-12 Nov-13 Dec-13
YoY MoM YoY MoM YoY MoM
Overall -0.8 1.0 -0.6 -1.5 0.8 2.4
Food 10.8 0.7 -5.4 -0.9 -3.5 2.7
Metals 0.3 5.8 -2.3 -0.6 -7.0 0.8
Energy -3.5 0.4 0.7 -2.0 3.0 2.7
Agricultural Raw Material 2.4 1.0 5.8 1.5 5.3 0.6
Cotton -12.7 3.1 4.7 -5.3 4.9 3.4
Source: IMF

State Bank of Pakistan
13
8. Seasonal Adjustment in CPI
Seasonal adjustment is the process of estimating and removing the seasonal effects
from a time series after decomposing it into seasonal, trend, cycle and irregular
components. The purpose is to identify the different components of the time series
and thus provide a better understanding of its underlying behavior. Seasonally
adjusted changes are usually preferred for analyzing general price trends in the
economy because they eliminate the effect of changes that normally occur at the
same time and in about the same magnitude every year. Various statistical methods
can be used to decompose a time series into its constituent components. The State
Bank of Pakistan uses X-12- ARIMA Seasonal Adjustment Method for this purpose.
The changes in consumer prices are normally reported in terms of year-on-year and
month-on-month basis. Seasonal adjustment is particularly useful for analyzing
month-on-month changes. The monthly data series of Consumer Price Index (CPI)
from July 2008 to December 2013 has been used for seasonal adjustment analysis.
The seasonal analysis is carried out without taking trading-day or Islamic calendar
month’s effects.
Figure 8.1 reveals that seasonality in CPI has been increasing over the period of last
four years. Average seasonal factors reveal strong seasonality during the calendar
year. There is an upward seasonality during the months from July to November &
April and downward seasonality in the remaining months of the year. Upward and
downward seasonality is above and below the trend line respectively. It is important
to note that seasonal factors are estimates based on present and past experience and
that future data may not necessarily show the same pattern of seasonal factors.

Inflation Monitor, December 2013
14
Fig. 8.1 Seasonal Factors of CPI
Note: Data Available in Annex Table 16.
97
98
99
100
101
102
103
Dec-10
Feb-11
Apr-11
Jun-11
Aug-11
Oct-11
Dec-11
Feb-12
Apr-12
Jun-12
Aug-12
Oct-12
Dec-12
Feb-13
Apr-13
Jun-13
Aug-13
Oct-13
Dec-13
Seasonal Factors of CPI
Jul Aug Sep Oct Nov Dec Jan Feb Mar Apr May Jun
Average 100.2100.7100.6100.8100.599.4199.8899.1899.40100.099.6499.56
97
98
99
100
101
102
103
Average Seasonal Factors of CPI
Fig. 8.2 Seasonal Factors of CPI Food
Note: Data Available in Annex Table 17.
97
98
99
100
101
102
103
Dec-10
Feb-11
Apr-11
Jun-11
Aug-11
Oct-11
Dec-11
Feb-12
Apr-12
Jun-12
Aug-12
Oct-12
Dec-12
Feb-13
Apr-13
Jun-13
Aug-13
Oct-13
Dec-13
Seasonal Factors of CPI Food
Jul Aug Sep Oct Nov Dec Jan Feb Mar Apr May Jun
Average 100.3101.5101.6101.7101.499.1599.6098.1198.7099.5599.1198.86
97
98
99
100
101
102
103
Average Seasonal Factors of CPI Food

State Bank of Pakistan
15
Figures 8.3 & 8.4 show that seasonally adjusted series are relatively smoother
than the original series due to the removal of the seasonal variations. The trend
follows the long-term movement in original series, and is smoother than the
original series because some irregular fluctuations have been removed.
Fig. 8.3 Seasonal Plots of CPI
130
140
150
160
170
180
190
200
210
220
Jul Aug Sep Oct Nov Dec Jan Feb Mar Apr May Jun
Seasonal Plot - Original Series
FY-11 FY12 FY13 FY14
130
140
150
160
170
180
190
200
210
220
Jul Aug Sep Oct Nov Dec Jan Feb Mar Apr May Jun
Seasonal Plot - Adjusted Series
FY-11 FY12 FY13 FY14
Fig. 8.4 Seasonal Plots of CPI (Food)
130
140
150
160
170
180
190
200
210
220
Jul Aug Sep Oct Nov Dec Jan Feb Mar Apr May Jun
Seasonal Plot Original Series
FY-11 FY12 FY13 FY14
130
140
150
160
170
180
190
200
210
220
Jul Aug Sep Oct Nov Dec Jan Feb Mar Apr May Jun
Seasonal Plot -Adjusted Series
FY-11 FY12 FY13 FY14

Inflation Monitor, December 2013
16
Seasonally adjusted CPI for December 2013
stood at 189.84 against 188.68 in original
series showing an increase of 1.16 on account
of adjustment of downward seasonality in
December 2013.
Seasonally adjusted CPI food group for
December 2013 stood at 212.76 against 210.89
in original series showing an increase of 1.87
on account of adjustment of downward
seasonality in December 2013.
Month-on-month change of seasonally
adjusted CPI series stood at -0.12% reflecting
deccrease during December 2013 over
November 2013 and a decrease of 1.32% in
original series.
Month-on-month change of seasonally
adjusted CPI food group series stood at -0.95%
reflecting decrease during December 2013
over November 2013 and a decrease of 3.33%
in original series.
It is important to note that inflation rates
should be analyzed on the basis of seasonally
adjusted rates. This is especially needed for
inflation rates on month-on-month basis. The
most recent annual rate of inflation is usually
indicated by annualizing the seasonally
adjusted month-on-month rate. Annualized
rate of CPI inflation in December 2013
(corresponding to the seasonally adjusted
month-on-month rate) is -1.48 percent.
Fig. 8.5 Month-on-Month Percent Changes in CPI
Fig. 8.6 Month-on-Month Percent Changes in CPI Food
-4
-3
-2
-1
0
1
2
3
4
Dec-12
Jan-13
Feb-13
Mar-13
Apr-13
May-13
Jun-13
Jul-13
Aug-13
Sep-13
Oct-13
Nov-13
Dec-13
MoM % Changes in CPI
Original Series Seasonally Adjusted
-40
-30
-20
-10
0
10
20
30
40
50
Dec-12
Jan-13
Feb-13
Mar-13
Apr-13
May-13
Jun-13
Jul-13
Aug-13
Sep-13
Oct-13
Nov-13
Dec-13
MoM Annualize % Change in CPI
Original Series Seasonally Adjusted
-4
-3
-2
-1
0
1
2
3
4
Dec-12
Jan-13
Feb-13
Mar-13
Apr-13
May-13
Jun-13
Jul-13
Aug-13
Sep-13
Oct-13
Nov-13
Dec-13
MoM % Changes in CPI Food
Original Series Seasonally Adjusted
-40
-30
-20
-10
0
10
20
30
40
50
Dec-12
Jan-13
Feb-13
Mar-13
Apr-13
May-13
Jun-13
Jul-13
Aug-13
Sep-13
Oct-13
Nov-13
Dec-13
MoM Annualize % Change in CPI Food
Original Series Seasonally Adjusted

State Bank of Pakistan
17
Annexure A
Table A1: CPI Inflation by Groups (percent)
MoM change YoY change Weight Dec-12 Nov-13 Dec-13 Dec-12 Nov-13 Dec-13
I. Food Group 37.5 0.0 2.6 -3.3 7.7 13.0 9.3
Food & Non-Alcoholic Beverages 34.8 -0.1 2.8 -3.7 7.2 13.0 8.9
Alcoholic Beverages & Tobacco 1.4 0.2 0.0 1.2 18.2 14.4 15.7
Restaurant & Hotels 1.2 0.7 0.9 1.1 10.7 12.3 12.7
II. Non-Food Group 62.5 0.4 0.3 0.2 8.1 9.4 9.1
Clothing & Footwear 7.6 2.0 0.9 0.2 15.8 14.0 12.0
Housing, Water, Elect, Gas &.
other Fuels
29.4 0.1 0.1 0.1 4.1 9.5 9.6
Furnishing & Household Equip.
Maintenance etc
4.2 0.8 0.9 0.9 12.3 8.7 8.8
Health 2.2 0.4 0.4 0.7 14.3 6.2 6.4
Transport 7.2 0.2 0.0 0.0 8.9 9.0 8.8
Communication 3.2 0.1 0.0 0.1 0.6 4.8 4.8
Recreation & Culture 2.0 0.3 0.3 0.3 17.9 9.9 9.9
Education 3.9 0.1 0.0 0.3 10.0 8.5 8.7
Miscellaneous 2.8 0.4 0.6 0.4 11.3 4.6 4.5
Headline 100.0 0.2 1.3 -1.3 7.9 10.9 9.2
Table A2: Distribution of Price changes (YoY) of CPI basket
No. of items in each inflation range
Groups %
changes
Total number
of items
Decrease or
no change
(0% or less)
Subdued
increase
(>0% but
<5%)
Moderate
increase (5%
but less than
10%)
Double digit
increase
(10% or
more)
Dec-13 Dec-12 Dec-13 Dec-12 Dec-13 Dec-12 Dec-13 Dec-12 Dec-13 Dec-12 Dec-13
I. Food Group 9.3 126 126 31 31 17 18 32 28 46 49
Food & Non-Alcoholic Beverages 8.9 114 114 31 31 16 17 28 26 39 40
Alcoholic Beverages & Tobacco 15.7 6 6 0 0 1 1 2 1 3 4
Restaurant & Hotels 12.7 6 6 0 0 0 0 2 1 4 5
II. Non-Food Group 9.1 348 348 40 57 42 55 71 110 195 126
Clothing & Footwear 12.0 59 59 1 4 1 2 5 14 52 39
Housing, Water, Elect, Gas & other
Fuels
9.6 36 36 7 2 2 2 11 18 16 14
Furnishing & Household Equip.
Maintenance etc
8.8 69 69 2 1 10 10 14 31 43 27
Health 6.4 39 39 11 23 5 7 5 3 18 6
Transport 8.8 43 43 2 13 5 7 12 18 24 5
Communication 4.8 12 12 5 2 2 4 2 3 3 3
Recreation & Culture 9.9 39 39 8 7 8 13 7 5 16 14
Education 8.7 16 16 4 2 3 4 3 5 6 5
Miscellaneous 4.5 35 35 0 3 6 6 12 13 17 13
Overall 9.2 474 474 71 88 59 73 103 138 241 175
Note: Prices of 13 seasonal items were not reported during the month.

Inflation Monitor, December 2013
18
Table A3: Top and Bottom 15 Contributors to CPI Inflation (YoY) in December 2013
Top 15 Contributors
YoY Change Weighted
Contribution Items/ Contributors Weights Dec-12 Dec-13
Ranked by Weighted Contribution
1 House Rent 21.81 6.27 7.86 15.10
2 Wheat Flour 4.16 10.32 26.92 12.92
3 Electricity 4.40 16.39 15.82 8.62
4 Milk Fresh 6.68 11.91 6.34 5.84
5 Onion 0.53 -30.58 78.24 4.37
6 Motor Fuel 3.03 6.19 12.69 4.17
7 Education 3.94 10.04 8.66 3.33
8 Cigarette 1.39 18.37 15.84 2.65
9 Potatoes 0.47 21.97 48.79 2.64
10 Cotton Cloth 1.73 8.01 13.07 2.30
11 Transport Services 2.70 9.72 6.33 2.11
12 Rice 1.58 14.38 11.90 2.06
13 Ready Made Food 1.23 10.66 12.70 1.99
14 Tailoring 0.88 15.60 14.79 1.70
15 Tomatoes 0.44 -35.54 46.98 1.69
Total 54.98 71.51
Bottom 15 Contributors
A. Ranked by Weighted Contribution 1 Spices 0.54 3.09 -16.08 -1.42
2 Pulse Gram 0.24 44.45 -29.24 -1.01
3 Fresh Fruits 1.86 2.13 -3.27 -0.69
4 Besan 0.15 42.74 -26.55 -0.59
5 Gram Whole 0.16 12.36 -21.22 -0.49
6 Egg 0.46 26.53 -4.74 -0.34
7 Vegetable Ghee 2.07 3.30 -1.56 -0.33
8 Personal Equipments 0.84 14.30 -2.04 -0.29
9 Cooking Oil 1.75 11.75 -0.65 -0.12
10 Fresh Vegetable 1.69 -1.08 -0.23 -0.04
11 Pulse Mash (Washed) 0.21 -9.74 -0.61 -0.02
12 Mustard Oil 0.10 5.02 -0.49 0.00
13 Medical Equipment 0.01 13.66 5.74 0.01
14 Kerosene Oil 0.01 13.70 8.89 0.01
15 Betel Leaves & Nuts 0.02 6.36 3.98 0.01
Total 10.11 -5.30

State Bank of Pakistan
19
Table A3.1: Top and Bottom 15 Contributors to CPI Inflation (MoM) in December 2013
Top 15 Contributors
MoM Change Weighted
Contribution Items/ Contributors Weights Nov-13 Dec-13
Ranked by Weighted Contribution
1 Chicken 1.36 -5.94 13.90 12.13
2 Wheat Flour 4.16 2.86 1.85 6.95
3 Egg 0.46 11.06 7.22 2.87
4 Milk Fresh 6.68 0.35 0.45 2.75
5 Wheat 0.35 3.82 5.62 1.70
6 Cigarette 1.39 0.00 1.26 1.52
7 Pulse Moong 0.23 2.30 6.05 1.33
8 Woolen Readymade Garments 0.40 2.10 4.18 1.31
9 Rice 1.58 0.19 0.98 1.18
10 Ready Made Food 1.23 0.89 1.06 1.17
11 Bakery & Confectionary 1.16 1.02 1.09 0.98
12 Personal Care 1.49 0.26 0.83 0.94
13 Woolen Cloth 0.88 1.99 1.25 0.93
14 Household Textile 0.65 1.15 1.80 0.88
15 Construction Input Item 0.56 1.56 1.69 0.83
Total 22.57 37.45
Bottom 15 Contributors
A. Ranked by Weighted Contribution 1 Fresh Vegetable 1.69 4.20 -30.59 -53.99
2 Tomatoes 0.44 75.81 -53.83 -38.58
3 Potatoes 0.47 44.51 -35.94 -28.30
4 Onion 0.53 12.32 -18.07 -13.75
5 Sugar 1.04 7.42 -9.07 -8.07
6 Fresh Fruits 1.86 -6.80 -4.24 -5.68
7 Footwear 1.55 0.12 -3.90 -4.06
8 Tea 0.84 -0.34 -2.17 -1.82
9 Motor Fuel 3.03 -0.20 -0.36 -0.85
10 Personal Equipments 0.84 1.21 -0.51 -0.44
11 Gur 0.02 1.04 -9.95 -0.24
12 Beverages 1.20 0.83 -0.01 -0.01
13 Betel Leaves & Nuts 0.02 -0.55 -0.18 0.00
14 Motor Vehicle Tax 0.11 0.00 0.00 0.00
15 Gas 1.58 0.00 0.00 0.00
Total 15.22 -155.79

Inflation Monitor, December 2013
20
Table A3.2: Top Fifteen Contributors to CPI Inflation (YoY) in December 2013
YoY Change Weighted
Contribution Items/ Contributors Weights Dec-12 Dec-13
A. Ranked by Percentage Change
A. Ranked by Weighted Contribution 1 Onion 0.53 -30.58 78.24 4.37
2 Potatoes 0.47 21.97 48.79 2.64
3 Tomatoes 0.44 -35.54 46.98 1.69
4 Wheat 0.35 10.30 30.87 1.20
5 Wheat Product 0.10 6.26 27.29 0.28
6 Wheat Flour 4.16 10.32 26.92 12.92
7 Postal Services 0.07 5.27 24.42 0.18
8 Pulse Masoor 0.27 -6.86 18.15 0.44
9 Cosmetics 0.39 6.10 17.81 0.65
10 Pulse Moong 0.23 -12.36 17.07 0.54
11 Cigarette 1.39 18.37 15.84 2.65
12 Electricity 4.40 16.39 15.82 8.62
13 Text Books 0.57 40.53 15.60 1.30
14 Tailoring 0.88 15.60 14.79 1.70
15 Sewing Needle & Dry Cell 0.15 9.99 14.01 0.20
Total 14.40 39.38
B. Ranked by Weights
A. Ranked by Weighted Contribution 1 House Rent 21.81 6.27 7.86 15.10
2 Milk Fresh 6.68 11.91 6.34 5.84
3 Electricity 4.40 16.39 15.82 8.62
4 Wheat Flour 4.16 10.32 26.92 12.92
5 Education 3.94 10.04 8.66 3.33
6 Communication & Apparatus 3.15 0.47 4.22 1.03
7 Motor Fuel 3.03 6.19 12.69 4.17
8 Transport Services 2.70 9.72 6.33 2.11
9 Meat 2.43 6.91 4.81 1.61
10 Vegetable Ghee 2.07 3.30 -1.56 -0.33
11 Fresh Fruits 1.86 2.13 -3.27 -0.69
12 Cooking Oil 1.75 11.75 -0.65 -0.12
13 Cotton Cloth 1.73 8.01 13.07 2.30
14 Fresh Vegetable 1.69 -1.08 -0.23 -0.04
15 Rice 1.58 14.38 11.90 2.06
Total 63.00 57.92
Note: Weighted contribution is estimated by multiplying the weights by the price change of an item; this is then
reported as a share in YoY change in CPI, which is 9.2 percent in December, 2013.

State Bank of Pakistan
21
Table A3.3: Top Ten Contributors to CPI Food Inflation (YoY) in December 2013
YoY Change Weighted
Contribution Items/ Contributors Weights Dec-12 Dec-13
A. Ranked by Weighted Contribution
1 Wheat Flour 4.16 10.32 26.92 12.92
2 Milk Fresh 6.68 11.91 6.34 5.84
3 Onion 0.53 -30.58 78.24 4.37
4 Cigarette 1.39 18.37 15.84 2.65
5 Potatoes 0.47 21.97 48.79 2.64
6 Rice 1.58 14.38 11.90 2.06
7 Ready Made Food 1.23 10.66 12.70 1.99
8 Tomatoes 0.44 -35.54 46.98 1.69
9 Bakery & Confectionary 1.16 8.52 12.64 1.62
10 Meat 2.43 6.91 4.81 1.61
Total 20.07 37.39
B. Ranked by Percentage Change
A. Ranked by Weighted Contribution 1 Onion 0.53 -30.58 78.24 4.37
2 Potatoes 0.47 21.97 48.79 2.64
3 Tomatoes 0.44 -35.54 46.98 1.69
4 Wheat 0.35 10.30 30.87 1.20
5 Wheat Product 0.10 6.26 27.29 0.28
6 Wheat Flour 4.16 10.32 26.92 12.92
7 Pulse Masoor 0.27 -6.86 18.15 0.44
8 Pulse Moong 0.23 -12.36 17.07 0.54
9 Cigarette 1.39 18.37 15.84 2.65
10 Tea 0.84 8.59 13.40 1.55
Total 8.78 28.29
C. Ranked by Weights
A. Ranked by Weighted Contribution 1 Milk Fresh 6.68 11.91 6.34 5.84
2 Wheat Flour 4.16 10.32 26.92 12.92
3 Meat 2.43 6.91 4.81 1.61
4 Vegetable Ghee 2.07 3.30 -1.56 -0.33
5 Fresh Fruits 1.86 2.13 -3.27 -0.69
6 Cooking Oil 1.75 11.75 -0.65 -0.12
7 Fresh Vegetable 1.69 -1.08 -0.23 -0.04
8 Rice 1.58 14.38 11.90 2.06
9 Cigarette 1.39 18.37 15.84 2.65
10 Chicken 1.36 14.43 7.34 1.08
Total 24.99 24.99
Note: Weighted contribution is estimated by multiplying the weights by the price change of an item; this is then
reported as a share in YoY change in CPI Food, which is 9.3 percent in December, 2013.

Inflation Monitor, December 2013
22
Table A3.4: Top Ten Contributors to CPI Non-food Inflation (YoY) in December 2013
YoY Change Weighted
Contribution Items/ Contributors Weights Dec-12 Dec-13
A. Ranked by Weighted Contribution
1 House Rent 21.81 6.27 7.86 15.10
2 Electricity 4.40 16.39 15.82 8.62
3 Motor Fuel 3.03 6.19 12.69 4.17
4 Education 3.94 10.04 8.66 3.33
5 Cotton Cloth 1.73 8.01 13.07 2.30
6 Transport Services 2.70 9.72 6.33 2.11
7 Tailoring 0.88 15.60 14.79 1.70
8 Footwear 1.55 20.96 9.25 1.35
9 Text Books 0.57 40.53 15.60 1.30
10 Ready Made Garment 0.97 16.49 11.93 1.28
Total 41.59 41.27
B. Ranked by Percentage Change
A. Ranked by Weighted Contribution 1 Postal Services 0.07 5.27 24.42 0.18
2 Cosmetics 0.39 6.10 17.81 0.65
3 Electricity 4.40 16.39 15.82 8.62
4 Text Books 0.57 40.53 15.60 1.30
5 Tailoring 0.88 15.60 14.79 1.70
6 Sewing Needle & Dry Cell 0.15 9.99 14.01 0.20
7 Woolen Readymade Garments 0.40 26.08 13.11 0.60
8 Cotton Cloth 1.73 8.01 13.07 2.30
9 Motor Fuel 3.03 6.19 12.69 4.17
10 Doctor (MBBS) Clinic Fee 0.59 19.93 12.64 0.92
Total 12.20 20.64
C. Ranked by Weights
A. Ranked by Weighted Contribution 1 House Rent 21.81 6.27 7.86 15.10
2 Electricity 4.40 16.39 15.82 8.62
3 Education 3.94 10.04 8.66 3.33
4 Communication & Apparatus 3.15 0.47 4.22 1.03
5 Motor Fuel 3.03 6.19 12.69 4.17
6 Transport Services 2.70 9.72 6.33 2.11
7 Cotton Cloth 1.73 8.01 13.07 2.30
8 Gas 1.58 -42.09 7.05 0.94
9 Footwear 1.55 20.96 9.25 1.35
10 Personal Care 1.49 10.10 7.14 1.21
Total 45.39 40.17
Note: Weighted contribution is estimated by multiplying the weights by the price change of an item; this is then
reported as a share in YoY change in CPI Non-food, which is 9.1 percent in December, 2013.
State Bank of Pakistan
23
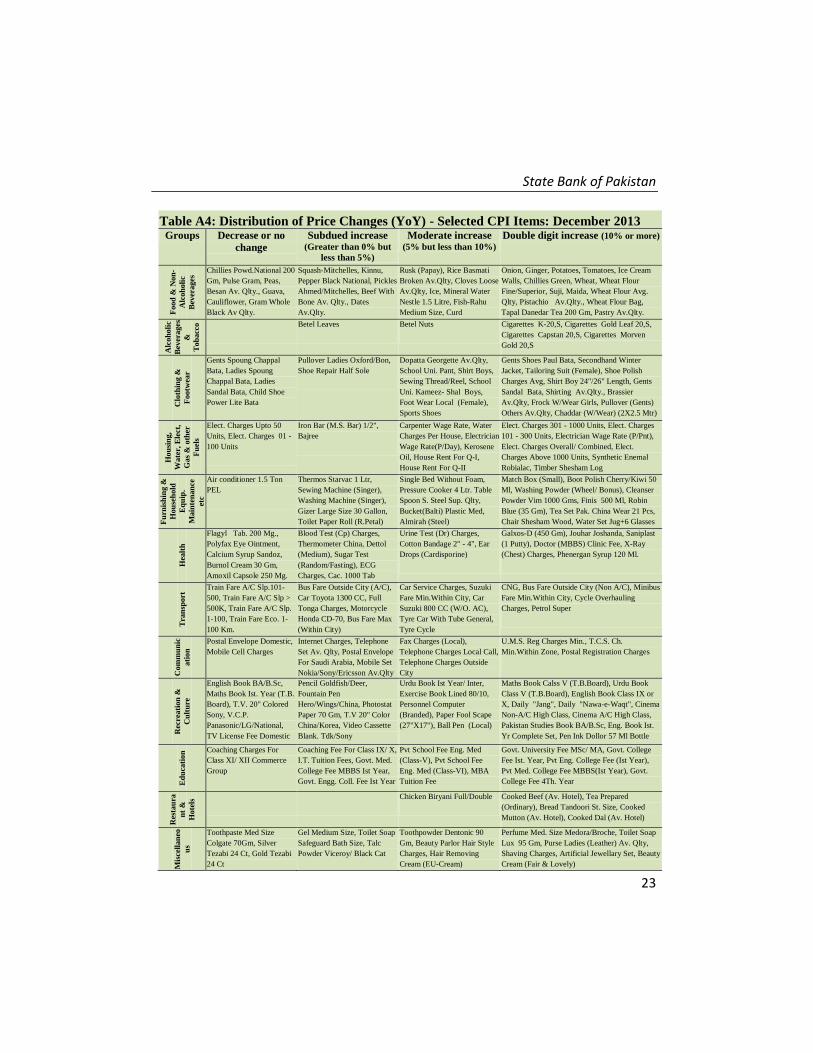
Table A4: Distribution of Price Changes (YoY) - Selected CPI Items: December 2013 Groups Decrease or no
change
Subdued increase (Greater than 0% but
less than 5%)
Moderate increase (5% but less than 10%)
Double digit increase (10% or more)
Food
& N
on
-
Alc
oh
oli
c
Bev
erages
Chillies Powd.National 200
Gm, Pulse Gram, Peas,
Besan Av. Qlty., Guava,
Cauliflower, Gram Whole
Black Av Qlty.
Squash-Mitchelles, Kinnu,
Pepper Black National, Pickles
Ahmed/Mitchelles, Beef With
Bone Av. Qlty., Dates
Av.Qlty.
Rusk (Papay), Rice Basmati
Broken Av.Qlty, Cloves Loose
Av.Qlty, Ice, Mineral Water
Nestle 1.5 Litre, Fish-Rahu
Medium Size, Curd
Onion, Ginger, Potatoes, Tomatoes, Ice Cream
Walls, Chillies Green, Wheat, Wheat Flour
Fine/Superior, Suji, Maida, Wheat Flour Avg.
Qlty, Pistachio Av.Qlty., Wheat Flour Bag,
Tapal Danedar Tea 200 Gm, Pastry Av.Qlty.
Alc
oh
oli
c
Bev
erages
&
Tob
acc
o
Betel Leaves Betel Nuts Cigarettes K-20,S, Cigarettes Gold Leaf 20,S,
Cigarettes Capstan 20,S, Cigarettes Morven
Gold 20,S
Clo
thin
g &
Footw
ear
Gents Spoung Chappal
Bata, Ladies Spoung
Chappal Bata, Ladies
Sandal Bata, Child Shoe
Power Lite Bata
Pullover Ladies Oxford/Bon,
Shoe Repair Half Sole
Dopatta Georgette Av.Qlty,
School Uni. Pant, Shirt Boys,
Sewing Thread/Reel, School
Uni. Kameez- Shal Boys,
Foot Wear Local (Female),
Sports Shoes
Gents Shoes Paul Bata, Secondhand Winter
Jacket, Tailoring Suit (Female), Shoe Polish
Charges Avg, Shirt Boy 24"/26" Length, Gents
Sandal Bata, Shirting Av.Qlty., Brassier
Av.Qlty, Frock W/Wear Girls, Pullover (Gents)
Others Av.Qlty, Chaddar (W/Wear) (2X2.5 Mtr)
Hou
sin
g,
Wate
r, E
lect
,
Gas
& o
ther
Fu
els
Elect. Charges Upto 50
Units, Elect. Charges 01 -
100 Units
Iron Bar (M.S. Bar) 1/2",
Bajree
Carpenter Wage Rate, Water
Charges Per House, Electrician
Wage Rate(P/Day), Kerosene
Oil, House Rent For Q-I,
House Rent For Q-II
Elect. Charges 301 - 1000 Units, Elect. Charges
101 - 300 Units, Electrician Wage Rate (P/Pnt),
Elect. Charges Overall/ Combined, Elect.
Charges Above 1000 Units, Synthetic Enemal
Robialac, Timber Shesham Log
Fu
rnis
hin
g &
Hou
seh
old
Eq
uip
.
Main
ten
an
ce
etc
Air conditioner 1.5 Ton
PEL
Thermos Starvac 1 Ltr,
Sewing Machine (Singer),
Washing Machine (Singer),
Gizer Large Size 30 Gallon,
Toilet Paper Roll (R.Petal)
Single Bed Without Foam,
Pressure Cooker 4 Ltr. Table
Spoon S. Steel Sup. Qlty,
Bucket(Balti) Plastic Med,
Almirah (Steel)
Match Box (Small), Boot Polish Cherry/Kiwi 50
Ml, Washing Powder (Wheel/ Bonus), Cleanser
Powder Vim 1000 Gms, Finis 500 Ml, Robin
Blue (35 Gm), Tea Set Pak. China Wear 21 Pcs,
Chair Shesham Wood, Water Set Jug+6 Glasses
Hea
lth
Flagyl Tab. 200 Mg.,
Polyfax Eye Ointment,
Calcium Syrup Sandoz,
Burnol Cream 30 Gm,
Amoxil Capsole 250 Mg.
Blood Test (Cp) Charges,
Thermometer China, Dettol
(Medium), Sugar Test
(Random/Fasting), ECG
Charges, Cac. 1000 Tab
Urine Test (Dr) Charges,
Cotton Bandage 2" - 4", Ear
Drops (Cardisporine)
Galxos-D (450 Gm), Jouhar Joshanda, Saniplast
(1 Putty), Doctor (MBBS) Clinic Fee, X-Ray
(Chest) Charges, Phenergan Syrup 120 Ml.
Tra
nsp
ort
Train Fare A/C Slp.101-
500, Train Fare A/C Slp >
500K, Train Fare A/C Slp.
1-100, Train Fare Eco. 1-
100 Km.
Bus Fare Outside City (A/C),
Car Toyota 1300 CC, Full
Tonga Charges, Motorcycle
Honda CD-70, Bus Fare Max
(Within City)
Car Service Charges, Suzuki
Fare Min.Within City, Car
Suzuki 800 CC (W/O. AC),
Tyre Car With Tube General,
Tyre Cycle
CNG, Bus Fare Outside City (Non A/C), Minibus
Fare Min.Within City, Cycle Overhauling
Charges, Petrol Super
Com
mu
nic
ati
on
Postal Envelope Domestic,
Mobile Cell Charges
Internet Charges, Telephone
Set Av. Qlty, Postal Envelope
For Saudi Arabia, Mobile Set
Nokia/Sony/Ericsson Av.Qlty
Fax Charges (Local),
Telephone Charges Local Call,
Telephone Charges Outside
City
U.M.S. Reg Charges Min., T.C.S. Ch.
Min.Within Zone, Postal Registration Charges
Rec
reati
on
&
Cu
ltu
re
English Book BA/B.Sc,
Maths Book Ist. Year (T.B.
Board), T.V. 20" Colored
Sony, V.C.P.
Panasonic/LG/National,
TV License Fee Domestic
Pencil Goldfish/Deer,
Fountain Pen
Hero/Wings/China, Photostat
Paper 70 Gm, T.V 20" Color
China/Korea, Video Cassette
Blank. Tdk/Sony
Urdu Book Ist Year/ Inter,
Exercise Book Lined 80/10,
Personnel Computer
(Branded), Paper Fool Scape
(27"X17"), Ball Pen (Local)
Maths Book Calss V (T.B.Board), Urdu Book
Class V (T.B.Board), English Book Class IX or
X, Daily "Jang", Daily "Nawa-e-Waqt", Cinema
Non-A/C High Class, Cinema A/C High Class,
Pakistan Studies Book BA/B.Sc, Eng. Book Ist.
Yr Complete Set, Pen Ink Dollor 57 Ml Bottle
Ed
uca
tion
Coaching Charges For
Class XI/ XII Commerce
Group
Coaching Fee For Class IX/ X,
I.T. Tuition Fees, Govt. Med.
College Fee MBBS Ist Year,
Govt. Engg. Coll. Fee Ist Year
Pvt School Fee Eng. Med
(Class-V), Pvt School Fee
Eng. Med (Class-VI), MBA
Tuition Fee
Govt. University Fee MSc/ MA, Govt. College
Fee Ist. Year, Pvt Eng. College Fee (Ist Year),
Pvt Med. College Fee MBBS(Ist Year), Govt.
College Fee 4Th. Year
Res
tau
ra
nt
&
Hote
ls Chicken Biryani Full/Double Cooked Beef (Av. Hotel), Tea Prepared
(Ordinary), Bread Tandoori St. Size, Cooked
Mutton (Av. Hotel), Cooked Dal (Av. Hotel)
Mis
cell
an
eo
us
Toothpaste Med Size
Colgate 70Gm, Silver
Tezabi 24 Ct, Gold Tezabi
24 Ct
Gel Medium Size, Toilet Soap
Safeguard Bath Size, Talc
Powder Viceroy/ Black Cat
Toothpowder Dentonic 90
Gm, Beauty Parlor Hair Style
Charges, Hair Removing
Cream (EU-Cream)
Perfume Med. Size Medora/Broche, Toilet Soap
Lux 95 Gm, Purse Ladies (Leather) Av. Qlty,
Shaving Charges, Artificial Jewellary Set, Beauty
Cream (Fair & Lovely)

Inflation Monitor, December 2013
24
Table A5: City- wise CPI Inflation by Income Groups, December 2013 Up to Rs: 8000 Rs 8001- 12000
General Food Non-Food General Food Non-Food
MoM YoY MoM YoY MoM YoY
MoM YoY MoM YoY MoM YoY 1 Rawalpindi -1.9 10.7 -3.9 11.2 0.7 9.9 -1.6 10.9 -3.8 11.2 0.9 10.5
2 Islamabad -1.8 14.3 -3.8 11.7 0.9 17.6 -1.3 14.1 -3.1 11.7 0.7 16.8
3 Lahore -2.9 7.9 -5.4 9.5 0.9 5.8 -2.7 7.9 -5.1 9.6 0.5 5.9
4 Gujranwala -3.0 6.7 -6.0 5.5 1.2 8.4 -2.7 6.6 -5.6 5.2 0.8 8.2
5 Sialkot -2.9 7.2 -5.1 6.2 0.1 8.7 -2.3 7.2 -4.2 5.9 -0.1 8.7
6 Faisalabad -3.4 10.2 -6.1 8.8 0.3 12.0 -2.9 9.7 -5.6 8.1 0.2 11.6
7 Multan -2.7 8.2 -4.9 8.9 0.2 7.4 -2.7 7.9 -5.1 8.3 0.1 7.4
8 Sargodha -4.7 9.2 -7.9 9.4 -0.8 9.0 -4.0 9.0 -7.2 9.1 -0.7 8.9
9 Bahawalpur -2.0 9.7 -3.7 10.3 0.1 8.9 -1.3 9.2 -2.6 9.7 0.1 8.8
10 Karachi -2.3 6.5 -4.2 7.6 0.5 5.0 -2.4 6.1 -4.6 6.5 0.4 5.5
11 Hyderabad -2.4 8.6 -4.0 11.2 0.0 5.1 -2.3 8.1 -4.1 10.4 0.0 5.4
12 Sukkur -2.1 10.4 -3.6 11.8 -0.2 8.6 -1.8 10.0 -3.3 11.3 -0.2 8.5
13 Larkana -1.7 14.2 -3.1 14.3 0.1 14.0 -1.4 13.9 -2.9 14.3 0.1 13.6
14 Peshawar -1.0 13.8 -1.9 14.7 0.2 12.8 -0.5 13.1 -1.3 13.9 0.3 12.3
15 Bannu -2.4 8.1 -4.0 10.1 -0.4 5.7 -2.0 7.6 -3.6 9.6 -0.2 5.6
16 Quetta 0.6 12.9 1.2 16.2 -0.1 8.7 0.5 11.6 1.2 14.8 -0.2 8.0
17 Khuzdar 0.2 8.0 0.4 11.2 0.0 4.3 0.3 7.8 0.5 10.8 0.1 4.8
Rs 12001-18000 Rs 18001-35000
General Food Non-Food General Food Non-Food
MoM YoY MoM YoY MoM YoY
MoM YoY MoM YoY MoM YoY 1 Rawalpindi -1.7 10.9 -4.0 11.1 0.5 10.8 -1.6 10.7 -4.2 10.7 0.5 10.7
2 Islamabad -1.2 15.3 -3.0 11.6 0.6 19.2 -1.2 17.0 -3.4 11.5 0.7 21.9
3 Lahore -2.5 7.8 -4.7 9.5 0.1 6.0 -2.1 8.0 -4.3 9.5 0.1 6.7
4 Gujranwala -2.6 6.2 -5.1 5.0 0.1 7.5 -2.1 6.5 -4.6 5.0 0.2 7.9
5 Sialkot -2.3 7.4 -3.9 6.5 -0.6 8.4 -1.7 7.8 -3.3 6.4 -0.4 9.0
6 Faisalabad -2.7 9.7 -5.2 7.8 -0.1 11.8 -2.0 9.7 -4.4 7.8 0.2 11.5
7 Multan -2.5 7.8 -4.7 8.1 -0.2 7.5 -2.2 7.7 -4.7 7.6 -0.1 7.9
8 Sargodha -3.9 8.9 -7.1 9.2 -0.8 8.6 -3.5 8.8 -6.9 9.2 -0.7 8.5
9 Bahawalpur -1.0 9.1 -2.0 9.7 0.0 8.7 -0.4 8.3 -1.2 9.5 0.1 7.4
10 Karachi -2.4 6.0 -4.7 6.2 0.1 5.7 -2.0 6.3 -4.5 6.3 0.3 6.3
11 Hyderabad -2.4 7.8 -4.2 10.0 -0.3 5.4 -2.1 7.6 -4.1 9.6 -0.2 5.9
12 Sukkur -1.7 9.6 -3.0 10.8 -0.3 8.4 -1.3 9.0 -2.6 9.7 -0.2 8.3
13 Larkana -1.3 14.3 -2.7 14.5 0.0 14.0 -1.0 14.0 -2.4 14.5 0.1 13.6
14 Peshawar -0.5 13.1 -1.4 13.8 0.3 12.4 -0.5 12.7 -1.3 13.0 0.3 12.5
15 Bannu -2.1 8.0 -3.7 10.0 -0.5 6.2 -2.1 7.7 -3.9 9.2 -0.4 6.5
16 Quetta 0.5 10.8 1.1 13.1 -0.1 8.4 0.4 10.2 0.9 11.9 -0.1 8.7
17 Khuzdar 0.3 7.3 0.5 10.2 0.1 4.7 0.4 7.5 0.7 10.2 0.1 5.3
Above Rs 35000 Combined General Food Non-Food General Food Non-Food
MoM YoY MoM YoY MoM YoY
MoM YoY MoM YoY MoM YoY 1 Rawalpindi -0.7 10.7 -3.1 10.7 0.5 10.7 -1.1 10.6 -3.6 10.7 0.7 10.6
2 Islamabad -0.3 15.6 -2.1 11.4 0.6 17.8 -0.4 15.5 -2.4 11.4 1.1 18.7
3 Lahore -1.3 8.1 -3.5 9.4 0.1 7.4 -1.8 8.0 -4.2 9.5 0.2 6.8
4 Gujranwala -1.5 6.3 -4.0 5.0 -0.1 7.0 -2.1 6.5 -4.8 5.1 -0.1 7.5
5 Sialkot -1.2 7.8 -2.6 6.5 -0.5 8.5 -1.7 7.6 -3.3 6.4 -0.5 8.5
6 Faisalabad -1.2 9.9 -3.5 7.4 0.1 11.2 -2.1 9.8 -4.8 7.9 -0.2 11.3
7 Multan -1.1 7.4 -3.3 7.3 0.0 7.4 -1.9 7.6 -4.3 7.8 -0.1 7.5
8 Sargodha -2.7 8.8 -6.6 8.9 -0.9 8.7 -3.5 8.9 -7.0 9.2 -1.2 8.7
9 Bahawalpur -0.1 7.9 -0.4 9.3 0.0 7.2 -0.8 8.7 -1.9 9.7 0.0 8.0
10 Karachi -1.2 6.8 -3.8 6.5 0.2 6.9 -1.6 6.5 -4.2 6.4 0.5 6.5
11 Hyderabad -1.6 6.5 -3.7 8.6 -0.4 5.3 -2.0 7.4 -4.0 9.6 -0.5 5.7
12 Sukkur -0.8 8.1 -1.8 8.8 -0.2 7.8 -1.4 9.2 -2.7 10.3 -0.5 8.5
13 Larkana -0.7 12.7 -2.1 13.2 0.0 12.5 -1.2 13.9 -2.6 14.3 -0.2 13.6
14 Peshawar -0.2 13.3 -1.0 12.7 0.2 13.5 -0.4 13.2 -1.3 13.5 0.2 12.9
15 Bannu -1.3 5.8 -2.6 8.5 -0.7 4.5 -2.0 7.6 -3.6 9.6 -0.8 6.3
16 Quetta 0.3 9.4 1.0 10.9 0.0 8.7 0.4 10.4 1.0 12.6 0.0 8.9
17 Khuzdar 0.2 4.6 0.7 7.4 -0.1 3.2 0.3 7.5 0.5 10.3 0.1 5.7

State Bank of Pakistan
25
Table A6: City- wise CPI Inflation (YoY) December, 2013
High inflation cities Low inflation cities
General Food Non-food General Food Non-food
Islamabad 15.5 11.4 18.7
Abbotabad 9.1 10.7 8.0
Larkana 13.9 14.3 13.6
Rahim Yar Khan 9.0 8.1 9.8
Mianwali 13.8 12.4 14.7
D.G. Khan 9.0 9.8 8.4
Mingora 13.4 12.2 14.1
Gawadar 8.9 10.8 7.7
Peshawar 13.2 13.5 12.9
Sargodha 8.9 9.2 8.7
Dera Mrd.Jamali 12.9 14.9 11.5
Jehlum 8.8 8.4 9.1
Mithi 12.3 9.3 14.2
Wazirabad 8.8 7.9 9.4
Mardan 12.1 10.9 12.8
Muzaffargarh 8.7 8.1 9.2
Jhang 11.3 10.6 11.7
Bahawalpur 8.7 9.7 8.0
Turbat 11.2 11.1 11.3
Lahore 8.0 9.5 6.8
Rawalpindi 10.6 10.7 10.6
Nawabshah 7.9 6.8 8.6
D. I. Khan 10.6 13.1 8.9
Multan 7.6 7.8 7.5
Quetta 10.4 12.6 8.9
Mirpur Khas 7.6 9.1 6.6
Attock 10.4 14.2 7.7
Sialkot 7.6 6.4 8.5
Loralai &Cantt 9.9 13.6 7.4
Bannu 7.6 9.6 6.3
Faisalabad 9.8 7.9 11.3
Khuzdar 7.5 10.3 5.7
Sahiwal 9.4 8.5 9.9
Dadu 7.4 8.7 6.5
Sukkur 9.2 10.3 8.5
Hyderabad 7.4 9.6 5.7
Bahawalnagar 6.5 7.2 6.0
Gujranwala 6.5 5.1 7.5
Karachi 6.5 6.4 6.5
Vehari 5.5 5.4 5.6
Note: High inflation refers to equal or above average inflation, and low inflation refers to below average

Inflation Monitor, December 2013
26
Table A7: Income Group-wise Inflation ( percent)
MoM
YoY
Dec-12 Nov-13 Dec-13 Dec-12 Nov-13 Dec-13
Up to Rs. 8000
General 0.1 2.1 -2.2 8.2 12.1 9.4
Food -0.2 3.3 -4.0 7.1 14.9 10.5
Non-food 0.6 0.4 0.2 9.6 8.5 8.1
Rs. 8001- 12000
General 0.2 1.8 -1.9 9.3 11.2 8.9
Food -0.1 3.1 -3.8 7.3 14.1 9.9
Non-food 0.5 0.3 0.2 11.5 8.1 7.8
Rs. 12001- 18000
General 0.2 1.6 -1.7 9.1 11.9 9.7
Food -0.1 2.9 -3.6 7.5 13.6 9.6
Non-food 0.5 0.3 0.2 10.6 10.2 9.8
Rs. 18001- 35000
General 0.2 1.4 -1.5 7.6 11.5 9.6
Food 0.0 2.7 -3.4 7.8 13.1 9.2
Non-food 0.4 0.3 0.2 7.4 10.2 9.9
Above Rs. 35000
General 0.3 0.9 -0.9 6.9 10.1 8.9
Food 0.1 2.2 -2.9 7.9 12.1 8.8
Non-food 0.4 0.3 0.2 6.4 9.1 8.9
All income groups
General 0.2 1.3 -1.3 7.9 10.9 9.2
Food 0.0 2.6 -3.3 7.7 13.0 9.3
Non-food 0.4 0.3 0.2 8.1 9.4 9.1
State Bank of Pakistan
27
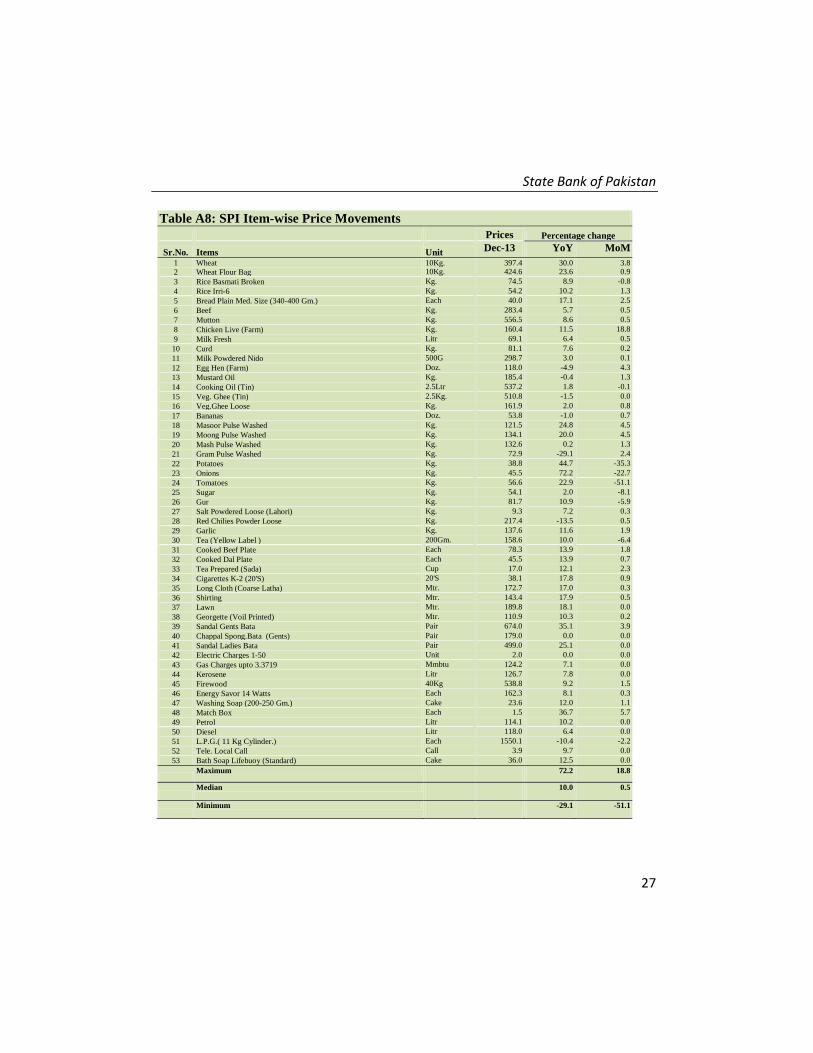
Table A8: SPI Item-wise Price Movements
Prices Percentage change
Sr.No. Items Unit Dec-13 YoY MoM
1 Wheat 10Kg. 397.4 30.0 3.8
2 Wheat Flour Bag 10Kg. 424.6 23.6 0.9
3 Rice Basmati Broken Kg. 74.5 8.9 -0.8
4 Rice Irri-6 Kg. 54.2 10.2 1.3
5 Bread Plain Med. Size (340-400 Gm.) Each 40.0 17.1 2.5
6 Beef Kg. 283.4 5.7 0.5
7 Mutton Kg. 556.5 8.6 0.5
8 Chicken Live (Farm) Kg. 160.4 11.5 18.8
9 Milk Fresh Litr 69.1 6.4 0.5
10 Curd Kg. 81.1 7.6 0.2
11 Milk Powdered Nido 500G 298.7 3.0 0.1
12 Egg Hen (Farm) Doz. 118.0 -4.9 4.3
13 Mustard Oil Kg. 185.4 -0.4 1.3
14 Cooking Oil (Tin) 2.5Ltr 537.2 1.8 -0.1
15 Veg. Ghee (Tin) 2.5Kg. 510.8 -1.5 0.0
16 Veg.Ghee Loose Kg. 161.9 2.0 0.8
17 Bananas Doz. 53.8 -1.0 0.7
18 Masoor Pulse Washed Kg. 121.5 24.8 4.5
19 Moong Pulse Washed Kg. 134.1 20.0 4.5
20 Mash Pulse Washed Kg. 132.6 0.2 1.3
21 Gram Pulse Washed Kg. 72.9 -29.1 2.4
22 Potatoes Kg. 38.8 44.7 -35.3
23 Onions Kg. 45.5 72.2 -22.7
24 Tomatoes Kg. 56.6 22.9 -51.1
25 Sugar Kg. 54.1 2.0 -8.1
26 Gur Kg. 81.7 10.9 -5.9
27 Salt Powdered Loose (Lahori) Kg. 9.3 7.2 0.3
28 Red Chilies Powder Loose Kg. 217.4 -13.5 0.5
29 Garlic Kg. 137.6 11.6 1.9
30 Tea (Yellow Label ) 200Gm. 158.6 10.0 -6.4
31 Cooked Beef Plate Each 78.3 13.9 1.8
32 Cooked Dal Plate Each 45.5 13.9 0.7
33 Tea Prepared (Sada) Cup 17.0 12.1 2.3
34 Cigarettes K-2 (20'S) 20'S 38.1 17.8 0.9
35 Long Cloth (Coarse Latha) Mtr. 172.7 17.0 0.3
36 Shirting Mtr. 143.4 17.9 0.5
37 Lawn Mtr. 189.8 18.1 0.0
38 Georgette (Voil Printed) Mtr. 110.9 10.3 0.2
39 Sandal Gents Bata Pair 674.0 35.1 3.9
40 Chappal Spong.Bata (Gents) Pair 179.0 0.0 0.0
41 Sandal Ladies Bata Pair 499.0 25.1 0.0
42 Electric Charges 1-50 Unit 2.0 0.0 0.0
43 Gas Charges upto 3.3719 Mmbtu 124.2 7.1 0.0
44 Kerosene Litr 126.7 7.8 0.0
45 Firewood 40Kg 538.8 9.2 1.5
46 Energy Savor 14 Watts Each 162.3 8.1 0.3
47 Washing Soap (200-250 Gm.) Cake 23.6 12.0 1.1
48 Match Box Each 1.5 36.7 5.7
49 Petrol Litr 114.1 10.2 0.0
50 Diesel Litr 118.0 6.4 0.0
51 L.P.G.( 11 Kg Cylinder.) Each 1550.1 -10.4 -2.2
52 Tele. Local Call Call 3.9 9.7 0.0
53 Bath Soap Lifebuoy (Standard) Cake 36.0 12.5 0.0
Maximum 72.2 18.8
Median 10.0 0.5
Minimum -29.1 -51.1

Inflation Monitor, December 2013
28
Table A9: Distribution of Price Changes (YoY) - WPI Items: December 2013
Groups Decrease or no change Subdued increase (Greater than 0% but less
than 5%)
Moderate increase (5% but less than 10%)
Double digit increase (10% or
more)
Agric
ult
ure F
orest
ry
& F
ish
ery P
ro
du
cts
Fresh Fruits, Pulses, Other
Oil Seeds, Eggs, Sugar
Crops
Milk from Bovine
Animals, Cotton Seeds
Fuel Wood in Logs,
Rice, Maize, Hides and
Fur Skins- Raw,
Poultry
Stimulant and Spice Crops, Edible
Roots/Potatoes, Fish Live Fresh or
Chilled, Wheat, Sorghum/Jowar,
Vegetables, Fibre Crops, Dry
Fruits, Raw Animal Material/Wool,
Millet/Bajra, Unmanufactured
Tobacco
Ore
s &
Min
era
ls,
Ele
ctr
icit
y G
as
&
Wa
ter
Natural Gas Liquefied Salt & Pure Sodium Chloride,
Electrical Energy, Coal not
Agglomerated
Fo
od
Pro
du
cts
, B
ev
era
ges
an
d T
ob
acco
,
Tex
tile
s, A
pp
arel
an
d L
ea
ther P
ro
du
cts
Spices, Other Cereal
Flour, Other Food
Products, Dried Fruits &
Nuts, Chocolate
Meat of Animals,
Blended Yarn, Silk and
Rayon Fabrics,
Vegetable Oil Refined,
Vegetables & Fruit
Juices, Cotton Yarn,
Sugar Confectionary,
Vegetable Ghee, Nylon
Yarn, Synthetic Carpets,
Sugar Refined,
Processed Liquid Milk,
Footwear
Other Fabrics, Mineral
Water, Cotton Fabrics,
Woolen Carpets, Oil
Cakes, Dairy Products
N.E.C, Fruit Juices,
Hosiery Products
Other Leather N.E.C, Leather
without Hairs, Wheat Flour, Ice
Cream, Bed Sheets, Tobacco
Products, Towels, Coffee and Tea,
Milk and Cream in Solid Form,
Ready Made Garments, Quilts,
Beverages, Blankets, Woven
Fabrics
Oth
er T
ra
nsp
orta
ble
Go
od
s
ex
cep
t M
eta
l P
ro
du
cts
,
Mach
inery
an
d E
qu
ipm
en
ts
Medicines, Coke Mobil Oil, Dying
Materials, Auto Tyres,
Fertilizers
Furnace Oil, Cement,
Kerosene Oil, Printing
Paper, Glass Sheets,
Ceramics and Sanitary,
Soaps & Detergent,
Matches, Diesel Oil,
Bed Foams, Plastic
Products
Hard Board, Timber, Pesticides,
Insecticides, Bricks Blocks and
Tiles, Paints & Varnishes, Other
Glass Articles, Motor Sprit,
Chemicals
Meta
l P
rod
uct
Mach
inery
& E
qu
ipm
en
t
Pig Iron, Engines and
Motors, Vacuum Pumps,
Concrete Mixer
Air Conditioners, Chuff
Cutter, Bicycles, Motor
Cycles, Radio and
Television
Lighting Equipments,
Electrical Wires,
Motor Vehicles, Steel
Bars & Sheets, Steel
Products
Lathe Machines, Cultivators,
Tractors, Pipe Fittings,
Refrige,Wash& Sew
Mach,Iron,Fan
State Bank of Pakistan
29
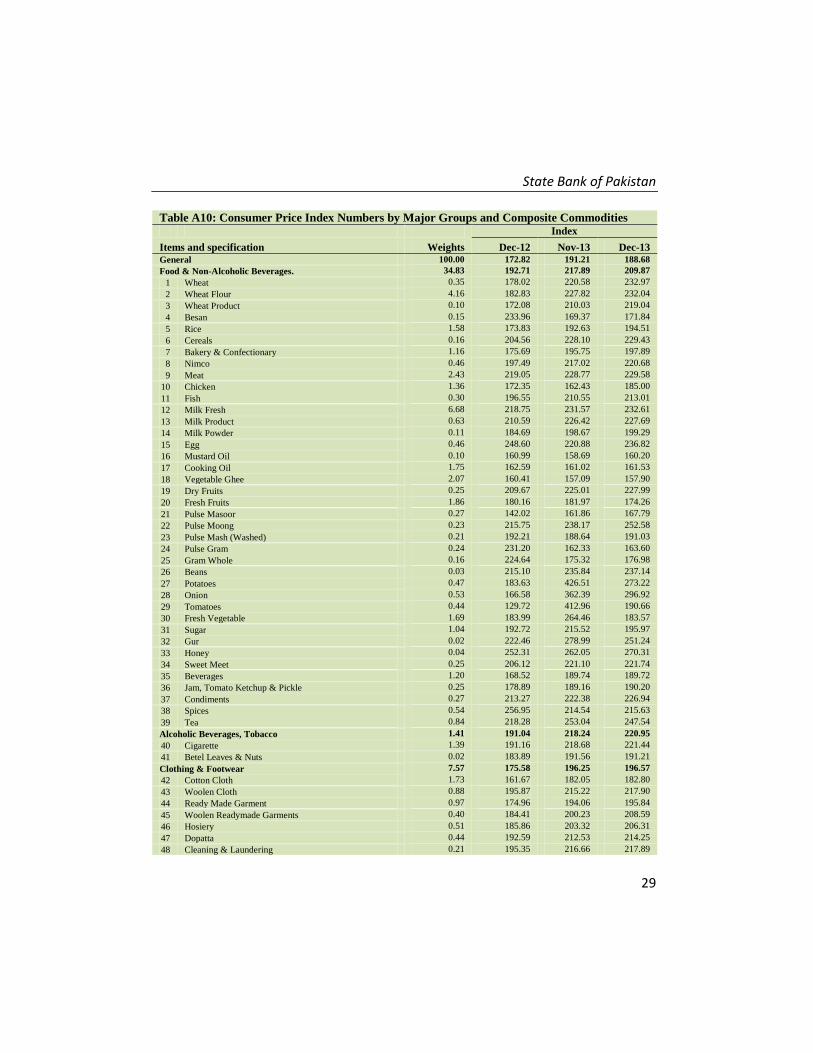
Table A10: Consumer Price Index Numbers by Major Groups and Composite Commodities Index
Items and specification Weights Dec-12 Nov-13 Dec-13
General 100.00 172.82 191.21 188.68
Food & Non-Alcoholic Beverages. 34.83 192.71 217.89 209.87
1 Wheat 0.35 178.02 220.58 232.97
2 Wheat Flour 4.16 182.83 227.82 232.04
3 Wheat Product 0.10 172.08 210.03 219.04
4 Besan 0.15 233.96 169.37 171.84
5 Rice 1.58 173.83 192.63 194.51
6 Cereals 0.16 204.56 228.10 229.43
7 Bakery & Confectionary 1.16 175.69 195.75 197.89
8 Nimco 0.46 197.49 217.02 220.68
9 Meat 2.43 219.05 228.77 229.58
10 Chicken 1.36 172.35 162.43 185.00
11 Fish 0.30 196.55 210.55 213.01
12 Milk Fresh 6.68 218.75 231.57 232.61
13 Milk Product 0.63 210.59 226.42 227.69
14 Milk Powder 0.11 184.69 198.67 199.29
15 Egg 0.46 248.60 220.88 236.82
16 Mustard Oil 0.10 160.99 158.69 160.20
17 Cooking Oil 1.75 162.59 161.02 161.53
18 Vegetable Ghee 2.07 160.41 157.09 157.90
19 Dry Fruits 0.25 209.67 225.01 227.99
20 Fresh Fruits 1.86 180.16 181.97 174.26
21 Pulse Masoor 0.27 142.02 161.86 167.79
22 Pulse Moong 0.23 215.75 238.17 252.58
23 Pulse Mash (Washed) 0.21 192.21 188.64 191.03
24 Pulse Gram 0.24 231.20 162.33 163.60
25 Gram Whole 0.16 224.64 175.32 176.98
26 Beans 0.03 215.10 235.84 237.14
27 Potatoes 0.47 183.63 426.51 273.22
28 Onion 0.53 166.58 362.39 296.92
29 Tomatoes 0.44 129.72 412.96 190.66
30 Fresh Vegetable 1.69 183.99 264.46 183.57
31 Sugar 1.04 192.72 215.52 195.97
32 Gur 0.02 222.46 278.99 251.24
33 Honey 0.04 252.31 262.05 270.31
34 Sweet Meet 0.25 206.12 221.10 221.74
35 Beverages 1.20 168.52 189.74 189.72
36 Jam, Tomato Ketchup & Pickle 0.25 178.89 189.16 190.20
37 Condiments 0.27 213.27 222.38 226.94
38 Spices 0.54 256.95 214.54 215.63
39 Tea 0.84 218.28 253.04 247.54
Alcoholic Beverages, Tobacco 1.41 191.04 218.24 220.95
40 Cigarette 1.39 191.16 218.68 221.44
41 Betel Leaves & Nuts 0.02 183.89 191.56 191.21
Clothing & Footwear 7.57 175.58 196.25 196.57
42 Cotton Cloth 1.73 161.67 182.05 182.80
43 Woolen Cloth 0.88 195.87 215.22 217.90
44 Ready Made Garment 0.97 174.96 194.06 195.84
45 Woolen Readymade Garments 0.40 184.41 200.23 208.59
46 Hosiery 0.51 185.86 203.32 206.31
47 Dopatta 0.44 192.59 212.53 214.25
48 Cleaning & Laundering 0.21 195.35 216.66 217.89

Inflation Monitor, December 2013
30
Table A10: Consumer Price Index Numbers by Major Groups and Composite Commodities
Index
Items and specification Weights Dec-12 Nov-13 Dec-13 49 Tailoring 0.88 206.63 235.52 237.19 50 Footwear 1.55 149.16 169.58 162.96
Housing,Water,Elect,Gas & Other Fuel 29.41 150.10 164.33 164.44
51 House Rent 21.81 139.61 150.59 150.59 52 Construction Input Item 0.56 203.13 221.73 225.47
53 Construction Wage Rate 0.33 172.69 191.07 191.24
54 Water Supply 0.50 134.90 147.52 147.52
55 Electricity 4.40 196.37 227.44 227.44
56 Gas 1.58 134.34 143.81 143.81
57 Kerosene Oil 0.01 272.53 296.65 296.77 58 Fire Wood Whole 0.23 236.83 256.78 260.84
Furnished H.Hold Equip.& Maint. Etc 4.21 180.08 194.16 195.83
59 Furniture 0.33 169.13 183.52 187.36
60 Household Textile 0.65 176.21 190.35 193.78
61 Household Equipment 0.59 158.25 165.35 166.01
62 Utensils 0.32 177.63 195.29 197.31 63 Plastic Products 0.25 175.69 189.62 190.40
64 Washing Soap & Detergent 0.79 195.07 212.44 213.77
65 Sewing Needle & Dry Cell 0.15 151.84 172.30 173.11
66 Household Servant 1.04 191.93 205.48 206.44
67 Marriage Hall Charges 0.08 193.63 206.52 207.66
Health 2.19 156.76 165.73 166.83 68 Drug Medicine 1.27 138.76 142.19 142.27
69 Medical Equipment 0.01 198.31 209.63 209.70
70 Doctor (MBBS) Clinic Fee 0.59 194.63 216.61 219.23
71 Medical Test 0.32 157.07 163.95 166.32
Transport 7.20 181.04 197.04 197.03
72 Motor Vehicle 0.66 152.89 160.81 161.22 73 Motor Vehicle Accessories 0.24 209.17 221.31 222.12
74 Motor Fuel 3.03 172.28 194.85 194.14
75 Mechanical Service 0.46 184.20 197.52 198.85
76 Motor Vehicle Tax 0.11 152.02 153.74 153.74
77 Transport Services 2.70 195.85 207.87 208.24
Communication 3.22 123.85 129.71 129.79 78 Postal Services 0.07 173.52 215.89 215.89
79 Communication & Apparatus 3.15 122.80 127.90 127.98
Recreation & Culture 2.02 166.69 182.66 183.13
80 Recreation & Culture 0.86 122.16 126.38 126.50
81 Text Books 0.57 231.05 267.10 267.10
82 News Papers 0.19 155.92 170.49 172.95 83 Stationery 0.40 176.31 189.69 190.60
Education 3.94 154.93 167.91 168.34
84 Education 3.94 154.93 167.91 168.34
Restaurants And Hotels 1.23 202.44 225.76 228.16
85 Ready Made Food 1.23 202.44 225.76 228.16
Miscellaneous Goods And Services 2.76 201.20 209.61 210.35 86 Personal Care 1.49 180.05 191.32 192.91
87 Cosmetics 0.39 149.65 174.38 176.30
88 Blades 0.03 173.53 180.83 181.71
89 Personal Equipments 0.84 263.21 259.16 257.84

State Bank of Pakistan
31
Table A11: Wholesale Price Index Numbers by Major Groups and Composite Commodities
Index
Items and Specifications Dec-12 Nov-13 Dec-13 General 192.98 212.22 210.11 Agriculture Forestry & Fishery 192.97 220.76 212.36
1 Wheat 185.88 231.90 244.00
2 Maize 165.11 178.94 175.94 3 Rice 163.76 176.47 176.55
4 Sorghum/Jowar 198.10 263.55 248.44 5 Millet/Bajra 157.83 179.40 175.79
6 Vegetables 185.19 367.68 220.02 7 Fresh Fruits 207.91 194.51 183.06 8 Dry Fruits 179.38 197.11 201.08
9 Cotton Seeds 166.78 168.77 168.48 10 Other Oil Seeds 186.07 178.95 182.45
11 Edible Roots/ Potatoes 176.09 472.04 296.10 12 Stimulant And Spice Crops 170.28 275.65 289.64 13 Pulses 207.89 178.53 186.65
14 Sugar Crops 267.92 267.92 267.92 15 Fibre Crops 179.31 212.61 210.20
16 Unmanufactured Tobacco 169.08 181.11 187.30 17 Poultry 175.34 159.59 185.85
18 Milk From Bovine Animals 213.76 223.35 224.04 19 Eggs 250.45 230.34 245.62 20 Raw Animal Material/Wool 137.58 153.55 153.55
21 Hides And Fur Skins, Raw 138.82 145.71 147.61 22 Fuel Wood In Logs 216.60 236.04 238.23
23 Fishes Live Fresh Or Chilled 178.10 249.22 249.61
Ores/Minerals, Gas & Elect. 208.45 243.77 243.89 24 Coal Not Agglomerated 196.08 223.53 223.53
25 Natural Gas Liquefied 193.63 204.91 205.11 26 Salt & Pure Sodium Chloride 164.54 217.04 220.90
27 Electrical Energy 226.10 287.44 287.44
Food, Beverages, Tobacco, Textiles 188.44 201.99 200.91
28 Meat Of Animals 228.57 239.95 239.95 29 Vegetables & Fruit Juices 188.52 192.59 193.79 30 Dried Fruits & Nuts 224.06 224.54 223.51
31 Fruit Juices 157.91 165.29 166.02 32 Vegetable Oil Refined 156.05 160.83 161.60
33 Vegetable Ghee 139.95 141.61 142.45 34 Oil Cakes 172.67 181.80 183.79 35 Processed Liquid Milk 208.43 205.54 210.94
36 Milk And Cream In Solid Form 171.59 190.96 193.72 37 Ice Cream 167.68 209.79 209.79
38 Dairy Products N.E.C 204.91 217.26 217.26 39 Wheat Flour 168.13 209.15 214.45
40 Other Cereal Flour 200.17 132.04 136.20 41 Sugar Refined 199.74 229.71 202.31 42 Chocolate 99.19 99.19 99.19
43 Sugar Confectionary 100.40 102.28 102.28 44 Coffee And Tea 199.81 229.47 226.18
45 Spices 301.56 194.28 194.39 46 Other Food Products 319.27 308.23 308.23 47 Mineral Water 168.32 181.84 181.84
48 Beverages 137.86 150.11 152.77 49 Tobacco Products 208.80 242.41 242.41
50 Cotton Yarn 211.22 221.66 215.52 51 Nylon Yarn 178.80 181.73 181.73
52 Blended Yarn 192.45 201.89 201.89 53 Woven Fabrics 206.00 224.64 226.82 54 Cotton Fabrics 174.17 187.77 187.77
55 Other Fabrics 165.62 179.06 179.06

Inflation Monitor, December 2013
32
Table A11: Wholesale Price Index Numbers by Major Groups and Composite Commodities
Index
Items and Specifications Dec-12 Nov-13 Dec-13 56 Silk And Rayon Fabrics 154.21 161.09 161.09 57 Towels 203.06 233.85 234.25 58 Blankets 184.97 196.10 204.97
59 Bed Sheets 197.94 227.19 236.05 60 Quilts 151.68 160.74 169.53
61 Woolen Carpets 106.55 109.52 113.69 62 Synthetic Carpets 114.41 115.69 116.10
63 Hosiery Products 178.65 187.81 187.81 64 Ready Made Garments 136.27 153.12 153.12 65 Leather With Out Hairs 109.83 144.55 149.13
66 Other Leather N.E.C 122.57 276.28 297.73 67 Footwear’s 133.63 139.49 134.22
Other Transportable Goods 204.13 216.87 218.30 68 Timber 148.36 166.37 173.24 69 Printing Paper 155.35 167.02 169.75
70 Hard Board 194.44 214.58 229.17 71 Coke 163.45 163.45 163.45
72 Motor Sprit 171.33 190.50 190.50 73 Diesel Oil 261.87 279.46 279.46
74 Kerosene Oil 263.47 288.01 288.01 75 Furnace Oil 168.81 184.52 184.93 76 Mobil Oil 184.45 193.09 193.09
77 Chemicals 156.65 169.65 172.77 78 Dying Materials 104.26 106.46 107.55
79 Fertilizers 261.25 263.88 266.56 80 Pesticides 197.49 224.99 225.48 81 Insecticides 117.42 131.04 133.78
82 Paints & Varnishes 237.48 249.49 265.56 83 Medicines 139.54 138.77 138.77
84 Soaps & Detergent 168.41 178.85 181.19 85 Auto Tyres 180.84 185.73 185.73
86 Plastic Products 191.35 200.86 201.76 87 Glass Sheets 190.93 206.90 207.75 88 Other Glass Articles 191.72 213.87 214.09
89 Ceramics And Sanitary 157.32 171.02 171.05 90 Bricks Blocks And Tiles 173.20 194.89 196.76
91 Cement 187.19 200.84 204.86 92 Bed Foams 141.17 149.33 149.67 93 Matches 133.50 143.20 143.20
Metal Product Machinery & Equip 159.19 168.01 168.65 94 Pig Iron 128.97 128.97 128.97
95 Steel Bars & Sheets 133.53 140.55 140.33 96 Pipe Fittings 141.47 166.34 168.00
97 Steel Products 161.94 170.08 170.12 98 Engines And Motors 109.07 109.07 109.07 99 Vacuum Pumps 115.39 115.39 115.39
100 Air Conditioners 172.67 181.12 181.12 101 Cultivators 189.23 226.90 226.90
102 Chuff Cutter 138.54 144.94 144.94 103 Tractors 161.96 193.29 193.29 104 Lathe Machines 147.68 174.96 208.81
105 Concrete Mixer 138.83 138.83 138.83 106 Refrige,Wash& Sew Mach, Iron,Fan 166.45 186.98 191.24
107 Electrical Wires 159.57 169.09 169.55 108 Lighting Equipments 148.22 163.43 162.71
109 Radio And Television 126.46 126.49 126.49 110 Motor Vehicles 171.79 181.77 181.93 111 Motor Cycles 125.19 125.41 125.41
112 Bicycles 177.87 180.99 180.99

State Bank of Pakistan
33
Table A12: Price Indices - Base 2007-08 = 100
Period CPI WPI SPI *
Overall Food Non-food Overall Food Non-Food
2008-09 117.03 123.12 113.38
118.93 119.68 118.45 123.26
2009-10 128.85 139.05 122.73
135.40 136.85 134.48 139.84
2010-11 146.45 164.10 135.87
164.17 159.26 167.28 164.02
2011-12
162.57 182.20 150.80 181.28 181.32 181.26 178.67 2012-13 174.53 195.18 162.16
194.61 197.21 192.95 189.64
2011 Apr 150.99 169.25 140.05
178.69 165.46 187.09 167.83
May 151.33 168.76 140.88
176.97 167.15 183.20 167.98
Jun 152.78 169.88 142.53
177.98 172.14 181.68 168.09
Jul 154.72 174.80 142.68
177.26 175.45 178.41 171.45
Aug 156.89 177.32 144.65
178.24 178.67 177.97 173.86
Sep 158.50 180.16 145.52
178.68 181.88 176.65 175.02
Oct 160.79 183.07 147.44
179.34 182.82 177.13 176.45
Nov 161.25 183.26 148.06
178.39 181.48 176.43 177.53
Dec 160.12 179.21 148.67
176.01 178.29 174.57 175.04
2012 Jan 162.58 181.90 151.00
179.99 178.95 180.65 178.25
Feb 163.07 180.69 152.51
180.99 177.56 183.17 178.63
Mar 164.98 183.46 153.90
182.20 180.41 183.34 180.79
Apr 168.00 187.43 156.35
185.48 184.45 186.13 184.03
May 169.93 187.75 159.25
189.46 186.57 191.29 184.88
Jun 169.99 187.35 159.58
189.37 189.36 189.37 188.14
Jul 169.57 190.72 156.89
190.05 193.92 187.59 183.98
Aug 171.09 192.47 158.27
191.99 195.30 189.89 186.47
Sep 172.44 193.80 159.64
192.66 195.81 190.66 188.21
Oct 173.10 193.66 160.77 192.88 196.21 190.77 187.32
Nov 172.42 193.03 160.07 192.16 193.02 191.61 187.35
Dec 172.82 192.97 160.74 192.98 195.49 191.39 187.95
2013 Jan 175.70 196.58 163.19 195.39 198.81 193.22 190.89
Feb 175.11 194.05 163.76 196.06 197.22 195.32 190.79
Mar 175.82 195.06 164.29 196.57 196.02 196.92 192.01
Apr 177.74 197.74 165.75 198.09 199.00 197.51 192.02
May 178.65 200.00 165.85 197.23 201.14 194.75 191.96
Jun 179.94 202.11 166.65
199.21 204.60 195.79 196.75
Jul 183.58 208.19 168.83 202.49 209.34 198.15 200.80
Aug 185.71 212.27 169.79 207.85 211.45 205.57 203.29
Sep 185.18 209.09 170.85 209.33 211.29 208.09 203.05
Oct 188.82 212.61 174.56
211.70 213.26 210.71 207.69
Nov 191.21 218.16 175.06 212.22 215.77 209.97 214.76
Dec 188.68 210.89 175.37
210.11 210.28 210.00 210.78
*: all groups combined
Inflation Monitor, December 2013
34
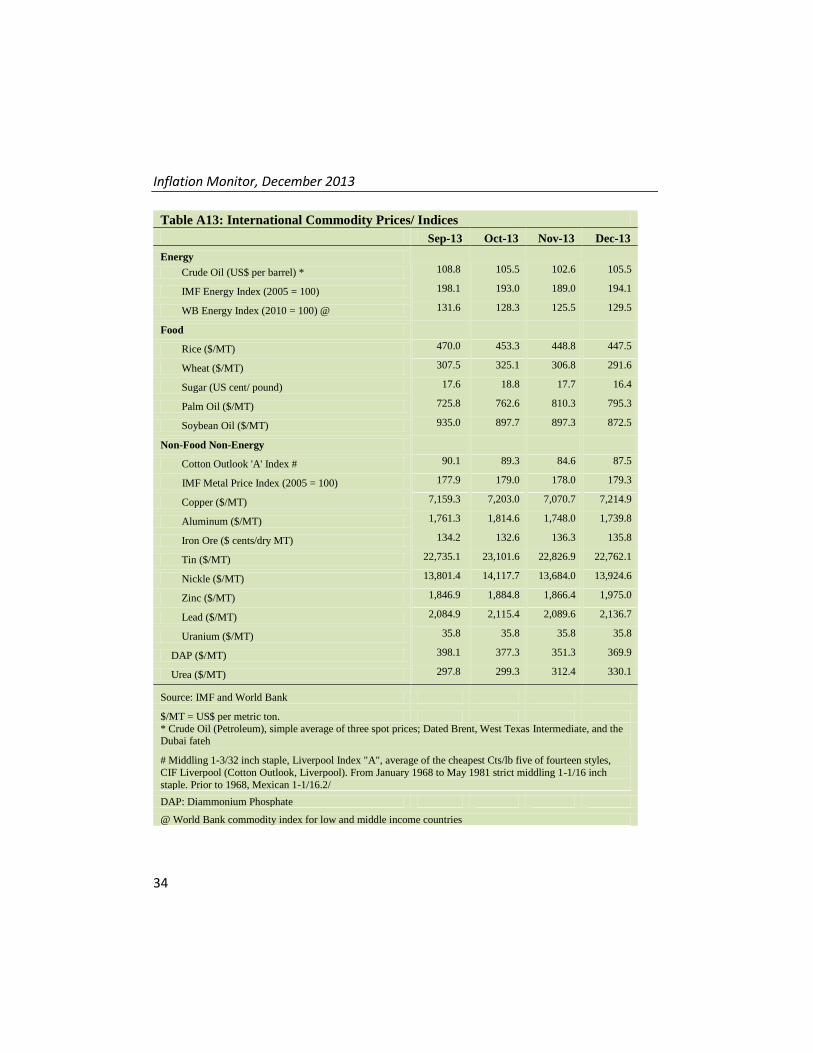
Table A13: International Commodity Prices/ Indices
Sep-13 Oct-13 Nov-13 Dec-13
Energy
Crude Oil (US$ per barrel) * 108.8 105.5 102.6 105.5
IMF Energy Index (2005 = 100) 198.1 193.0 189.0 194.1
WB Energy Index (2010 = 100) @ 131.6 128.3 125.5 129.5
Food
Rice ($/MT) 470.0 453.3 448.8 447.5
Wheat ($/MT) 307.5 325.1 306.8 291.6
Sugar (US cent/ pound) 17.6 18.8 17.7 16.4
Palm Oil ($/MT) 725.8 762.6 810.3 795.3
Soybean Oil ($/MT) 935.0 897.7 897.3 872.5
Non-Food Non-Energy
Cotton Outlook 'A' Index # 90.1 89.3 84.6 87.5
IMF Metal Price Index (2005 = 100) 177.9 179.0 178.0 179.3
Copper ($/MT) 7,159.3 7,203.0 7,070.7 7,214.9
Aluminum ($/MT) 1,761.3 1,814.6 1,748.0 1,739.8
Iron Ore ($ cents/dry MT) 134.2 132.6 136.3 135.8
Tin ($/MT) 22,735.1 23,101.6 22,826.9 22,762.1
Nickle ($/MT) 13,801.4 14,117.7 13,684.0 13,924.6
Zinc ($/MT) 1,846.9 1,884.8 1,866.4 1,975.0
Lead ($/MT) 2,084.9 2,115.4 2,089.6 2,136.7
Uranium ($/MT) 35.8 35.8 35.8 35.8
DAP ($/MT) 398.1 377.3 351.3 369.9
Urea ($/MT) 297.8 299.3 312.4 330.1
Source: IMF and World Bank
$/MT = US$ per metric ton.
* Crude Oil (Petroleum), simple average of three spot prices; Dated Brent, West Texas Intermediate, and the Dubai fateh
# Middling 1-3/32 inch staple, Liverpool Index "A", average of the cheapest Cts/lb five of fourteen styles,
CIF Liverpool (Cotton Outlook, Liverpool). From January 1968 to May 1981 strict middling 1-1/16 inch
staple. Prior to 1968, Mexican 1-1/16.2/
DAP: Diammonium Phosphate
@ World Bank commodity index for low and middle income countries
State Bank of Pakistan
35
Table 14. CPI Data Series Original and Seasonally Adjusted
Original Series
Period FY11 FY12 FY13 FY14
Jul 137.62 154.72 169.57 183.58
Aug 140.63 156.88 171.09 185.71
Sep 143.49 158.50 172.44 185.18
Oct 144.90 160.79 173.10 188.82
Nov 146.34 161.25 172.42 191.21
Dec 145.90 160.12 172.82 188.68
Jan 147.67 162.58 175.70
Feb 146.85 163.07 175.11
Mar 148.91 164.98 175.82
Apr 150.99 168.00 177.74
May 151.33 169.93 178.65
Jun 152.78 169.99 179.94
Seasonally Adjusted Series
Jul 137.43 154.50 169.28 182.91
Aug 139.72 155.81 169.85 184.32
Sep 142.58 157.49 171.37 184.02
Oct 143.74 159.47 171.71 187.31
Nov 145.57 160.38 171.45 190.08
Dec 146.72 161.05 173.88 189.84
Jan 147.86 162.77 175.88
Feb 148.05 164.43 176.58
Mar 149.79 165.98 176.92
Apr 150.98 167.93 177.63
May 151.82 170.54 179.35
Jun 153.41 170.73 180.79
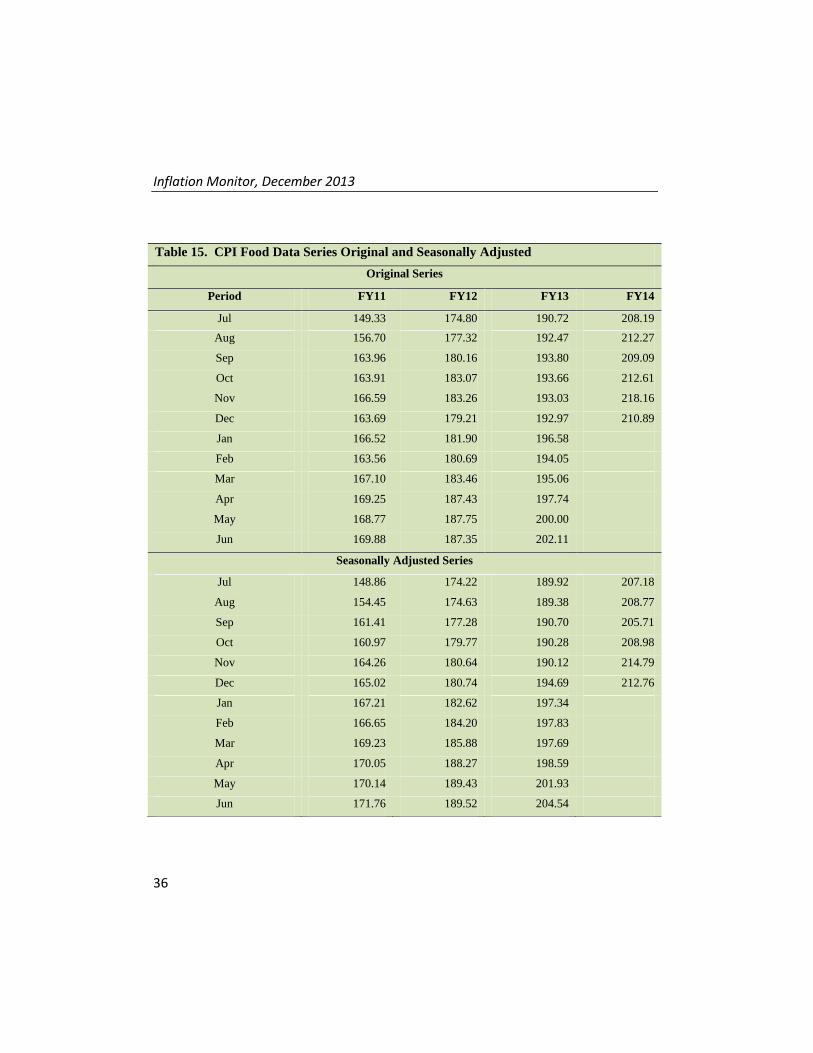
Inflation Monitor, December 2013
36
Table 15. CPI Food Data Series Original and Seasonally Adjusted
Original Series
Period FY11 FY12 FY13 FY14
Jul 149.33 174.80 190.72 208.19
Aug 156.70 177.32 192.47 212.27
Sep 163.96 180.16 193.80 209.09
Oct 163.91 183.07 193.66 212.61
Nov 166.59 183.26 193.03 218.16
Dec 163.69 179.21 192.97 210.89
Jan 166.52 181.90 196.58
Feb 163.56 180.69 194.05
Mar 167.10 183.46 195.06
Apr 169.25 187.43 197.74
May 168.77 187.75 200.00
Jun 169.88 187.35 202.11
Seasonally Adjusted Series
Jul 148.86 174.22 189.92 207.18
Aug 154.45 174.63 189.38 208.77
Sep 161.41 177.28 190.70 205.71
Oct 160.97 179.77 190.28 208.98
Nov 164.26 180.64 190.12 214.79
Dec 165.02 180.74 194.69 212.76
Jan 167.21 182.62 197.34
Feb 166.65 184.20 197.83
Mar 169.23 185.88 197.69
Apr 170.05 188.27 198.59
May 170.14 189.43 201.93
Jun 171.76 189.52 204.54

State Bank of Pakistan
37
Table 16: CPI Monthly & Average Seasonal Factors
Period FY11 FY12 FY13 FY14 Average
Jul 100.14 100.14 100.17 100.37 100.20
Aug 100.65 100.68 100.73 100.75 100.70
Sep 100.64 100.64 100.62 100.63 100.63
Oct 100.80 100.83 100.81 100.81 100.81
Nov 100.53 100.54 100.57 100.60 100.56
Dec 99.44 99.42 99.39 99.39 99.41
Jan 99.87 99.89 99.90 99.88
Feb 99.19 99.17 99.17 99.18
Mar 99.41 99.40 99.38 99.40
Apr 100.01 100.04 100.06 100.04
May 99.68 99.64 99.61 99.64
Jun 99.59 99.57 99.53 99.56
Table 17: CPI Food Monthly & Average Seasonal Factors
Period FY11 FY12 FY13 FY14 Average
Jul 100.31 100.34 100.42 100.49 100.39
Aug 101.46 101.54 101.63 101.68 101.58
Sep 101.58 101.62 101.63 101.64 101.62
Oct 101.82 101.84 101.78 101.74 101.79
Nov 101.42 101.45 101.53 101.57 101.49
Dec 99.20 99.15 99.12 99.12 99.15
Jan 99.59 99.61 99.61 99.60
Feb 98.15 98.10 98.09 98.11
Mar 98.74 98.70 98.67 98.70
Apr 99.53 99.55 99.57 99.55
May 99.19 99.11 99.04 99.11
Jun 98.91 98.86 98.81 98.86

Inflation Monitor, December 2013
38
Table 18: CPI Month-on-Month Change Original & Seasonally Adjusted
Original Series
Period FY11 FY12 FY13 FY14
Jul 2.07 1.27 -0.25 2.02
Aug 2.19 1.40 0.90 1.16
Sep 2.03 1.03 0.79 -0.29
Oct 0.98 1.44 0.38 1.97
Nov 0.99 0.29 -0.39 1.27
Dec -0.30 -0.70 0.23 -1.32
Jan 1.21 1.54 1.67
Feb -0.56 0.30 -0.34
Mar 1.40 1.17 0.41
Apr 1.40 1.83 1.09
May 0.23 1.15 0.51
Jun 0.96 0.04 0.72
Seasonally Adjusted Series
Jul 0.71 -0.85 1.17
Aug 1.67 0.85 0.34 0.77
Sep 2.05 1.08 0.89 -0.16
Oct 0.81 1.26 0.20 1.78
Nov 1.27 0.57 -0.15 1.48
Dec 0.79 0.42 1.42 -0.12
Jan 0.78 1.06 1.15
Feb 0.12 1.02 0.40
Mar 1.18 0.94 0.19
Apr 0.79 1.17 0.41
May 0.56 1.55 0.97
Jun 1.05 0.11 0.81

State Bank of Pakistan
39
Table 19: CPI Food Month-on-Month Change Original & Seasonally Adjusted Series
Original Series
Period FY11 FY12 FY13 FY14
Jul 1.84 2.90 1.80 3.01
Aug 4.93 1.44 0.92 1.96
Sep 4.64 1.60 0.69 -1.50
Oct -0.04 1.62 -0.07 1.68
Nov 1.64 0.10 -0.33 2.61
Dec -1.74 -2.21 -0.03 -3.33
Jan 1.73 1.50 1.87
Feb -1.77 -0.66 -1.29
Mar 2.16 1.53 0.52
Apr 1.28 2.16 1.37
May -0.28 0.17 1.14
Jun 0.66 -0.21 1.06
Seasonally Adjusted Series
Jul 1.43 0.21 1.29
Aug 3.75 0.24 -0.28 0.77
Sep 4.50 1.52 0.70 -1.46
Oct -0.27 1.40 -0.22 1.59
Nov 2.04 0.48 -0.09 2.78
Dec 0.46 0.06 2.41 -0.95
Jan 1.33 1.04 1.36
Feb -0.34 0.86 0.25
Mar 1.55 0.91 -0.07
Apr 0.48 1.29 0.46
May 0.05 0.62 1.68
Jun 0.95 0.04 1.29

Inflation Monitor, December 2013
40
-7-5-3-1135791113
-5
0
5
10
15
20
25
Clothing & Footwear
YoY 12mma MoM (RHS)
-7-5-3-1135791113
-5
0
5
10
15
20
25
Housing, Water, Elec, Gas and Other Fuels
-7
-5
-3
-1
1
3
5
7
9
11
13
-5
0
5
10
15
20
25
Health
-7
-5
-3
-1
1
3
5
7
9
11
13
-5
0
5
10
15
20
25
Furnishing & Household Equip. Maintenance etc
-7
-5
-3
-1
1
3
5
7
9
11
13
-5
0
5
10
15
20
25
Transport
-7-5-3-1135791113
-5
0
5
10
15
20
25
De
c-1
1
Feb
-12
Ap
r-1
2
Jun
-12
Au
g-1
2
Oct
-12
De
c-1
2
Feb
-13
Ap
r-1
3
Jun
-13
Au
g-1
3
Oct
-13
De
c-1
3
Recreation & Culture
-7
-5
-3
-1
1
3
5
7
9
11
13
-5
0
5
10
15
20
25
Communication
-7-5-3-1135791113
-5
0
5
10
15
20
25
De
c-1
1
Feb
-12
Ap
r-1
2
Jun
-12
Au
g-1
2
Oct
-12
De
c-1
2
Feb
-13
Ap
r-1
3
Jun
-13
Au
g-1
3
Oct
-13
De
c-1
3
Education
Figure A1: CPI Non-food Inflation (percent)

State Bank of Pakistan
41
Figure A2: Frequency Distribution of Price Changes of CPI Items, December 2013
0
20
40
60
80
100
0
20
40
60
80
100YoY price changes
Frequency (No. of items)
% cummulative frequency (RHS)
0
20
40
60
80
100
0
20
40
60
80
10012-month ma price changes
0
20
40
60
80
100
0
20
40
60
80
100
<-8
-8 to
-6
-6 to
-4
-4 to
-2
-2 to
0
0 to
2
2 to
4
4 to
6
6 to
8
8 to
10
10
to 1
2
12
to 1
4
14
to 1
6
16
to 1
8
18
to 2
0
>2
0
Price intervals in percent
12-month ma food price changes
0
20
40
60
80
100
0
20
40
60
80
100
<-8
-8 to
-6
-6 to
-4
-4 to
-2
-2 to
0
0 to
2
2 to
4
4 to
6
6 to
8
8 to
10
10
to 1
2
12
to 1
4
14
to 1
6
16
to 1
8
18
to 2
0
>2
0
Price intervals in percent
12-month ma non-food price changes

Inflation Monitor, December 2013
42
Figure A3: Frequency Distribution of Price Changes of WPI Commodities, December 2013
0
20
40
60
80
100
0
10
20
30
40
50
YoY price changes
Frequency (No. of items)
% cummulative frequency (RHS)
0
20
40
60
80
100
0
10
20
30
40
5012-month ma price changes
0
20
40
60
80
100
0
10
20
30
40
50
<-8
-8 to
-6
-6 to
-4
-4 to
-2
-2 to
0
0 to
2
2 to
4
4 to
6
6 to
8
8 to
10
10
to 1
2
12
to 1
4
14
to 1
6
16
to 1
8
18
to 2
0
>2
0
Price intervals in percent
12-month ma food price changes
0
20
40
60
80
100
0
10
20
30
40
50
<-8
-8 to
-6
-6 to
-4
-4 to
-2
-2 to
0
0 to
2
2 to
4
4 to
6
6 to
8
8 to
10
10
to 1
2
12
to 1
4
14
to 1
6
16
to 1
8
18
to 2
0
>2
0
Price intervals in percent
12-month ma non-food price changes

State Bank of Pakistan
43
Numbers in square brackets show the weights of respective groups in the CPI baskets.
`Figure A4: Group- wise/ Overall Inflation Diffusion Index (IDI) and respective/ overall YoY Inflation (percent)
-5
0
5
10
15
20
25
-60
-40
-20
0
20
40
60
80
100
120
Food & Non-Alcoholic Beverages Group
[34.83%]
FNAB-IDI (LHS) Overall-IDI (LHS)
FNAB Inflation-YoY Overall Inflation
-5
0
5
10
15
20
25
-60
-40
-20
0
20
40
60
80
100
120
Alcoholic Beverages & Tobacco Group [1.41%]
ABT-IDI (LHS) Overall-IDI (LHS)
ABT Inflation-YoY Overall Inflation
-5
0
5
10
15
20
25
-60
-40
-20
0
20
40
60
80
100
120
Furnishing & Household Equip. Group [4.21%]
FHE-IDI (LHS) Overall-IDI (LHS)
FHE Inflation-YoY Overall Inflation
-5
0
5
10
15
20
25
-60
-40
-20
0
20
40
60
80
100
120
Health Group [2.19%]
H-IDI (LHS) Overall-IDI (LHS)
H Inflation- YoY Overall Inflation
-5
0
5
10
15
20
25
-60
-40
-20
0
20
40
60
80
100
120
Transport Group [7.20%]
T-IDI (LHS) Overall-IDI (LHS)
T Inflation-YoY Overall Inflation
-5
0
5
10
15
20
25
-60
-40
-20
0
20
40
60
80
100
120
Recreation & Culture Group [2.02%]
RC-IDI (LHS) Overall-IDI (LHS)
RC Inflation- YoY Overall Inflation
-5
0
5
10
15
20
25
-60
-40
-20
0
20
40
60
80
100
120
Education Group [3.94%]
Edu-IDI (LHS) Overall-IDI (LHS)Edu Inflation-YoY Overall Inflation
-5
0
5
10
15
20
25
-60
-40
-20
0
20
40
60
80
100
120
Restaurant & Hotels Group [1.23%]
RH-IDI (LHS) Overall-IDI (LHS)
RH Inflation- YoY Overall Inflation
-5
0
5
10
15
20
25
-60-40-20
020406080
100120
De
c-1
1
Feb
-12
Ap
r-1
2
Jun
-12
Au
g-1
2
Oct
-12
De
c-1
2
Feb
-13
Ap
r-1
3
Jun
-13
Au
g-1
3
Oct
-13
De
c-1
3
Miscellaneous Group [2.76%]
Misc-IDI (LHS) Overall-IDI (LHS)Misc Inflation- YoY Overall Inflation
-5
0
5
10
15
20
25
-60-40-20
020406080
100120
De
c-1
1
Feb
-12
Ap
r-1
2
Jun
-12
Au
g-1
2
Oct
-12
De
c-1
2
Feb
-13
Ap
r-1
3
Jun
-13
Au
g-1
3
Oct
-13
De
c-1
3
Housing, Water, Elect. Gas Group [29.41%]
HWEG-IDI (LHS) Overall-IDI (LHS)
HWEG Inflation- YoY Overall Inflation
-5
0
5
10
15
20
25
-60-40-20
020406080
100120
De
c-1
1
Feb
-12
Ap
r-1
2
Jun
-12
Au
g-1
2
Oct
-12
De
c-1
2
Feb
-13
Ap
r-1
3
Jun
-13
Au
g-1
3
Oct
-13
De
c-1
3
Communication Group [3.22%]
Com-IDI (LHS) Overall-IDI (LHS)
Com Inflation- YoY Overall Inflation
-5
0
5
10
15
20
25
-60
-40
-20
0
20
40
60
80
100
120
Clothing & Footwear Group [7.57%]
CF- IDI (LHS) Overall-IDI (LHS)
CF Inflation- YoY Overall Inflation
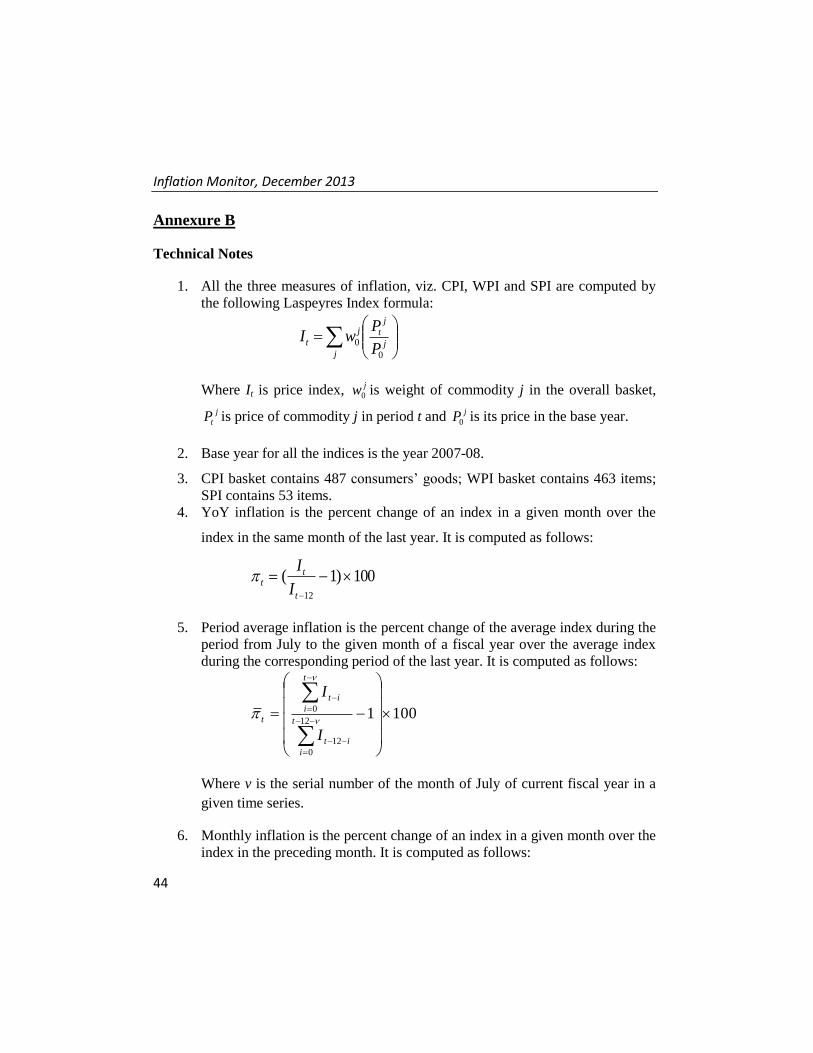
Inflation Monitor, December 2013
44
Annexure B
Technical Notes
1. All the three measures of inflation, viz. CPI, WPI and SPI are computed by
the following Laspeyres Index formula:
jj
j
tj
tP
PwI
0
0
Where It is price index, jw0 is weight of commodity j in the overall basket,
j
tP is price of commodity j in period t and jP0 is its price in the base year.
2. Base year for all the indices is the year 2007-08.
3. CPI basket contains 487 consumers’ goods; WPI basket contains 463 items;
SPI contains 53 items.
4. YoY inflation is the percent change of an index in a given month over the
index in the same month of the last year. It is computed as follows:
100)1(12
t
tt
I
I
5. Period average inflation is the percent change of the average index during the
period from July to the given month of a fiscal year over the average index
during the corresponding period of the last year. It is computed as follows:
100112
0
12
0
t
i
it
t
i
it
t
I
I
Where v is the serial number of the month of July of current fiscal year in a
given time series.
6. Monthly inflation is the percent change of an index in a given month over the
index in the preceding month. It is computed as follows:

State Bank of Pakistan
45
100)1(1
t
t
tI
I
7. 12-month moving average inflation (Long-run trend inflation) is the percent
change of 12-month moving average of a price index; it is computed as
follows:
1001~11
0
12
11
0
i
it
i
it
t
I
I
8. Core Inflation is defined as the persistent component of measured inflation
that excludes volatile and controlled prices. It reflects the normal supply and
demand conditions in the economy. Core inflation is computed by the
following three methods:
a) Non-food, Non-energy inflation (NFNE inflation); it is computed by
excluding food group and energy items (kerosene oil, petrol, diesel,
CNG, electricity and natural gas) from the CPI basket.
b) 20% trimmed-mean inflation; it is computed through the following
steps:
i. All CPI items are arranged in ascending order according to
YoY/12-month moving average/monthly/period average
changes in their price indices in a given month.
ii. 20 percent of the items showing extreme changes are
excluded with 10 percent of the items at the top of the list
(corresponding to cumulative weight of 90% or more) and
10 percent of the items at the bottom of the list
(corresponding to cumulative weight of 10 percent or less).
iii. The weighted mean of the changes in price indices of the
rest of the items is core inflation.
c) Relatively Stable Component of CPI (RSC-CPI) developed by State
Bank of Pakistan is a hybrid method based on permanent exclusion
criteria. Volatile price items, to be excluded in the newly proposed

Inflation Monitor, December 2013
46
measure RSC-CPI, are identified by analyzing the list and frequency
of commodities that have been trimmed frequently in the past while
computing monthly weighted trimmed mean measure. Commodities
that were trimmed out 13 and above times since July 2008 to
February 2013 are selected for permanently excluding from the CPI
basket. This newly developed component includes a mix of both
food and non-food commodities that show persistent price behavior.
Fifty Commodities included comprise relatively stable component
(RSC-CPI) with a weight of 67.69. The detailed methodology of
RSC-CPI and group wise items along their weights can be viewed at
the following link;
http://www.sbp.org.pk/publications/wpapers/2013/wp66.pdf
9. Weighted contribution of different items (or sub-groups) to total inflation is
worked out as below:
Let the overall index (It) is the weighted average of price indexes of
individual items or sub-groups (Iit), i.e.
i
itit IwI
The weighted contribution of a single item (or a sub-group) to overall
inflation is defined as below:
t
it
iitit wC
12
Where itC : Contribution of ith item to the overall inflation
12
12
12
t
it
itI
I ; i.e. ratio of item’s index to overall index in the
reference month

State Bank of Pakistan
47
iw : Weights of ith item
it : Inflation of ith item
t : Overall inflation
10. Annualized rate of inflation (based on a month-on-month rate ) is computed
as follows
Annualized = ((1+
)
12-1) 100
Methodology for Estimating Inflation Diffusion Index for Pakistan
We constructed an index to measure the spread of inflation in the 487 commodities of
the CPI basket. It is based on month-on-month (MoM) change in the prices of these
commodities and can be obtained by estimating what is known as an ‘inflation
diffusion index’ (IDI) as below:
Number of Commodities with ↑ in MoM change-Number of Commodities with ↓ in MoM change
Number of Commodities for which prices are reported
Thus, it is the difference between the share of items with increasing prices (i.e.
depicting inflation) and the share of items with falling prices (i.e. depicting deflation)
in CPI amongst the commodities for which prices have altered or remained constant1.
Based upon commodity level price data from July 2001 to February 2011 we
computed inflation diffusion indices overall (general) CPI basket and for all groups
in CPI basket (except House Rent Index being single item). A simple analysis2
suggests that IDI is a leading indicator for Pakistan’s YoY inflation.
1 We do not observe the prices of certain commodities (like the seasonal items) during certain periods of
time. To calculate the inflation diffusion index we consider the commodities for which prices have been
reported (irrespective of changed or not) during the month under review. 2 Formal test shows one way ‘Granger’ causality from IDI to YoY inflation.