inflation in bulgaria: convergence or eu-phoria? jianping zhou 1/ international monetary fund may 2,...
TRANSCRIPT

Inflation in Bulgaria:Convergence or EU-phoria?
Jianping Zhou1/
International Monetary Fund
May 2, 2007
1/ The views presented here are those of the author and are not to be interpreted as those of the IMF. Please do not quote without author’s permission.

Background/Motivation Bulgaria’s joining the euro zone now hinges on its ability to
reduce its inflation differential vis-à-vis the euro zone.
Remarkable progress was made over the last 10 years in bringing down the hyperinflation to a single-digit rate today.
However, inflation has risen in recent years and inflation gap widened, to 5 percentage points in 2006, although partly due one-off adjustments.
Large inflation gaps exist also in many other new EU member states (NMS).

Background/MotivationFigure 1. Bulgaria: Inflation, 1998-2006
(Annual average, in percent)
Source: WEO; Staff calculations.
Inflation in Bulgaria
0
2
4
6
8
10
12
14
16
18
20
1998 1999 2000 2001 2002 2003 2004 2005 2006
Inflation in 2006
0
1
2
3
4
5
6
7
8
Bulgaria
Rom
ania
Latvia
Slovak
Republic
Estonia
Hungary
Lithuania
Czech
Republic
Slovenia
Poland
Euro area
Best 3

Background/Motivation The government is committed to early adoption of the euro
and confident in reducing inflation.
There is increasing skepticism that the NMS will be able to fulfill the inflation criterion by their targeted dates for joining the euro (about three years from now for most of them) and whether they even should (Kopits, 2006).
Price convergence: closer integration with Europe significantly increased trade and capital flows, weakened “border effects” and reduced price dispersions (Rogers, 2007).
Income convergence: productivity catch-up
The Balassa-Samuelson effect: faster catch-up in tradables sector relative to nontradables sector

Background/Motivation The role of domestic policies may be limited (Mody and
Ohnsorge, 2006); a transitional recession might be necessary to depress inflation (Buiter and Grafe, 2002).
The persistence of inflation differentials across the euro area countries since the introduction of the euro also lends support to those opposing the inflation criterion.

Figure 2. Euro Area and Selected NMS Countries: Dispersion of Inflation Rates(12-month MA; in percent)
Sources: Eurostat; Staff calculations.
Euro Area
Max
Mean
Min
0
1
2
3
4
5
6
7
8
9
1997M1 1999M1 2001M1 2003M1 2005M1 2007M1
NMS countries with fixed exchange rates
Bulgaria
Max
Min
Mean
-2
0
2
4
6
8
10
12
14
16
1999M1 2000M1 2001M1 2002M1 2003M1 2004M1 2005M1 2006M1 2007M1
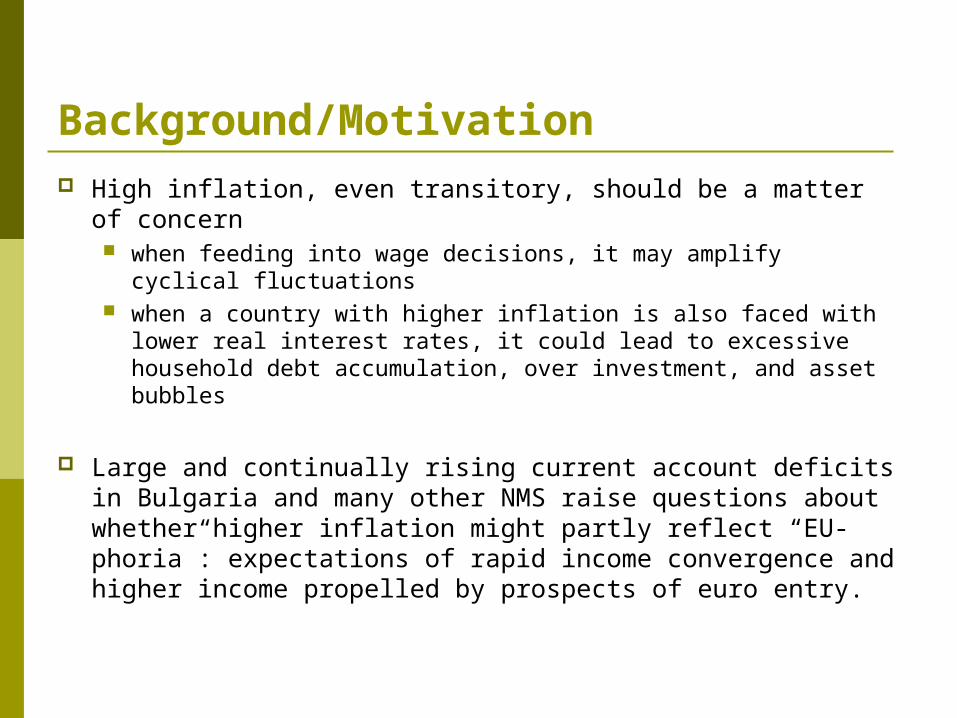
Background/Motivation High inflation, even transitory, should be a matter of
concern when feeding into wage decisions, it may amplify cyclical
fluctuations when a country with higher inflation is also faced with lower
real interest rates, it could lead to excessive household debt accumulation, over investment, and asset bubbles
Large and continually rising current account deficits in Bulgaria and many other NMS raise questions about whether higher inflation might partly reflect “EU-phoria”: expectations of rapid income convergence and higher income propelled by prospects of euro entry.
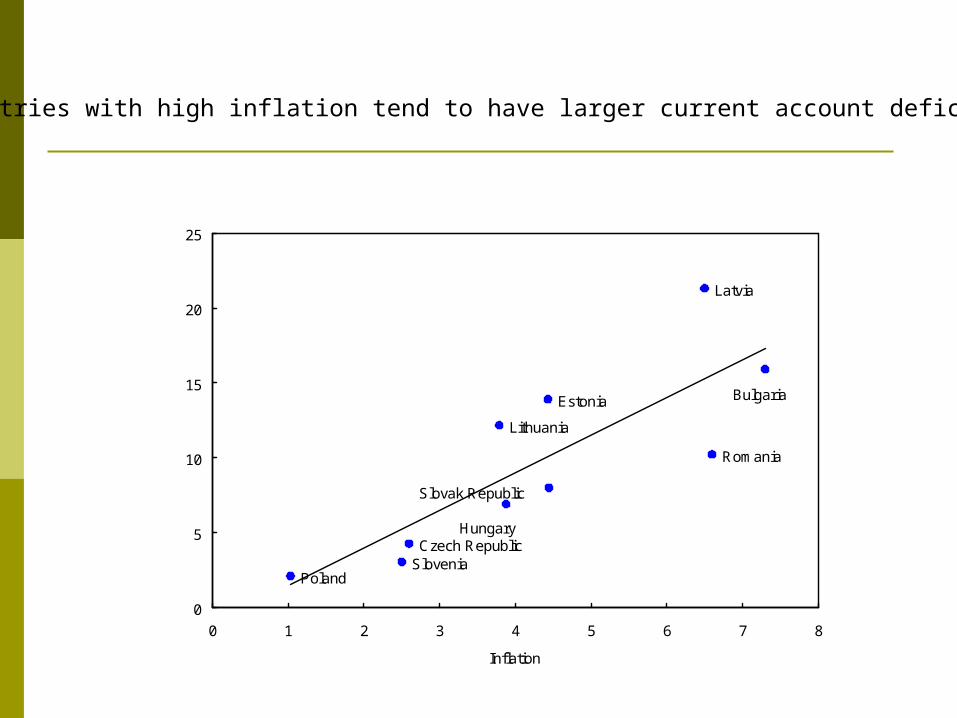
Figure 3. New EU Member States: Inflation and Current Account Deficit, 2006
Source: WEO and Staff calculations.
Slovenia
Slovak Republic
Romania
Poland
Lithuania
Latvia
Hungary
Estonia
Czech Republic
Bulgaria
0
5
10
15
20
25
0 1 2 3 4 5 6 7 8
Cur
rent
Acc
ount
Def
icit
(% o
f GD
P)
Inflation
Countries with high inflation tend to have larger current account deficits.

A summary Stylized facts about inflation in Bulgaria
A theoretical model Examines the impacts of the B-S and the EIC effects on
inflation, consumption, output, and the current account balance
Provides basis for the empirical framework
Empirical investigations Partial correlations and panel regressions
Preliminary results

Inflation gap was closed in 2003 (and inflation criteria met), but has widened since then
HICP Inflation
Bulgaria
Max
Min
Euroarea
-10
0
10
20
30
40
50
60
1999M1 2000M1 2001M1 2002M1 2003M1 2004M1 2005M1 2006M1 2007M1

The impact of administrative price adjustments
In 2006: 21 percent of the prices under the government control; a large increase in excise duties for tobacco.
This share is higher than in 2000 (17 percent).
Increases in these prices added about 1 percentage point to the average inflation rate.
it is not clear whether inflation would be lower without these price controls.
Inflation excluding these prices has been highly correlated with the overall inflation.

Higher inflation in the nontradables sector than in the tradables sector.
Figure 6. Bulgaria: Dual Inflation, 2001M1-2007M1(in percent, 12-month y-o-y)
Sources: Eurostat; Staff calculations.
-2
0
2
4
6
8
10
12
14
16
2001M1 2002M1 2003M1 2004M1 2005M1 2006M1 2007M1
Non-tradable
Tradable

Why would prices of nontradable goods increase faster? The Balassa-Samuelson effect
Relatively higher productivity growth in the tradables sector
Differences in market structures (e.g., the degree of competition) Mody and Ohnsorge, 2006 Arratibel and others, 2002
Expected faster income convergence Results from the theoretical model

The representative consumer with perfect foresight expectations maximize an intertemporal utility function.
1 1 2( ) ( )U u C u C
1 1( )
1
Cu C
1 1 1 1 1
(1 )t Tt NtC C C
1
1 1 1(1 )t Tt NtP P P
*TtP SP

The representative firm produces the trade and non-traded goods with the following production function:
T T TY A L
N N NY A L
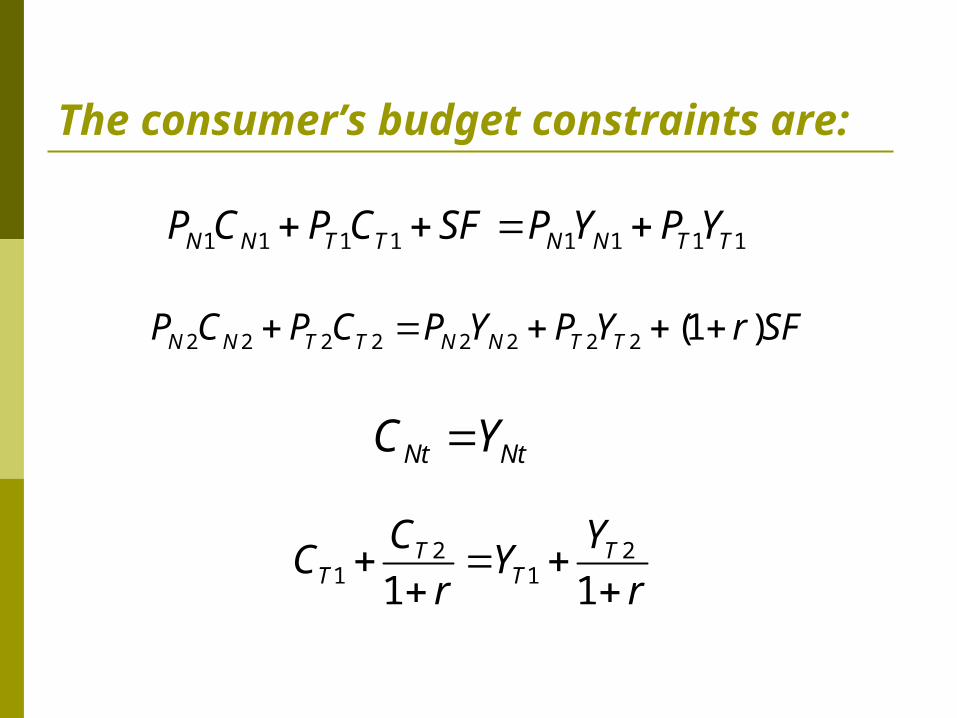
The consumer’s budget constraints are:
2 2 2 2 2 2 2 2 (1 )N N T T N N T TP C P C P Y P Y r SF
1 1 1 1 1 1 1 1N N T T N N T TP C P C SF P Y P Y
Nt NtC Y
2 21 11 1
T TT T
C YC Y
r r
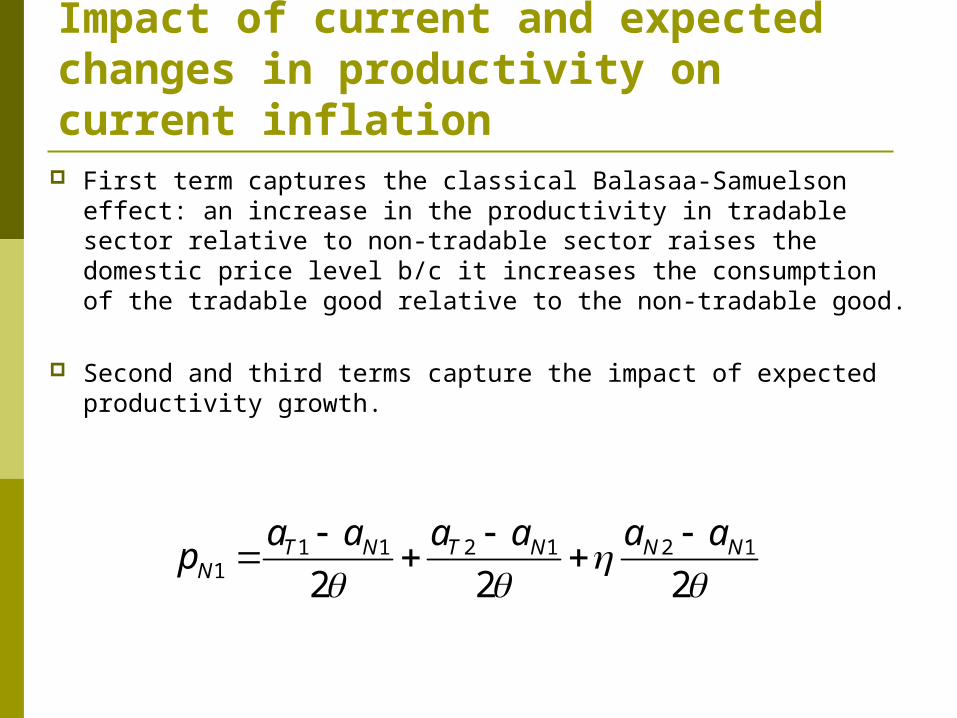
Impact of current and expected changes in productivity on current inflation
First term captures the classical Balasaa-Samuelson effect: an increase in the productivity in tradable sector relative to non-tradable sector raises the domestic price level b/c it increases the consumption of the tradable good relative to the non-tradable good.
Second and third terms capture the impact of expected productivity growth.
1 1 2 1 2 11 2 2 2
T N T N N NN
a a a a a ap

Impact of the B-S effect and expected productivity growth on inflation, consumption, output, and the current account balance
2 11
12 ( )
2N
ap a a
2 11 1
1( ) 2
2T Nc c a a a
1 1 2T Ny y a
2 11
1( )
2x a a
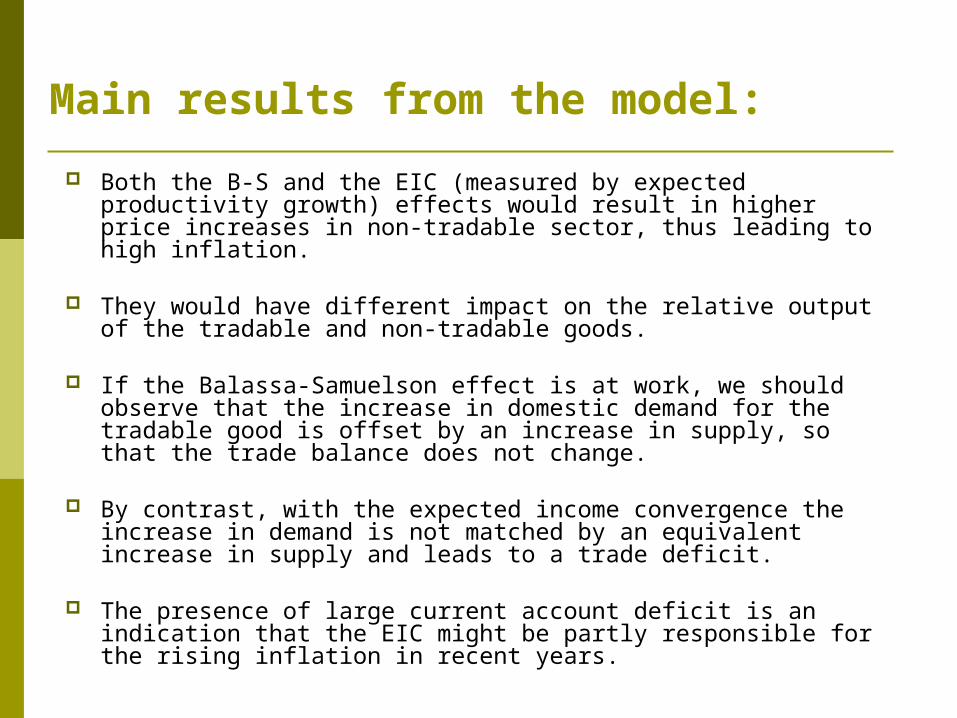
Main results from the model:
Both the B-S and the EIC (measured by expected productivity growth) effects would result in higher price increases in non-tradable sector, thus leading to high inflation.
They would have different impact on the relative output of the tradable and non-tradable goods.
If the Balassa-Samuelson effect is at work, we should observe that the increase in domestic demand for the tradable good is offset by an increase in supply, so that the trade balance does not change.
By contrast, with the expected income convergence the increase in demand is not matched by an equivalent increase in supply and leads to a trade deficit.
The presence of large current account deficit is an indication that the EIC might be partly responsible for the rising inflation in recent years.
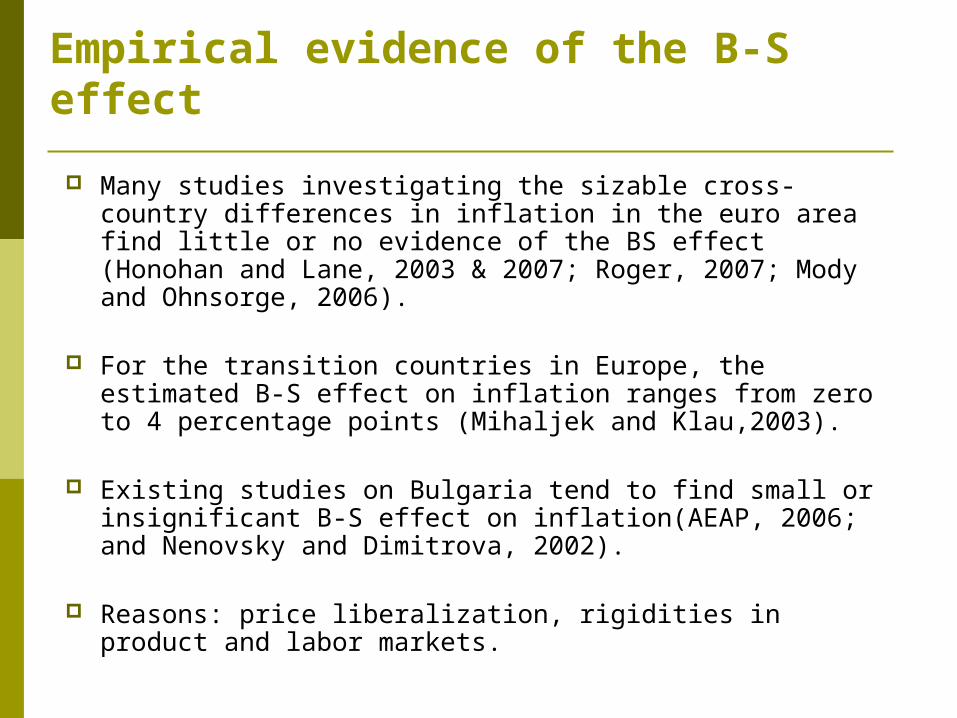
Empirical evidence of the B-S effect
Many studies investigating the sizable cross-country differences in inflation in the euro area find little or no evidence of the BS effect (Honohan and Lane, 2003 & 2007; Roger, 2007; Mody and Ohnsorge, 2006).
For the transition countries in Europe, the estimated B-S effect on inflation ranges from zero to 4 percentage points (Mihaljek and Klau,2003).
Existing studies on Bulgaria tend to find small or insignificant B-S effect on inflation(AEAP, 2006; and Nenovsky and Dimitrova, 2002).
Reasons: price liberalization, rigidities in product and labor markets.

Empirical evidence of the B-S effect
Prices of non-traded goods have been rising much faster than the prices of the traded goods, but not due to the BS effect.
Productivity has been rising faster in the nontradables sector, contrary to the B-S hypothesis.
Employment in the non-tradable sector grew much more rapidly than in the tradable sector.
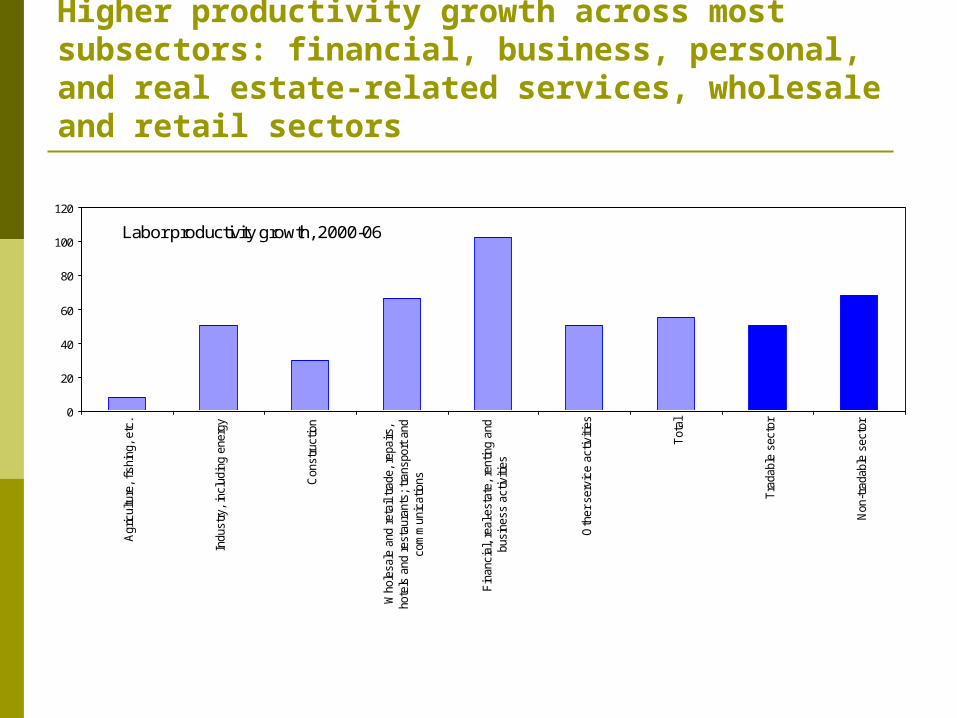
Higher productivity growth across most subsectors: financial, business, personal, and real estate-related services, wholesale and retail sectors
Labor productivity growth, 2000-06
0
20
40
60
80
100
120
Agr
icul
ture
, fis
hing
, et
c.
Indu
stry
, in
clud
ing
ener
gy
Con
stru
ctio
n
Who
lesa
le a
nd r
etai
l tra
de,
repa
irs,
hote
ls a
nd r
esta
uran
ts;
tran
spor
t an
dco
mm
unic
atio
ns
Fin
anci
al,
real
-est
ate,
ren
ting
and
busi
ness
act
iviti
es
Oth
er s
ervi
ce a
ctiv
ities
Tot
al
Tra
dabl
e se
ctor
Non
-tra
dabl
e se
ctor

Bulgaria is not alone ...Figure 10. Baltic Countries and Euro Zone: Sectoral Productivity, 2000-04
(in percent, accumulated growth)
Source: European Commission; Staff estimates.
-10
0
10
20
30
40
50
60
70
TOTAL MANUFACTURING,EXCLUDING ELECTRICAL
MARKET SERVICES, EXCLUDINGPOST AND
TELECOMMUNICATIONS
NON-MARKET SERVICES
EstoniaLatviaLithuaniaEuro zone
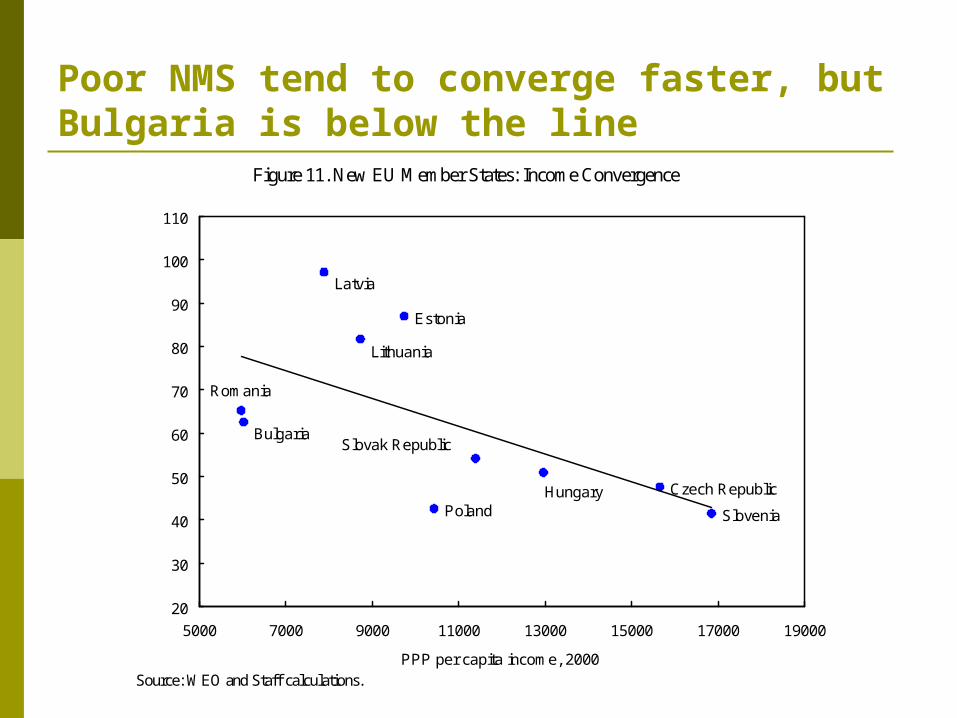
Poor NMS tend to converge faster, but Bulgaria is below the line
Figure 11. New EU Member States: Income Convergence
Source: WEO and Staff calculations.
Slovenia
Slovak Republic
Romania
Poland
Lithuania
Latvia
Hungary
Estonia
Czech Republic
Bulgaria
20
30
40
50
60
70
80
90
100
110
5000 7000 9000 11000 13000 15000 17000 19000
Incr
ease
in P
PP
per
cap
ita in
com
e, 2
000-
06
PPP per capita income, 2000

Convergence speed: Bulgaria (1%), vs. Ireland (2.5%).
PPP per capita income (% of euro area average)
0
10
20
30
40
50
60
70
80
90
Bulgaria Romania Poland Latvia Lithuania SlovakRepublic
Estonia Hungary CzechRepublic
Slovenia
2000
2006
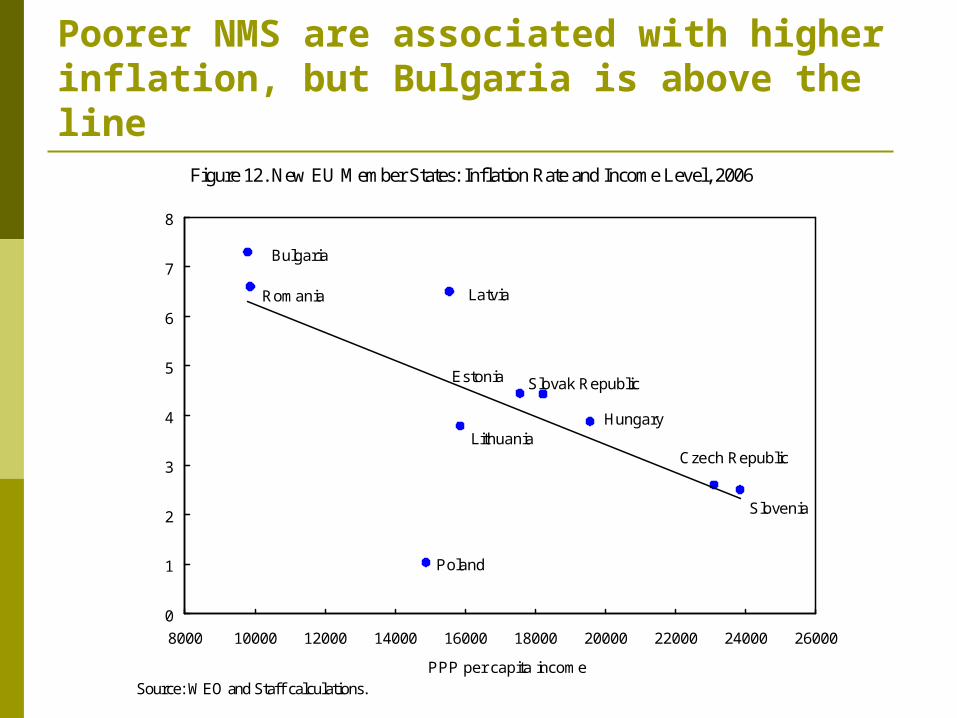
Poorer NMS are associated with higher inflation, but Bulgaria is above the line
Figure 12. New EU Member States: Inflation Rate and Income Level, 2006
Source: WEO and Staff calculations.
Slovenia
Slovak Republic
Romania
Poland
Lithuania
Latvia
Hungary
Estonia
Czech Republic
Bulgaria
0
1
2
3
4
5
6
7
8
8000 10000 12000 14000 16000 18000 20000 22000 24000 26000
Infla
tion
PPP per capita income

The convergence process has been accompanied by accelerated capital inflows, adding inflationary pressures
Figure 13. New EU Member States: Inflation Rate and Capital Inflows, 2006
Source: WEO and Staff calculations.
Slovenia
Slovak Republic
Romania
Poland
Lithuania
Latvia
Hungary
Estonia
Czech Republic
Bulgaria
-5
0
5
10
15
20
0 1 2 3 4 5 6 7 8
Cap
ital I
nflo
ws
(in p
erce
nt o
f GD
P)
Inflation

Based on the correlation in Figure 14, Bulgaria’s inflation should be about 4 percent
Figure 14. New EU Member States: Inflation and Income Convergence
Source: WEO and Staff calculations.
Bulgaria
Czech Republic
Estonia
Hungary
Latvia
Lithuania
Poland
Romania
Slovak Republic
Slovenia
0
1
2
3
4
5
6
7
8
30 40 50 60 70 80 90 100 110
CP
I in
flatio
n (
2006
)
Increase in PPP per capita income (2000-06)

Same holds for average inflation in 2004-06
Figure 14. New EU Member States: Inflation and Convergence
Source: WEO and Staff calculations.
Slovenia
Slovak Republic
Romania
Poland
Lithuania
Latvia
Hungary
Estonia
Czech Republic
Bulgaria
0
1
2
3
4
5
6
7
8
9
10
30 40 50 60 70 80 90 100 110
Ave
rage
CP
I in
flatio
n (2
004-
06)
Increase in PPP per capita income (2000-06)

Its current account deficit should be about 10 percent of GDP (similar to what implied by Blanchard & Giavazzi, 2002)
Figure 15. New EU Member States: Current Account Deficit and Income Convergence Income Level
Source: WEO and Staff calculations.
Bulgaria
Czech Republic
Estonia
Hungary
Latvia
Lithuania
Poland
RomaniaSlovak Republic
Slovenia
0
5
10
15
20
25
30 40 50 60 70 80 90 100 110
Ave
rage
CA
D (
2006
, % o
f G
DP
)
EU-phoria
Increase in PPP per capita income (2000-06; percent)

To the extent that CAB reflects expectations for higher future income, economic agents in Bulgaria appear to be becoming increasingly optimistic.
Figure 15. New EU Member States: Current Account deficit and Initial Income Level
Source: WEO and Staff calculations.
Bulgaria
Czech Republic
Estonia
Hungary
Latvia
Lithuania
Poland
RomaniaSlovak Republic
Slovenia
0
2
4
6
8
10
12
30 40 50 60 70 80 90 100 110
Ave
rage
CA
D (
2000
-06,
% o
f GD
P)
Increase in PPP per capita income (2000-06)
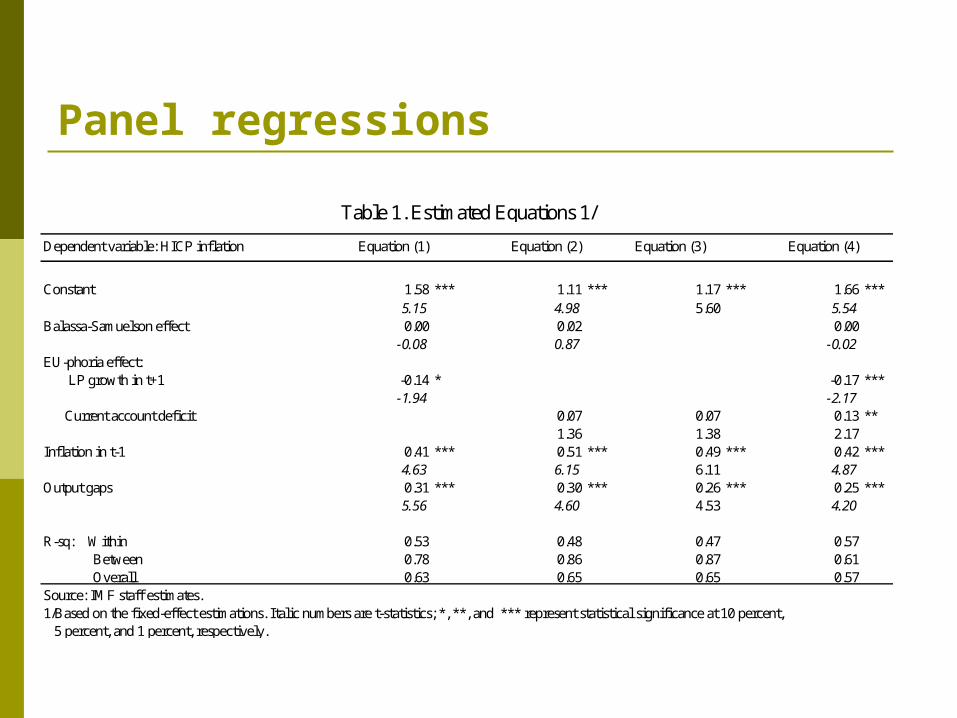
Panel regressions
Dependent variable: HICP inflation Equation (1) Equation (2) Equation (3) Equation (4)
Constant 1.58 *** 1.11 *** 1.17 *** 1.66 ***5.15 4.98 5.60 5.54
Balassa-Samuelson effect 0.00 0.02 0.00-0.08 0.87 -0.02
EU-phoria effect: LP growth in t+1 -0.14 * -0.17 ***
-1.94 -2.17 Current account deficit 0.07 0.07 0.13 **
1.36 1.38 2.17Inflation in t-1 0.41 *** 0.51 *** 0.49 *** 0.42 ***
4.63 6.15 6.11 4.87Output gaps 0.31 *** 0.30 *** 0.26 *** 0.25 ***
5.56 4.60 4.53 4.20
R-sq: Within 0.53 0.48 0.47 0.57 Between 0.78 0.86 0.87 0.61 Overall 0.63 0.65 0.65 0.57Source: IMF staff estimates.1/Based on the fixed-effect estimations. Italic numbers are t-statistics; *, **, and *** represent statistical significance at 10 percent, 5 percent, and 1 percent, respectively.
Table 1. Estimated Equations 1/
Preliminary results
We find no significant Balassa-Samuelson effect on inflation in Bulgaria.
It is possible that “EU-phoria” or expected rapid income convergence is partly responsible for the relatively higher inflation in Bulgaria.
Is inflation in Bulgaria too high? Past performances Standards set by certain countries (e.g., Ireland) Supply side polices needed to ensure rapid income
convergence

Concluding remarks The large current account deficit, buoyant credit growth, and
inflationary pressures all point to a certain degree of “EU-phoria”: expectations of faster convergence and higher future income.
The presence of the risks associated with unrealized expectations, either because of unexpected adverse external shocks or because of unsuccessful domestic policies to deliver expected high productivity growth, underlines the need for policy safeguards.
With the currency board arrangement in place, tight fiscal policy remains the key instrument in containing domestic demand and reducing overheating.
Other important measures would include prudent wage policies, strengthened financial regulation and supervisions, and last but most importantly, structural reforms to improve the flexibility of the economy.

Some caveats Empirical results are based on work in progress, and should
be interpreted with cautions. CAB may be capturing other effects, e.g., trade and financial
integration Data issues
Policy discussions emphasize on the risks associated with volatile expectations, not on whether these expectation are “exuberant”
Future work to better capture the degree of “EU-phoria” Stochastic expectations Engel and Rogers (2006): the expected future US growth is
measured by its expected future share of world GDP to its current share of world GDP