infiltration well to reduce the impact of land use changes ... filehessd 11, 5487–5513, 2014...
TRANSCRIPT

HESSD11, 5487–5513, 2014
Infiltration well toreduce the impact ofland use changes on
flood peaks
D. I. Kusumastuti et al.
Title Page
Abstract Introduction
Conclusions References
Tables Figures
J I
J I
Back Close
Full Screen / Esc
Printer-friendly Version
Interactive Discussion
Discussion
Paper
|D
iscussionP
aper|
Discussion
Paper
|D
iscussionP
aper|
Hydrol. Earth Syst. Sci. Discuss., 11, 5487–5513, 2014www.hydrol-earth-syst-sci-discuss.net/11/5487/2014/doi:10.5194/hessd-11-5487-2014© Author(s) 2014. CC Attribution 3.0 License.
This discussion paper is/has been under review for the journal Hydrology and Earth SystemSciences (HESS). Please refer to the corresponding final paper in HESS if available.
Infiltration well to reduce the impact ofland use changes on flood peaks: a casestudy of Way Kuala Garuntang catchment,Bandar Lampung, Indonesia
D. I. Kusumastuti1, D. Jokowinarno1, S. N. Khotimah1, C. Dewi2, and F. Yuniarti3
1Civil Engineerring Department, Engineering Faculty, University of Lampung,Lampung, Indonesia2Study Program of Survey and Mapping, Engineering Faculty, University of Lampung,Lampung, Indonesia3Magister of Civil Engineering, University of Lampung, Lampung, Indonesia
Received: 6 May 2014 – Accepted: 13 May 2014 – Published: 26 May 2014
Correspondence to: D. I. Kusumastuti ([email protected])
Published by Copernicus Publications on behalf of the European Geosciences Union.
5487

HESSD11, 5487–5513, 2014
Infiltration well toreduce the impact ofland use changes on
flood peaks
D. I. Kusumastuti et al.
Title Page
Abstract Introduction
Conclusions References
Tables Figures
J I
J I
Back Close
Full Screen / Esc
Printer-friendly Version
Interactive Discussion
Discussion
Paper
|D
iscussionP
aper|
Discussion
Paper
|D
iscussionP
aper|
Abstract
Significant land use changes due to rapid development, a central issue in Bandar Lam-pung and high rainfall intensity are the main triggers for frequent flooding. This studywas carried out to define design rainfall intensity based on analysis of hourly temporalrainfall pattern for calculating design discharge, predict the impact of land use changes5
on flood peaks, and predict the impact of infiltration well on flood peak reduction. Theresults showed that rainfall distribution pattern for storm duration of 4 h are 40, 35,20 and 5 % for the first, second, third and fourth hour, respectively. Analysis on landuse changes underlined that if 30 % of the catchment area is maintained for greenland then flood peaks can be decreased. However, with city development, land con-10
versions are intended for settlements, industries and trading areas which will increaseflood peaks significantly. Application of infiltration well in the catchment can reducesurface runoff depends on the density and dimension of the well. The results suggestthat using infiltration well with diameters between 0.8 to 1.4 m which are applied eachin every 4000 m2 of land area will reduce flood peaks from 6.9 to 12.6 %. While the15
application of infiltration well with density of 500 m2 will reduce flood peaks from 55.21to 99.8 %. Commitment and relevant government policies and community participationwill encourage to undertake flood reduction measures.
1 Introduction
Flooding often occurs in several locations in Indonesia during wet season, that include20
Bandar Lampung, the capital city and economic hub of Lampung Province and the en-try point to Sumatra. The province is located on Southeast Sumatera island. The city’sarea is about 169.21 km2, with a population of approximately 881 801 people (Bappeda,2010). Over the last two decades the city has shown significant increase in populationand economic growth. Recently several flooding events in the city had caused inun-25
dation. In one instance several patients were evacuated from a public hospital located
5488

HESSD11, 5487–5513, 2014
Infiltration well toreduce the impact ofland use changes on
flood peaks
D. I. Kusumastuti et al.
Title Page
Abstract Introduction
Conclusions References
Tables Figures
J I
J I
Back Close
Full Screen / Esc
Printer-friendly Version
Interactive Discussion
Discussion
Paper
|D
iscussionP
aper|
Discussion
Paper
|D
iscussionP
aper|
near a river. Landslide in a canal within the Bumi Kedaton National Park caused severedamage on road and bridge, the central town was inundated for few hours and causedmassive traffic jam and some casualties.
The most common causes of flooding are high rainfall intensity, land use changes,reduced infiltrated area, insufficient drainage system and reduced river capacity. Sig-5
nificant land use changes due to rapid development in most part of Indonesia’s largercities are considered as one of the major cause of flooding. The land use changesinclude urbanisation, deforestation and industralisation. The changes in land use as-sociated with urban development contribute to flooding in terms of the peak discharge,volume, and frequency of floods.10
The effect of land use changes on hydrologic response has gathered interest amongresearchers recently due to intensified developments in developing countries (Ashagrieet al., 2006; Doe et al., 1996). Numbers of researches use GIS based model to evaluatethe impacts of land use changes on hydrologic response (Gumindoga, 2010; Hacket,2009; He and Hogue, 2012; Juahir et.al., 2010; Koch et al., 2012; Camorani et al.,15
2005; Nobert and Jeremiah, 2012). Beside surface hydrology responses, the effectof land use changes on groundwater hydrology is also becoming a research interest(DeSmedt and Batelan, 2001). This study investigates the impact of land use changeson surface runoff that contribute flood discharge.Information about streamflow and theimpact of land use changes to the flow can help communities reduce their current and20
future vulnerability to floods.Flood peak is influenced by many factors, including the intensity and duration of
storms. In common engineering practice there is the specification of a rainfall eventas design rainfall which must reflect required levels of protection, local climate, andcatchment conditions as well as to ensure safe, economical and standardised design.25
Design rainfall temporal patterns are used to represent the typical variation of designrainfall intensities during a typical storm burst. A number of hydrology analyses in In-donesia used van Breen method to determine design rainfall intensity, a method whichconsiders temporal distribution of rainfall within the design rainfall (Ilmiaty et al., 2012;
5489

HESSD11, 5487–5513, 2014
Infiltration well toreduce the impact ofland use changes on
flood peaks
D. I. Kusumastuti et al.
Title Page
Abstract Introduction
Conclusions References
Tables Figures
J I
J I
Back Close
Full Screen / Esc
Printer-friendly Version
Interactive Discussion
Discussion
Paper
|D
iscussionP
aper|
Discussion
Paper
|D
iscussionP
aper|
Kusumastuti, 2009). Van Breen method was developed in the early twentieth centuryusing rainfall data of Java Island, Indonesia. The temporal distribution of rainfall withinthe design storm is an important factor that affects the runoff volume and magnitudeand timing of the peak discharge.
Increase in settlements, industries, trading and roads due to rapid development of5
Bandar Lampung city has a dire consequence on flooding. To reduce the impact offlooding, use of infiltration wells was investigated. Infiltration well is one of water con-servation techniques which help reducing surface runoff and peak flow. Study aboutinfiltration well in indonesia was initiated by Sunjoto (1988). It was based on the con-cept of natural water balance as a part of hydrological cycle (Sunjoto, 1993, 1994).10
When the ground surface is permeable, some precipitation will infiltrate naturally andthe rest as runoff along the ground surfaces. However, massive land use changes inrecent times promote more runoff because much of ground area is covered by im-pervious layers such as roofs and pavements which prohibit water infiltration process.Infiltration well will be ideal in this situation because collected water from roof and chan-15
nels can be directed to the wells for infiltration (Fig. 1). Some researches on infiltrationwell found that with appropriate well dimensions and numbers, it can reduce surfacerunoff significantly. Furthermore, the application of infiltration well support the policy ofzero delta discharge which limits water discharge to drainage system (Arafat, 2008;Iriani et al., 2013; Indriatmoko, 2013).20
Study area for this research is Way Kuala Garuntang catchment, one of the twomajor catchments in Bandar Lampung, has an area of 63.9 km2 and lies across thecentre of the city (Fig. 2). The catchment experienced frequent flooding due to sig-nificant land use changes. This research will focus on how land use changes in theWay Kuala Garuntang catchment influence the hydrologic responses. The hydrologic25
analysis using rational method was applied on some land use change scenarios to seethe changes of peak flow of Way Kuala Garuntang catchment. Design rainfall intensityanalysis was also carried out to support the rational method calculation in the begin-ning of hydrologic analysis. Finally, analysis of the impact of infiltration well in the Way
5490

HESSD11, 5487–5513, 2014
Infiltration well toreduce the impact ofland use changes on
flood peaks
D. I. Kusumastuti et al.
Title Page
Abstract Introduction
Conclusions References
Tables Figures
J I
J I
Back Close
Full Screen / Esc
Printer-friendly Version
Interactive Discussion
Discussion
Paper
|D
iscussionP
aper|
Discussion
Paper
|D
iscussionP
aper|
Kuala Garuntang catchment to reduce flood discharge was carried out. The aim of thisstudy is (1) to define design rainfall intensity based on analysis of hourly temporal rain-fall pattern, (2) to predict the impact of land use changes on flood peaks, and (3) topredict the impact of infiltration well on flood peak reduction.
2 Methodology5
Four scenarios of land use changes were applied on a simple rainfall–runoff model, us-ing rational method to see the pattern of flood peak generated by the catchment. Thestudy also concerns to the effort for flood reduction in Way Kuala Garuntang catchmentby using infiltration well. Land slope, the depth of shallow ground water and infiltrationrate are important considerations for determining the area for infiltration well. Quan-10
tum GIS was used in the study Way Kuala Garuntang catchment in order it fulfill therequirement for the application of infiltration well.
2.1 Rainfall–runoff model of land use change scenarios
This study focuses on peak discharge rather than the hydrograph, hence a simplerainfall–runoff method was utilized. The rational method is widely used to calculate15
runoff producing potential of a catchment and form as the basis for many small struc-ture designs. The application of rational method is valid for predicting runoff in a smallcatchment (ASCE, 1992). The area of the catchment is larger than specified in ASCE(1992), but rational method was adopted in this study not to predict runoff precisely,rather the method occupied to get insight of the effect of land use changes on runoff.20
Application of the rational method is based on a simple formula that relates runoffproducing potential of the watershed, rainfall intensity for a particular length of time (thetime of concentration), and the watershed drainage area. The formula is
Q = Cu ·C · I ·A (1)
5491

HESSD11, 5487–5513, 2014
Infiltration well toreduce the impact ofland use changes on
flood peaks
D. I. Kusumastuti et al.
Title Page
Abstract Introduction
Conclusions References
Tables Figures
J I
J I
Back Close
Full Screen / Esc
Printer-friendly Version
Interactive Discussion
Discussion
Paper
|D
iscussionP
aper|
Discussion
Paper
|D
iscussionP
aper|
where, Q =design discharge (m3 s−1), Cu =unit conversion coefficient, C = runoff co-efficient (dimensionless), I =design rainfall intensity (mm h−1), A = catchment area(km2).
2.1.1 Design rainfall intensity
Design rainfall intensity, I , varies according to geographic location and design excee-5
dence frequency or return period. The longer the return interval (hence, the lower theexceedence frequency), the greater the precipitation intensity for a given storm dura-tion. Series of hourly rainfall data 2001–2012 were obtained from the Meteorologicaland Climatology Berueu Panjang, Lampung Province. The data was not complete, nodata for year 2002 and some missing months for others. The average annual rainfall10
was between 1500–2500 mm, with wet season occurs beween October to April and dryseason occurs between April to October.
The series of hourly rainfall data was grouped according to storm durations, withthe shortest and longest durations are 3 and 8 h, respectively. Minimum storm depthconsidered in the analysis is 20 mm. Analysis of rainfall intensity pattern for each storm15
duration initially was done by calculating the percentage of storm depth occurs in a par-ticular storm event compared to total storm depth occurs during that day (within 24 h).Next, the percentage of hourly rainfall pattern is calculated by comparing hourly rain-fall to storm depth. Design rainfall intensity was selected as the highest percentageof hourly rainfall pattern. Flood frequency analyses were used to estimate the proba-20
bility of the occurrence of a given hydrologic event. Once design rainfall intensity forparticular return period was estimated, flood peaks can be calculated using rationalmethod.
2.1.2 Runoff coefficient
Runoff coefficient plays an important role in catchment management as it can be used25
as surface runoff indicator in a catchment and flood estimation. To estimate runoff
5492

HESSD11, 5487–5513, 2014
Infiltration well toreduce the impact ofland use changes on
flood peaks
D. I. Kusumastuti et al.
Title Page
Abstract Introduction
Conclusions References
Tables Figures
J I
J I
Back Close
Full Screen / Esc
Printer-friendly Version
Interactive Discussion
Discussion
Paper
|D
iscussionP
aper|
Discussion
Paper
|D
iscussionP
aper|
coefficient for Way Kuala Garuntang catchment, it requires runoff coefficient for eachland use in Way Kuala Garuntang catchment. Land uses in Way Kuala Garuntangcatchment (Bappeda, 2010) and corresponding runoff coefficients (Triatmojo, 2008)are mining area (0.95), residential (0.65), industry purposes (0.55), vacant land (0.4),trading area (0.8), government office (0.75), tourism area (0.8), industry area (0.85),5
preserved area (0.3), agriculture (0.35), public service area (0.75), road (0.9) and dou-ble track railway (0.35). Industry purpose area differs from industry area as industrypurpose area is an area reserved for future development, while industry area is anarea that has already been occupied with industries.
2.1.3 Scenarios for sensitivity analysis of land use10
Figure 3 presents the existing distribution of land uses in Way Kuala Garuntangcatchment: mining area (0.4 %), settlement (54.14 %), industry purpose(4.1 %), vacantland (31.22 %), trading and service area (1.79 %), government office area (0.23 %),tourism area (0.04 %), industry area (0.38 %), preserved area (0.46 %), agriculturearea (4.72 %), public service area (1.28 %), road area (1.16 %) and double track railway15
(0.07 %) (Bappeda, 2010).To understand the impact of land use on flood peak, this study considers four sce-
narios in the sensitivity analysis of land use. In Scenario 1, all vacant land is convertedinto green land. Based on Regional Spatial Plan of Bandar Lampung 2010–2030 ap-proximately 30 % of the area is reserved for green land. In Scenario 2, all vacant land20
is converted into green land (as in Scenario 1) and half of the agriculture area is con-verted into settlement and industry purpose.
Scenarios 3 and 4 consider different land use changes from Scenarios 1 and 2.In Scenario 3 all vacant land is converted into industry area and half of the settlementinto trading and service. Nowadays there is tendency in Bandar Lampung to build ruko,25
a term in Indonesia meaning home and store which being used for living as well as trad-ing and services. A ruko usually consists of three or more storeys, where the first storeyis used as store and second and third storeys are used as home. Scenario 4 considers
5493

HESSD11, 5487–5513, 2014
Infiltration well toreduce the impact ofland use changes on
flood peaks
D. I. Kusumastuti et al.
Title Page
Abstract Introduction
Conclusions References
Tables Figures
J I
J I
Back Close
Full Screen / Esc
Printer-friendly Version
Interactive Discussion
Discussion
Paper
|D
iscussionP
aper|
Discussion
Paper
|D
iscussionP
aper|
the convertion of all vacant land into industry area and a quarter of the settlement areainto trading and services. Scenarios 3 and 4 assume that despite the projection of veryhigh population by 2030, it will not require more land for settlement as more people willlive in appartment and ruko. Significant growth of industries requires more space andhence the policy to preserve 30 % of the area for green land cannot be maintained.5
Description about land use and corresponding percentage of the catchment area foreach scenario above is presented in Table 1.
2.2 Infiltration well application
In its application, the natural condition of the area should be checked whether the areafulfill the requirement of National Standard such as (1) land permeability should be10
more than 2 cm h−1, (2) shallow ground water level is greater than 3 m below groundlevel in wet season and (3) land slope is less than 30◦. In this study the conditions ofWay Kuala Garuntang catchment were established by using maps of land permeability,shallow groundwater level and land slope of Way Kuala Garuntang catchment withexisting land use map to determine suitable areas for the application.The number of15
infiltration well can be calculated as follows (Suripin, 2004).
The number of wells =Qrunoff
Qwell
=Qrunoff
(Awell base × V )+ (Awell wall × V )
=Qrunoff(
π ·Φ2design ×K
)+ (2 ·π ·Φdesign ·hdesign ×K )
(2)
20
where Qrunoff is daily peak flow in 1 day (m3 day−1), Qwell is total runoff collectedin a well within 1 day (m3 day−1), Qwell is calculated based on infiltration well dis-charge (m3 day−1) and wall infiltration well discharge (m3 day−1), K is land permeability
5494

HESSD11, 5487–5513, 2014
Infiltration well toreduce the impact ofland use changes on
flood peaks
D. I. Kusumastuti et al.
Title Page
Abstract Introduction
Conclusions References
Tables Figures
J I
J I
Back Close
Full Screen / Esc
Printer-friendly Version
Interactive Discussion
Discussion
Paper
|D
iscussionP
aper|
Discussion
Paper
|D
iscussionP
aper|
coefficient (m day−1), Φdesign is well radius (m), Awell base is well base area (m2), Awell wall
is well wall area (m2) and hdesign is well depth (m).
3 Result and discussion
The characteristics of the storm data analysed in this study are presented in Fig. 4.For storm duration 3 to 8 h the average of total storm depths is between of 38.98 to5
62.47 mm (Fig. 4a), standard deviation is between 12.19–36.02 mm (Fig. 4b), mini-mum storm depth is between 20 to 40.5 mm and maximum storm depth is between57.8 to 145 mm (Fig. 4c). From the available hourly rainfall data, there were 34.15,26.83, 13.41, 14.63, 4.88 and 6.10 % storm events for storm duration of 3, 4, 5, 6, 7and 8 h, respectively (Fig. 4d). Figure 4 shows that the trend of average storm depth,10
standard deviation and minimum storm depth increase as storm duration increases.However, maximum storm depth tends to decrease as storm duration increases.
The result shows that the most common storm event has 3 h duration, followed by4 h duration. Storm event with duration of 5 and 6 h have similar percentage of occur-rences, but have less significant percentage of event compared to the event with 3 and15
4 h duration. The percentage of occurrences for storm duration of 7 and 8 h are similarbut they have the least percentage of occurrences compared to others. Storm depth ofthe event compared to storm depth within 24 h shows that the percentage is between87 to 97 %.
Storm event with the duration of one and two hours are not taken into account as20
the duration is too short and in most events, they are followed by another storm eventwhich have longer storm duration and higher storm depth.
Further investigation on hourly storm distribution is done to understand the distri-bution pattern. Figure 5 shows the percentage of hourly storm distribution for stormduration 3 to 8 h. There are similar trend for all storm duration that the percentage of25
storm distribution at early hours are relatively high compared to that toward the end
5495

HESSD11, 5487–5513, 2014
Infiltration well toreduce the impact ofland use changes on
flood peaks
D. I. Kusumastuti et al.
Title Page
Abstract Introduction
Conclusions References
Tables Figures
J I
J I
Back Close
Full Screen / Esc
Printer-friendly Version
Interactive Discussion
Discussion
Paper
|D
iscussionP
aper|
Discussion
Paper
|D
iscussionP
aper|
hours. For storm duration of 3 h (Fig. 5a), the percentage of storm depth distributionis 40, 50 and 10 % for the first, second and third hour, respectively. For storm duration4 h (Fig. 5b), the percentage of hourly storm distribution is 40, 35, 20 and 5 % for thefirst, second, third and fourth hour, respectively. It can be seen that the highest per-centage of storm depth distribution occurs at second and first hour at storm duration5
3 and 4 h, respectively. While for storm duration of 5 h (Fig. 5c), the first and secondhours have the same percentage, i.e. 30 % and for storm duration 7 h (Fig. 5e) have thesame percentage, i.e. 20 %. For storm durations 6 and 8 h (Fig. 5d and 5f), the highestpercentage of storm duration distribution occurs at second hour.
Relating the result of this study with van Breen method, there are some similarity and10
differences. The similarity is the comparison between depth of storm event comparedto that of storm fall in 24 h. Van Breen defined that 90 % of the rain in one day fell infour hours. This study shows that approximately 90 % of the rain in one day falls in onestorm event. Furthermore, for storm duration of 4 h, the highest percentage of stormdepth distribution defined in the method was 40 %. The difference between result of15
this study and van Breen method is in the distribution patterns. Van Breen illustratedthat distribution of storm depth was low in first hour, and significantly high in the secondand third hours and considerably decreases in the fourth hour. While the results of thestudy show that the distribution pattern was high in beginning hours and significantlylow toward the end (Fig. 6).20
Using the finding, design rainfall intensity for Way Kuala Garuntang catchment canbe calculated as 40 of 90 % of design rainfall (in one day). Calculated design rain-fall intensity for 2, 5 and 10 year return periods are 24.67, 27.71 and 29.20 mm h−1,respectively.
3.1 Land use25
Simulations on land uses in Way Garuntang catchment was done using Quantum GISas presented in Fig. 7. Based on runoff coefficient for various land uses in Way Garun-tang catchment as well as proportion of catchment area associated with particular land
5496

HESSD11, 5487–5513, 2014
Infiltration well toreduce the impact ofland use changes on
flood peaks
D. I. Kusumastuti et al.
Title Page
Abstract Introduction
Conclusions References
Tables Figures
J I
J I
Back Close
Full Screen / Esc
Printer-friendly Version
Interactive Discussion
Discussion
Paper
|D
iscussionP
aper|
Discussion
Paper
|D
iscussionP
aper|
use as presented in Table 1, the composite runoff coefficient for existing condition, Sce-nario 1 (Fig. 7a), Scenario 2 (Fig. 7b), Scenario 3 (Fig. 7c) and Scenario 4 (Fig. 4d)are 0.56, 0.45, 0.47, 0.74 and 0.72, respectively. For the existing condition, using calcu-lated design rainfall intensity and composite runoff coefficient for the catchment, designflood for 5 year return period is 260.95 m3 s−1.5
Simulation on land use impact as presented in Fig. 8 shows that the results can becategorised into two groups. Simulation results using Scenarios 1 and 2 has an im-pact in reducing peak discharge, while Scenarios 3 and 4 effect in increasing peakdischarge. Those ratios are the comparison between the peak discharge resulted fromthe scenario and that resulted from existing condition. The reduction of peak discharge10
ratios are 19.48 and 16.01 % for simulation results using Scenarios 1 and 2, respec-tively. The decrease in peak discharge is an impact of applying around 30 % of thecatchment area into green land. A preliminary work on the impact of land use changesin this catchment has been done by Yuniarti et al. (2013) and found the importance ofgreen land. Green land is required to give sufficient space for infiltration, which is good15
for groundwater recharge as well as flood control. Scenario 2 includes green land inthe simulation, but also converts some of agriculture area into settlement. This meansincreasing semi impervious area, increasing runoff coefficient and consequently in-creasing flood peak. As a result, the reduction of peak discharge is less significant asland use conversion tend to change recharge potential area into semi impervious area.20
In contrast to simulation results on the first two scenarios, Scenarios 3 and 4 causesignificant increase of peak discharges. Scenario 3 aggravates land use change sit-uation which converts all vacant land into industry area and half of settlement areainto trading and service. Therefore, the impervious area increases significantly whichreflects in the increase of peak discharge to 32.28 %. Compare to that Scenario, Sce-25
nario 4 alleviates land use change situation as in addition to the conversion of vacantland into industry area, only a quarter of the existing settlement is converted into tradingand service area. Scenario 4 causes the increase of peak runoff to 28.66 %.
5497

HESSD11, 5487–5513, 2014
Infiltration well toreduce the impact ofland use changes on
flood peaks
D. I. Kusumastuti et al.
Title Page
Abstract Introduction
Conclusions References
Tables Figures
J I
J I
Back Close
Full Screen / Esc
Printer-friendly Version
Interactive Discussion
Discussion
Paper
|D
iscussionP
aper|
Discussion
Paper
|D
iscussionP
aper|
3.2 Analysis of the number of infiltration well applied in the catchment
Understanding possible impact of land use changes presented above, there shouldbe an effort to reduce the impact of land use changes on flooding. From the analysisusing Geographic Information System which overlays the existing land use map withland permeability, shallow ground water level and land slope maps, it is found that5
52.06 km2 or 81.47 % of the catchment area is the effective area for applying infiltrationwell. Figure 9 presents the map of suitable area for infiltration well application. Basedon the effective area, an analysis of the density of infiltration well application was donewith the assumption that the depth of the well is 3 m, and diameters of the wells are 0.8,1.0, 1.2 and 1.4 m. Equation (2) was used in this analysis.10
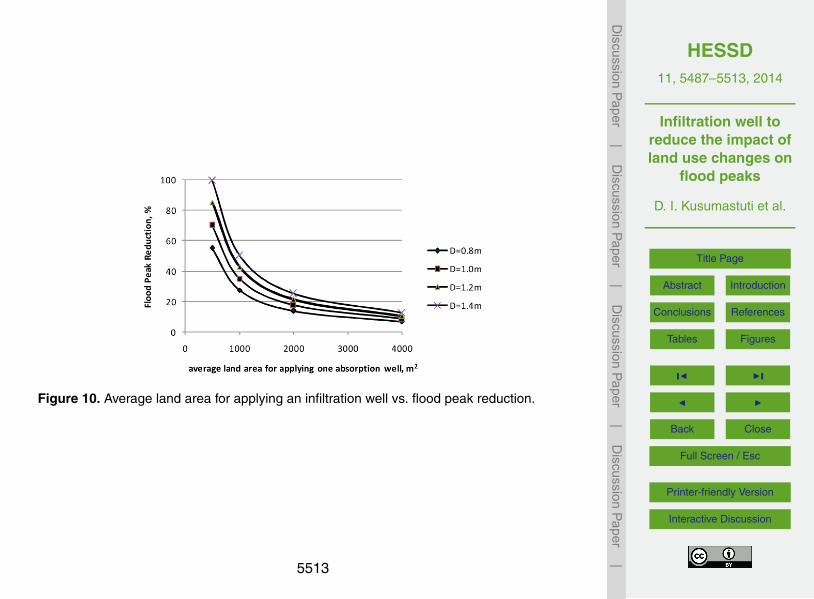
The average land area for applying infiltration well related to flood peak reduction ispresented in Fig. 8. It can be seen that the average land area and well diameter havesignificant impact on reducing flood peaks. Applying an infiltration well per 4000 m2
in the whole catchment will reduce flood peaks to 6.9, 8.76, 10.68 and 12.6 % us-ing diameters of 0.8, 1.0, 1.2 and 1.4 m, respectively. Applying an infiltration well per15
4000 m2 means that there will be about 13 015 wells applied in the catchment. Us-ing average density area of 2000 m2, infiltration wells may reduce flood peaks to 13.8,17.52, 21.3 and 25.29 % for diameters of 0.8, 1.0, 1.2 and 1.4 m, respectively. Consid-erable increase of flood peak reduction showed when applying infiltration well each inthe average of 1000 and 500 m2 land area. The ranges of flood peak reductions are20
between 27.61 to 50.57 % and 55.21 to 99.8 % using designated diameters for averageapplying land area of 1000 and 500 m2, respectively.
The results suggest that using infiltration well with diameter 1.4 m which are ap-pliedeach in every 500 m2 of land area nearly reduce all runoff. However, applying aninfiltration well per 4000 m2 means implementing 104 116 wells in the catchment. It re-25
quires a lot of financial commitments not only from the government but also from thepeople. It also requires willingness of people to allow their land for the implementation.Relating the result with possible land use changes, implementation of infiltration well
5498

HESSD11, 5487–5513, 2014
Infiltration well toreduce the impact ofland use changes on
flood peaks
D. I. Kusumastuti et al.
Title Page
Abstract Introduction
Conclusions References
Tables Figures
J I
J I
Back Close
Full Screen / Esc
Printer-friendly Version
Interactive Discussion
Discussion
Paper
|D
iscussionP
aper|
Discussion
Paper
|D
iscussionP
aper|
in every 2000 m2 is considered sufficient as flood peak reductions correspond to floodpeak increases with land use changes. In addition, the number of wells required willonly be 26 029 wells, far less compared to applying an infiltration well each in every500 m2.
4 Implication and conclusion5
Rainfall data, especially in fine time scale, is less available in developing country suchas Indonesia. In practice design rainfall intensity is significant for determining designflood. With limitation of fine scale rainfall data, design rainfall intensity is usually es-timated from a 24 h design rainfall. Design of hourly rainfall distribution consequentlycontrol design rainfall intensity. There is different hourly rainfall pattern between the10
method that commonly used and result from this study. For selected runoff methodused in this study, as its simplicity, flood peak is only influenced by the highest hourlyrainfall intensity distribution and not by the whole rainfall intensity pattern. Therefore,design rainfall intensity resulted in this study is similar with that of the common usedmethod. However, for runoff calculation method which also considers rainfall intensity15
pattern, flood peak will be different if using rainfall intensity distribution resulted fromthis study compared to that of commonly used method.
Rainfall intensity pattern resulted from this study was carried out by simple analysisof hourly rainfall data. To have a more accurate result, a thorough statistical analysisneeds to be done. Result indicated by this study is expected to provoke further analysis20
as in a case of limited fine time scale of rainfall data, rainfall intensity pattern will in-fluence not only flood peaks, but also flood hydrographs and intensity duration curveswhich are vital in hydrology design.
Urbanisation, population growth and economic increase require more settlements,trading area and industries which may cause some land use changes. Bandar Lam-25
pung as a developing city will experience some land use changes due to the fac-tors mentioned above. Analysis on some possible land use changes emphasize the
5499

HESSD11, 5487–5513, 2014
Infiltration well toreduce the impact ofland use changes on
flood peaks
D. I. Kusumastuti et al.
Title Page
Abstract Introduction
Conclusions References
Tables Figures
J I
J I
Back Close
Full Screen / Esc
Printer-friendly Version
Interactive Discussion
Discussion
Paper
|D
iscussionP
aper|
Discussion
Paper
|D
iscussionP
aper|
importance of open green space related to flooding, and particularly flood peaks. Infact there is spatial plan act for this city to maintain 30 % of the area for open greenspace. However, in practice people may not comply with the rule. This study indicatesif conversion of land use to get space for more settlement, industries and trading areaswill increase flood peaks significantly.5
Application of infiltration wells have been considered in several places in Indonesiaincluding Bandar Lampung, but not widely applied. Most possible places to apply in-filtration wells are at the area of government offices or public facilities. Although thereare few individuals who had applied infiltration wells at their house. This study does notexamine the locations to implement infiltration wells. Instead, it considers the density10
of infiltration well within the catchment and how it may reduce flood peaks.Infiltration well is one of the techniques to reduce flood, beside some other tech-
niques such as rain barrel, porous trench, retention pond and bio-retention. Implemen-tation of these techniques simultaneously will have significant impact on flood reduc-tion. Require commitment and relevant policies from the government to encourage use15
of these applications as well as community participation to tackle flood reduction.
Acknowledgements. This work was financially supported by National Strategic Research Fund-ing under Department of Research and Community Service, Department of Higher EducationIndonesia (DIKTI). This support is gratefully acknowledged.
References20
Arafat, Y.: Reduksi Beban Aliran Drainase Permukaan Menggunakan Sumur Resapan,SMARTek, 6, 144–153, 2008.
ASCE – American Society of Civil Engineers: Design and Construction of Urban StormwaterManagement Systems, ASCE Manuals and Reports on Engineering Practice No. 77 andWater Pollut. Control Fed. Manual of Practice RD-20, New York, NT, 1992.25
5500

HESSD11, 5487–5513, 2014
Infiltration well toreduce the impact ofland use changes on
flood peaks
D. I. Kusumastuti et al.
Title Page
Abstract Introduction
Conclusions References
Tables Figures
J I
J I
Back Close
Full Screen / Esc
Printer-friendly Version
Interactive Discussion
Discussion
Paper
|D
iscussionP
aper|
Discussion
Paper
|D
iscussionP
aper|
Ashagrie, A. G., de Laat, P. J., de Wit, M. J., Tu, M., and Uhlenbrook, S.: Detecting the influ-ence of land use changes on discharges and floods in the Meuse River Basin – the pre-dictive power of a ninety-year rainfall–runoff relation, Hydrol. Earth Syst. Sci., 10, 691–701,doi:10.5194/hess-10-691-2006, 2006.
Bappeda Bandar Lampung: Bandar Lampung Spatial Plan, Bandar Lampung, 2010.5
Camorani, G., Castellarin, A., and Brath, A.: Effects of land use changes on the hidrologicrespons of reclamation system, Phys. Chem. Earth, 30, 561–574, 2005.
DeSmedt, F. and Batelan, O.: The impact of land use changes on the groundwater in the GroteNete River Basin, Belgium, in: Proceeding of the Conference Future of Groundwater Re-sources, edited by: Ribeiro, L., Lisbon, 151–158, 2001.10
Doe, W. W., Saghafian, B., and Julien, P. Y.: Land use impacts on watershed respon: the inte-gration of two dimensional hydrologic model and geographical information system, Hydrol.Process., 10, 1503–1511, 1996.
Gumindoga, W.: Hydrology Impact of Landuse Change in the Upper Gilgel Abay River Basin,Ethiopia, TOP MODEL Application, Thesis, International Institute for Geo-Information Sci-15
ence and Earth Observation, Enschede, the Netherlands, 2010.Hacket, W. R.: Changing Land Use, Climate, and Hydrology in the Winooski River Basin, Ver-
mont, M.S. thesis, The University of Vermont, Vermont, 2009.He, M. and Hogue, T. S.: Integrating hydrologic modeling and land use projections for evaluation
of hydrologic response and regional water supply impact in semi arid environments, Environ.20
Earth Sci., 65, 1671–1685, doi:10.1007/s12665-011-1144-3, 2012.Ilmiaty, R. S., Susanto, R. H., Setiawan, B., Suryadi, F. X., and Bonar, G.: Drainage effects
of Sangkuriang Indah residential area on condition existing drainage system in watershedBorang River Palembang City, Int. J. Biol. Ecol. Environ. Sci., 1, 154–158, 2012.
Indriatmoko, R. H.: Penerapan Prinsip Zero Delta Q dalam Pembangunan Wilayah, J. Air In-25
donesia, 6, 77–83, 2010.Iriani, K., Gunawan, A., and Besperi, B.: Perencanaan Sumur Resapan Air Hujan untuk Konser-
vasi Air Tanah di Daerah Permukan (Studi Kasus di Perumahan RT II, III, dan IV PerumahanLingkar Timur Bengkulu), Inersia, 5, 9–22, 2013.
Juahir, H., Zain, S. M., Aris, A. Z., Yusof, M. K., Samah, M. A. A., and Mokhtar, M.: Hydrological30
trend analysis due to land use changes at Langat River Basin, Environ. Asia, 3, 20–31, 2010.
5501

HESSD11, 5487–5513, 2014
Infiltration well toreduce the impact ofland use changes on
flood peaks
D. I. Kusumastuti et al.
Title Page
Abstract Introduction
Conclusions References
Tables Figures
J I
J I
Back Close
Full Screen / Esc
Printer-friendly Version
Interactive Discussion
Discussion
Paper
|D
iscussionP
aper|
Discussion
Paper
|D
iscussionP
aper|
Koch, F. J., Griensven, A. V., Uhlenbrook, S., Tekleab, S., and Teferi, E.: The effects of landuse change on hydrological response in the Choke Mountain range (Ethiopia) – a new ap-proach addressing land use dynamics in the model SWAT, in: Proceedings of the Interna-tional Congress on Environmental Modelling and Software Managing Resources of a LimitedPlanet, Sixth Biennial Meeting, Leipzig, Germany, 2012.5
Kusumastuti, D. I.: Hydrology analysis to define design flood of the Johor River using syntheticunit hydrograph gama I, Rekayasa, 13, 219–228, 2009.
Nobert, J. and Jeremiah, J.: Hydrological response of watershed systems to land use/coverchange, a case study of Wami River Basin, Open Hydrol. J., 6, 78–87, 2012.
Sunjoto, S.: Optimization of infiltration well to avoid salted water intrusion in coast areas, in:10
Proc. Sent. IUC-UGM, Yogyakarta, 1988.Sunjoto, S.: Sustainable urban drainage, in: Proc. Intl. Conf. On Environmental Management,
Geo-Water and Engineering Aspects, 8–11 February 1993, Wollongong, 1993.Sunjoto, S.: Infiltration well and urban drainage concept, in: Proceedings of the Conference on
Future Groundwater Resources at Risk, IAHS Publ. no. 222, June 1994, Helsinki, 527–532,15
1994.Suripin, S.: Drainase Perkotaan, Andi Offset, Yogyakarta, 2004.Triatmodjo, B.: Hidrologi Terapan, Beta Offset, Yogyakarta, 2008.Yuniarti, F., Kusumastuti, D. I., and Jokowinarno, D.: Geospatial analysis of land use and land
cover changes for discharge at Way Kuala Garuntang watershed in Bandar Lampung, in:20
Proceedings of the 2nd International Conference on Engineering and Technology Develop-ment, 27–29 August, Bandar Lampung, 2013.
5502

HESSD11, 5487–5513, 2014
Infiltration well toreduce the impact ofland use changes on
flood peaks
D. I. Kusumastuti et al.
Title Page
Abstract Introduction
Conclusions References
Tables Figures
J I
J I
Back Close
Full Screen / Esc
Printer-friendly Version
Interactive Discussion
Discussion
Paper
|D
iscussionP
aper|
Discussion
Paper
|D
iscussionP
aper|
Table 1. Percentage of land use of the catchment area for four scenarios.
Land UsePercentage of Land Use of The Catchment Area
Existing Scenario 1 Scenario 2 Scenario 3 Scenario 4
Mining Area 0.40 0.40 0.40 0.40 0.40Residential 54.14 54.14 56.50 27.07 40.60Industry Purpose 4.11 4.11 – 4.11 4.11Vacant Land 31.23 – – – –Trading and Service 1.79 1.79 1.79 28.86 15.33Government Office 0.23 0.23 0.23 0.23 0.23Tourism Area 0.05 0.05 0.05 0.05 0.05Industry Area 0.38 0.38 4.49 31.60 31.60Preserved Area 0.46 0.46 0.46 0.46 0.46Agriculture 4.72 4.72 2.35 4.72 4.72Public Service Area 1.27 1.27 1.27 1.27 1.27Road 1.16 1.16 1.16 1.16 1.16Double Track Railway 0.07 0.07 0.07 0.07 0.07Green Land – 31.23 31.23 – –
5503

HESSD11, 5487–5513, 2014
Infiltration well toreduce the impact ofland use changes on
flood peaks
D. I. Kusumastuti et al.
Title Page
Abstract Introduction
Conclusions References
Tables Figures
J I
J I
Back Close
Full Screen / Esc
Printer-friendly Version
Interactive Discussion
Discussion
Paper
|D
iscussionP
aper|
Discussion
Paper
|D
iscussionP
aper|
Figure 1. Illustration of infiltration well applications (a) house with gutter at the eaves and(b) house with gutter at the ground (source: Sunjoto, 1994).
5504

HESSD11, 5487–5513, 2014
Infiltration well toreduce the impact ofland use changes on
flood peaks
D. I. Kusumastuti et al.
Title Page
Abstract Introduction
Conclusions References
Tables Figures
J I
J I
Back Close
Full Screen / Esc
Printer-friendly Version
Interactive Discussion
Discussion
Paper
|D
iscussionP
aper|
Discussion
Paper
|D
iscussionP
aper|
Figure 2. Way Kuala Garuntang catchment within the city of Bandar Lampung.
5505

HESSD11, 5487–5513, 2014
Infiltration well toreduce the impact ofland use changes on
flood peaks
D. I. Kusumastuti et al.
Title Page
Abstract Introduction
Conclusions References
Tables Figures
J I
J I
Back Close
Full Screen / Esc
Printer-friendly Version
Interactive Discussion
Discussion
Paper
|D
iscussionP
aper|
Discussion
Paper
|D
iscussionP
aper|
Figure 3. Land use map of Way Kuala Garuntang at existing condition (source: Bappeda,2010).
5506

HESSD11, 5487–5513, 2014
Infiltration well toreduce the impact ofland use changes on
flood peaks
D. I. Kusumastuti et al.
Title Page
Abstract Introduction
Conclusions References
Tables Figures
J I
J I
Back Close
Full Screen / Esc
Printer-friendly Version
Interactive Discussion
Discussion
Paper
|D
iscussionP
aper|
Discussion
Paper
|D
iscussionP
aper|
Figure 4. Characteristics of rainfall data.
5507

HESSD11, 5487–5513, 2014
Infiltration well toreduce the impact ofland use changes on
flood peaks
D. I. Kusumastuti et al.
Title Page
Abstract Introduction
Conclusions References
Tables Figures
J I
J I
Back Close
Full Screen / Esc
Printer-friendly Version
Interactive Discussion
Discussion
Paper
|D
iscussionP
aper|
Discussion
Paper
|D
iscussionP
aper|
Figure 5. Storm depth distribution for storm durations 3 to 8 h.
5508

HESSD11, 5487–5513, 2014
Infiltration well toreduce the impact ofland use changes on
flood peaks
D. I. Kusumastuti et al.
Title Page
Abstract Introduction
Conclusions References
Tables Figures
J I
J I
Back Close
Full Screen / Esc
Printer-friendly Version
Interactive Discussion
Discussion
Paper
|D
iscussionP
aper|
Discussion
Paper
|D
iscussionP
aper|
Figure 6. Hourly rainfall distribution pattern.
5509

HESSD11, 5487–5513, 2014
Infiltration well toreduce the impact ofland use changes on
flood peaks
D. I. Kusumastuti et al.
Title Page
Abstract Introduction
Conclusions References
Tables Figures
J I
J I
Back Close
Full Screen / Esc
Printer-friendly Version
Interactive Discussion
Discussion
Paper
|D
iscussionP
aper|
Discussion
Paper
|D
iscussionP
aper|
Figure 7. Land use on the four land use change scenarios.
5510

HESSD11, 5487–5513, 2014
Infiltration well toreduce the impact ofland use changes on
flood peaks
D. I. Kusumastuti et al.
Title Page
Abstract Introduction
Conclusions References
Tables Figures
J I
J I
Back Close
Full Screen / Esc
Printer-friendly Version
Interactive Discussion
Discussion
Paper
|D
iscussionP
aper|
Discussion
Paper
|D
iscussionP
aper|
Figure 8. Impact of land use changes on peak discharge compared to existing condition.
5511

HESSD11, 5487–5513, 2014
Infiltration well toreduce the impact ofland use changes on
flood peaks
D. I. Kusumastuti et al.
Title Page
Abstract Introduction
Conclusions References
Tables Figures
J I
J I
Back Close
Full Screen / Esc
Printer-friendly Version
Interactive Discussion
Discussion
Paper
|D
iscussionP
aper|
Discussion
Paper
|D
iscussionP
aper|
Figure 9. Suitable area for infiltration well application.
5512
HESSD11, 5487–5513, 2014
Infiltration well toreduce the impact ofland use changes on
flood peaks
D. I. Kusumastuti et al.
Title Page
Abstract Introduction
Conclusions References
Tables Figures
J I
J I
Back Close
Full Screen / Esc
Printer-friendly Version
Interactive Discussion
Discussion
Paper
|D
iscussionP
aper|
Discussion
Paper
|D
iscussionP
aper|
Figure 10. Average land area for applying an infiltration well vs. flood peak reduction.
5513