infertility and fertility treatment in utah: a report for ... · 1) monitor fertility treatment...
TRANSCRIPT

1
Infertility and Fertility Treatment in Utah: A Report for the Utah Legislature
Joseph B. Stanford, MD, MSPH
Karen Schliep, PhD, MSPH
Sakineh Najmabadi, MPH
Rachael Hemmert, MSPH
Camrey Tuttle
Sara Simonsen, CNM, PhD
Jessica Sanders, PhD, MSPH
C. Matthew Peterson, MD
University of Utah
September 29, 2018
We acknowledge the contributions of Laurie Baksh, Heather Borski, Wu Xu, Navina Forsythe, and Sheila Walsh-McDonald, all from the Utah Department of Health; of Camille Hawkins, from the Utah Infertility Resource Center; and of clinicians and staff from the Utah Center for Reproductive Medicine, the Reproductive Care Center, and the Utah Fertility Center.

2
Table of Contents Executive Summary (Page 3)
Glossary and Abbreviations (Page 6)
Background (Page 8)
Scope of problem
Causes of infertility
Infertility diagnosis and treatments
Infertility treatment in Utah
Cost, coverage, access to treatment
Summary motivation for report
Data Sources and Methods (Page 10)
Utah Pregnancy Risk Assessment Monitoring System (PRAMS)
Utah Population Database (UPDB)
Utah Vital Statistics (Birth Certificate) Data (UVS)
Utah Fertility Experiences Study (UFES)
National Survey of Family Growth (NSFG)
Questions and Answers (Page 11)
1. What is the statewide estimated prevalence of infertility among Utah families? (Page 11)
2. How does the prevalence of infertility vary by sex, age, race/ethnicity, insurance status,
education, and income? (Page 11)
3. What are the causes and risk factors for infertility? (Page 11)
4. What type of healthcare providers offer infertility treatments sought by families? (Page 13)
5. What fertility treatments were recommended to women/families with infertility in Utah?
(Page 14)
6. What treatments have the women/families with infertility used in Utah? (Page 14)
7. What are the outcomes associated with different types of fertility treatments: including
pregnancies, live births, multiple births, preterm births, newborn intensive care and associated
costs? (Page 15)
8. What are the estimated costs for different types of infertility treatments? (Page 17)
9. For those who received infertility treatments, how were the costs paid? (Page 17)
10. What coverage is available by insurers? (Page 17)
11. What are barriers to seeking infertility services? (Page 19)
12. How does infertility impact a family's wellbeing and family members' health and mental health
status? (Page 25)
13. How does infertility impact the state of Utah demographically and economically? (Page 26)
14. What policies have other States of the United States enacted for infertility evaluation,
treatment, and related issues, and what have been the results? (Page 27)
Conclusions and Policy Recommendations (Page 30)
Supplemental Tables (Page 32)
References (Page 35)

3
Executive Summary
The estimated statewide prevalence of infertility among Utah families in their reproductive years is about 10–20%, which is similar to the national level [1, 2]. Infertility may be due to a variety of underlying causes in the female only (about a third), the male only (about a third), or both [3]. It impacts many couples physically, emotionally, and financially, which in turn impacts society. In addition to hindering couples from having wanted children, the condition of infertility is also associated with type 2 diabetes, cardiovascular disease and cancer, as well as all-cause mortality in women and men [4, 5]. Thus, infertility deserves appropriate diagnosis and treatment as a medical condition [6, 7]. Understanding the health care costs and risk of treatment also deserves attention; for example, children who are born after fertility treatment may be at higher risk for some adverse health outcomes and extended hospital stays, especially if they are born as twins or a higher order multiple pregnancy. In an attempt to ameliorate adverse outcomes and increase the likelihood of healthy children, it is essential to improve education about fertility and to ensure access to evidence-based, cost-effective treatment options. This report is prepared for the Utah Legislature as a synthesis of the best available data for Utah, using several sources of population-based data. We have included background on infertility in Utah, comparisons to national data, data on Utahns’ experiences with infertility, availability and costs of treatment, and suggestions for possible public health and policy actions.
Background
During the last two decades, significant changes in demographics and certain health indicators have occurred in Utah:
• Since 2006, Utah’s birth rate has decreased (21.2 births per 1,000 residents in 2006 compared to 16.6 births per 1,000 residents in 2016). While still higher than almost all states in the nation, Utah’s birth rate is lowering at a more rapid rate than the US birth rate (14.3 vs. 12.2 births per 1,000 residents in the same years). [8]
• A higher proportion of women in Utah are of reproductive age (15–44 years) than the national level (44.3% vs. 39.8%). [9]
• Currently 10.2% of Utahns live in poverty (vs. national level of 14.0%, 2016) [10], and 8.8% of Utahns do not have any health insurance coverage (vs. the national level of 8.6%) [11]. However, most of those who have health insurance still have limited or no insurance coverage for fertility evaluation and treatment.
• There has been a shift toward increased racial and ethnic diversity in our state. In 2015, 21.2% of Utah’s population identified a race or ethnicity other than non-Hispanic white, compared to 14.7% in 2000. [12]
• Sexually transmitted diseases (STDs) are increasing in Utah. Between 2000 and 2016, there was an over 300% increase in Chlamydia cases (98 cases per 100,000 persons in 2000, vs. 310 in 2016) and a 680% increase in Gonorrhea (10.4 cases per 100,000 persons in 2000, vs. 68.8 in 2016).[13, 14] Both of these diseases are known causes of infertility.

4
Analysis
While the ongoing decline in Utah’s birth rate is not exclusively due to infertility , there is evidence that about 10–20% of Utah families of reproductive age have experienced difficulty having desired children. Further findings from multiple Utah data sources are summarized as follows:
• Utah woman aged 35 years or older, with higher education, and with household income >185% of federal poverty level used more medical fertility treatment than women with lower education and income. Race and ethnicity do not appear to be substantially different among women using or not using fertility treatment in Utah, although they are different nationally.
• Utah has a higher level of overall use of fertility treatment than all other states for which population-based data are available (30 other states). The most common type of fertility treatment used in Utah is fertility drugs (ovulation drugs), followed by artificial insemination and in vitro fertilization (IVF). In Utah, about 5% of births result from some type of medical fertility treatment, with about 1% of births resulting from IVF treatment.
• Various types of health care practitioners, including physician assistants, nurse practitioners, certified nurse midwives, family physicians, obstetrician-gynecologists and specialized fertility physicians diagnose and treat individuals and couples experiencing infertility. IVF is provided by reproductive endocrinologists in specialized fertility clinics (of which there are currently three that are professionally recognized in Utah). Which type of health care practitioner is best suited to address a patient’s issue depends on the couple’s history, the complexity of underlying disease, and the treatment preferences of the couple.
• Infertility is a powerful indicator for underlying health conditions in both women and men that deserves evaluation and potential treatment for improved health across the lifespan, irrespective of pregnancy intention.
• Infants born after more invasive fertility treatment, including IVF, have an increased risk of adverse health outcomes including preterm birth and low birthweight, as well as longer infant hospitalization and higher healthcare costs, primarily because of the higher rate of twins with IVF and superovulation treatments (with or without artificial insemination). Most of this increased risk could be eliminated if treatment was modified to substantially reduce the risk of twins, but to do this requires changes in the economic incentives around payment for treatment that also incorporates desired outcomes.
• In Utah, newborn and maternal care hospital costs for twins are 1.7 to 3.8 times higher than hospital costs for a singleton birth.
• Significant barriers to access and utilization of fertility evaluation and treatments include lack of insurance coverage and high costs, lack of education, and social and emotional barriers.
• Utah recently implemented pilot coverage of fertility treatment starting with House Bill 347, 2014 (which “authorizes, at the discretion of the insurer, an indemnity benefit for adoption or infertility treatment”), and SB 181, 2017, which mandates this benefit in a pilot program for enrollees of PEHP.
Policy Implications
We recommend the following public health and policy actions:

5
1) Monitor fertility treatment utilization, barriers to fertility related care, and associated twin and higher order births, particularly through birth certificates and the ongoing survey efforts of the Utah Department of Health, Maternal and Infant Health Program.
2) Reduce socio-economic disparities in access to fertility evaluation and treatment through insurance policy and regulation.
3) Evaluate the impact of all legislative changes (like House Bill 347, 2014, and Senate Bill 181, 2017) on utilization of fertility treatments.
4) Consider providing coverage through Medicaid and PCN to fertility treatment to reduce economic disparities in access to treatment.
5) Design any mandates or recommendations for insurance coverage of fertility treatments to incentivize singleton pregnancies.
6) Support alternative routes to desired parenthood, including adoption and foster care.
7) Increase access of providers and the public to information on reproductive planning, fertility, prevention of sexually transmitted infections, evidence-based fertility evaluation and treatment and healthy habits that improve fertility (including smoking cessation, weight management).

6
Glossary and Abbreviations Age-specific fertility rate: The number of live births (often per 1,000 women) in a specific age group
for a specific point in time, usually a year.
Artificial Insemination (AI): General term used when sperm are placed into the uterus, or cervix (opening of the uterus), or vagina. In medical practice, most artificial insemination is performed as intrauterine insemination, and it is usually combined with ovulation induction, and sometimes with superovulation.
Assisted reproductive technology (ART): Any procedure involving medical handling of eggs and/or sperm to establish pregnancy in treatment of infertility. Most of the time, ART is used synonymously with in vitro fertilization (IVF). In this report, we usually prefer the more specific term of IVF, but sometimes the sources we quote have used the term ART.
Embryo cryopreservation: Freezing of embryos for future use. When multiple embryos are created during an IVF procedure, some of the embryos can be frozen for future transfer to the uterus, so that not all embryos are transferred at once.
Fertility preservation: Freezing of sperm, eggs, or sometimes embryos, for future use. This is a medical option for persons facing health conditions (e.g. chemotherapy) that could limit future fertility.
In vitro fertilization (IVF): Fertilization of an egg by a sperm outside of the body by placing multiple sperm together with an egg during a laboratory procedure, after which the resulting embryo is transferred into a woman’s uterus.
Infertility: The inability of a couple to conceive and have a live born child, despite at least one year of having sexual intercourse without contraception. If the woman is 35 years of age or older, the diagnosis is made after 6 months, instead of one year. There are some medical conditions, such as a lack of ovulation in the woman, or very low sperm production in men, in which the diagnosis of infertility can sometimes be made sooner.
Intracytoplasmic sperm injection (ICSI): A version of IVF in which a single sperm cell is directly injected into an egg in the laboratory setting. The resulting embryo is transferred into a woman’s uterus.
Intrauterine insemination (IUI): Medical procedure to place sperm (from the partner or donor) into the uterus of the female recipient. In medical practice, most artificial insemination is intrauterine insemination, and it is usually combined with ovulation induction, and sometimes with superovulation.
Ovulation induction (OI): Treatment of infertility in the female by administration of a drug that triggers ovulation (the development and release of one or more eggs), thereby increasing the chance of fertilization and pregnancy. This technique can be used in anovulatory and ovulatory women.
Reproductive justice: The human right to maintain personal bodily autonomy, have children, not have children, and parent children in safe and sustainable communities. The term acknowledges the intersection between race, ethnicity, financial, environmental, social, and cultural influences.
Single embryo transfer: In an IVF procedure, transferring only one embryo to the uterus in each cycle of treatment. Usually combined with embryo cryopreservation.

7
Singleton term live birth: A birth of a single live newborn after a full-term pregnancy. Most experts in evaluating fertility treatment consider this the optimal outcome for fertility treatments, because it is healthiest for mother and baby, and has the lowest costs for pregnancy and newborn care.
Superovulation: A form of ovulation induction in which the ovaries are stimulated to produce more than 2 eggs at a time. These eggs may be retrieved for IVF, or the woman may undergo AI, or the couple may simply be advised to have regular intercourse. This type of treatment increases twins and multiple gestations, unless it is combined with cryopreservation and single embryo transfer.
Total fertility rate: Total number of children born or likely to be born to a woman in her lifetime, if she were to experience the exact current age-specific fertility rates through her lifetime, and she were to survive from birth through the end of her reproductive life.
Additional abbreviations used in this report are listed under Data Sources and Methods.

8
Background
Scope of problem In the United States at least one in every seven couples hoping to have a baby, experiences difficulties
achieving or maintaining pregnancy [18, 19]. Infertility is defined as the inability to conceive within one year of intercourse without contraception (or 6 months if the woman is 35 years or older) [20, 21]. There is no formal definition about what the frequency of intercourse should be, but in general sexual intercourse about twice per week is considered adequate to maximize the probability of conception [22, 23]. Depending on pregnancy history, this diagnosis is differentiated between primary and secondary infertility. It is called primary infertility if there has never previously been a birth. Secondary infertility is the inability to conceive or carry to term after a previous live birth. In data from the population-based U.S. National Survey of Family Growth, 15.5% of U.S. women who were trying to conceive at the time of their response met a 12-month definition for infertility [1, 2]. For U.S. men asked separately, about 12% met the same definition [24]. Although infertility is a condition impacting the reproductive system [4, 5], its health implications extend beyond the ability to have children and are known to be associated with other health conditions. These associations are not necessarily causal or symptomatic but may indicate more generalized underlying health concerns [4]. Women and men with infertility may have increased likelihood of having type 2 diabetes, cardiovascular disease and cancer, and all-cause mortality, demonstrating that infertility is a marker for important underlying diseases [6, 7]. Additionally, the diagnosis of infertility and its treatment result in increased rates of pregnancy complications for both the mother and child. When infertility therapies result in multiple pregnancies, the risk of adverse outcomes for mother and child are increased. Finally, there may be serious social, financial, psychological, and relationship consequences of infertility, among both those who do and do not go on to successfully achieve a live birth [25-27].
Causes of infertility Infertility may be due to a variety of underlying causes in the female, the male, or both [3], including
genetic abnormalities, aging, acute and chronic diseases, treatments of certain conditions, behavioral factors, and exposure to environmental, occupational, and infectious agents [28, 29]. One third of infertility cases are caused primarily by a male condition. Most of the remaining cases are either caused primarily by female conditions (about 33%) or by a combination of male and female conditions. In some cases, no cause is identified; this is frequently referred to as unexplained infertility [28, 29]. There are significant health disparities surrounding infertility: its prevalence, diagnosis, referral and treatment significantly vary by race, ethnicity, and socioeconomic status in the United States [4, 29]. There are some data that suggest that socioeconomic status (education, income, and insurance status) is the primary disparity in access to treatment; however other data suggest there are disparities in access and utilization based on other factors including race and ethnicity. These are important considerations in the context of addressing health care access and reproductive justice (the human right to maintain personal bodily autonomy, have children, not have children, and parent children in safe and sustainable communities). Later in this report, we discuss further the evidence in Utah that points to socioeconomic status and education as the primary factors driving disparity in access to fertility services in Utah, and also present data about the barriers women experience in seeking fertility treatment.
Infertility diagnosis and treatments Methods of diagnosing and treating infertility range from counseling and advice about nutrition and
timing of intercourse to medications, surgery, or IVF [19], and in most cases, involves both partners. Cost

9
and procedure complexity impact access to infertility treatment [19]. According to the National Survey of Family Growth (1982–2010), among women aged 25–44, 17% (6.9 million) had used fertility treatment, a significant decrease from 20% in 1995 [30]. About half of couples in the United States experiencing infertility end up seeking medical attention, but as discussed later in this report, the proportion receiving some medical attention is higher in Utah; about 85% [18, 31]. Nationwide, the four most commonly used infertility services among women aged 25–44 in 2006–2010 included medical counseling (9.4%), infertility tests (male or female) (7.3%), medical help to prevent miscarriage (6.8%), and ovulation induction drugs (5.8%). Artificial insemination (AI) was received by 1.7%. Finally, 0.7% of couples nationwide received IVF [30]. Some medical treatments for infertility are provided by both generalist and subspecialty trained physicians, including artificial insemination, ovulation induction, and approaches to diagnose underlying problems and restore healthy reproductive function [19, 32]. In recent years, there has been an increasing use of in vitro fertilization (IVF), with or without intracytoplasmic sperm injection (ICSI) [19, 33, 34]. The increase has come in part with increasing numbers of physicians providing the service, and also with increased insurance coverage in some states [35]. IVF and ICSI were originally developed to overcome specific diagnostic reasons for infertility (i.e., tubal obstruction and severe male factor infertility) [3] but have become more widely used for infertility of any reason because of increasing availability and the high likelihood of live birth from one cycle of treatment. However, the majority of births to infertile couples still result from other medical treatments, such as ovulation induction medications and AI.
Infertility treatment in Utah Currently, approximately 1% of births in the United States are conceived through ART (primarily IVF)
[36]. In 2004–2005, 0.6% of Utah live births were conceived through IVF, and 4.9% were conceived through other fertility treatment, including medications and/or IUI [37]. In Utah, 65% of IVF treatment cycles are in women younger than 35 years of age, compared to 44% of cycles nationally [36]. Of Utah couples who had a live birth from fertility treatment, 18% used IVF, 13% AI, 48% ovulation induction drugs alone, 10% other treatments (including surgery), and 11% conceived in a cycle where they were not getting treatment. (See Figure 5 and Supplemental table S-3.) There are three SART-affiliated clinics in Utah that provide IVF and other fertility treatments, discussed further under Question 6.
Cost, coverage, access to treatment Infertility treatments have a wide range of costs associated with them. One of the major issues
impeding the widespread adoption of IVF has been its high cost, further complicated by the fact that few insurance companies reimburse for infertility treatment generally, or IVF specifically [38]. In addition to the cost of treatment, the costs of care for pregnancy and newborns should be considered [39]. For example, a twin pregnancy may incur extra costs for pregnancy care, early birth, and newborn intensive care, as compared to a term singleton pregnancy.
Summary motivation for report In summary, infertility impacts many couples physically, emotionally, and financially, which in turn
impacts the population of the State of Utah. Those who seek treatment face an array of options and medical advances, with the problem of obtaining relevant up-to-date data about costs and outcomes, including child health outcome. This report is prepared for the Utah Legislature as a synthesis of the best available data for Utah, with relevant benchmarks to national data, and suggestions for possible policy options to reduce the burden of infertility for Utah citizens.

10
Data Sources and Methods
Multiple data sources were used in this report to assess infertility and fertility treatment in Utah.
Centers for Disease Control and Society for Assisted Reproductive Technology (CDC-SART) The CDC-SART database maintains national statistics on treatments with different varieties of IVF and
resulting rates of pregnancy and live birth, with results also available for specific clinics.
Pregnancy Risk Assessment Monitoring System (PRAMS) Utah is among the 47 states conducting the Pregnancy Risk Assessment Monitoring System (PRAMS)
survey, a health surveillance project of the Centers for Disease Control and Prevention (CDC) and state health departments. This survey provides state-specific, population-based data on maternal attitudes and experiences before, during and shortly after a live birth. PRAMS identifies health problems, changes in health status and measures reproductive health goals [40]. PRAMS data are also linked to birth certificate data. PRAMS surveillance in Utah began in May 1999. For this report, we used data from phase 7 of PRAMS in Utah, consisting of data from women delivering a live born infant between 2012 and 2015.
Utah Population Database (UPDB) The Utah Population Database (UPDB) operates under parameters set by the Utah State government.
It includes information from birth certificates, death certificates, fetal death certificates, marriage and divorce records, Utah driver’s license data, hospital discharge data, and other sources. Strict research ethics review is required to access data from the UPDB.
Utah Vital Statistics (Birth Certificate) Data (UVS) Utah Vital Statistics (Birth Certificate) data are collected by the Utah Department of Health. The UVS
includes information on all birth events that occur in Utah as well as fetal deaths and early term stillbirths [41]. In this report, we have accessed UVS data in relation to PRAMS and/or the UPDB.
Utah Fertility Experiences Study (UFES) In 2008–2012, we conducted a retrospective cohort study of infertility experiences, treatment
choices, barriers to treatments, and outcomes of treatment in Utah [1, 30]. We enrolled 501 women who had experienced primary infertility from population-based sampling, to be representative of Utah. We also enrolled 459 women who had been treated by one of two subspecialist fertility clinics, the Utah Center for Reproductive Medicine (University of Utah), or the Reproductive Care Center (private clinic), which were the two major infertility subspecialty clinics in Utah until recently, when a third clinic opened, the Utah Fertility Center (see Question 6). Even with the population-based sampling, women who participated in the Utah Fertility Experiences Study were more likely than the general Utah population to be under 30 years of age, have a college degree, identify as white, non-Hispanic and have a family income of at least $50,000. Therefore, the results from the UFES do not fully represent women from disadvantaged groups (lower income, lower education) within the Utah population.
National Survey of Family Growth (NSFG) The National Survey of Family Growth collects information on family life, marriage and divorce,
pregnancy, infertility, use of contraception, and men’s and women’s health. The U.S. Department of Health and Human Services and others use this survey results to plan health services and health education programs, and to do statistical studies of families, fertility, and health [42]. We have used NSFG data for information about the USA generally. Data specific to Utah are not available from the NSFG, because the NSFG is not designed to give state-level estimates, and there are few respondents from Utah.

11
Questions and Answers
1. What is the statewide estimated prevalence of infertility among Utah families? Using data available from the population-based sample from the UFES (which includes women who
never had live birth), UPDB, and the population-based PRAMS (which includes only women who had live birth), we estimate that statewide prevalence of infertility among Utah families in their reproductive years is about 10–20%, which is in the same range as a population-based estimate from the United States: 15.5% of U.S. women who were currently trying to conceive met a 12-month definition for infertility [1, 2].
Details from each source in Utah are as follows: 1) In UFES, researchers contacted women in Utah who had been married for at least three years but had not had a previous birth. Based on those who responded and qualified for the study, we estimate that among couples married for at least three years, 19–22% have experienced infertility at some point. This may be a high estimate because those who responded to the survey may have been more concerned about infertility. 2) Among those who had a live birth and participated in the 2012–2015 Utah PRAMS survey, 12% reported trying for more than a year to achieve pregnancy. This is a low estimate, because it does not include women who did not have a live birth. For more details and other characteristics of women trying to conceive, see Supplemental Table S1.
2. How does the prevalence of infertility vary by sex, age, race/ethnicity, insurance status, education, and income?
According to PRAMS (2012–2015, Utah), woman aged 35 years or older, with higher education, or with a household income of more than 185% of the federal poverty level were more likely to use infertility treatment. In Utah, race/ethnicity did not play a significant role in using infertility treatment. This may be due to low representation among racial and ethnic minorities in the Utah sample. See Figure 1. For more details and other characteristics of women receiving treatment, see Supplemental Table S2.
Socioeconomic disparity may have reproductive consequences [25]. Common stressors such as increasing unemployment may lead to a population-level-increase in miscarriage [43]. Income disparity may contribute to impairment of ovarian function and unexplained infertility [25]. The exact reasons behind this relationship are unknown; however, it is clear that environmental, financial, and social stressors can have physical health repercussions [25]. 3. What are the causes and risk factors for infertility?
Causes of Infertility
About one-third of infertility cases can be attributed to male factors and one-third to female factors. For the remaining one-third of infertile couples, infertility is caused by a combination of problems in both partners (about 10%), unexplained infertility (about 20%), and other (about 3%) [19, 44].

12
Male infertility can be caused by failure to produce sperm (azoospermia), production of limited sperm (oligospermia), production of suboptimal sperm that hinders egg fertilization or embryo development, or some defect that interferes with sperm transportation (Table 1). There are a number of health issues among men that may cause abnormal sperm production or other problems of male infertility such as infection, antibodies that attack sperm, hormone issues, varicocele (or swelling of the veins that drain the testicle), defects of tubules that transport sperm, chromosome defects, ejaculation issues, tumors, undescended testicles, or problems with sexual intercourse such as erectile dysfunction [44].
Female fertility is most commonly affected by ovulation disorders, which are also the primary cause of infertility in 25% of couples who have difficulty conceiving [19]. Ovulation disorders encompass a spectrum of symptoms and a variety of underlying causes, including polycystic ovary syndrome (PCOS), hypothalamic dysfunction (causing irregular or absent periods), premature ovarian insufficiency (the ovaries no longer produce eggs), or hyperprolactinemia (the pituitary gland produces too much prolactin inhibiting ovulation) [45]. Other causes of female infertility include blocked fallopian tubes, endometriosis, uterine fibroids, uterine abnormalities present from birth that may affect multiple aspects of reproduction, or cervical abnormalities in structure or cervical fluid production.
Risk Factors for Infertility
Some risk factors are non-modifiable including genetics and epigenetics (thought to cause infertility in up to 30% of couples with idiopathic [or unknown] infertility) [46] or older age, particularly for women with fertility decreasing by half among women in their late 30s compared with women in their early 20s [47]. Several environmental factors, which may in part be modifiable, are thought to impact both male and female infertility. For men, overexposure to certain environmental elements such as heavy metals or pesticides can reduce sperm production or sperm function [47]. Similarly, women exposed to environmental toxicants, such as endocrine disrupting chemicals, have been found to have increased risk for infertility via their impact on gynecological disorders such as endometriosis [48].
There are also some modifiable health behaviors that can enhance natural fertility (Table 2). To maximize natural fertility, both men and women are advised to understand the couple’s fertile window (time when couple is most likely to achieve pregnancy) and increase intercourse frequency during this time[47], as fertility awareness has been found to be one of the most important predictors of achieving pregnancy among couples with no known fertility
Table 1: Common Causes of Male and Female Infertility
Male Female Azoospermia Ovulatory disorders Oligospermia Damage to fallopian tubes Abnormal sperm morphology/motility Endometriosis Defects in tubes that transport sperm Uterine fibroids
Other uterine/cervical causes
Table 2: Modifiable Factors to Improve Natural Fertility for both Males and Females Education on fertile window Refrain from illicit drug use and tobacco Abstain/moderate alcohol and caffeine intake Early diagnosis and treatment of sexually transmitted infections Seek out stress-reducing behaviors Maintain a healthy weight through diet/exercise Limit exposure to toxins/pollutants Reproductive life planning

13
disorders[49]. Additionally, couples are advised to abstain from illicit drug and tobacco use, abstain or aim for moderate alcohol (≤ 1 drink/day) and caffeine (<250 mg/day) consumption, manage stress in healthy ways, and aim to achieve a healthy weight, as both under- and overweight can affect ovulatory function in women and impact sperm production and hormone function in men [47, 49].
4. What type of healthcare providers offer infertility treatments sought by families? Drugs for ovulation induction are commonly offered by primary providers for women and couples,
including obstetrician-gynecologists, family physicians, reproductive endocrinologists, and sometimes also physician assistants, nurse practitioners, and certified nurse midwives. [50] They are also sometimes prescribed alone (without IUI or IVF) in specialty fertility clinics. Artificial insemination (usually intrauterine insemination) is usually done together with ovulation induction, and is offered by some obstetrician-gynecologists, and by specialized fertility providers (reproductive endocrinologists) in specialty fertility clinics. In vitro fertilization is offered almost exclusively in specialty fertility clinics. There are three specialty fertility clinics in Utah that are recognized by and affiliated with the Society of Assisted Reproductive Technology (SART), which requires validated reporting of the details of IVF cycles performed. Each has multiple locations. See Table 3.
Table 3. Specialty Fertility Clinics in Utah, recognized by the Society of Assisted Reproductive Technology Clinic Name Est. Year #
Providers Geographic Locations
Utah Center for Reproductive Medicine
1981 10 Salt Lake City, South Jordan, Centerville, St. George
Reproductive Care Center
1993 6 Sandy, Clearfield, Pleasant Grove
Utah Fertility Center 2015 10 Pleasant Grove, Ogden, Murray, St. George
Alternative treatments (such as acupuncture or herbs) are offered by a spectrum of health professionals, including some physicians, nurse practitioners, naturopathic doctors, chiropractic physicians, licensed acupuncturists, and others. Many women also opt to access these on their own rather than going though professionals.
Among women in Utah with primary infertility, the majority have seen at least one medical provider for the problem. Among respondents in the FES study, 84% responded that they saw a generalist provider (obstetrician-gynecologist, family physician; physician assistant, nurse practitioner, or certified nurse midwife) first; while 8% initially saw a fertility subspecialist. Of those who first saw a generalist provider, the majority went on to see a fertility subspecialist. See Figure 2. The ultimate proportion of those with infertility who had a live birth within 5 years was the same whether
Figure 2. Types of health providers seen by women in Utah with primary infertility
14
the couples first sought care from a generalist or a specialist. However, those who first saw a generalist provider were half as likely to receive IVF (odds ratio 0.48, 95% confidence interval, 0.28–0.82), even after adjusting for income, age, and time trying to conceive [31]. A complex dynamic exists between generalist doctors and fertility subspecialists who see infertility patients [51]. In some cases, generalists may not recognize or clearly refer patients who may benefit from IVF or other specialized care. However, direct referral to ART programs that primarily perform IVF without providing initial alternatives such as ovulation induction and AI may steer patients prematurely and unnecessarily to IVF, which has higher costs and higher risks. In fact, 82% of couples achieve a pregnancy with fertility treatment other than IVF in Utah (Figure 5), which suggests that policies would be beneficial that supporting other fertility treatments when appropriate, as well as facilitating timely referral for IVF, when indicated.
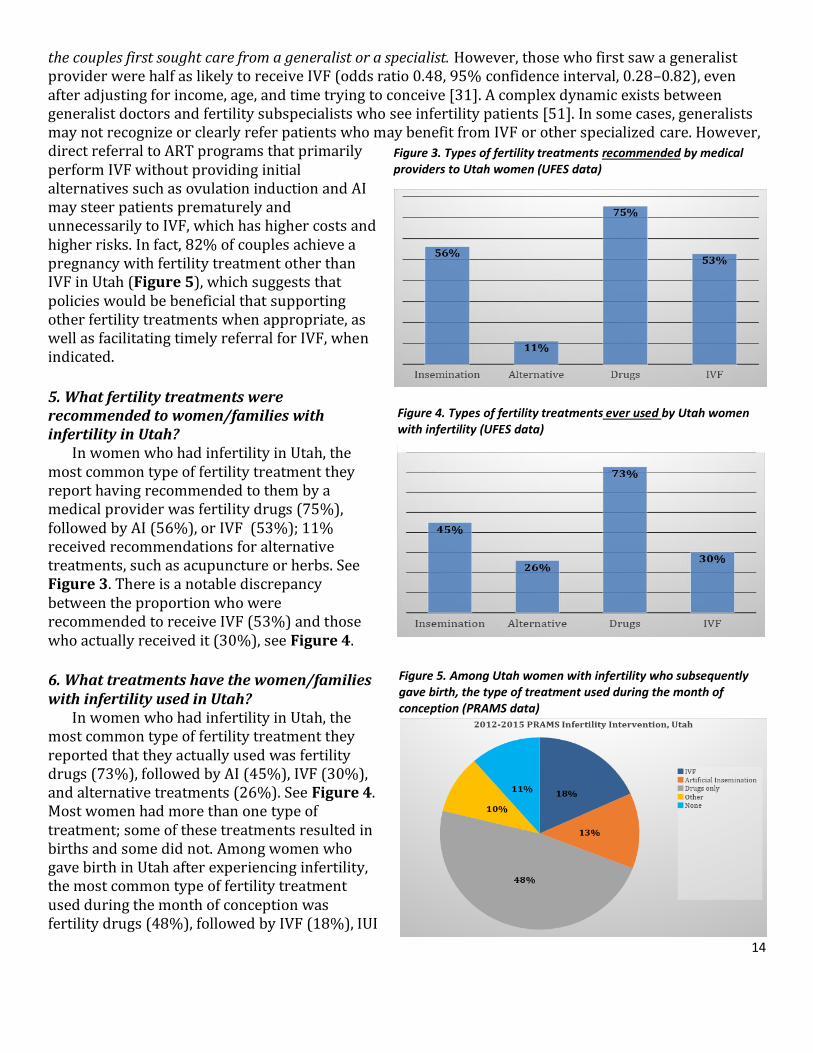
5. What fertility treatments were recommended to women/families with infertility in Utah?
In women who had infertility in Utah, the most common type of fertility treatment they report having recommended to them by a medical provider was fertility drugs (75%), followed by AI (56%), or IVF (53%); 11% received recommendations for alternative treatments, such as acupuncture or herbs. See Figure 3. There is a notable discrepancy between the proportion who were recommended to receive IVF (53%) and those who actually received it (30%), see Figure 4.
6. What treatments have the women/families with infertility used in Utah?
In women who had infertility in Utah, the most common type of fertility treatment they reported that they actually used was fertility drugs (73%), followed by AI (45%), IVF (30%), and alternative treatments (26%). See Figure 4. Most women had more than one type of treatment; some of these treatments resulted in births and some did not. Among women who gave birth in Utah after experiencing infertility, the most common type of fertility treatment used during the month of conception was fertility drugs (48%), followed by IVF (18%), IUI
Figure 4. Types of fertility treatments ever used by Utah women with infertility (UFES data)
Figure 3. Types of fertility treatments recommended by medical providers to Utah women (UFES data)
Figure 5. Among Utah women with infertility who subsequently gave birth, the type of treatment used during the month of conception (PRAMS data)

15
(13%), and Other, including surgery or other drugs (10%), or none (11%). See Figure 5. For comparison with other states, see Question 13. For more details of the types of treatment by different demographic factors, see Supplemental Table S3.
7. What are the outcomes associated with different types of fertility treatments: including pregnancies, live births, multiple births, preterm births, newborn intensive care and associated costs?
Pregnancies and live births Specialty fertility clinics publish pregnancy and live birth rates per cycle of treatment, based on the
SART national database. Live birth rates are lower than pregnancy rates because of pregnancy losses, mostly miscarriages. Live birth rates are strongly influenced by factors such as the woman’s age and underlying diagnoses, whether one or multiple embryos are transferred to the uterus, and whether donor eggs are used, which means that birth rates between clinics are not directly comparable. For example, in 2015 (the most recent year with finalized SART data), for women aged 35–37 undergoing IVF with their own fresh embryos, the three specialty fertility clinics in Utah reported overall live birth rates ranging from 27% to 52%, as compared to the national average of 26%; and singleton live birth rates ranging from 23% to 54%, as compared to the national average of 20% [52]. The per cycle ongoing pregnancy rate after IUI with ovulation induction is about 7% on average, and also varies by maternal age, duration of infertility, and underlying diagnoses or causes [53].
More relevant for women and couples are the cumulative probabilities for a live birth for different types of treatments. A study in Massachusetts followed over 240,000 couples starting IVF treatment. At 1.5 years, they had a crude cumulative live birth rate of 55%, a live birth rate adjusted for treatment drop-out of 75%, with 47% of the births being twins [54]. It’s important to note that Massachusetts is a state that legally mandates insurance coverage of fertility treatment, including IVF.
A recent study followed couples in Denmark (where all fertility evaluation and treatment is covered by the national health insurance). Over 19,000 couples were followed for 2 years, and over 5,000 of them for up to 5 years. For those who started treatment first with AI (63% of all couples), the average female age at the start was 32.4 years and the cumulative live births were 59% at 2 years and 75% at 5 years. For those who started treatment first with IVF (37% of all couples), the average female age at the start was 33.1 years and the cumulative live births were 53% at 2 years and 65% at 5 years [55]. These cumulative births include births from all pregnancies regardless of treatment at the time of conception—including those resulting from the original treatment, or after switching from IVF to AI (or from AI to IVF), and spontaneous pregnancies between treatments. Cumulative pregnancies were slightly lower in couples starting with IVF, because under Danish medical guidelines, couples with more severe underlying conditions were more likely to start right away with IVF.
We have conducted a similar analysis among 7214 consecutive couples who presented for infertility treatment to the Utah Center for Reproductive Medicine (University of Utah) from 2000-2008. The results are shown in Figure 6. After about 2 years, highest cumulative live births were among those who started with artificial insemination but then switched to in vitro fertilization (over 80% had a birth by 5 years); with the next highest among those who started with in vitro fertilization (about 75% by 5 years), followed by those who only had artificial insemination (about 65% by 5 years), followed by those who only had more conservative treatment (about 55% by 5 years).

16
Singleton term live birth Most fertility experts and researchers
consider singleton term live birth to be the best measure for success of fertility treatment. This is the preferred measure used by the CDC and SART [56].
Multiple births, preterm births, and low birth weight
Some fertility treatments have a much higher risk of twins or multiple births, based on how they are currently practiced, especially IVF and superovulation [57]. Twin gestations are at much higher risk for preterm birth, low birth weight, and neonatal problems, including newborn intensive care and long-term effects on the health of the children [58]. We have assessed these outcomes in a population-based sample of births from Utah, Florida, and Maryland, using PRAMS data. The highest rates of preterm birth and low birthweight occurred in women giving birth after receiving IVF, IUI and OI and OI alone. [OI is called OS in the figure, for Ovulation Stimulation.] Low birthweight was consistently associated with treatment. Most of the excess risk for preterm birth and low birthweight in IVF was related to twins and higher order gestation pregnancies that are more common with IVF as it is usually practiced. The rates of multiple gestation (mostly twins) were 33.2% for IVF, 9.1% for AI, 8.3% for ovulation drugs, 0.7% for other treatment, 2.8% for spontaneous conception after prior treatment and 1.2% for women who never had treatment. [59] The increase in multiple gestation for some treatments are the main reason for the increased rates of preterm birth and low birth weight shown in Figure 7.
In the same dataset (Utah, Maryland, Florida PRAMS data), we found that the proportion of infants requiring seven or more days in the hospital was 18.7% for IVF, 11.2% for AI, 7.7% for ovulation drugs, 5.7% for other treatment, 6.4% for spontaneous conception after prior treatment, and 5.9% for women who never had treatment. These results are consistent with those from other studies nationally and internationally [60-65].

17
Alternative treatments Acupuncture may help improve pregnancy rates during IVF treatment, but some studies show a
positive impact, and other studies show no impact or a negative impact [66]. For other alternative treatments, such as herbs or massage therapy, there are no peer-reviewed data regarding their outcomes. More research is needed in these areas.
Other treatments Surgery has been shown to be effective at increasing pregnancy and live birth rates in women with
some conditions, such as endometriosis [67]. In countries outside the U.S.A., a systematic restorative approach based on ovulation/fertility cycle tracking, ovulation induction, and other supportive treatments has been shown to be effective for the majority of couples with infertility, with research in the U.S.A. ongoing [34, 68, 69].
The following three questions (8-10) are addressed together:
8. What are the estimated costs for different types of infertility treatments? 9. For those who received infertility treatments, how were the costs paid? 10. What coverage is available by insurers?
Financially, use of infertility treatments can be demanding. While a study in 2007 reported that 15 states have mandated at least partial coverage for infertility treatments, Utah is not one of these states [70]. For patients without insurance, or with insurance that does not cover treatments, the cost of infertility care has to come out of pocket, and it is often a significant drain on their life savings. Healthcare costs can vary widely for different couples, depending on procedures required for evaluation and treatment. For example, some women and men may require specific surgery to correct an underlying condition, while others do not require surgery. Also, a treatment that seems less expensive can end up costing more than expected if it is less effective and therefore used for more cycles before a pregnancy is achieved [71].
To gain an overview of the economic cost of fertility treatment for Utah families, we interviewed billing managers of the three SART-approved specialty fertility clinics in Utah. Table 4 gives the range of estimated costs and the estimated coverage, obtained from these clinics. These costs are estimates, and may vary according to specific diagnoses, conditions, or necessary procedures for any given couple. As agreed upon with the clinic managers, we do not specifically report on costs by specific clinic, but just report the highest and lowest estimate we received. The reported costs do not include costs of time or lost work for the couples, and they do not include costs related to pregnancy and birth, or any complications for pregnancy and birth.
Fertility evaluations and treatment regimens can be costly. Table 4 presents a range of costs obtained by direct query from the three specialty fertility clinics in Utah. One cycle of intra-uterine insemination including ovulation induction drugs and ultrasound can cost at minimum $1400. On the other end of the spectrum, IVF can cost up to $36,000 dollars when donor eggs are used. With the exception of the initial female and male evaluation, the majority of fertility treatments are not covered by insurance. Clinic billing managers noted that fertility treatment insurance coverage is not usually determined by the insurance company alone but rather by individual company policies. Patients who are employed by businesses willing to pay for fertility treatments have coverage. In general, costs for these fertility treatments are lower in Utah than many other States in the U.S.

18
Cost of twins In addition to the costs of fertility treatment, it is necessary to consider the costs incurred by twin (or
higher order multiple) pregnancies. We recently estimated costs across three local hospital systems for maternal and newborn care and found that twins cost a total of 1.7-3.8 times more per hospitalization than a singleton birth.
Geographical Access In Utah, access to specialty fertility
clinic services, as measured by driving time, is reasonable for the majority of the state’s population, along the Wasatch front. See Map 1. However, there are rural areas where access required long travel times (2 hours or more). This increased travel time to see specialists may suggest a need to train more primary care physicians and providers about basic evaluation and education on behaviors to enhance fertility, as described in Table 2. As telemedicine services increase, access to fertility services for those in rural areas may improve. Additionally, some couples may also travel out of state to seek fertility evaluation or treatments.
Table 4. Estimated range of costs and insurance coverage for common fertility treatments in specialty fertility clinics in Utah.
Min. $ Max. $ % Fully
Covered By Insurance
% Partially Covered By Insurance
% No Coverage by
Insurance
Standard Female Evaluation* $200 $1,850 37% 42% 21% Standard Male Evaluation** $200 $1,000 15% 55% 30% Intra-uterine insemination (IUI)*** $900 $2,300 35% 7% 58% IVF without ICSI $11,000 17,000 25% 10% 65% IVF with ICSI $12,800 $19,000 25% 10% 65% IVF with Donor Eggs $12,000 $36,000 - - - Frozen Embryo Transfer*** $3,000 $3,400 - - -
*Could include physical exam, blood work, antral follicle count, hysterosalpingogram (uterine X-ray), Sonohysterogram (uterine ultrasound), assessment of ovarian follicles/reserve.
**Could include physical exam, blood work, semen analysis, and/or ultrasound ***Includes ovulation induction drugs and ultrasound tracking ****Includes storage fees for frozen embryos

19
Impact of lack of insurance coverage on twins and multiple births The lack of insurance coverage for infertility treatment contributes to motivating some couples and
physicians to pursue more aggressive treatment earlier in their care (i.e., superovulation, with or without AI; or IVF with multiple embryos transferred) in the hopes of increasing the chance of live birth from any given cycle of treatment. This in turn has led to higher rate of multiple births nationwide, with their associated complications and costs [72]. On an individual basis, there is evidence that state-mandated insurance coverage for IVF modestly reduces the multiple pregnancy rate among couples receiving IVF [73]. However, in a recent population-based study, a correlation was found between insurance mandates to cover IVF and an increased rate of multiple births statewide [74]. This suggests that simply mandating insurance coverage for fertility treatment is insufficient to encourage healthier babies and lower costs. It is necessary, but not sufficient to have insurance coverage for fertility treatment alone. The insurance coverage and financial incentives need to be structured to encourage treatments that minimize the risk of multiple gestation (i.e., AI without superovulation; IVF with single embryo transfer) [57].
The University of Utah recently completed an pilot study (not yet published) in which some couples undergoing IVF were randomized to have their fees for cryopreservation (frozen embryos) waived, to incentivize them to transfer single embryos during their IVF treatment. If extra embryos are frozen, then couples can transfer one embryo at a time for 2 or 3 cycles if necessary, instead of transferring all the embryos in one single cycle. Those couples who were incentivized for single embryo transfer, compared to those who were not, had a much lower incidence of: multi-fetal gestation (5% vs. 55%; p=0.003), low birth weight (5% vs. 55%; p<0.0005), and preterm delivery (9.5% vs. 50%; p=0.004). This clearly indicates the large health and financial benefits than can accrue if couples and physicians are financially incentivized to apply treatment protocols that minimize the risk of multiple gestation.
11. What are barriers to seeking infertility services? In addition to geographic barriers to specialty care, there are other barriers to seeking infertility
services. The UFES included detailed interview data about the barriers to infertility services for women in Utah. UFES asked women about the reasons that women did not use doctor recommend fertility treatments, specifically by type of treatment. UFES also asked about reasons that women stopped using treatments, specifically by type of treatment. For each of these questions, women could select from the following options:
● Beliefs (my own, partners’ or family’s beliefs) ● Money (insurance coverage, job, or lack of money) ● Transportation (lack of transportation or distance to clinic was too great) ● Concerns (felt treatment wasn’t safe for me and my future baby, concern about procedure, did not
feel ready, wanted to try other forms of treatment) ● Doubt in process (felt that getting pregnant was impossible, felt that treatment wouldn’t work, did
not know here to go for help) ● Too busy (Life was so busy, this never became a priority, other demands) ● Physically drained ● Got pregnant ● Other (Thought a pregnancy would happen eventually, there was change in my relationship with
my partner, and other)

20
Barriers to use of fertility enhancing or ovulation induction (OI) drugs Fertility enhancing drugs, including ovulation induction medications or superovulation, as noted
previously, are the most commonly use treatment for infertility, Figures 8–10 present the overall frequencies for the reasons women gave for not using fertility enhancing drugs. The most common reasons were concerns about treatment, money, or achieved pregnancy. There are some differences by income (Figure 9) and education (Figure 10). Women with income between $50,000 and $70,000 were more likely to not use treatment because of cost. College graduates and women with higher income were more likely to have concerns about treatment. These differences are important considerations with regard to equity in access and knowledge about treatment options. Figures 11–13 present the frequencies for the reasons women gave for discontinuing provider-recommended fertility enhancing drugs. The most common reasons for discontinuing fertility drugs were doubting the process, money, and feeling physically drained. Women with middle income were more likely to discontinue treatment because of cost, while women with higher income were more likely to express physical exhaustion.
Barriers to use of artificial insemination (AI) Figures 14–16 present the frequencies for the reasons women gave for not using provider-
recommended artificial insemination (which is usually combined with ovulation induction or superovulation). The most common reasons for not using artificial insemination were money, concerns about the treatment, or pregnancy. Women with low or middle income were more likely to have trouble with the cost. Figures 17–19 present the frequencies for the reasons women gave for discontinuing provider-recommended artificial insemination. The most common reasons for discontinuing artificial insemination were doubting the process, money, and feeling physically drained. Women with higher income were more likely to doubt the process or feel physically drained.
Barriers to use of in vitro fertilization (IVF) Figures 20–22 present the frequencies for the reasons women gave for not using provider-
recommended IVF. The most common reasons for not using IVF were money (overwhelmingly high at 83%), concerns about the treatment, or doubting the process. Women of all income levels expressed equally high levels of concern about the cost. Figures 23–25 present the frequencies for the reasons women gave for discontinuing provider-recommended IVF. The most common reasons for discontinuing IVF were money (overwhelmingly high at 87%), concerns about the treatment, or doubting the process. Women with higher income were more likely to doubt the process or feel physically drained.
Barriers to use of alternative treatments Figures 26–28 present the frequencies for the reasons women gave for not using provider-
recommended alternative treatments (such as acupuncture or herbs). The most common reasons for not using alternative treatments were concerns about the treatment, money, and doubting the process. Women with middle income expressed more concern about money. Figures 29-31 present the frequencies for the reasons women gave for discontinuing provider-recommended alternative treatments. The most common reasons for discontinuing alternative treatments were doubt in the process (73%) and money (69%), as well as feeling physically drained and general concerns about safety and side effects. Women with higher education expressed more doubt in the process, while women with low or middle income had more concerns about money.

21

22

23

24

25
12. How does infertility impact a family's wellbeing and family members' health and mental health
status?
The UFES included detailed interview data about the impact of infertility on a woman’s life and
relationships. As shown in Figure 32, about half of women in UFES felt that infertility was disruptive to
their lives, and two-thirds indicated it was stressful. As shown in Figure 33, the impact on the marriage
or partnership was mixed: nearly 20% indicated that it had a negative impact; while just over 50% indicated a positive impact of working together on the problem.
Utah’s strong family-oriented culture may influence the impact of infertility [75]. In 2015, there were
50,776 live births in Utah. This set the Utah birth rate at 16.95 per 1000, the highest birth rate in the
United States [8]. The cultural emphasis on early marriage and childbearing may result in increased

26
pressure on couples to become pregnant and increased feelings of depression and incompetency when
fertility issues arise. Feelings of jealousy and envy can arise in women with infertility as they observe friends and acquaintances beginning to build their families [76]. A survey-based study done by the Utah
Infertility Resource Center (UIRC) reported that 85% of respondents said Utah’s family focused culture
influenced their infertility journey. Further, 75% reported that infertility was the most devastating event
of their life [77].
The National Survey of Fertility Barriers asks a set of questions about distress from infertility, perceived
stigma, and self-esteem [78]. Although the number of Utah women in the study is very limited (n=31), the
responses for Utah women were not any different on these dimensions from the overall national sample
in the United States. Thus, we do not have any direct evidence that the devastating psychological impact
of infertility is quantitatively different for Utah than for other states.
13. How does infertility impact the state of Utah demographically and economically?
One long-term consequence of the declining fertility rate is the change in the population’s demographic makeup. The age structure will shift gradually from young to old. The population 65 years and older will
be doubled to one in five Utahns and it will impact the type of services needed in the future [15]. At the
same time, over the past decade, the median age at first marriage in Utah has steadily increased, from
22.1 in 2005 to 24.3 in 2015. This is associated with decreased age-specific fertility rates among mid-teens, late teens, and those in their early 20s, and slight increases in age-specific fertility rates of those in
their late 30 and 40s [15]. This gradual shift in age-specific fertility rates causes a higher demand for
more aggressive and expensive fertility treatment, because at older age, more intensive treatment may be
needed. According to PRAMS data (2012-2015-Utah), women ≥ 35 years old compared to younger women significantly used more fertility treatment (20.5% vs 9.4%) and the treatments they received
were more aggressive and expensive compared to their young peers (36.9% IVF vs. 17.8%; 21%
insemination vs. 10.3%; but 29.9% drugs vs 53.2%). See Supplemental Tables 2 and 3.
The Institute of Medicine estimates US preterm births cost $26.2 billion annually, or $51,600 per preterm
baby, and approximately 40% are publicly funded. This represents an additional major cost when fertility
treatments increase the rate of twin or higher order births. (See Question 7)
In 2003, a new standard birth certificate was developed for the United States, National Center for Health
Statistics, which was gradually adopted by different states over the ensuing years. One of the items in the
new standard birth certificate is information about whether a pregnancy resulted from infertility
treatment. It is unclear how completely this information is captured from state to state. Nevertheless, an
analysis of these birth certificate data in 2011 from 31 states found that Utah reported the highest proportion of births due to some form of fertility treatment [85]. See Figure 34. It’s important to note
that in Utah, the proportion of women identified as receiving infertility treatment on the birth certificate
was lower than expected from PRAMS or clinical records. Therefore, the proportion of births with any fertility treatment reported in Figure 33 is likely low relative to the true proportion.
According to the Centers for Disease Control and Prevention, the financial impact of involuntary
childlessness and resulting treatment for depression and decreased work productivity in the U.S. has not
been fully investigated. Based on preliminary calculations, the cost of diagnosing and treating infertility
and its consequences exceeds $5 billion per year [79]. Infertility consequences includes maternal and

27
infant outcomes, including some longer-term disability
caused by multiple gestation, preterm delivery, and low birth weight [79]. If all couples affected by infertility
seek care and treatment, the overall cost would likely
be higher [79]. In Utah, as in many states, there is
limited insurance coverage for the initial assessment and subsequent treatment, and tracking out of pocket
expenditures for treatment is difficult [79]. As discussed
below, it is possible to structure insurance incentives to
reduce multiple gestations, which would reduce costs.
Furthermore, families in Utah are very likely to be
comprised of more than one child, the 2010 census
shows Utah to have the highest average number of people per household of any state, 3.1 compared to the
national average of 2.58 [80]. As shown in Figure 35,
the overall fertility rate in Utah is dropping somewhat
since the depression of 2008, but still remains much higher than the rest of the nation. This increased
number of children could also correlate with an
increased economic burden from a diagnosis of
secondary infertility.
14. What policies have other States of the United
States enacted for infertility evaluation, treatment,
and related issues, and what have been the results?
Enacted laws, requiring insurers to cover or offer
coverage for infertility diagnosis and
treatment, differ widely by state. Currently 13
states: Arkansas, Connecticut, Hawaii, Illinois, Louisiana, Maryland, Massachusetts, Montana,
New Jersey, New York, Ohio, Rhode Island and
West Virginia, have laws mandating insurers
to cover infertility diagnosis and treatment. In the states of California and Texas, insurance
companies are required to offer coverage for
infertility treatment. While insurance
companies in most of these states offer or
provide coverage for in vitro fertilization,
California, Louisiana, and New York’s laws
specifically exclude IVF. In Utah, insurers providing coverage for maternity benefits are
required to provide an indemnity benefit of up

28
to $4000 for adoption, and they have the option to apply this benefit also to fertility treatments, as
discussed next [81].
In the State of Utah, legislation regarding fertility benefits started with a requirement to add a benefit of
up to $4000 for to help pay for adoption in insurance plans that cover maternity benefits. In 2014, House
Bill 347 modified this provision to encourage insurance companies to allow this $4000 benefit to be
applied to fertility treatment. This was updated effective January 1,2018. The H.B. 336 Health Reform Amendments (2017 General Session) continue the provision of adoption or infertility treatments (Utah
Code Ann.§31A-22-610.1). Insurers may “comply with the provisions of this section by providing the
$4,000 adoption indemnity benefit to an enrollee to be used for the purpose of the enrollee obtaining
infertility treatments rather than seeking reimbursement for an adoption in accordance with terms
designated by the insurer.” [81] Insurers may allow an amount of $4000 to couples making a claim to go
to either costs of adoption or infertility treatments as long as the couple is also eligible for maternity
benefits [81]. However, this provision has had minimal utilization or impact to date, as insurers have not exercised this option.
In addition, passed during the 2018 General Session, SB 181, Infertility Insurance Coverage Pilot
Program, requires the Public Employees' Health Plan (PEHP) to create a 3-year pilot program to
implement the option of using the aforementioned benefit to help cover the cost of using an assisted reproductive technology. Under this program, each qualified individual who is participating in the pilot
program and eligible for maternity benefits will be eligible to receive a one-time, lifetime maximum
benefit of $4000 toward the cost of assisted reproductive technology (ART), or adoption. To be covered
by this program, the couple must: 1) have a condition that would cause infertility, or have been attempting to become pregnant for greater than a year; 2) signify the use of other infertility treatments
covered under the health benefit plan; 3) have the procedure performed at an approved facility. This
program will be used as an experiment to be concluded no later than November 30, 2021 to assess the effectiveness of providing ART treatments to qualifying couples [82].
Thus, under current Utah code and using estimates of costs stated previously in this report, for couples
involved in the pilot program from PEHP: artificial insemination with ovulation induction could be fully
covered for at 2-4 cycles, while IVF would only be about half covered (see Table 4). While of course, this aid to couples is a step forward, its overall impact may be limited for those couples who need IVF. Of note,
clinic managers at the Utah specialized fertility clinics informed us that to date, only a small handful of
PEHP insured patients have inquired about the new mandate. As the program progresses, they will
evaluate how impactful this additional coverage will be.
As noted above, states around the nation have their own varying codes on infertility treatments.
Massachusetts’ law under 22-176B-4J states that “Any subscription certificate under an individual or
group medical service agreement…shall provide as a benefit for all individual subscribers or
members….to the same extent that benefits are provided for other pregnancy-related
procedures……coverage for medically necessary expenses of diagnosis and treatment of infertility” [83].
Other states mandating comprehensive coverage include Rhode Island, Illinois, Maryland and New Jersey,
Arkansas, Connecticut, Hawaii, Louisiana, Montana, New York, and West Virginia. Further, two states Texas and California require companies to offer coverage. By offering it is meant that the insurance
coverage is required to communicate the availability of coverage to group contract holders [84]. There
are therefore, fifteen states more thoroughly covering infertility treatments than the state of Utah.

29
However, there are also states that limit treatment. For example, Minnesota law states that medical
assistance shall not provide coverage for fertility drugs if used to enhance fertility [84].
As noted earlier, at least 5% of Utah births have resulted from infertility treatment [85]. Theoretically, if
each of these couples making up the 5% throughout the state received a mandated $4000 of benefits, this
would mean a maximum $1,028,800 charged to insurance companies (assuming everyone had insurance
coverage). If the amount was to be raised to $10,000 (for more comprehensive coverage, again throughout the state) the sum for insurance companies would be a maximum of $25,572,000 [63-64].
Against these costs must also be considered the health costs that are associated with adverse physical
and mental health effects of untreated infertility in women and men. These are difficult to estimate, but
are real, and may have their own impacts on health insurance costs as well as the general economy of the
state.

30
Conclusions and Policy Recommendations Based on the data we have reviewed above, we recommend the following policy options for
consideration:
1) Monitor fertility treatment utilization and barriers to fertility related care, and associated twin and higher order births.
a. Take measures to improve the capture of key fertility information on the birth certificate questions that currently exist.
b. Make changes to the birth certificate questions and procedures to gather data to ensure as complete capture as possible of infertility (including untreated infertility) and fertility treatment on the birth certificate. (Like other medical history items, these would be maintained in the data file, but not given on the printed copy of the birth certificate.)
c. Continue to monitor birth outcomes, including twin and higher order gestation, and newborn hospitalization and complications among those using fertility treatment via birth certificate and supplementary data systems, including PRAMS, which is administered in Utah by the Utah Department of Health, Maternal and Infant Health Program.
2) Reduce socio-economic disparities in access to fertility evaluation and treatment through insurance policy and regulation, such as House Bill 347, 2014 (which “authorizes, at the discretion of the insurer, an indemnity benefit for adoption or infertility treatment”), and SB 181, 2017, which mandates this benefit in a pilot program through PEHP.
a. Work towards transparency in services available and pricing.
b. Encourage appropriate initial evaluation and treatment of infertility in primary care, and timely referral to specialized fertility treatment when indicated.
c. Ensure transparency in insurance coverage of fertility related care.
3) Evaluate the adoption and impact of recent legislation in Utah encouraging or mandating insurance coverage for fertility treatment (i.e., HB 347, 2014, and SB 181, 2017).
a. Assess actual implementation of the indemnity benefit and evaluate utilization and coverage of fertility treatments. This will provide critical data for future possible expansions to other insurances beyond PEHP.
b. Based on the experience of current legislation, additional steps towards mandated insurance coverage for fertility treatment in Utah could be considered and monitored in future years.
c. Consider coverage for fertility preservation services for individuals who are experiencing health conditions that could limit future fertility (e.g. chemotherapy).

31
4) Consider providing coverage for fertility evaluation and treatment through Medicaid and PCN. This will reduce socio-economic disparities in fertility care.
5) Design all coverage mandates or recommendations to incentivize treatment approaches that maximize singleton pregnancies, which pose lower risks to both mom and baby.
a. In the use of fertility drugs for ovulation induction with or without intrauterine insemination, the goal should be single ovulation rather than superovulation.
b. In IVF, the goal should be single embryo transfer rather than multiple embryo transfer, with frozen embryos for subsequent single embryo transfers, if needed.
c. Financial payment to providers should clearly encourage the above procedures to minimize the incidence of twins and higher order births, which are much more expensive for insurance and for society.
d. Any mandates for fertility coverage should be based on evidence-based guidelines. Where appropriate by diagnosis, prognosis and woman’s age, less invasive approaches should be encouraged prior to initiating IVF.
6) Support alternative routes to desired parenthood, including fostering and adoption.
a. Adoption should continue to be part of the options available for any insurance mandate, as it is currently.
b. Parental leave policy should include adoption and foster care.
7) Increase access of Utah specific information for medical providers and the public on reproductive planning, fertility, prevention of sexually transmitted infections, evidence-based information about fertility evaluation and treatment, and health practices that improve natural fertility (including smoking cessation, weight management, stress reduction).
a. While information is widely available on the internet, development of a resource which can link Utah residents and providers to vetted, evidence-based information and providers would be helpful.
b. Commonly used alternative treatments, such as herbs and acupuncture currently have little supporting data for success rates. Increased research in these areas could enhance treatment options.
c. Increase awareness about the role that age plays in fertility is important. Delaying childbearing beyond the woman’s age 35 incurs an increasing likelihood of infertility. Information about fertility preservation should also be available for individuals that anticipate delayed parenthood for health reasons or other life circumstances.
d. Promote public awareness of evidence-based fertility evaluation and treatment.

32
Supplemental Tables
Supplemental Table 1 Time to get pregnant among women who had a live intended birth by
demographic and health characteristics; PRAMS Data 2012-2015: Utah
Weighted N Total:
126,683
Less than a year
111,441 (88%)
A year or more 15,242 (12%)
P value
Maternal characteristics ● Maternal age
Less than 35 years 35+ years
111623
15060
89.6 76.2
10.4 23.8
<.0001
● Education level Less than high school Completed high school Some college College graduate
6811
18527 44814 53918
86.3 86.7 88.1 88.5
13.7 13.3 11.9 11.5
0.6272
● Race White/non-Hispanic All Other
111306
13634
88.0 88.0
12.0 12.0
0.9871
● Marital status Married Other
116928
9709
88.0 88.0
12.0 12.0
0.9650
● Federal poverty level
≤100% of FPL
101-133% of FPL 134-185% of FPL >185% of FPL
16427 12114 16077 78799
91.2 91.0 91.2 86.3
8.8 9.0 8.8
13.7
0.0026
● Insurance before pregnancy No insurance Medicaid Private/group insurance Other insurance
15141
6728 99207
5043
89.8 95.7 87.0 91.6
10.2
4.3 13.0
8.4
0.0024
● Pre-pregnancy BMI Underweight (<18.5) Normal (18.5-24.9) Overweight (25.0-29.9) Obese (30.0+)
6000
72427 26324 20975
94.2 90.1 88.3 78.1
5.8 9.9
11.7 21.9
<.0001
● Smoked 3 months before pregnancy Yes No
1950
124572
84.5 88.1
15.5 11.9
0.4143
● Alcoholic drinks 3 months before pregnancy Yes
● No
26041 99692
84.5 88.8
15.5 11.2
0.0090
Pregnancy related outcomes
o Number of fetuses Singleton Twin Triplet, etc.
124468
2150 65
88.4 66.4 30.3
11.6 33.6 69.7
<.0001
o Congenital defect Yes No
879
125769
70.6 88.1
29.4 11.9
0.0126

33
Supplemental Table 2 Use of infertility treatment among women who had a live intended birth by
demographic and health characteristics; PRAMS Data 2012-2015: Utah
Weighted N Total:
126,688
Used infertility treatment (%)
13,524 (10.7%)
Did not use infertility treatment
(%) 113,164 (89.3)
P value
Maternal characteristics ● Maternal age
Less than 35 years 35+ years
110118
14890
9.4
20.5
90.6 79.5
<.0001
● Education level Less than high school Completed high school Some college College graduate
6386
18408 44273 53397
4.7 9.2
10.4 12.3
95.3 90.8 89.6 87.7
0.0064
● Race White/non-Hispanic Other
110141
13236
10.7 11.7
89.3 88.3
0.6053
● Marital status Married Other
115684
9258
11.2
5.8
88.8 94.2
0.0164
● Federal poverty level
≤100% of FPL
101-133% of FPL 134-185% of FPL >185% of FPL
16212 11580 15916 78028
3.8 7.1 3.9
14.2
96.2 92.9 96.1 85.8
<.0001
● Insurance before pregnancy No insurance Medicaid Private/group insurance Other insurance
14819
6722 97971
4933
4.5 0.8
12.6 7.8
95.5 99.2 87.4 92.2
<.0001
● Pre-pregnancy BMI Underweight (<18.5) Normal (18.5-24.9) Overweight (25.0-29.9) Obese (30.0+)
6055
71389 25955 20689
6.9 9.6
10.7 16.1
93.1 90.4 89.3 83.9
0.0019
● Smoked 3 months before pregnancy Yes No
1923
122925
6.3
10.8
93.7 89.2
0.2021
● Alcoholic drinks 3 months before pregnancy Yes No
25432 98656
87.1 89.8
12.9 10.2
0.0844
Pregnancy related outcomes o Months try get pregnant
0-6 months 7-12 months 13-24 months >24 months
96347 12576
6861 8102
3.4
22.5 39.3 55.6
96.6 77.5 60.7 44.4
<.0001
o Number of fetus Singleton Twin Triplet, etc.
122714
2229 65
10.0 48.0 85.5
90.0 52.0 14.5
<.0001
o Congenital defect Yes No
861
124113
17.1 10.7
82.9 89.3
0.3393

34
Supplemental Table 3 Type of treatment utilized at time of conception by demographic
characteristics among women who took fertility drugs or received any medical procedures from a doctor, nurse, or other health care worker to help them get pregnant with their new baby; PRAMS
Data 2012-2015: Utah
ART 18.2% (13.5,2
3.0)
Insemination 12.7%
(8.6, 16.8)
Drugs only 47.9%
(41.6, 54.3)
Other 9.8% (5.9,
13.6)
None 11.4% (7.1,
15.6)
P value
Maternal characteristics ● Maternal age
Less than 35 years 35+ years
12.8 36.9
10.3 21.0
53.2 29.9
10.9
5.6
12.8
6.6
<.0001
● Education level Less than high school Completed high school Some college College graduate
12.0 13.4
9.0 27.3
2.8
11.6 6.0
17.2
65.0 53.2 53.8 41.9
15.0 18.0 12.6
5.1
5.2 3.7
18.6 8.5
<.0001
● Race White/non-Hispanic Other
19.1 14.0
12.6
9.1
46.5 61.5
9.6
10.5
12.2
4.9
0.3898
● Marital status Married Other
18.2 19.7
13.2
1.4
48.3 40.2
9.1
25.6
11.3 13.0
0.2170
● Federal poverty level ≤133% of FPL ≥134% of FPL
0.7
20.1
9.0
13.2
49.5 48.1
22.4
7.7
18.3 10.8
0.0051
● Insurance before pregnancy No insurance / Medicaid Private/group insurance / Other
insurance
3.7 19.1
7.1 12.9
34.8 48.7
39.2 8.1
15.1 11.2
<.0001
● Pre-pregnancy BMI Underweight / Normal Overweight / Obese
18.7 17.9
14.3
9.8
46.8 49.7
9.0
10.8
11.2 11.8
0.8524
● Smoked 3 months before pregnancy Yes No
0
18.5
21.8 12.7
33.6 48.3
31.7
9.1
12.8 11.4
● Alcoholic drinks 3 months before pregnancy
Yes No
23.0 16.8
20.5 9.5
42.9 49.9
7.2 10.7
6.4 13.2
0.0833
Pregnancy related outcomes o Months try get pregnant
0-6 months 7-12 months 13-24 months >24 months
11.7
3.9 17.4 32.0
13.2 17.9 10.0
9.1
59.4 51.6 52.0 36.7
8.3 9.0
13.1 9.1
7.4
17.6 7.5
13.2
0.0085
o Number of fetus Singleton Twin or more
14.0 62.4
12.5 14.7
51.1 15.2
10.0
6.9
12.4
0.8
<.0001
o Congenital defect Yes No
25.7 18.2
63.2 12.4
11.1 48.2
0
9.8
0
11.4

35
References 1. Thoma, M.E., et al., Prevalence of infertility in the United States as estimated by the current duration
approach and a traditional constructed approach. Fertil Steril, 2013. 99(5): p. 1324-1331.e1. 2. Stanford, J.B., What is the true prevalence of infertility? Fertil Steril, 2013. 99(5): p. 1201-2. 3. Evers, J.L., Female subfertility. Lancet, 2002. 360(9327): p. 151-9. 4. Warner, L., D.J. Jamieson, and W.D. Barfield, CDC releases a National Public Health Action Plan for
the Detection, Prevention, and Management of Infertility. J Womens Health (Larchmt), 2015. 24(7): p. 548-9.
5. WHO. Infertility is a global public health issue 2018 [cited 2018 9/13/2018]; Available from: http://www.who.int/reproductivehealth/topics/infertility/perspective/en/.
6. Daniilidis, A. and K. Dinas, Long term health consequences of polycystic ovarian syndrome: a review analysis. Hippokratia, 2009. 13(2): p. 90-2.
7. Kvaskoff, M., et al., Endometriosis: a high-risk population for major chronic diseases? Hum Reprod Update, 2015. 21(4): p. 500-16.
8. IBIS-UDOH. Complete Health Indicator Report of Birth Rates. 2018 [cited 2018 9/19/2018]; Available from: https://ibis.health.utah.gov/indicator/complete_profile/BrthRat.html.
9. IBIS-UDOH. Complete Health Indicator Report of Utah Population Characteristics: Age Distribution of the Population. 2018 [cited 2018 9/28/2018]; Available from: https://ibis.health.utah.gov/indicator/complete_profile/AgeDistPop.html.
10. IBIS-UDOH. Health Indicator Report of Utah Population Characteristics: Poverty, All Persons. 2018 [cited 2018 9/19/2018]; Available from: https://ibis.health.utah.gov/indicator/view/Pov.UT_US.html.
11. IBIS-UDOH. Complete Health Indicator Report of Health Insurance Coverage. 2017 [cited 2018 9/19/2018]; Available from: https://ibis.health.utah.gov/indicator/complete_profile/HlthIns.html.
12. IBIS-UDOH. Query Results for Population Estimates Query Module for Race/Ethnicity (Race Alone) - Count. 2017 [cited 2018 9/19/2018]; Available from: https://ibis.health.utah.gov/query/result/pop/PopRaceAlone/Count.html.
13. IBIS-UDOH. Complete Health Indicator Report of Chlamydia Cases. 2017 [cited 2018 9/28/2018]; Available from: https://ibis.health.utah.gov/indicator/complete_profile/ChlamCas.html.
14. IBIS-UDOH. Complete Health Indicator Report of Gonorrhea Cases. 2017 [cited 2018 9/28/2018]; Available from: https://ibis.health.utah.gov/indicator/complete_profile/GonCas.html.
15. Hollingshaus, M., et al., Fertility in Utah since the great recession: the new normal or a pregnant pause? Gardner Business Review, 2017.
16. IBIS-UDOH. Complete Health Indicator Report of General Fertility Rate. 2018 [cited 2018 8/27/2018]; Available from: https://ibis.health.utah.gov/indicator/complete_profile/FertRat.htm.
17. WHO. Health situation and trend assessment: Total Fertility Rate. 2018 [cited 2018 8/30/2018]; Available from: http://www.searo.who.int/entity/health_situation_trends/data/chi/TFR/en/.
18. Chandra A, et al., Fertility, family planning, and reproductive health of U.S. women: data from the 2002 National Survey of Family Growth, in Vital and Health Statistics Series 23: Data from the National Survey of Family Growth 2005. 2005, Centers for Disease Control and Prevention, National Center for Health Statistics. p. 1-160.
19. Fertility: assessment and treatment for people with fertility problems. Royal College of Obstetricians and Gynaecologists Press, 2004.
20. Healy, D.L., A.O. Trounson, and A.N. Andersen, Female infertility: causes and treatment. Lancet, 1994. 343(8912): p. 1539-44.

36
21. Izzo, C.R., P.A. Monteleone, and P.C. Serafini, Human reproduction: current status. Rev Assoc Med Bras (1992), 2015. 61(6): p. 557-9.
22. Stanford, J.B. and D.B. Dunson, Effects of sexual intercourse patterns in time to pregnancy studies. Am J Epidemiol, 2007. 165(9): p. 1088-95.
23. Wilcox, A.J., C.R. Weinberg, and D.D. Baird, Timing of sexual intercourse in relation to ovulation. Effects on probability of conception, survival of the pregnancy, and sex of baby. N Engl J Med, 1995. 333(23): p. 1517-21.
24. Louis, J.F., et al., The prevalence of couple infertility in the United States from a male perspective: evidence from a nationally representative sample. Andrology, 2013. 1(5): p. 741-8.
25. Berga, S.L., Social determinants of infertility: beyond the obvious. Fertil Steril, 2016. 105(6): p. 1459-60.
26. Martins, M.V., et al., Marital stability and repartnering: infertility-related stress trajectories of unsuccessful fertility treatment. Fertil Steril, 2014. 102(6): p. 1716-22.
27. De Frene, V., et al., Sexual and relational satisfaction in couples where the woman has polycystic ovary syndrome: a dyadic analysis. Hum Reprod, 2015. 30(3): p. 625-31.
28. Qiao, J. and R. Li, Fertility preservation: challenges and opportunities. Lancet, 2014. 384(9950): p. 1246-7.
29. National Public Health Action Plan 2014. 2014. 30. Chandra, A., C.E. Copen, and E.H. Stephen, Infertility Service Use in the United States: Data From the
National Survey of Family Growth, 1982–2010, in National Health Statistics Reports. 2014, Centers for Disease Control and Prevention, National Center for Health Statistics.
31. Boltz, M.W., et al., Fertility Treatment, Use of in Vitro Fertilization, and Time to Live Birth Based on Initial Provider Type. J Am Board Fam Med, 2017. 30(2): p. 230-238.
32. Hull, M.G., Infertility treatment: relative effectiveness of conventional and assisted conception methods. Hum Reprod, 1992. 7(6): p. 785-96.
33. Copperman, A.B. and A.H. DeCherney, Turn, turn, turn. Fertil Steril, 2006. 85(1): p. 12-3. 34. Stanford, J.B., T.A. Parnell, and P.C. Boyle, Outcomes from treatment of infertility with natural
procreative technology in an Irish general practice. J Am Board Fam Med, 2008. 21(5): p. 375-84. 35. Hammoud, A.O., et al., In vitro fertilization availability and utilization in the United States: a study of
demographic, social, and economic factors. Fertil Steril, 2009. 91(5): p. 1630-5. 36. SART. 2018 [cited 2018; Available from: www.sart.org. 37. Stanford, J. and S. Simonsen, Infertility in Utah, 2004-5. Utah's Health An Annual Review 2007,
2007(12 Suppl.): p. 153-7. 38. Henne, M.B. and M.K. Bundorf, Insurance mandates and trends in infertility treatments. Fertil Steril,
2008. 89(1): p. 66-73. 39. Pashayan, N., G. Lyratzopoulos, and R. Mathur, Cost-effectiveness of primary offer of IVF vs. primary
offer of IUI followed by IVF (for IUI failures) in couples with unexplained or mild male factor subfertility. BMC Health Serv Res, 2006. 6: p. 80.
40. CDC. What is PRAMS? 2018 [cited 2018 6/6/2018]; Available from: https://www.cdc.gov/prams/. 41. UDOH. Birth Records. 2016 [cited 2018 9/14/2018]; Available from:
https://vitalrecords.utah.gov/records. 42. CDC. National Survey of Family Growth. 2018 [cited 2018 9/14/2018]; Available from:
https://www.cdc.gov/nchs/nsfg/index.htm. 43. Bruckner, T.A., L.H. Mortensen, and R.A. Catalano, Spontaneous Pregnancy Loss in Denmark
Following Economic Downturns. Am J Epidemiol, 2016. 183(8): p. 701-8. 44. Practice Committee of the American Society for Reproductive Medicine, Diagnostic evaluation of
the infertile male: a committee opinion. Fertil Steril, 2015. 103(3): p. e18-25.

37
45. Fluker, M., S.J.F.T. Fisher, Hurd WW. Clinical reproductive medicine, and s.N. York, Anovulation and ovulatory dysfunction. 2007: p. 277-86.
46. Mallepaly, R., Genetic basis of male and female infertility, in Genetics of Human Infertility. 2017: p. 1-16.
47. Optimizing natural fertility: a committee opinion. Fertil Steril, 2017. 107(1): p. 52-58. 48. Buck Louis, G.M., et al., Incidence of endometriosis by study population and diagnostic method: the
ENDO study. Fertil Steril, 2011. 96(2): p. 360-5. 49. Hahn, K.A., et al., Predicting pregnancy among women with no known fertility problems. Fertility
and Sterility, 2015. 104(3): p. e111-e112. 50. Stanford, J.B., et al., Use of clomiphene citrate in the University of Utah Community Clinics. J Reprod
Med, 2013. 58(5-6): p. 229-33. 51. Klitzman, R., Gatekeepers for infertility treatment? Views of ART providers concerning referrals by
non-ART providers. Reprod Biomed Soc Online, 2018. 5: p. 17-30. 52. CDC. ART success rates. 2018 [cited 2018; Available from:
https://www.cdc.gov/art/artdata/index.html. 53. Steures, P., et al., Prediction of an ongoing pregnancy after intrauterine insemination. Fertil Steril,
2004. 82(1): p. 45-51. 54. Luke, B., et al., Cumulative birth rates with linked assisted reproductive technology cycles. N Engl J
Med, 2012. 366(26): p. 2483-91. 55. Malchau, S.S., et al., The long-term prognosis for live birth in couples initiating fertility treatments.
Hum Reprod, 2017: p. 1-11. 56. Sunderam, S., et al., Assisted Reproductive Technology Surveillance - United States, 2014. MMWR
Surveill Summ, 2017. 66(6): p. 1-24. 57. Stanford, J.B., What Kind of Policies for Fertility Treatment would Improve Affordability and
Outcomes for Individuals and the Public? Paediatr Perinat Epidemiol, 2017. 58. Keith, L.G., J.J. Oleszczuk, and D.M. Keith, Multiple gestation: reflections on epidemiology, causes, and
consequences. International Journal of Fertility and Womens Medicine, 2000. 45(3): p. 206-14. 59. Stanford, J.B., S.E. Simonsen, and L. Baksh, Fertility treatments and adverse perinatal outcomes in a
population-based sampling of births in Florida, Maryland, and Utah: a cross-sectional study. Brit J Obstet Gynecol, 2016. 123(5): p. 718-29.
60. Allen, C., et al., Pregnancy and perinatal outcomes after assisted reproduction: a comparative study. Irish J Med Sci, 2008. 177(3): p. 233-41.
61. Wisborg, K., H.J. Ingerslev, and T.B. Henriksen, In vitro fertilization and preterm delivery, low birth weight, and admission to the neonatal intensive care unit: a prospective follow-up study. Fertil Steril, 2010. 94(6): p. 2102-6.
62. Davies, M.J., et al., Reproductive technologies and the risk of birth defects. N Engl J Med, 2012. 366(19): p. 1803-13.
63. Jackson, R.A., et al., Perinatal outcomes in singletons following in vitro fertilization: a meta-analysis. Obstet Gynecol, 2004. 103(3): p. 551-63.
64. Ombelet, W., et al., Perinatal outcome of 12,021 singleton and 3108 twin births after non-IVF-assisted reproduction: a cohort study. Hum Reprod, 2006. 21(4): p. 1025-32.
65. Ombelet, W., et al., Obstetric and perinatal outcome of 1655 ICSI and 3974 IVF singleton and 1102 ICSI and 2901 IVF twin births: a comparative analysis. Reprod Biomed Online, 2005. 11(1): p. 76-85.
66. Meldrum, D.R., et al., Acupuncture--help, harm, or placebo? Fertil Steril, 2013. 99(7): p. 1821-4. 67. Jacobson, T.Z., et al., Laparoscopic surgery for subfertility associated with endometriosis. Cochrane
Database Syst Rev, 2002(4).

38
68. Boyle, P.C., et al., Healthy Singleton Pregnancies From Restorative Reproductive Medicine (RRM) After Failed IVF. Front Med (Lausanne), 2018. 5: p. 210.
69. Tham, E., K. Schliep, and J. Stanford, Natural procreative technology for infertility and recurrent miscarriage: outcomes in a Canadian family practice. Can Fam Physician, 2012. 58(5): p. e267-e274.
70. Henne, B.M. and K.M. Bundorf, Insurance mandates and trends in infertility treatments. Ferility and Sterility, 2008. 89(1): p. 66-73.
71. Voorhis, B.J.V., et al., Cost-effiectiveness of infertility treatments: a cohort study. Fertility and Sterility, 1997. 67(5): p. 830-836.
72. Kulkarni, A.D., et al., Fertility treatments and multiple births in the United States. N Engl J Med, 2013. 369(23): p. 2218-25.
73. Provost, M.P., et al., State Insurance Mandates and Multiple Birth Rates After In Vitro Fertilization. Obstet Gynecol, 2016. 128(6): p. 1205-1214.
74. Kulkarni, A.D., et al., Affordability of Fertility Treatments and Multiple Births in the United States. Paediatr Perinat Epidemiol, 2017. 31(5): p. 438-448.
75. Stanford, J.B. and K.R. Smith, Marital fertility and income: moderating effects of the Church of Jesus Christ of Latter-day Saints religion in utah. J Biosoc Sci, 2013. 45(2): p. 239-48.
76. Domar, Zuttermeister, and Friedman, The Pyschological Impact of Infertility: A comparsion with pateints with other medical conditions. Journal of Psychosomatic OBstetrics and Gynaecolog, 1993(14): p. 45-52.
77. Infertility Experience in Utah. UIRC Newsletter, 2016. 78. Shreffler, K.M., et al., Infertility and fertility intentions, desires, and outcomes among US women.
Demographic Research, 2016. 35(39): p. 1149-1168. 79. CDC. A Public Health Focus on Infertility Prevention, Detection, and Management. 2015 [cited 2018
9/14/2018]; Available from: https://www.cdc.gov/reproductivehealth/infertility/whitepaper-pg1.htm#tabs-793807-1.
80. Households and Families. U.S. Census Bureau: Washington D.C, 2012. 81. Indemnity benefit for adoption or infertility treatments 31A-22-610.1. Utah State Legislature: Salt
Lake City, 2017. 82. Expanded Infertility Treatment coverage pilot program 49-20-418. 2018: Salt Lake City. 2018. 83. Infertility and diagnosis and treatment benefits. 2018, Massachusetts' StateL egislature: Boston.
2018. 84. State Laws Related to Insurance Coverage For Infertility Treatment. 2018, NCSL: Denver. 2018. 85. Osterman, M.J., et al., Newly released data from the revised U.S. birth certificate, 2011. Natl Vital Stat
Rep, 2013. 62(4): p. 1-22.