industry update -australia - apla sue van... · • lotto portfolio growth has been driven by...
TRANSCRIPT
Industry Update
- Australia -
Sue van der Merwe
General Manager Group Lottery Operations
Tatts Lotteries
1
2013 Annual Regional Conference
Presentation Outline
• Australian Gambling Market
• Australian Lotteries Market
• Key Developments
2
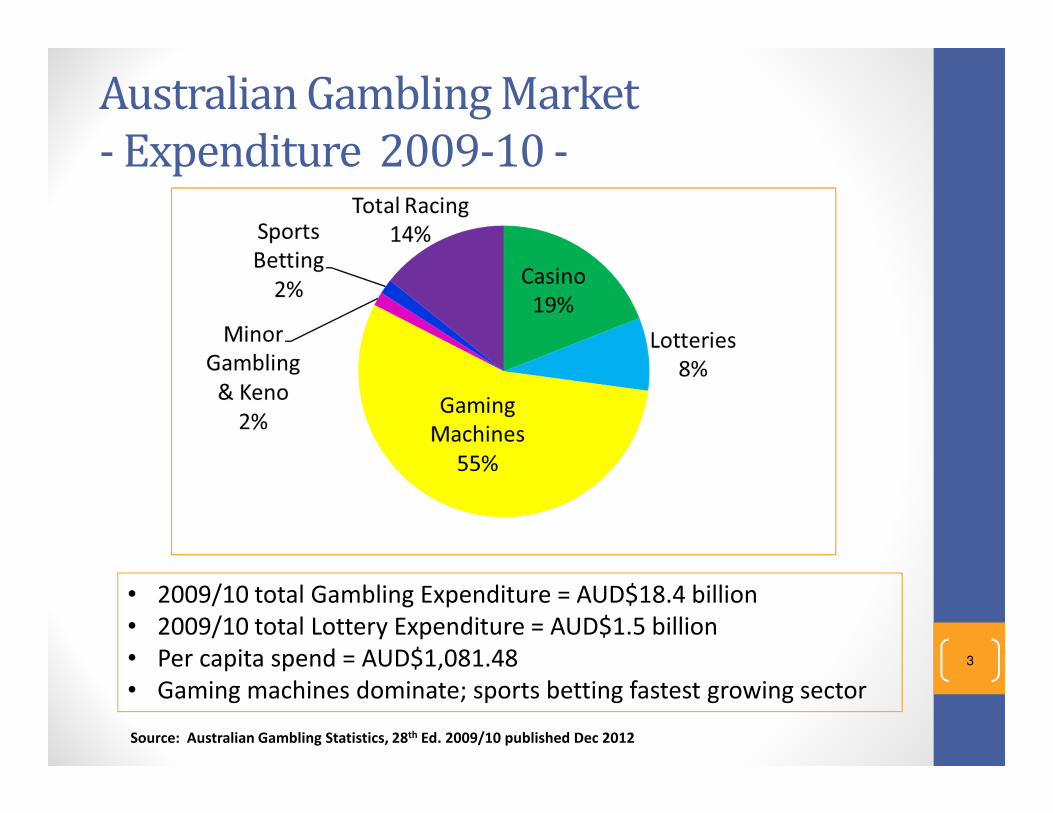
Australian Gambling Market
- Expenditure 2009-10 -
3
• 2009/10 total Gambling Expenditure = AUD$18.4 billion
• 2009/10 total Lottery Expenditure = AUD$1.5 billion
• Per capita spend = AUD$1,081.48
• Gaming machines dominate; sports betting fastest growing sector
Source: Australian Gambling Statistics, 28th Ed. 2009/10 published Dec 2012
4
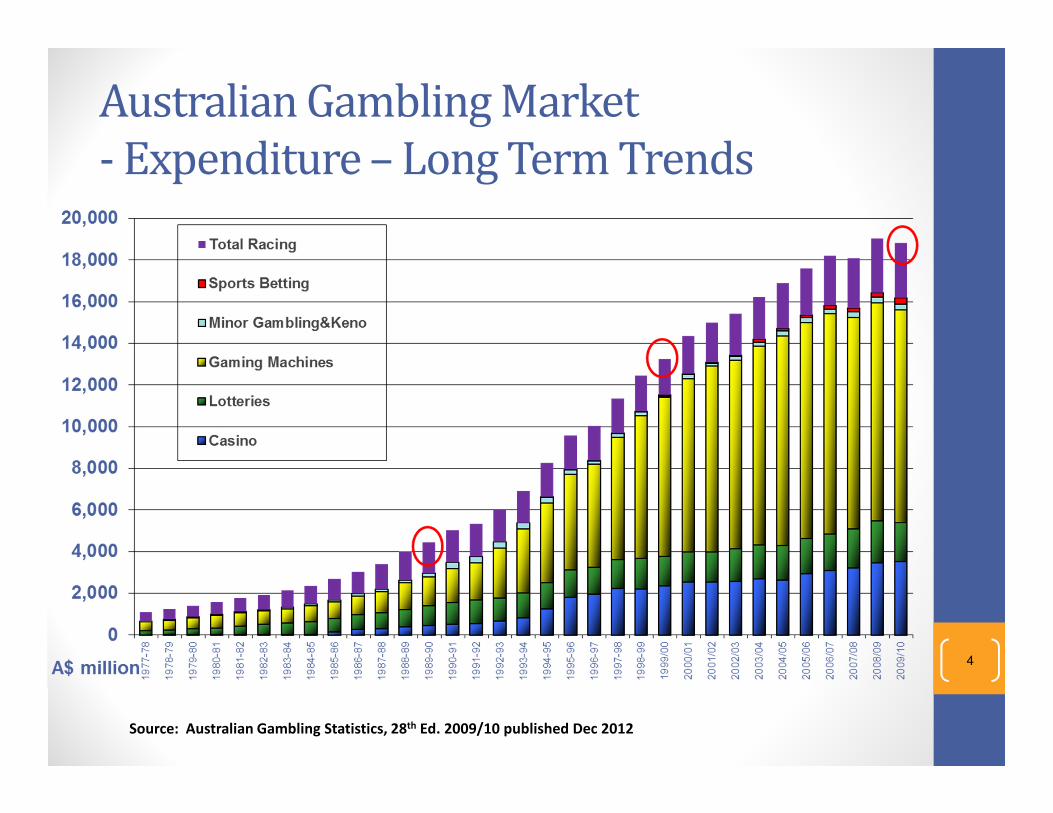
Australian Gambling Market
- Expenditure – Long Term Trends
Source: Australian Gambling Statistics, 28th Ed. 2009/10 published Dec 2012

5
Australian Gambling Market
- Percentage Share -
Source: Australian Gambling Statistics, 28th Ed. 2009/10 published Dec 2012
6
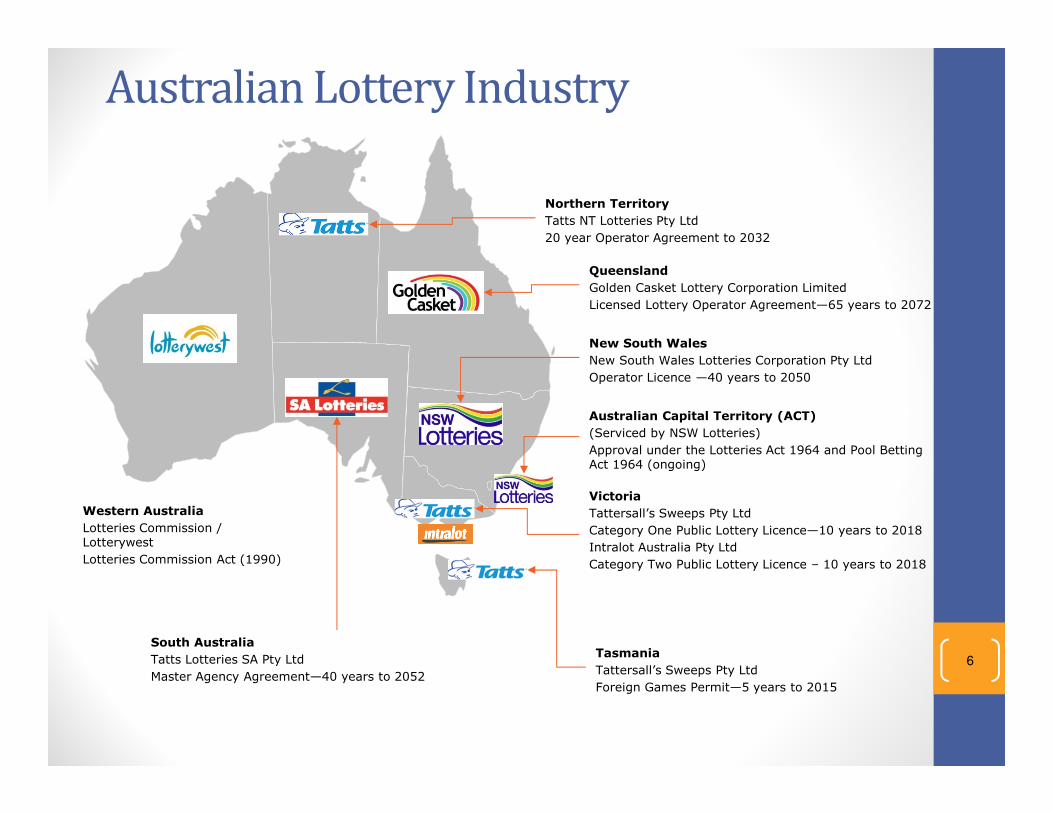
Australian Lottery Industry
Western Australia
Lotteries Commission / Lotterywest
Lotteries Commission Act (1990)
Northern Territory
Tatts NT Lotteries Pty Ltd
20 year Operator Agreement to 2032
Queensland
Golden Casket Lottery Corporation Limited
Licensed Lottery Operator Agreement—65 years to 2072
New South Wales
New South Wales Lotteries Corporation Pty Ltd
Operator Licence —40 years to 2050
Australian Capital Territory (ACT)
(Serviced by NSW Lotteries)
Approval under the Lotteries Act 1964 and Pool Betting Act 1964 (ongoing)
Victoria
Tattersall’s Sweeps Pty Ltd
Category One Public Lottery Licence—10 years to 2018
Intralot Australia Pty Ltd
Category Two Public Lottery Licence – 10 years to 2018
Tasmania
Tattersall’s Sweeps Pty Ltd
Foreign Games Permit—5 years to 2015
South Australia
Tatts Lotteries SA Pty Ltd
Master Agency Agreement—40 years to 2052
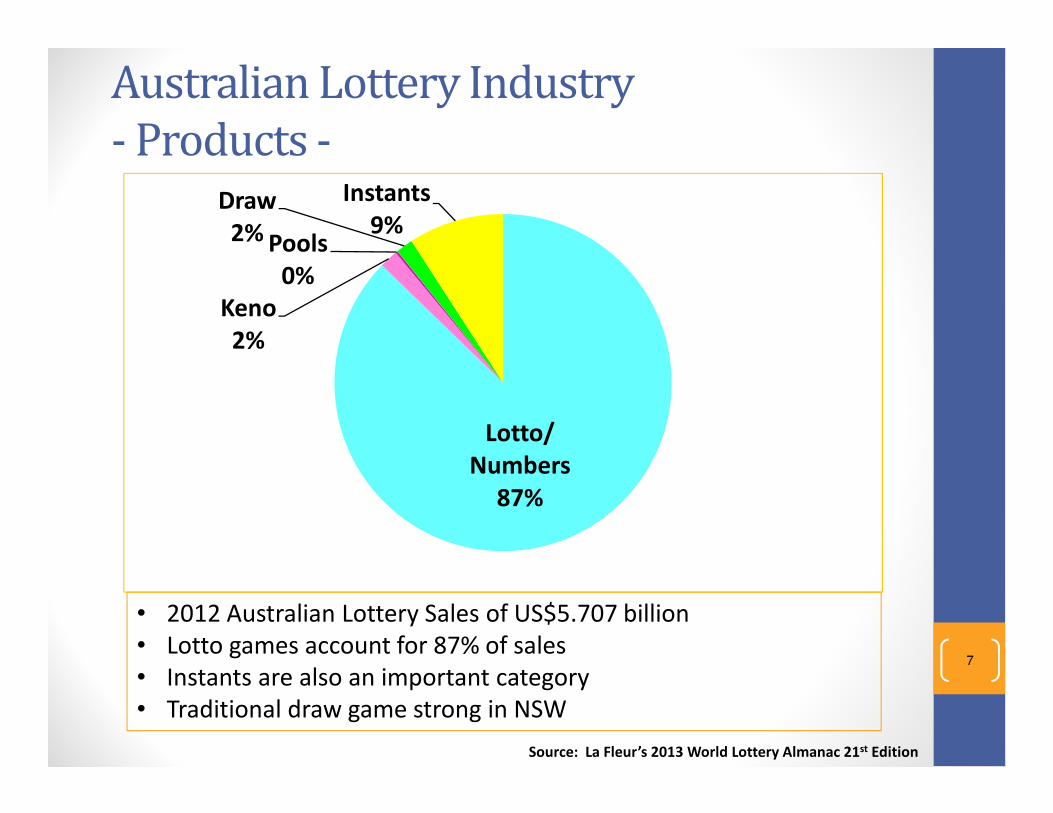
Australian Lottery Industry
- Products -
7
Source: La Fleur’s 2013 World Lottery Almanac 21st Edition
• 2012 Australian Lottery Sales of US$5.707 billion
• Lotto games account for 87% of sales
• Instants are also an important category
• Traditional draw game strong in NSW
Lotto/
Numbers
87%
Keno
2%
Pools
0%
Draw
2%
Instants
9%

8
Australian Lotteries
- Rankings in the Global Lottery Industry
2012 World Rankings - Lotto Per Capita (US$)
Rank Lottery Per Capita
1. Lotterywest $305
3. Tattersall’s $236
4. Golden Casket $212
6. NSW Lotteries $187
7. South Australian Lotteries $184
(Tatts Lotteries overall ranks as number 3 at US$208)

Sales Trends
- Last 4 years -
9
Source: La Fleur’s World Lottery Almanacs
$-
$1,000
$2,000
$3,000
$4,000
$5,000
$6,000
2009 2010 2011 2012
Lotto/Numbers Keno Pools Draw Instants
US$M
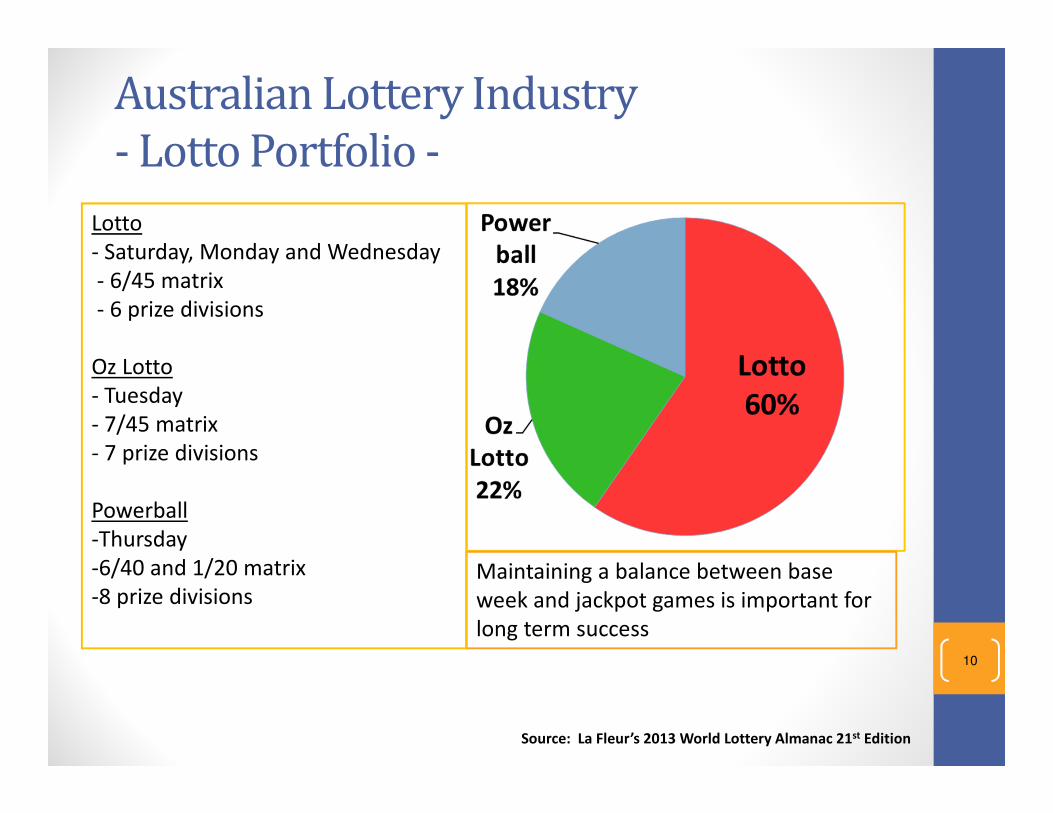
Australian Lottery Industry
- Lotto Portfolio -
10
Source: La Fleur’s 2013 World Lottery Almanac 21st Edition
Maintaining a balance between base
week and jackpot games is important for
long term success
Lotto
- Saturday, Monday and Wednesday
- 6/45 matrix
- 6 prize divisions
Oz Lotto
- Tuesday
- 7/45 matrix
- 7 prize divisions
Powerball
-Thursday
-6/40 and 1/20 matrix
-8 prize divisions

Key Trends and Developments
• Lotto portfolio growth has been driven by regular
game changes which are always done with the
portfolio impact in mind
• Small and regular price increases are a regular
part of the way we manage the lotto portfolio
• Instants sales have been under some pressure –
disposable income issue
• Responsible Play is an integral part of our lottery
operations
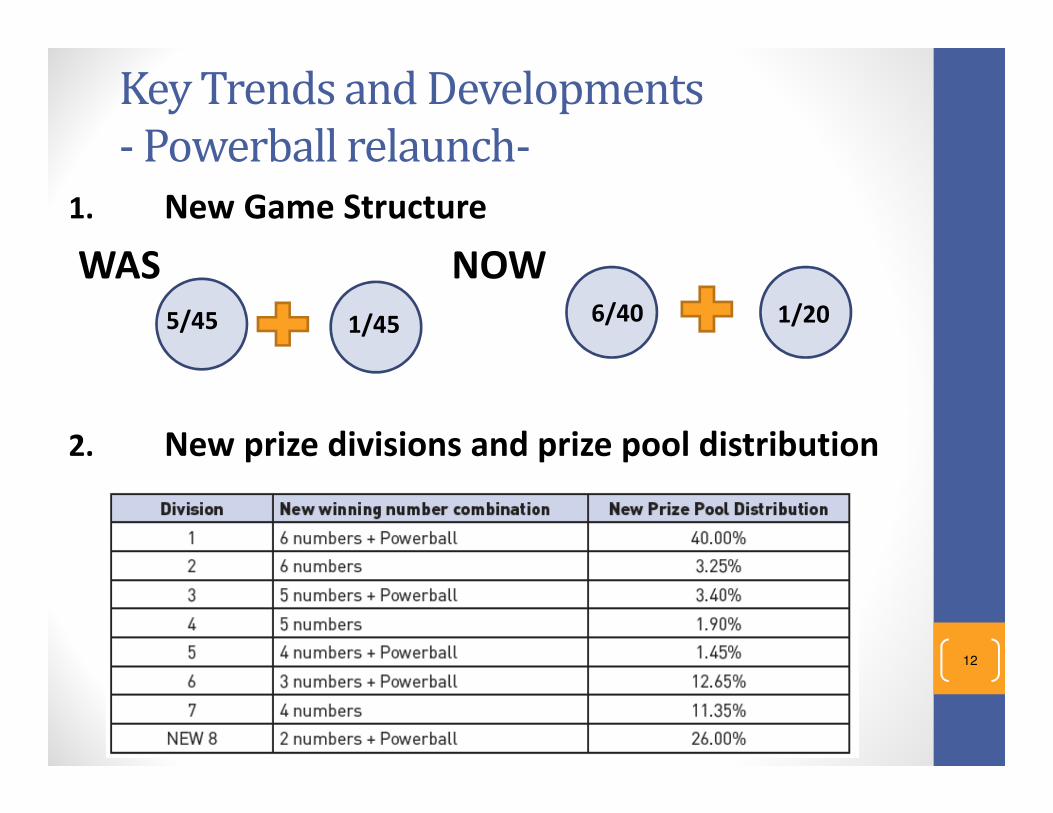
Key Trends and Developments
- Powerball relaunch-
12
1. New Game Structure
WAS NOW
2. New prize divisions and prize pool distribution
5/45 1/45 6/40 1/20

Key Trends and Developments
- Powerball relaunch-
3. New chances of winning
Chance of winning a Division One prize in Powerball
changed from 1 in 54,979,152 to 1 in 76,767,600. The
chance of winning any prize in Powerball improved
from 1 in 119 to 1 in 78.
4. Price Increase
The price per game increased by ten cents from 75
cents to 85 cents, plus agent commission.

Key Trends and Developments
- Powerball relaunch-
5. New jackpot sequence
In an attempt to reach bigger jackpots much faster
and more often, the $15M level was removed from
the sequence.
WAS
NOW

Key Trends and Developments
- Powerball relaunch-
6. Early Results
•Jackpot rolled to $60 million early on but since then
jackpots have been a little under expectation (the game
is being won at lower levels).
•New Division 8 has delivered 3,096,888 MORE
WINNERS, in the first 6 months compared to the
previous divisional structure (average division 8 prize
payment is $13.66 ).
•Players are positive about the change

Thank You
16