industry structure and value-motivated conglomeration
TRANSCRIPT

Industry Structure and Value-Motivated Conglomeration
Timothy R. Burch University of Miami
Vikram Nanda University of Michigan
M. P. Narayanan University of Michigan
October 2004
ABSTRACT
Agency problems are often cited to explain why managers diversify their firms even though
diversification strategies are often claimed to destroy value. In theory, however,
conglomeration can be beneficial and the popular press often discusses conglomeration
decisions as being driven by industry conditions. We argue that value maximization theories of
conglomeration imply that two industry factors (growth opportunities and industry
concentration) are negatively related to predicted degrees of conglomeration and find empirical
support in a panel of 50 industries across 20 years. Our study also documents that
conglomerate structures are more valuable when industry conditions predict high levels of
conglomeration. Although our evidence does not rule out the existence of agency-motivated
conglomeration, we conclude that value-maximization plays an important role. JEL Classifications: G34, L16 Keywords: Diversification, diversification discount, conglomeration, industry structure Correspondance: Vikram Nanda, Department of Finance, Ross School of Business, University of Michigan, Ann Arbor, MI 48109-1234, USA, Ph: (734) 763-0105, Fax (734) 936-0274, email: [email protected]. We thank Nicole Boyson and participants at the 2003 Western Finance Association meetings for helpful comments.

INDUSTRY STRUCTURE AND VALUE-MOTIVATED CONGLOMERATION
A firm�s decision to modify the scope of its activities � by engaging in diversifying
acquisitions, for instance � can significantly affect shareholder value. The effect of scope on
firm value has been actively studied and there is substantial literature on whether
conglomeration is value driven or is largely the product of agency motives (see Montgomery
(1994) and Stein (2001) for a survey of this literature). These studies typically focus on the
individual conglomerate firm and examine the firm�s organizational structure and investment
policies to understand if conglomeration creates or destroys value through its effect on resource
allocation. The impact of industry structure and investment opportunities on the extent to which
firms in an industry are organized under the conglomerate form, however, has received much
less attention in the academic literature.
The influence of industry factors becomes apparent when we consider the intertemporal
variation in conglomeration in various industries. It is well known that while conglomeration in
the U.S. increased during the sixties and seventies (Servaes (1996)), firms have become
increasingly focused on their core activities during the eighties and nineties. Comment and
Jarrell (1995) document, for instance, that about 56% of exchange-listed firms in 1988 were in
only one industry segment, compared to only 38% in 1979.
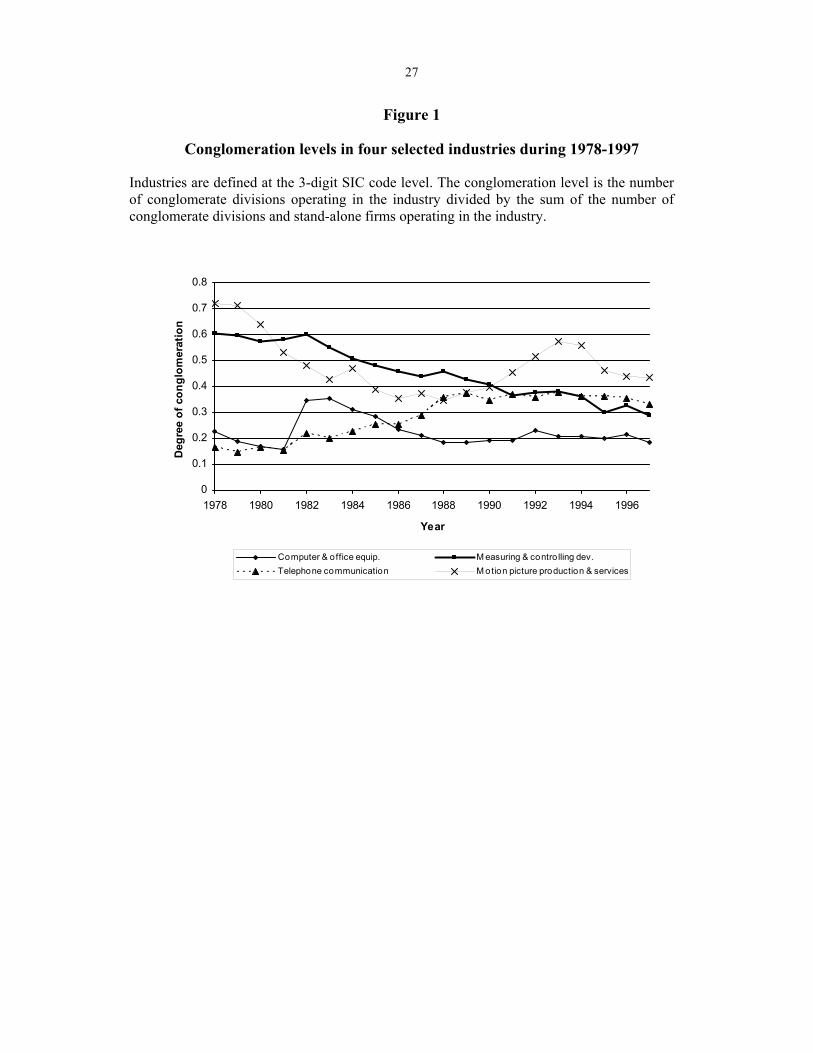
Consistent with this pattern, evidence in the paper indicates that, on average, industries
experienced a decrease in conglomeration. The interesting observation, however, is that despite
the average trend the picture at the industry level is more complex, with considerable variation
in the pattern of conglomeration across industries. This is apparent from Figure 1, which plots
the degree of conglomeration in four selected industries over the period 1978-1997. As
indicated, while the degree of conglomeration in the measuring and control devices industry
follows the general pattern and steadily declines over this period, the same cannot be said about
the other three industries in Figure 1. In the telephone communication industry for instance, the
degree of conglomeration generally increases over much of this period, while despite some
early fluctuations, there is little overall change in the computer and office equipment industry.
In contrast, the motion picture production and services industry exhibits wild swings but a net
decline in the degree of conglomeration.

2
While relatively little attention has been paid to the role of industry structure in the
academic literature on conglomeration, and to the degree of conglomeration in entire industries,
it is commonplace for the popular press to discuss diversifying or refocusing actions by firms in
terms of industry opportunities and technological and strategic considerations. For instance,
several mergers between telecommunication firms and cable TV companies or between
producers of entertainment products and cable and satellite companies have been analyzed in
terms of a convergence in technology across the industries (see Chalm-Olmstead (1998), for
example). This suggests that there may be circumstances that favor conglomeration in an
industry, i.e., conditions under which fewer of an industry�s units are likely to be organized as
stand-alone firms rather than as conglomerate divisions. The question that arises then is
whether conglomeration is a value-creating activity when such favorable industry conditions
exist. Our empirical approach allows us to address this question.
As a first step, we identify industry factors that favor conglomeration from a
shareholder value perspective. We do so by drawing upon existing theories that provide a
value-creating rationale for conglomeration, and then developing predictions regarding the
impact of industry level factors on the degree of conglomeration in an industry. We focus on
two primary factors that are predicted by such theories to influence the degree of
conglomeration in an industry: the growth opportunities available to firms in the industry, and
the competitive environment in the industry, specifically, the degree of concentration in the
industry (i.e., the extent to which a few players dominate the industry). As we discuss in more
detail later, value theories predict a lower degree of conglomeration in industries with higher
growth opportunities and in those that are more concentrated.
These implications are tested using panel data for fifty of the largest industries in the
U.S. over the twenty-year period 1978-1997. The median market-to-book value of stand-alone
firms in an industry serves as our proxy for the industry�s growth opportunities, while an asset-
based Herfindahl index (using assets of both conglomerate divisions and stand-alone firms) is
used to measure the extent to which an industry is concentrated. The extent of conglomeration
in an industry is measured by the number of conglomerate divisions in an industry as a
proportion of the total units (conglomerate divisions plus single-segment firms) in that industry.

3
The empirical results indicate that the two industry factors are significant predictors of the level
of conglomeration in the manner predicted by the value theories of conglomeration.
The next step is to investigate whether conglomeration increases value when, on the
basis of the industry factors considered, an increase in conglomeration is predicted. This allows
us to probe a long-standing question of whether conglomeration can enhance firm value in the
right environment, although it may deliver few benefits on average. To measure the relative
value of conglomerates operating in a particular industry, we introduce a metric called
�industry excess value� that is derived from the excess values of individual conglomerate firms
operating in the industry. (The excess value of an individual conglomerate is defined in the
usual way, as the market value of the conglomerate relative to the sum of its divisions� values
imputed from single-segment firms). We find that conglomeration levels predicted by the two
industry factors (growth opportunities and industry concentration) and industry excess values
are strongly and positively related. Thus, conditions predicted by value theories to be favorable
to conglomeration are also conditions under which a conglomerate structure is more valuable.
These findings help to explain changes in conglomeration levels across industries and
over time. The results imply that conglomeration increases in industries that face a reduction in
growth opportunities and the level of concentration. More importantly, they imply that when
increases in industry conglomeration accompany decreases in growth opportunities and the
level of concentration in the industry, they increase firm value on average. Collectively, these
results prescribe some of the conditions under which conglomeration can add value (or destroy
less value). While these results provide support for value theories of conglomeration, they do
not refute the notion that agency problems may be responsible for the formation of many
value-destroying conglomerates. What our results suggest, however, is that value maximization
appears to play a significant role in many conglomeration decisions as well.
The paper is organized as follows. Section 1 provides an overview of the various value-
maximization theories of conglomeration and develops predictions for what they imply for the
relation between conglomeration levels and industry factors. Section 2 explains the
construction of the data and provides definitions of the variables. Section 3 discusses the
results. Section 4 considers whether agency theories can explain the relation between the
industry structure and the degree of conglomeration. Section 5 concludes.

4
1. Value theories of conglomeration
1.1. Review of value theories
In this section we discuss the prevailing value theories of conglomeration. There are
three theories that fall under this rubric: market power theories, the resource hypothesis, and
internal capital markets theories. The first two theories assume that managers are unconditional
shareholder value maximizers and that there are no moral hazard problems between
shareholders and managers. These two theories depend on some form of market friction or
failure that is not based on agency problems. By contrast, internal capital market theories
generally regard the decision to diversify as a value-maximizing response to the conditions
arising out of an agency problem. The agency problem is not specific to conglomerates,
however, and the conglomeration decision is not divergent from shareholder interests.
Therefore, we classify internal capital market theories as value theories, not agency theories.
The key is that the conglomeration decision is made in order to maximize firm value and
mitigate the negative effects of an agency problem.
Market power theories argue that conglomerates exercise market power through several
channels. For instance, they might employ predatory pricing tactics in one market using the
profits from another market (i.e., the cross-subsidization or �deep pockets� argument).1 Or,
conglomerates that meet in multiple markets can tacitly collude by competing less vigorously
with each other to create spheres of influence in specific markets (Bernheim and Whinston
(1990)). The resource hypothesis argues that excess capacity in production factors leads to
diversification if the production factors cannot be sold off at value (Penrose (1959) and Teece
(1980, 1982)). For example, if a firm possesses indivisible physical resources beyond the
optimal need for one product line, it can employ them in other product lines. In some cases, the
excess capacity arises in human resources because managers or workers become more efficient
1 See Bolton and Scharfstein (1990) for a model on how predatory pricing can drive a rival out.

5
through learning. In some other cases, organizational knowledge that is accumulated in the
process of developing a product or process can be used effectively for other products. As Teece
(1982) points out, in all these cases there must exist a market failure that prevents the transfer
of these excess production resources to other parties. Models by Matsusaka (2001) and
Maksimovic and Phillips (2002) are in the spirit of the resource hypothesis. Matsusaka (2001)
argues that firms with broad organizational capabilities use diversification as part of a dynamic
value-maximizing strategy to seek matches for their capabilities. Maksimovic and Phillips
(2002) suggest that firms optimally shift finite organizational capabilities to a more productive
activity when diminishing returns to scale reduce the productivity in their primary activity.
Internal capital market theories argue that a conglomerate structure improves the
allocation of investment capital. The common feature is that conglomeration provides
management with an option to deploy capital to its best uses. This option is valuable because
the external capital market, due to some market imperfection, is unable or unwilling to
substitute for the internal market. Williamson (1975) argues that external capital markets can
sometimes fail and that the internal capital market created by a conglomerate structure can
increase allocational efficiency. In Stein (1997), for example, external markets impose a capital
constraint on all projects (whether stand-alone or grouped as a conglomerate) because
managers are reluctant to return excess cash to shareholders. Headquarters, having better
information about project profitability, can allocate the limited capital more efficiently among
the firm�s projects if the projects are grouped together in a conglomerate structure. 2 Fluck and
Lynch (1999) suggest that conglomerates allow marginally profitable projects to obtain funding
2 It is interesting to note that the internal capital markets theory can be viewed as a variant of the resource
hypothesis, wherein the resource in excess is capital and the market imperfection arises from the manager�s desire
to control capital. Some of the limited capital available to managers might become excessive if external events
make the investments in one segment unprofitable. Since the managers have no desire to return it to investors, they
seek other avenues of investment to maximize shareholder value.

6
and survive a period of distress.3 Khanna and Tice (2001) find that when a rival firm enters the
local market, divisions of conglomerates respond with superior investment decisions to those
that stand-alone firms make.
1.2. Empirical evidence on value theories
There is a large body of work that investigates whether or not conglomeration adds
value. The initial evidence seems to support the notion that conglomerate segments are valued
less than �equivalent� single-segment firms. Lang and Stulz (1994) and Berger and Ofek
(1995) find that U.S. conglomerates trade at a discount of about 15% relative to a portfolio of
median single-segment firms in the same industries. Lins and Servaes (1999) find no significant
discount for German firms, but discoutns of around 10% in Japan and 15% in the U.K. In
addition, there is some evidence (see Lamont (1997) and Shin and Stulz (1998)) that one of the
causes of the value differential might be the inefficiency of internal capital markets in
conglomerates that misallocate capital among their segments. Rajan, Servaes, and Zingales
(2000) and Scharfstein (1998) find evidence that is consistent with misallocation of capital
within conglomerates.4
3 Aron (1988) argues that diversification can enhance shareholder value by mitigating moral hazard as multiple
segments provide correlated signals of managerial effort. This theory also falls under the class of value theories
since conglomeration is a value-enhancing response to a moral hazard problem prevalent in all firms. 4 There are several papers that attempt to explain the diversification discount and/or the misallocation of capital.
Scharfstein and Stein (2000) argue that capital allocation might be the least costly way to bribe divisional
managers who are engaging in value decreasing activities. Rajan, Servaes, and Zingales (2000) provide a theory
based on divisional managers� incentive to prefer investments that increase the market value of their human capital
at the expense of shareholder value. Headquarters can only allocate resources, and it is unable to enforce optimal
rules for sharing any divisional surplus. It turns out in their model that if divisions have very diverse resources,
there will be suboptimal investment and headquarters tries to improve shareholder value by making resource
allocation less diverse. Goel, Nanda, and Narayanan (2003) suggest that managers with career concerns will
overallocate capital to the divisions that enhance their reputation the most.

7
More recent work has questioned the evidence on both the conglomerate discount as
well as capital misallocation. Villalonga (2001) argues that the conglomerate discount
disappears when conglomerate segments are evaluated against a more comparable benchmark
using propensity scores, instead of a portfolio of median single-segment firms in the same
industries. Maksimovic and Phillips (2002), using plant level data, argue that the evidence is
consistent with efficient capital allocation in conglomerate. Whited (2001) claims that the
observed capital misallocation is an artifact of measurement error arising from the use of
Tobin�s q to proxy for investment opportunities. Correcting for this error, she finds no evidence
of capital misallocation in conglomerates. Lamont and Polk (2002), however, argue that they
continue to find evidence consistent with inefficient investment even after considering the
effects of measurement error. Several researchers argue that the diversification discount might
reflect characteristics of firms that choose to conglomerate (see Fluck and Lynch (1999),
Matsusaka (2001)). The general flavor of these theories is that firms that are inferior in some
way choose to conglomerate, which explains their discount. Empirical support for this
endogeneity bias is provided by Diltz and Hyland (2002), Campa and Kedia (2002), Chevalier
(2000), and Graham, Lemmon and Wolf (2002). Burch and Nanda (2002), however, study spin-
off events and infer the excess value loss from a conglomerate structure (prior to spin-off) and
its relation to divisional characteristics. They conclude that the conglomerate structure itself
can detract from firm value under some circumstances. The question of selection bias remains
in some sense, however, since conglomerates that choose to engage in a spin-off are
presumably ones for which management believes the spin-off is likely to create value. In
summary, the issue of whether the diversification decision creates or destroys value is still
under debate.

8
1.3. Value theories and the relation between industry structure and degree of conglomeration
In order to investigate whether the cross-sectional and intertemporal variations in
conglomeration are the result of shareholder value-maximizing decisions, we first identify two
determinants of the degree of conglomeration suggested by the value theories: industry growth
opportunities and the degree of concentration. In this section we motivate the implications of
the value theories (market power, resource hypothesis, and internal capital markets) for the
relationship between each of these variables and the degree of conglomeration.
The market power theory suggests that firms in industries with greater growth
opportunities have sufficient value creation opportunities and, therefore, have little incentive to
operate under a conglomerate umbrella in order to use the deep pockets of another segment to
fund predatory pricing tactics. When growth opportunities abound in an industry, rents are
easier to obtain, and the need to engage in predatory pricing is diminished. Furthermore, when
there are clear growth opportunities, external capital is more easily available and hence the
need to conglomerate to generate internal capital is muted. Therefore, companies in industries
with greater growth opportunities are unlikely to acquire segments with deep pockets and, in
general, there is little need to conglomerate. The market power theory�s predicted relation
between conglomeration and industry concentration is also negative, with a similar rationale.
Firms that have already obtained market power have less of a need to obtain it through
predatory pricing. If there are firms without market power in concentrated industries, they are
also unlikely to engage in predatory pricing since the firms with market power, with more
resources and stronger market positions, are unlikely to be successfully driven out by such
tactics.
The resource hypothesis contends that companies expand into other segments in order
to employ underutilized resources that cannot be sold. Since it is less likely that there are
excess production resources in a high-growth industry, the resource hypothesis implies that the
motivation for conglomeration is diminished in high-growth industries. The implication of the

9
resource hypothesis regarding industry concentration is more subtle. One might argue that,
productive resources are likely to be more fully deployed in concentrated industries and,
therefore, there is less need for diversification to deploy these assets. By itself, however, the
resource hypothesis does not lead to a strong prediction regarding conglomeration and industry
concentration.
The internal capital market theories are based on the idea that conglomeration provides
management an option to direct capital to more productive sources. Such an option is not as
valuable when the industry has strong growth prospects. The capital markets are more likely to
provide capital to firms in clear growth industries, since managers have less cause to waste
funds. Hence there is less need for such firms to be subsidized by other divisions within a
conglomerate structure, and we would expect companies in growth industries to be less likely
to conglomerate. In a concentrated industry, the value of such an option will be lower as well,
as the need to exercise the option arises less frequently. The reason is that there is less need, on
average, to switch capital from segments operating in concentrated industries since the
profitability of those segments, on average, is likely to be high (see Shepherd (1990) for
evidence on the positive relation between concentration and profitability). Therefore, the
internal capital market theories also imply a negative relation between concentration and
conglomeration.
It is worth noting that our discussion about the implications of the value theories has
focused on the impact of various factors on the degree of conglomeration of a representative
industry. Consider, for instance, the argument that value theories imply a negative relationship
between growth opportunities and the degree of conglomeration in an industry. If some firms in
an industry with few growth opportunities choose to diversify, this increases the degree of
conglomeration not only in the industry under consideration, but also in the industries into
which these firms diversify. Since the degree of conglomeration in an industry is influenced by
not only conditions in that industry but also by conditions in other industries, one might wonder

10
if our preceding arguments, which are based on conditions prevailing in one industry, are
invalidated. We claim that this is unlikely to be the case. This is because when a firm from an
industry diversifies because of fewer growth opportunities, it is more likely to merge with
another firm from a different industry which is also interested in diversifying for any of the
reasons for conglomeration we have detailed. Hence, both industries are likely to have some of
the conditions that promote conglomeration according to the value theories.5
In summary, the various value theories suggest that in industries with more growth or
investment opportunities, there will be less conglomeration. To varying degrees, all of them
also suggest that in more concentrated industries there will be less conglomeration. These
predictions are stated in the following empirical hypothesis:
H1: Value theories imply that the conglomeration level in an industry will be negatively related
to both its growth opportunities and its degree of concentration.
1.4. Role of industry structure in value-creating conglomeration
Any empirical support for Hypothesis (H1) provides only partial confirmation of the
role of value theories in the conglomeration decision. This is because it is possible that agency
and other non-value explanations can have similar predictions regarding the relationship
between the industry factors we examine and conglomeration levels. (We discuss the extent to
which agency theories are likely to have the same predictions in a later section). To confirm
that value theories play a role in conglomeration we, therefore, need evidence that
conglomeration actually results in value improvements when the value theories predict such
5 If firms in industries with conditions favorable to conglomeration combine with those in industries with
conditions unfavorable to conglomeration, it would result in no significant relationship between the value of
conglomerate firms and factors that measure the desirability of the conglomerate structure. Hence, whether or not
firms that increase their conglomeration levels tend to combine with similar firms (in terms of the industry factors
we explore) is an empirical question on which our analysis will shed light.

11
benefits. If Hypothesis (H1) is supported, then we can interpret predicted conglomeration levels
(as predicted by growth opportunities and industry concentration) as proxying for the extent to
which industry conditions favor conglomeration. This leads us to our second hypothesis:
H2: The values of conglomerates relative to single-segment firms in an industry should be
positively related to the industry�s conglomeration level that is predicted by the growth
opportunities and concentration in the industry.
2. Data sources and construction of variables
2.1. Data sources and choice of industries
We use the Compustat Industrial Segment (CIS) database for divisional data and the
Compustat annual industrial database for single-segment firm data for the years 1978-1997.
Both active and research data are used to avoid survivorship bias. Our intent is to test the
hypothesis using the 50 largest U.S. industries, based on the number of market participants
(single-segment firms plus divisions of conglomerates in an industry) in 1988.6 Following the
usual practice in the literature, we eliminate financial services and regulated utility industries.
We also eliminate all industries that have more than one missing necessary data item over the
twenty-year period. We then select the top 50 industries in terms total number of market
participants. Excluding the financial services and regulated utilities industries, this results in a
sample consisting of 50 of the largest 79 industries (according to the total number of
conglomerate divisions and stand-alone firms operating in the industry). In four of these 50
industries there is one missing data point. We relax our variable construction requirements for
6 This year is chosen as a mid-way point during the time period we study. Results are robust to using alternative
years to determine the 50 industries. Using more than 50 industries results in missing data which is problematic
for the panel data approach we employ.

12
these four cases, and the adjustments we make are described in detail in the subsections that
follow.
In selecting the 50 industries, the number of market participants is determined as
follows. We first count the total number of divisions and single-segment firms operating in
each 3-digit SIC industry in 1988. To qualify as a single-segment firm in 1988, the firm must
not have multiple divisions (as reported in the CIS database) during this year, and must have
valid assets or valid sales. To qualify as a division in 1988, a candidate�s parent firm must have
multiple divisions reported in this year.7 Thus, all divisions of multi-divisional parent firms in
our CIS database are included for counting purposes.
2.2. Variable construction
2.2.1. Degree of conglomeration (Cong)
This variable measures the extent to which units in an industry are under the
conglomerate structure and is defined as the number of conglomerate divisions in an industry
divided by the sum of the number of conglomerate divisions and the number of single-segment
firms in the industry. Conglomerate divisions and single-segment firms are counted using the
same methodology outlined above for industry selection.
2.2.2. Industry median market-to-book (IndMB)
We measure growth opportunities by the median industry market-to-book ratio. The
market-to-book ratio of a firm is defined as the market value of the firm (market value of
common stock plus book value of long-term debt and current liabilities plus book value of
preferred stock) divided by the book value of its assets. This ratio is calculated for the universe
of single-segment firms in the Compustat annual database in the 50, three-digit SIC industries
7 All of the divisions in our divisional data (for conglomerate firms) have positive 1988 sales, so we are not
concerned that our sample includes invalid divisions.

13
and the median is calculated for each industry in each year. We require that an industry have at
least five valid ratios, except for one industry year (out of 1,000 total), where this restriction is
relaxed so a median can be calculated.
2.2.3. Industry Herfindahl index (IndHerf)
We measure industry concentration with an asset-based Herfindahl index. Because we
wish to account for all players in the industry, both conglomerate divisions and single-segment
firms in the industry are used. IndHerf is calculated as follows:
( )2
1
12
=
∑
∑
=
=
n
ii
n
i i
A
AIndHerf , (1)
where Ai is the book value of assets of the single-segment firm or the conglomerate division i
operating in the industry, and n is the total number of single-segment firms and conglomerate
divisions in the industry.
2.2.4. Industry excess values (Weighted-EV and OLS-EV)
We introduce a metric called �industry excess value� to measure the relative values of
conglomerates operating in an industry. To begin, we essentially follow Berger and Ofek
(1995) in constructing conglomerate excess values (CEVs), defined as follows:
[ ],
)/(ln
1
=
∑=
n
iii AVINDDA
CMVCEV (2)
where,
CMV = market value of common equity, plus book value of debt of the conglomerate,
plus book value of preferred stock,
DAi = asset size for Division i,

14
INDi(V/A) = median ratio of total capital (market value of common equity, plus book value
of debt, plus book value of preferred stock) to assets for single-segment firms
in the 3-digit SIC industry of Division i, and,
n = number of divisions in the conglomerate firm.
Unlike in Berger and Ofek, CMV includes preferred stock. Following Berger and Ofek,
industry medians are taken from the narrowest SIC grouping that includes at least five single-
segment firms with sufficient data for computing the ratio. We also use their methodology in
grossing-up divisional assets and the elimination of extreme excess values.8
Weighted-EV for an industry is calculated by taking a weighted average of CEVs for
firms with segments operating in the industry. To illustrate, suppose there are only two
conglomerate firms X and Y, with conglomerate excess values CEVX and CEVY, each with
divisions operating in �industry 1.� Suppose that conglomerate X has total assets of 200, with
150 allocated in industry 1, and that conglomerate Y has total assets of 1000, with 300 allocated
to industry 1. The excess value for industry 1, Weighted-EV1, is calculated as follows:
+
×+
×
=−
1000300
200150
1000300
200150
1
YX CEVCEVEVWeighted
In the above measure, the weight given to the excess value of a conglomerate in
calculating the excess value of an industry is directly related to what fraction of the
conglomerate�s assets are devoted to that industry. The notion behind this construction is that a
division that represents a larger fraction of a conglomerate has a greater impact on its excess
8 Berger and Ofek (1995) eliminate conglomerates where the sum of divisional assets deviates from parent firm
aggregate assets by more than 25%. They then gross-up divisional assets so their sum equals the parent�s
aggregate assets. They also avoid extreme excess values by eliminating conglomerates where sum of divisional
imputed values (the denominator in the CEV definition) is less than one-fourth or more than four times CMV.
(3)

15
value than a smaller division.9 We require that at least five divisions in an industry have valid
parent CEV measures in order to compute Weighted-EV. In three of the 1000 industry-years,
this condition is not met, and therefore, we ease the restriction on the number of divisions
required.
Using the same notion as above (that a division that represents a larger fraction of a
conglomerate has a greater impact on its excess value), we construct an alternative measure of
industry excess value which we denote OLS-EV. This measure uses an ordinary least squares
approach (one regression for each year), with the conglomerate excess value as the dependent
variable and the relative asset weights of the divisions operating in various industries as the
independent variables. The coefficients of each industry are then interpreted as the excess value
of that industry. A detailed explanation of the construction of the OLS-EV variable is provided
in the Appendix.
3. Results
3.1. Intertemporal and inter-industry patterns in variables
Tables 1 and 2 describe the data. In Table 1 we present the variables used for the
industries in 1980 and 1995. These years are chosen because they are near the endpoints of our
9 The measure we use takes into account the importance of the industry to a conglomerate and provides an
indicator of the excess value of a typical (i.e., randomly-chosen) conglomerate firm with a division operating in a
particular industry. Other measures of industry excess value, based on different weighting schemes, can also be
computed. For example, we can construct a measure of excess value for an industry by assigning a weight to the
excess value of each conglomerate equal to the asset size of each conglomerate�s division in that industry relative
to the total assets of all divisions (of all conglomerates) in that industry. In the construction of Weighted-EV1
above, the (150/200) weights would be replaced with (150/450) and the (300/1000) weights would be replaced
with (300/450). Such a measure provides a value-weighted indicator of industry excess value regardless of the
importance of the industry to a particular conglomerate. The results hold using this alternative measure of industry
excess value.

16
time period. We present Weighted-EV for the industry excess values, since OLS-EV has fairly
similar values and is used mainly as a robustness check on the results. As can be seen in
Table 1, there is considerable variation across both industries and time. For example, in 1980
conglomeration levels range from a low of 17% (in the computer and office equipment industry
and also the telephone communication industry) to a high of 87% (in the aircraft and parts
industry and also the construction and related machinery industry). There are steep declines in
the conglomeration levels of many industries, while others show a smaller decline or a slight
increase. For example, the conglomeration level of the drugs industry declines sharply from
68% to 18%, while that for the industrial organic chemicals industry experiences a slight
increase from 80% to 83%. There is also considerable variation across industries and time for
the other variables we report (IndMB, or industry market-to-book, IndHerf, or industry
Herfindahl, and Weighted-EV, or the weighted industry excess value metric).
3.2. Yearly summary statistics
Table 2 presents summary statistics for the variables in our study. The trend toward
focus during the 1980s and 1990s is quite apparent, as the mean (median) Cong steadily
declines from a high of 70% (73%) in 1978 to a low of 44% (44%) in 1997. It is interesting to
note that overall, industry concentration levels have not changed dramatically through time (as
seen by the means and medians for IndHerf). There are two items of note in regards to industry
excess values. First, there is considerable variation from year to year, but there is no noticeable
overall pattern through time. Second, comparing Weighted-EV to OLS-EV confirms that the two
measures have fairly similar values, at least at the yearly aggregate level as measured by the
means and medians across industries. Thus, in spite of their quite different empirical
constructions, the two measures seem consistent with each other. We note that the median
Weighted-EV and OLS-EV across all years are �0.13 and −0.12, respectively. Not surprisingly

17
given their construction, these are of the same order of magnitude as reported previous studies
(e.g., Berger and Ofek (1995)).
3.3. Test of Hypothesis (H1)
In Panel A of Table 3 we test Hypothesis (H1) and present regressions of
conglomeration (Cong) on industry growth opportunities as measured by industry market-to-
book values (IndMB), and industry concentration as measured by the industry Herfindahl index
(IndHerf). We use a panel data approach to appropriately account for industry and time series
effects. Specifically, a two-way fixed effects model is used (i.e., both industry and year
dummies are included, although not reported) and we use error terms that are corrected for both
autocorrelation and heteroskedasticity. As reported, IndMB and IndHerf are both negatively
and significantly related to Cong, as Hypothesis (H1) predicts (see Model A1 in Panel A of
Table 3). For robustness purposes we also use a Fama-MacBeth approach (Fama and MacBeth
(1973)) which involves averaging the coefficients of 20 yearly cross-sectional regressions.
With this approach, which is not reported in the table, IndMB and IndHerf are negative and
more strongly significant.10 We conclude that Hypothesis (H1) is supported by the data.11 It is
also worth nothing that these results are inconsistent with firms in industries with conditions
favorable to conglomeration combining with those in industries that do not favor
conglomeration. Such a scenario would result in insignificant coefficients for IndMB and
IndHerf.
10 We use Hansen-Hodrick-Newey-West autocorrelation and heteroskedasticity consistent t-values with 5 lags to
establish the significance of the coefficients. The Fama-MacBeth approach is an inferior one for our purposes,
since it does not control for the differences in industry-wide conglomeration levels (across all 20 years) due to
factors we do not examine. The panel data regression approach, by contrast, allows us to control industry effects
by explicitly including industry dummy variables via the fixed effects model. 11 We also test Hypothesis (H1) using the value-weighted industry excess value measure discussed in footnote 9.
The two variables IndMB and IndHerf are significant and have the predicted negative sign.

18
3.4. Test of Hypothesis (H2)
We now address Hypothesis (H2), i.e., the issue of whether conglomeration in an
industry creates value when growth opportunities and concentration in an industry are favorable
to conglomeration. The results are reported in Panel B of Table 3, where industry excess value,
as measured by Weighted-EV (Model B1) or OLS-EV (Model B2), is regressed on the predicted
conglomeration level, denoted ValueCong1. ValueCong1 is obtained by using the model
estimated in Panel A to construct a predicted value for each industry year. As can be seen,
Models B1 through B3 show that ValueCong1 is positively and significantly related to industry
excess value. In Model B1 the coefficient is positive and the t-statistic is 8.33 while in Model
B2 the coefficient is positive and the t-statistic is 8.73. In Model B3 we include ResidCong1,
which is the residual from Model A1 (i.e., ResidCong1 = Cong � ValueCong1). This variable
allows us to investigate whether there is any value effect due to the industry�s conglomeration
level being different from that predicted by the two industry factors. The variable is
insignificant (t = −0.53), and ValueCong1 is not materially affected. Results using OLS-EV as
the dependent variable (which are not reported in the table) are qualitatively similar.
We also repeat the analysis in Panel B using a Fama-MacBeth approach (using the 20
cross-sectional models from the Fama-MacBeth version of Panel A mentioned previously, and
then averaging the slope coefficients of 20 yearly cross-sectional regressions for models B1 and
B2). Although not reported in the table, results are qualitatively similar. For example, in Model
B1 the slope coefficient is positive with a t-value of 5.42. We conclude that Hypothesis (H2) is
strongly supported.
One potential concern regarding the robustness of our results has to do with the
common components of our industry excess values and IndMB. , leading to a potential
�hardwiring� of the results. We address this concern in two ways and conclude that the main
results of the paper are not due to hardwiring. Table 4 reports the robustness tests.

19
First, we remove IndMB altogether (relying on only IndHerf) as a predictor of the
degree of conglomeration. The results of this regression are reported as Model A2 in Table 4.
The predicted conglomeration based on Model A2 is denoted by ValueCong2 and is used in a
regression to predict Weighted-EV (see Model B4).12 The results remain highly significant. The
t-value for ValueCong2 is slightly lower than that for ValueCong1 in Table 3, but it still implies
very strong significance with a value of 3.46.
Second, we repeat the estimation of Model B1 of Table 3 (which uses ValueCong1 from
that table), but we include IndMB directly as a regressor as well. This completely removes the
concern that the significance of ValueCong is being caused by its proxying for IndMB. As
Model B5 of Table 4 shows, we find that IndMB is negatively and highly significant (t = -9.92).
This is not surprising, since industry excess values (constructed from conglomerate excess
values) and single-segment firm market-to-book ratios (whose medians form IndMB) should be
inversely related. The key result is that ValueCong1 continues to be positive and significant,
with a t-value of 3.21. We conclude that Hypothesis (H2) is strongly supported by the evidence.
4. Do agency models explain the results?
The basis for Hypothesis (H2) is the premise that changes in conglomeration, as
predicted by the industry growth opportunities and concentration, will tend to be value-
increasing. This premise is based on Hypothesis (H1), where we have argued that value
theories predict that these industry factors are negatively related to the degree of
conglomeration in an industry. However, what if agency theories also predicted a negative
relationship between industry factors and conglomeration? How would this affect our
interpretation of the results as supportive of value motivated conglomeration? We briefly
12 We report only the results with Weighted-EV as the dependent variable. Results with OLS-EV as the dependent
variable are similar.

20
discuss below why our results support the existence of value-motivated conglomeration
decisions, even if some conglomeration decisions are driven by agency considerations.
Agency theories rely on some sort of friction or contracting problem that allows
managers to engage in activities not entirely consistent with shareholder value maximization.
There are three prevailing agency theories that have possible links to conglomeration activity:
the free cash flow theory proposed by Jensen (1986), the managerial entrenchment hypothesis
suggested by Shleifer and Vishny (1982), and the managerial risk-aversion hypothesis of
Amihud and Lev (1981). The existing literature presents varying degrees of support for the
ability of these explanations to explain conglomeration activity.13 While these theories offer
prescriptions of managerial behavior at the firm level regarding conglomeration, they do not
provide clear implications about conglomeration at the industry level and how it relates to
industry factors. In particular, these theories do not posit any clear relationships between the
degree of conglomeration in an industry and growth opportunities and concentration in that
industry. Therefore, the agency theories above are less useful in understanding cross-sectional
and intertemporal variations in the degree of conglomeration at the industry level.
Furthermore, the empirical evidence in Table 3 indicates that industry excess values are
positively related to the conglomeration level predicted by the industry factors. This implies
that value motivation plays an important role in conglomeration decisions even if there are
agency theories with similar predicted relationships between industry factors and the degree of
conglomeration. Note that if only agency theories explained the relations we observe between
conglomeration levels and the industry factors we examine, then the relation between industry
excess values and predicted conglomeration levels should be negative, not positive (given the
value destruction that agency-motivated conglomeration implies). Thus, we argue that value
13 The empirical literature on testing the agency motive for conglomeration has focused on the relationship
between managerial ownership and diversification (see Aggarwal and Samwick (2003), Amihud and Lev (1981),
Denis, Denis, and Sarin (1997), and May (1995)). The results are mixed.

21
theories do indeed play a role in conglomeration decisions even if some agency theories are
consistent with the predictions in hypothesis (H1).
We wish to emphasize, however, that our results are not inconsistent with the presence
of the agency motive in the context of conglomeration decisions. As stated before, there is
considerable evidence that suggests that agency issues might be playing an important role in
conglomerate decisions of some companies. Our intent in this paper is to show, using industry
level data, that value considerations also play a role in conglomerate decisions and that value-
based theories can explain some of the cross-sectional and intertemporal variations in the
degree of conglomeration at the industry level.
5. Conclusion
The literature has been largely negative in its view of conglomeration. Most empirical
studies indicate that, on average, conglomerates trade at a substantial discount to single-
segment firms. This has been interpreted as consistent with agency theories explaining
conglomeration decisions. In theory, however, conglomeration can be beneficial and driven by
value-maximizing goals, and managers and the press often discuss conglomeration decisions in
the context of industry conditions. In this paper we find evidence that the degree of
conglomeration in an industry is negatively related to the industry factors of growth
opportunities and concentration, as predicted by value theories. Furthermore, we find that when
changes in these factors favor the placement of an increasing fraction of units in an industry
under a conglomerate structure, the excess value of conglomerates in that industry is higher.
These results suggest that value motives can at least partially explain the conglomeration
decision. While our results provide support for value-motivated conglomeration for many
firms, they do not rule out agency considerations as a motive for conglomeration for others.
22
References
Aggarwal, R., Samwick, A., 2003. Why Do Managers Diversify their Firms? Agency
Reconsidered. Journal of Finance 58, 71-118.
Amihud, Y., Lev, B., 1981. Risk Reduction as a Managerial Motive for Conglomerate Mergers.
Bell Journal of Economics 12, 605-617.
Aron, D., 1988. Ability, Moral Hazard, Firm Size, and Diversification. Rand Journal of
Economics 19 (Spring), 72-87.
Berger, P., Ofek, E., 1995. Diversification�s Effect on Firm Value. Journal of Financial
Economics 37, 39-65.
Bernheim D., Whinston, M., 1990. Multi-Market Contact and Collusive Behavior. Rand
Journal of Economics 21, 1-26.
Bolton, P., Scharfstein, D., 1990. A Theory of Predation Based on Agency Problems in
Financial Contracting. American Economic Review 80, 94-106.
Burch, T., Nanda, V., 2002. Divisional Diversity and the Conglomerate Discount: The
Evidence from Spinoffs. Journal of Financial Economics 70, 69-98.
Campa, J., Kedia, S., 2002. Explaining the Diversification Discount. Journal of Finance 57,
1731-1762.
Chalm-Olmstead, S., 1998. Mergers, Acquisitions, and Convergence: The Strategic Alliances
of Broadcasting, Cable Television, and Telephone Services. Journal of Media
Economics 11, 33-46.
Chevalier, J., 2000. Why Do Firms Undertake Diversifying Mergers? An Analysis of the
Investment Policies of Merging Firms. Unpublished working paper. University of
Chicago.
Comment, R., Jarrell, G., 1995. Corporate Focus and Stock returns. Journal of Financial
Economics 37, 67-87.
Denis, D., Denis, D., Sarin, A.,1997. Agency Problems, Equity Ownership, and Corporate
Diversification. Journal of Finance 52, 135-160.
Fama, E., MacBeth, J., 1973. Risk, Return, and Equilibrium: Empirical Tests. Journal of
Political Economy 71, 607-636.

23
Fluck, Z., Lynch, A., 1999. Why Do Firms Merge and then Divest? A Theory of Financial
Synergy. Journal of Business 72, 319-46.
Graham, J., Lemmon, M., Wolf, J., 2002. Does Corporate Diversification Destroy Value?
Journal of Finance 57, 695-720.
Goel, A., Nanda, V., Narayanan, M.P., 2004. Career Concerns and Resource Allocations in
Conglomerates. The Review of Financial Studies 17, 99-128.
Diltz, D., Hyland, D., 2002. Why Firms Diversify: An Empirical Examination. Financial
Management 31, 51-81.
Jensen, M., 1986. Agency Costs of Free Cash Flow, Corporate Finance and Takeovers.
American Economic Review 76, 323-329.
Khanna, N., Tice, S., 2001. The Bright Side of Internal Capital Markets. Journal of Finance 56,
1489-1528.
Lamont, O., 1997. Cash Flow and Investment: Internal Capital Markets Evidence. Journal of
Finance 52, 83-109.
Lamont, O., Polk, C., 2002. Does Diversification Destroy Value? Evidence from Industry
Shocks. Journal of Financial Economics 63, 51-77.
Lang, L., Stulz, R., 1994. Tobin's Q, Corporate Diversification and Firm Performance. Journal
of Political Economy 102, 1248-1280.
Lins, K., Servaes, H., 1999. International Evidence on the Value of Corporate Diversification.
Journal of Finance 54, 2215-2239.
Maksimovic, V., Phillips, G., 2002. Do Conglomerate Firms Allocate Resources Inefficiently
Across Industries? Theory and Evidence. Journal of Finance 57, 721-767.
Matsusaka, J., 2001. Corporate Diversification, Value Maximization, and Organizational
Capabilities. Journal of Business 74, 409-431.
May, D., 1995. Do Managerial Motives Influence Firm Risk-Reduction Strategies. Journal of
Finance 50, 1291-1308.
Montgomery, C., 1994. Corporate Diversification. Journal of Economic Perspectives 8, 163-
178.
Penrose, E., 1959. The Theory of the Growth of the Firm, Oxford, Basil Blackwell.
Rajan, R., Servaes, H., Zingales, L., 2000. The Cost of Diversity: The Diversification Discount
and Inefficient Investment. Journal of Finance, 55:1, 35-80.

24
Scharfstein, D., 1998. The Dark Side of Internal Capital Markets II: Evidence from Diversified
Conglomerates. NBER working paper #6352.
Scharfstein, D., Stein, J., 2000. The Dark Side of Internal Capital Markets: Divisional Rent-
Seeking and Inefficient Investment. Journal of Finance 55, 2537-2564.
Servaes, H., 1996. The Value of Diversification During the Conglomerate Merger Wave.
Journal of Finance 51, 1201-1225.
Shepherd, W., 1990. The Economics of Industrial Organization, Third edition. Prentice Hall,
Englewood, New Jersey.
Shin, H., Stulz, R., 1998. Are Internal Capital Markets Efficient? Quarterly Journal of
Economics 113, 531-552.
Shleifer, A., Vishny, R., 1989. Managerial Entrenchment: The Case of Manger-Specific
Investments. Journal of Financial Economics, 17, 293-309.
Stein, J., 1997. Internal Capital Markets and the Competition for Corporate Resources. Journal
of Finance 52, 111-133.
Stein, J., 2003. Agency, Investment and Corporate Investment. In Constantinides, M., Harris,
M., Stulz, R. (Eds.), Handbook of the Economics of Finance, Vol. 1A Corporate
Finance. Elsevier Science, pp. 111-165.
Teece, D., 1980. Economics of Scope and the Scope of the Enterprise. Journal of Economic
Behavior and Organization 1, 223-247.
Teece. D., 1982. Towards an Economic Theory of the Multiproduct Firm. Journal of Economic
Behavior and Organization 3, 39-63.
Villalonga, B., 2001. Does Diversification Cause the �Diversification Discount�?, Unpublished
working paper, Harvard University.
Whited, T., 2001. Is It Inefficient Investment that Causes the Diversification Discount? Journal
of Finance 58, 1667-1691.
Williamson, O., 1975. Markets and Hierarchies: Analysis and Antitrust Implications. The Free
Press, New York, New York.

25
Appendix
Construction of the industry excess value measure OLS-EV
This measure uses an ordinary least squares (OLS) regression approach, where a
separate regression is performed for each year. To estimate the fifty industry values of OLS-EV
for a particular year, only conglomerates with valid divisional assets in one of the 50 industries
in that year are retained. Fifty industry variables (Ind1-Ind50) are then coded for each division
year, where each division�s asset weight within the conglomerate is assigned to the
corresponding industry variable, and the remaining industry variables are set to zero. The table
below provides an illustration using the example listed in the text for Weighted-EV, assuming
all of each firm�s assets not allocated to industry 1 are instead allocated to industry 2 (i.e. X
allocates 50 to industry 2, while Y allocates 700).
Regressors
Observ
ation
Conglo
merate
Dependent
variable Ind1 Ind2 Ind3...Ind50
1 X CEVX (150/200) (50/200) 0 � 0
2 Y CEVY (300/1000) (700/1000) 0 � 0
When a conglomerate contains a division operating outside of the 50 industries we
consider, the weights for the divisions that are among the 50 are rescaled so the sum of the
Ind1 through Ind50 for a given firm will always equal 1. Results are robust, however, if we do
not rescale the industry weights. OLS regressions are estimated for each year with no intercept
term, and the resulting 50 coefficients are used as each year�s 50 industry excess values. The
total number of observations in a given year�s regression equals the total number of
conglomerates with at least one division in the 50 industries. Observation sizes for the 20

26
regressions (one for each year) range from 616 to 1,112, and adjusted R-squared values range
from 0.033 to 0.207 (all but two regressions have adjusted R-squared values exceeding 0.06).
27
Figure 1
Conglomeration levels in four selected industries during 1978-1997
Industries are defined at the 3-digit SIC code level. The conglomeration level is the number of conglomerate divisions operating in the industry divided by the sum of the number of conglomerate divisions and stand-alone firms operating in the industry.
0
0.1
0.2
0.3
0.4
0.5
0.6
0.7
0.8
1978 1980 1982 1984 1986 1988 1990 1992 1994 1996
Year
Deg
ree
of c
ongl
omer
atio
n
Computer & office equip. M easuring & contro lling dev.Telephone communication M otion picture production & services

28
Table 1
Industry characteristics in 1980 and 1985 This table reports variable identities for 50 three-digit SIC industries in 1980 and 1995. Cong is the conglomeration level, defined as the number of divisions in the industry divided by the total number of divisions and stand-alone firms in the industry. IndMB is the median market-to-book ratio for stand-alone firms in the industry. IndHerf is an asset-based Herfindahl index for conglomerate divisions and stand-alone firms in the industry. Wtd-EV is the industry�s excess value using an asset-weighted average method that weights conglomerate excess values by the division�s asset weight within the parent firm.
1980 1995 Industry name Cong IndMB IndHerf Wtd-EV Cong IndMB IndHerf Wtd-EV
Aircraft and parts 0.87 1.41 0.06 -0.18 0.70 0.71 0.07 0.17 Beverages 0.69 0.64 0.06 0.05 0.45 1.50 0.07 0.12 Blast furnace and basic steel products 0.82 0.67 0.05 -0.26 0.51 0.82 0.06 0.02 Commercial printing 0.72 0.64 0.14 0.02 0.38 1.26 0.15 -0.11 Communications equipment 0.69 1.40 0.08 -0.10 0.30 2.16 0.09 -0.39 Computer and data processing services 0.47 1.71 0.15 -0.28 0.16 2.70 0.14 -0.31 Computer and office equipment 0.17 1.54 0.13 -0.46 0.20 2.16 0.08 -0.57 Construction and related machinery 0.87 0.78 0.05 0.01 0.78 1.17 0.07 -0.29 Crude petroleum and natural gas 0.58 4.16 0.03 -0.30 0.50 1.24 0.04 -0.05 Drugs 0.68 2.65 0.04 -0.52 0.18 3.46 0.04 -0.41 Eating and drinking places 0.59 0.93 0.06 -0.09 0.24 1.28 0.09 -0.33 Electric lighting and wiring equipment 0.80 0.75 0.12 -0.01 0.61 1.14 0.13 -0.26 Electrical goods 0.66 0.62 0.09 0.19 0.49 1.20 0.08 -0.16 Electrical industrial apparatus 0.76 1.29 0.24 -0.24 0.66 1.48 0.13 -0.25 Electronic components and accessories 0.62 1.47 0.04 -0.10 0.31 1.91 0.05 -0.32 Fabricated structural metal products 0.82 0.79 0.07 -0.06 0.59 1.21 0.04 -0.23 General industrial machinery 0.78 0.96 0.04 -0.03 0.60 1.25 0.04 -0.12 Gold and silver ores 0.46 4.24 0.06 -0.87 0.21 1.76 0.04 0.09 Groceries and related products 0.70 0.60 0.06 0.07 0.38 1.00 0.23 0.20 Grocery stores 0.53 0.63 0.06 -0.09 0.19 0.87 0.04 -0.04 Hotels and motels 0.67 0.90 0.11 -0.01 0.44 1.08 0.06 0.10 Industrial organic chemicals 0.80 1.81 0.07 -0.64 0.83 1.39 0.04 -0.06 Machinery, equipment, and supplies 0.85 1.14 0.03 -0.21 0.54 0.93 0.07 0.05 Measuring and controlling devices 0.57 1.38 0.04 -0.24 0.30 1.73 0.05 -0.39 Medical instruments and supplies 0.48 2.11 0.06 -0.31 0.24 2.55 0.05 -0.07 Metalworking machinery 0.79 0.98 0.05 -0.16 0.67 1.07 0.13 -0.26 Misc. amusement, recreation services 0.54 1.37 0.05 -0.22 0.35 1.21 0.04 0.11 Misc. electrical equipment & supplies 0.63 1.92 0.10 -0.55 0.48 1.36 0.10 -0.01 Misc. fabricated metal products 0.79 1.00 0.05 -0.18 0.71 0.97 0.07 -0.10 Misc. chemical products 0.79 2.03 0.16 -0.41 0.59 1.51 0.08 0.05 Misc. durable goods 0.63 0.68 0.15 -0.34 0.55 1.31 0.09 -0.03 Misc. manufactures 0.73 0.80 0.10 -0.03 0.48 0.95 0.24 -0.31 Motion picture production & services 0.64 0.98 0.12 -0.09 0.46 1.27 0.13 0.19 Motor vehicles and equipment 0.70 0.70 0.12 -0.22 0.54 1.11 0.09 -0.12 Nonferrous rolling and drawing 0.77 1.15 0.20 -0.44 0.57 1.09 0.18 -0.05
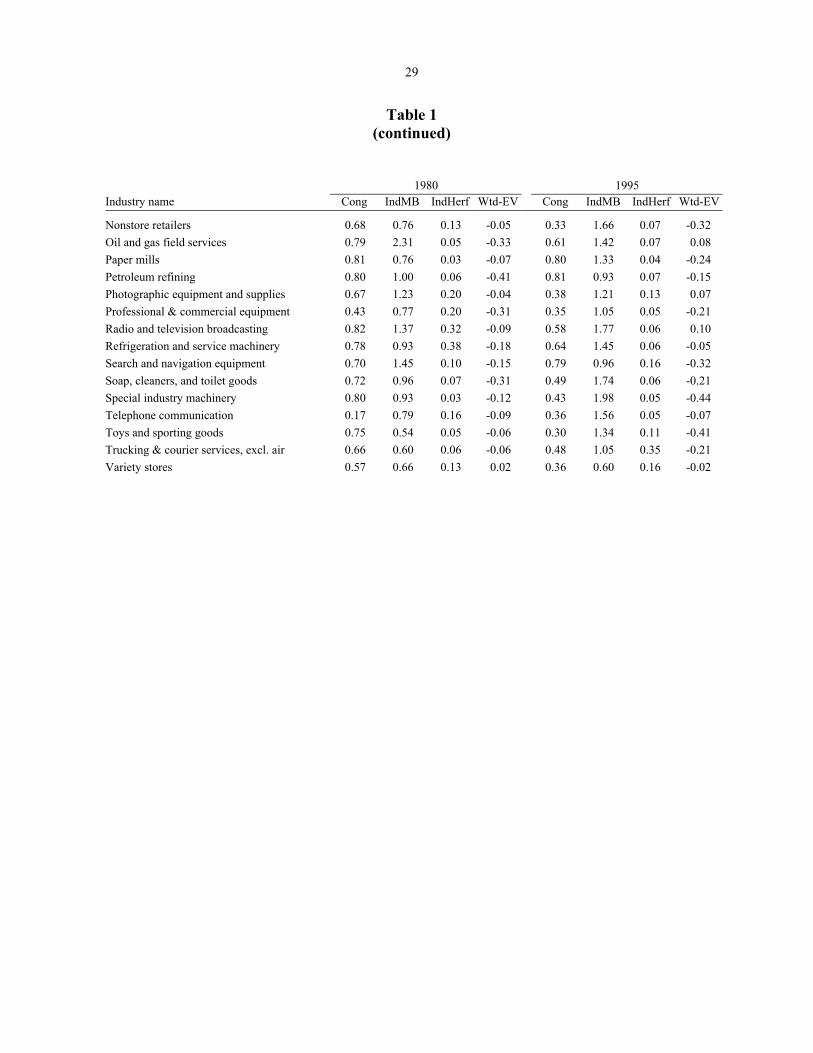
29
Table 1 (continued)
1980 1995
Industry name Cong IndMB IndHerf Wtd-EV Cong IndMB IndHerf Wtd-EV
Nonstore retailers 0.68 0.76 0.13 -0.05 0.33 1.66 0.07 -0.32 Oil and gas field services 0.79 2.31 0.05 -0.33 0.61 1.42 0.07 0.08 Paper mills 0.81 0.76 0.03 -0.07 0.80 1.33 0.04 -0.24 Petroleum refining 0.80 1.00 0.06 -0.41 0.81 0.93 0.07 -0.15 Photographic equipment and supplies 0.67 1.23 0.20 -0.04 0.38 1.21 0.13 0.07 Professional & commercial equipment 0.43 0.77 0.20 -0.31 0.35 1.05 0.05 -0.21 Radio and television broadcasting 0.82 1.37 0.32 -0.09 0.58 1.77 0.06 0.10 Refrigeration and service machinery 0.78 0.93 0.38 -0.18 0.64 1.45 0.06 -0.05 Search and navigation equipment 0.70 1.45 0.10 -0.15 0.79 0.96 0.16 -0.32 Soap, cleaners, and toilet goods 0.72 0.96 0.07 -0.31 0.49 1.74 0.06 -0.21 Special industry machinery 0.80 0.93 0.03 -0.12 0.43 1.98 0.05 -0.44 Telephone communication 0.17 0.79 0.16 -0.09 0.36 1.56 0.05 -0.07 Toys and sporting goods 0.75 0.54 0.05 -0.06 0.30 1.34 0.11 -0.41 Trucking & courier services, excl. air 0.66 0.60 0.06 -0.06 0.48 1.05 0.35 -0.21 Variety stores 0.57 0.66 0.13 0.02 0.36 0.60 0.16 -0.02

30
Tab
le 2
Su
mm
ary
stat
istic
s for
key
var
iabl
es
Stat
istic
s ar
e sh
own
for 5
0 th
ree-
digi
t SIC
indu
strie
s in
eac
h ye
ar a
nd o
vera
ll ac
ross
all
year
s. Co
ng (c
ongl
omer
atio
n le
vel)
is th
e nu
mbe
r of d
ivis
ions
in a
n in
dust
ry d
ivid
ed b
y th
e to
tal n
umbe
r of
div
isio
ns a
nd s
ingl
e-se
gmen
t firm
s in
the
indu
stry
. In
dMB
is th
e m
edia
n m
arke
t-to-
book
rat
io f
or s
ingl
e-se
gmen
t fir
ms
in th
e di
visi
on�s
indu
stry
. Ind
Her
f is
an a
sset
-bas
ed H
erfin
dahl
inde
x fo
r con
glom
erat
e di
visi
ons
and
stan
d-al
one
firm
s in
the
indu
stry
. Wei
ghte
d-EV
is
the
indu
stry
�s e
xces
s va
lue
usin
g an
ass
et-w
eigh
ted
wei
ghte
d av
erag
e m
etho
d th
at w
eigh
ts c
ongl
omer
ate
exce
ss v
alue
s by
the
divi
sion
�s a
sset
wei
ght w
ithin
th
e pa
rent
firm
. OLS
-EV
use
s an
ord
inar
y le
ast s
quar
es re
gres
sion
appr
oach
(one
regr
essi
on fo
r eac
h ye
ar) t
o co
nstru
ct in
dust
ry e
xces
s va
lues
. For
a g
iven
ye
ar, a
ll co
nglo
mer
ates
ope
ratin
g in
at l
east
one
of t
he 5
0 in
dust
ries
are
reta
ined
. For
eac
h co
nglo
mer
ate
year
, the
dep
ende
nt v
aria
ble
is th
e co
nglo
mer
ate�
s ex
cess
val
ue. F
ifty
indu
stry
-spe
cific
reg
ress
or v
aria
bles
are
then
cod
ed (
if th
e co
nglo
mer
ate
has
a di
visi
on in
a r
elev
ant i
ndus
try, t
he a
sset
-wei
ght o
f th
e di
visi
on is
ass
igne
d, a
nd 0
is a
ssig
ned
for a
ll re
mai
ning
indu
stry
regr
esso
rs fo
r whi
ch th
e co
nglo
mer
ate
has n
o di
visi
on, a
nd th
en w
eigh
ts a
re re
scal
ed so
they
su
m to
1).
The
OLS
coe
ffic
ient
s are
then
use
d as
the
indu
stry
exc
ess v
alue
s.
Con
g
IndM
B
In
dHer
f
Wei
ghte
d-EV
OLS
-EV
(Con
glom
erat
ion
leve
l)
(Ind
ustry
Mar
ket-t
o-B
ook)
(I
ndus
try H
erfin
dahl
inde
x)
(Wei
ghte
d-Ex
cess
val
ue)
(O
LS-E
xces
s val
ue)
Y
ear
M
ean
Med
St
d D
ev
Mea
n M
ed
Std
Dev
M
ean
Med
St
d D
ev
M
ean
Med
St
d D
evM
ean
Med
St
d D
ev
78
0.70
0.
73
0.15
0.
94
0.87
0.
35
0.10
0.
07
0.08
-0
.11
-0.0
9 0.
16
-0.1
0 -0
.08
0.20
79
0.
69
0.73
0.
16
1.06
0.
88
0.66
0.
10
0.07
0.
08
-0.1
5 -0
.13
0.16
-0
.14
-0.0
9 0.
27
80
0.68
0.
70
0.15
1.
24
0.97
0.
78
0.10
0.
07
0.07
-0
.19
-0.1
6 0.
20
-0.1
8 -0
.14
0.30
81
0.
66
0.68
0.
16
1.09
0.
98
0.45
0.
10
0.07
0.
07
-0.1
9 -0
.16
0.19
-0
.18
-0.1
4 0.
20
82
0.64
0.
65
0.15
1.
15
0.98
0.
57
0.11
0.
07
0.09
-0
.16
-0.1
5 0.
19
-0.1
4 -0
.11
0.22
83
0.
62
0.64
0.
16
1.35
1.
16
0.52
0.
11
0.07
0.
08
-0.2
1 -0
.20
0.17
-0
.20
-0.1
9 0.
18
84
0.61
0.
63
0.17
1.
16
1.04
0.
39
0.11
0.
07
0.08
-0
.18
-0.1
6 0.
16
-0.1
7 -0
.15
0.18
85
0.
57
0.58
0.
17
1.24
1.
18
0.40
0.
11
0.08
0.
08
-0.1
7 -0
.18
0.15
-0
.16
-0.1
7 0.
15
86
0.55
0.
56
0.18
1.
25
1.14
0.
44
0.11
0.
08
0.08
-0
.18
-0.1
6 0.
15
-0.1
7 -0
.15
0.18
87
0.
54
0.53
0.
18
1.12
1.
05
0.32
0.
11
0.08
0.
08
-0.1
1 -0
.10
0.18
-0
.10
-0.0
7 0.
18
88
0.53
0.
54
0.17
1.
10
1.04
0.
29
0.11
0.
08
0.07
-0
.08
-0.0
8 0.
11
-0.0
7 -0
.07
0.14
89
0.
52
0.52
0.
17
1.13
1.
05
0.32
0.
11
0.08
0.
08
-0.1
0 -0
.08
0.13
-0
.09
-0.0
8 0.
17
90
0.51
0.
51
0.17
0.
98
0.90
0.
31
0.11
0.
09
0.07
-0
.11
-0.1
0 0.
13
-0.0
8 -0
.08
0.16
91
0.
52
0.50
0.
18
1.13
1.
04
0.47
0.
10
0.08
0.
07
-0.1
0 -0
.07
0.16
-0
.09
-0.0
8 0.
20
92
0.52
0.
52
0.18
1.
26
1.12
0.
44
0.10
0.
08
0.06
-0
.16
-0.1
7 0.
19
-0.1
3 -0
.13
0.19
93
0.
51
0.50
0.
18
1.46
1.
46
0.47
0.
10
0.08
0.
06
-0.1
6 -0
.16
0.16
-0
.14
-0.1
5 0.
17
94
0.50
0.
50
0.18
1.
31
1.28
0.
35
0.10
0.
07
0.07
-0
.12
-0.1
4 0.
14
-0.1
2 -0
.11
0.14
95
0.
48
0.48
0.
18
1.40
1.
27
0.53
0.
09
0.07
0.
06
-0.1
3 -0
.11
0.19
-0
.13
-0.1
0 0.
21
96
0.47
0.
46
0.18
1.
39
1.26
0.
46
0.09
0.
07
0.06
-0
.11
-0.1
3 0.
17
-0.1
0 -0
.10
0.17
97
0.
44
0.44
0.
18
1.45
1.
36
0.43
0.
09
0.07
0.
07
-0.0
9 -0
.10
0.19
-0
.07
-0.0
7 0.
18
A
ll ye
ars
0.
56
0.58
0.
18
1.
21
1.10
0.
48
0.
10
0.08
0.
07
-0
.14
-0.1
3 0.
17
-0.1
3 -0
.12
0.19
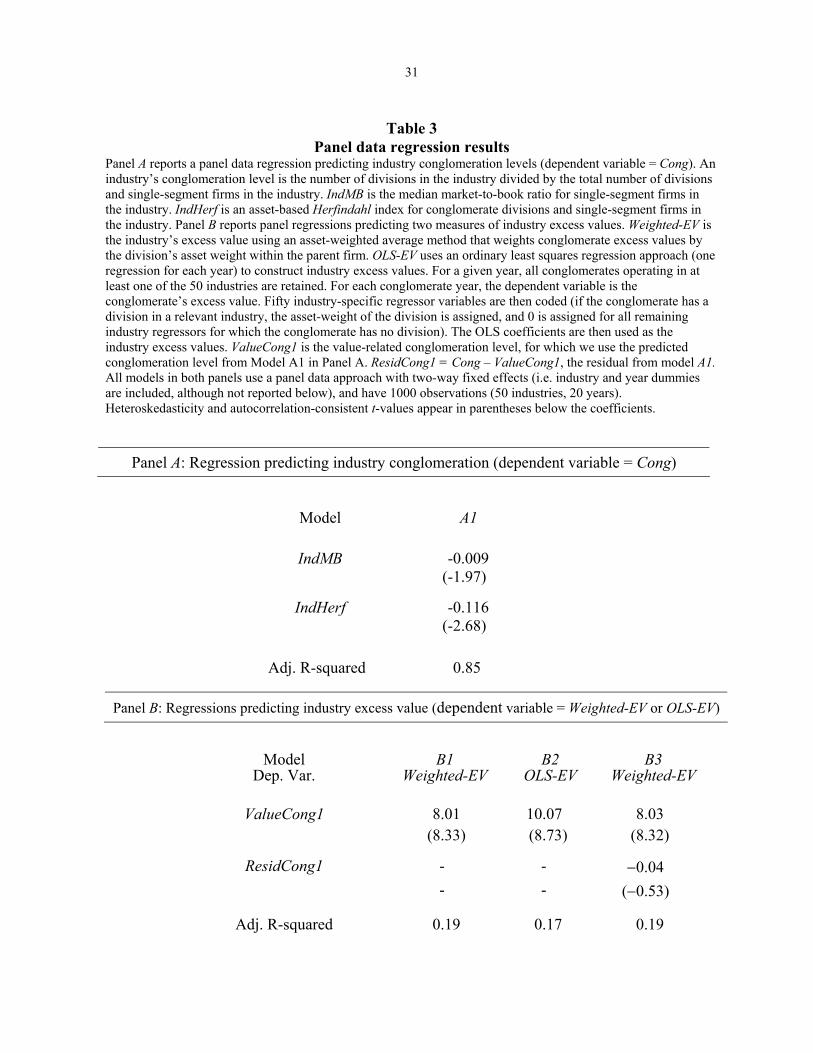
31
Table 3 Panel data regression results
Panel A reports a panel data regression predicting industry conglomeration levels (dependent variable = Cong). An industry�s conglomeration level is the number of divisions in the industry divided by the total number of divisions and single-segment firms in the industry. IndMB is the median market-to-book ratio for single-segment firms in the industry. IndHerf is an asset-based Herfindahl index for conglomerate divisions and single-segment firms in the industry. Panel B reports panel regressions predicting two measures of industry excess values. Weighted-EV is the industry�s excess value using an asset-weighted average method that weights conglomerate excess values by the division�s asset weight within the parent firm. OLS-EV uses an ordinary least squares regression approach (one regression for each year) to construct industry excess values. For a given year, all conglomerates operating in at least one of the 50 industries are retained. For each conglomerate year, the dependent variable is the conglomerate�s excess value. Fifty industry-specific regressor variables are then coded (if the conglomerate has a division in a relevant industry, the asset-weight of the division is assigned, and 0 is assigned for all remaining industry regressors for which the conglomerate has no division). The OLS coefficients are then used as the industry excess values. ValueCong1 is the value-related conglomeration level, for which we use the predicted conglomeration level from Model A1 in Panel A. ResidCong1 = Cong � ValueCong1, the residual from model A1. All models in both panels use a panel data approach with two-way fixed effects (i.e. industry and year dummies are included, although not reported below), and have 1000 observations (50 industries, 20 years). Heteroskedasticity and autocorrelation-consistent t-values appear in parentheses below the coefficients.
Panel A: Regression predicting industry conglomeration (dependent variable = Cong)
Model
A1
IndMB -0.009 (-1.97)
IndHerf -0.116 (-2.68) Adj. R-squared 0.85
Panel B: Regressions predicting industry excess value (dependent variable = Weighted-EV or OLS-EV)
Model B1 B2 B3 Dep. Var. Weighted-EV OLS-EV Weighted-EV
ValueCong1 8.01 10.07 8.03 (8.33) (8.73) (8.32)
ResidCong1 - - −0.04 - - (−0.53)
Adj. R-squared 0.19 0.17 0.19

32
Table 4 Robustness of regression results
Panel A reports panel data regressions predicting industry conglomeration levels (dependent variable = Cong). An industry�s conglomeration level is the number of divisions in the industry divided by the total number of divisions and single-segment firms in the industry. IndMB is the median market-to-book ratio for single-segment firms in the industry. IndHerf is an asset-based Herfindahl index for conglomerate divisions and single-segment firms in the industry. Lag(IndMB) and Lag(IndHerf) are IndMB is and IndHerf lagged by one year. Panel B reports panel data regressions predicting Weighted-EV, which is the industry�s excess value using an asset-weighted average method that weights conglomerate excess values by the division�s asset weight within the parent firm. ValueCong2 is the predicted conglomeration level from Model A2 in Panel A in this table. ValueCong1 is the predicted conglomeration level from Model A1 in Table 3. All models in both panels use a panel data approach with two-way fixed effects (i.e. industry and year dummies are included, although not reported below), and have 1000 observations (50 industries, 20 years). Heteroskedasticity and autocorrelation-consistent t-values appear in parentheses below the coefficients.
Panel A: Regressions predicting industry conglomeration (dependent variable = Cong) Model A2 IndHerf −0.113 (−2.61) Adj. R-squared 0.85
Panel B: Regressions predicting industry excess value (dependent variable = Weighted-EV) Model B4 B5
ValueCong2 5.62 - (3.46) -
ValueCong1 - 2.87 - (3.21)
IndMB - −0.21 - (−9.92)
Adj. R-squared 0.21 0.35