industry overview - · pdf fileindustry overview: market evolution ... research & advisory...
TRANSCRIPT

Citi Investment Mgt. CAB | Armonk NY | March 11, 2010
Industry Overview:
Market Evolution – Where are We and What Will Happen Next?
Presented by
Larry Tabb
Founder & CEO
TABB Group

Agenda
Who is TABB Group?
The macro picture
The market
Professional management
Commissions & services
Regulation
House rules
SEC market structure review
Disjoint regulatory initiatives
Market Structure
Electronic trading
High frequency trading
Impact on market structure
Conclusions

Who is TABB Group?
Research & advisory firm focused on Financial Markets value chain Fiduciary, manager, broker, exchange, custodian, depository & their ecosystem
Over 100 pieces of financial markets research a year
25 employees located in New York, Boston, London & Chicago
Built on The Value of First Person Knowledge
We interview nearly 1,000 industry professionals a year
Major studies include US, European & Asian Institutional Equity Trading
Hedge Funds Analysis
Options & OTC Derivatives Analysis
US and European Market Structure
High Frequency Trading
OMS & EMS Platform Trends
Latest initiative TabbFORUM Where Capital Markets Speak
Free Industry Blog

Markets around the globe were challenged over the past 1 3/4 years – but coming back
Korea
FTSEHK
DAX
India0%
CAC
CA
S&P China
Japan

Over past 11mths we are in huge bull market – global mkts up a min of 45+%
0%
Korea
CACFTSE
HK
DAX
India
Japan
China
S&P
CA

However, all is not great in professional money management land
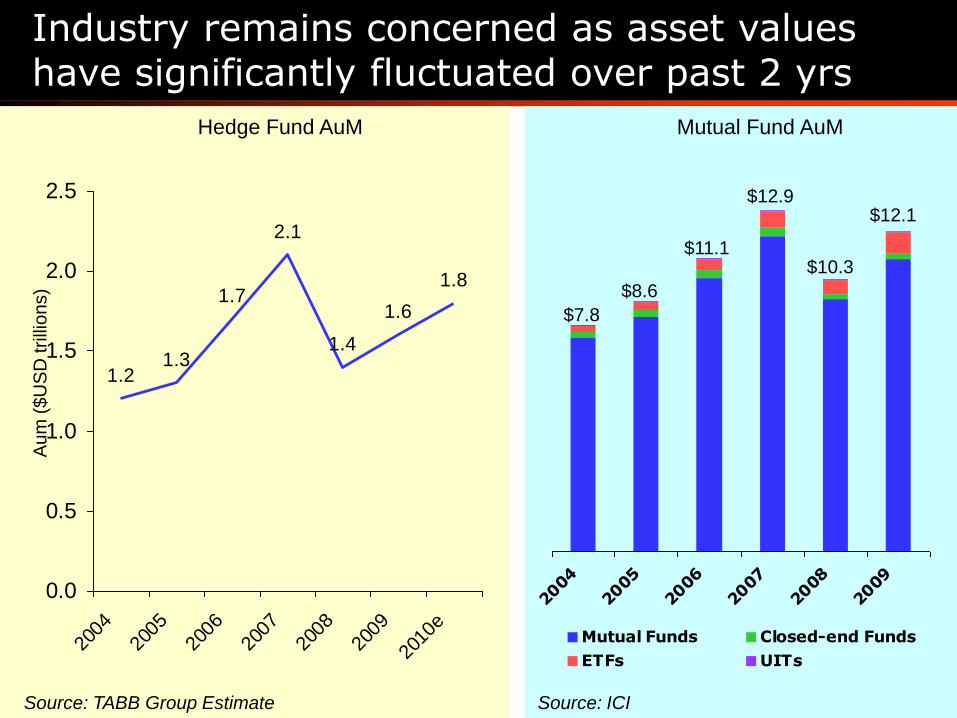
1.21.3
1.7
2.1
1.4
1.6
1.8
0.0
0.5
1.0
1.5
2.0
2.5
2004
2005
2006
2007
2008
2009
2010
e
Hedge Fund AuM
Industry remains concerned as asset values have significantly fluctuated over past 2 yrs
Au
m (
$U
SD
trilli
on
s)
2004
2005
2006
2007
2008
2009
Mutual Funds Closed-end Funds
ETFs UITs
$11.1
$12.9
$10.3
$12.1
$8.6
$7.8
Mutual Fund AuM
Source: TABB Group Estimate Source: ICI

54%
33%
27%
16%
13%
10%
8%
5%
Raising
Assets
Performance
Market
Volatility
Infrastructure
Regulatory
Liquidity
People
Broker
Relationships
Greatest Challenges Facing Your Firm?
Funds greatest concerns are raising assets while investors are worried about risk
41%
25%
20%
18%
7%
5%
2%
2%
2%
30%
Operational
Safety of
Strategy
Liquidity Risk
Market
Performance
Holdings
Managed
Accounts
Fund Size
Regulatory
Changes
Leverage
Pricing
Greatest Customer Concerns?
Source: TABB Group US Institutional Brokerage 2010

37%
26%
26%
19%
19%
16%
9%
Relative Performance
Absolute Performance
Return of Retail Investor
Confidence
Stock Selection
New & Alternative
Products
Return of Asset
Allocation
Acquisitions /
International Equities
What drives the growth of your firm in 2010?
Buy-side firms are fighting to recover from loss of equity assets, devastated performance records
Source: TABB Group US Institutional Brokerage 2010

23%
19%
11%
32%Liquidity,
Flow
Color,
Information,
Insight
Best
Execution
Research
39%
38%
36%
69%Research
Liquidity,
Flow
Algorithms
Sales
Trader
The number one business driver for brokers has flipped from liquidity to alpha-generating content
Commission Allocation Business Drivers
2009
Commission Allocation Business Drivers
2008
Source: TABB Group US Institutional Brokerage 2010

10%
40%
50%
12%
24%
64%
7%
29%
64%
Increased
Flat
Decreased
Quantitative Both Fundamental
Has Your Commission Wallet Increased or Decreased 2009 vs. 2008?
By Investment Style
Assets & turnover are down, & ability to pay sell side for services is damaged at majority of firms
Source: TABB Group US Institutional Brokerage 2010
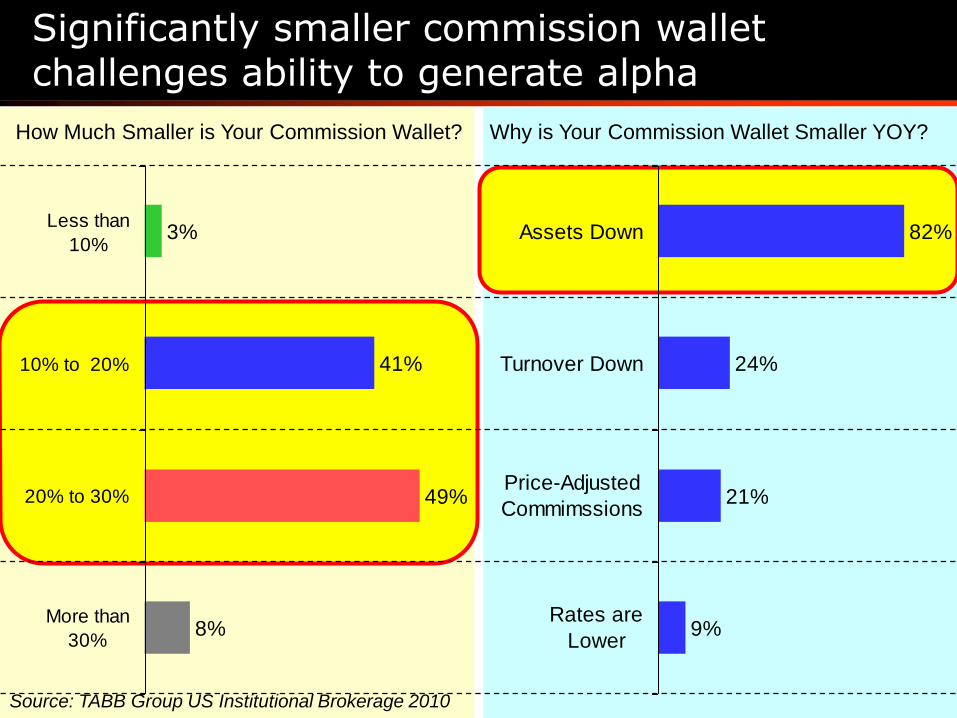
82%
24%
21%
9%
Assets Down
Turnover Down
Price-Adjusted
Commimssions
Rates are
Lower
3%
41%
49%
8%
Less than
10%
10% to 20%
20% to 30%
More than
30%
Why is Your Commission Wallet Smaller YOY? How Much Smaller is Your Commission Wallet?
How Much Smaller is Your Commission Wallet? Why is Your Commission Wallet Smaller YOY?
Significantly smaller commission wallet challenges ability to generate alpha
Source: TABB Group US Institutional Brokerage 2010

Average Commission Rates, 2006 – 2009
2.53
1.971.89
1.74
2006 2007 2008 2009
3 Year CAGR
-12% YOY ’08-’09
-8%
Brokers willing to cut rates – but they want consolidated flow
Source: TABB Group US Institutional Brokerage 2010

Increasingly CSAs are driving execution
48%
47%
28%
67%
65%
43%
80%
86%
50%
Large
Medium
Small
2007 2008 2009
29%
35%
34%
2 Year CAGR 2007 - 2009Percentage of Firms Using CSAs by Size
Source: TABB Group US Institutional Brokerage 2010
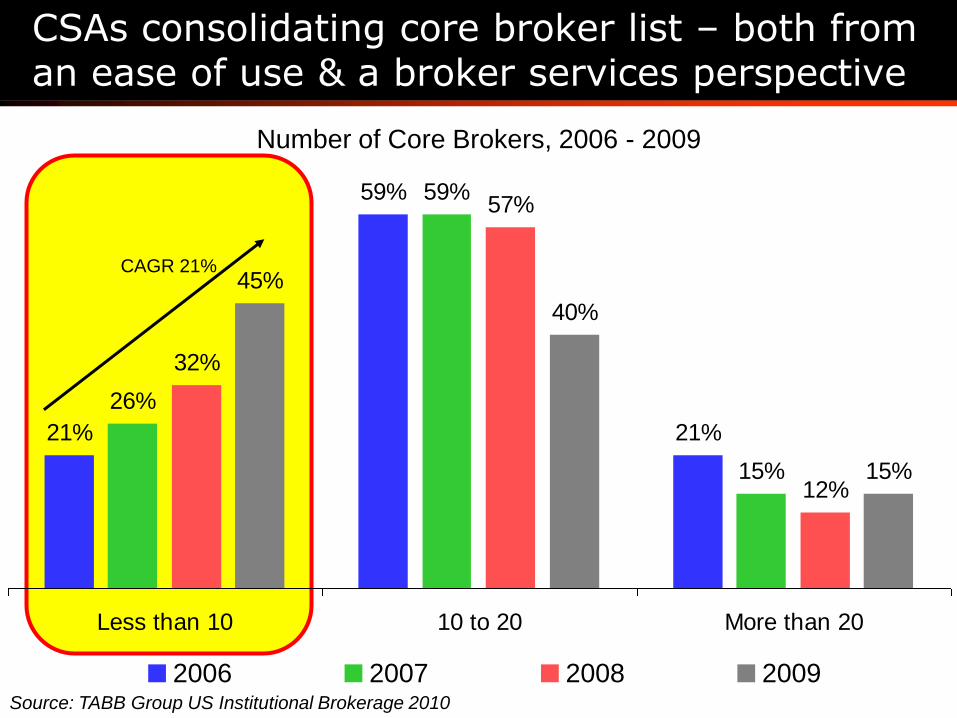
21%
59%
21%
26%
59%
15%
32%
57%
12%
45%
40%
15%
Less than 10 10 to 20 More than 20
2006 2007 2008 2009
CSAs consolidating core broker list – both from an ease of use & a broker services perspective
Number of Core Brokers, 2006 - 2009
CAGR 21%
Source: TABB Group US Institutional Brokerage 2010

13.4
11.4
12
12.3
13.6
10.6
13.7
12.8
18.6
13.3
14.8
15.5
Large
Medium
Small
Total
2009 2008 2007
-7%
-10%
-11%
-15%
Number of Core Brokers by Firm Size and Total 2 Year CAGR
…and average # of core brokers has declined to under 12.5 – declining 11% over last 2 years
Source: TABB Group US Institutional Brokerage 2010

While market is up, for the fund industry the business is still challenging
Business is difficult Investors are still scared – pulled out at wrong time
Assets are till mostly down
Alternatives are growing (ETFs)
Traditional distribution channels are being challenged (wirehouse branding)
Greater allocation to fixed income
Will assets come back? Boomers are starting to reach retirement age or are close
But where will boomers put assets?
Funds have cut costs to right-size
Opportunity is back But ability to capture opportunity is hampered
Commissions are down, but service demand is up Brokers want their more than fair share
And institutions have little alternative but to comply
CSAs are helping aggregate flow But hurting regionals, boutiques, and agency only brokers
And Regulation is around the corner

Regulation

House passes - Wall Street Reform and Consumer Protection Act of 2009
Creation of Consumer Financial Protection Agency (CFPA)
Financial Stability Council
Dissolution Authority and Ending “Too Big to Fail”
Executive Compensation
Investor Protections
Regulation of Derivatives
Mortgage Reform and Anti-Predatory Lending
Reform of Credit Rating Agencies
Hedge Fund, Private Equity & Private Pools of Capital Registration
Office of Insurance

Bill components
Consumer Financial Protection Agency (CFPA) Organization to vet financial products for consumers
Financial Stability Council Identify and regulate financial firms that are so large, interconnected, or risky
that their collapse would put the entire financial system at risk.
Dissolution Authority and Ending “Too Big to Fail” Gives government ability to take over and “resolve” large financial institutions
Executive Compensation A “say on pay,” oversight on executive comp & golden parachutes, enables
regulators to ban inappropriate or imprudently risky compensation practices,
& it requires disclosure of bonus plans
Investor Protections Strengthens SEC‟s powers so that it can better protect investors and regulate
the nation‟s securities markets

Bill components 2
Regulation of Derivatives Regulates OTC derivatives - standardized swaps have to be cleared &
traded on an exchange or electronic platform House amendment limits bank stakes in clearing houses to 20 percent
Mortgage Reform and Anti-Predatory Lending Mortgage reform and anti-predatory lending
Reform of Credit Rating Agencies Steps to reduce conflicts of interest, reduce market reliance on credit rating
agencies, & impose a liability standards on CRAs
Hedge Fund, Private Equity & Private Pools of Capital Registration Requires almost all private capital pool advisers to register with the SEC &
be subject to systemic risk regulation by the Financial Stability regulator

Unintended consequences
Will not be passed in tact Tremendous opposition and Senate has a different view
Much will be worked out in conference
Largest unintended consequences come from Derivatives bill Central clearing is not a panacea
How do you clear products that can‟t be valued? What happens to liquid products that become illiquid after a time?
Do we really want to incentivize the trading of OTC swaps?
Do we want to expand or contract these products
Who will provide liquidity? Traditional dealers will not provide liquidity with incentives
If we bring in more liquidity providers Will they have enough capital?
Who will guarantee them?
Depositories backed by banks limit counterparties to credit-worthy participants
Will banks join depositories with an unsound credit process?
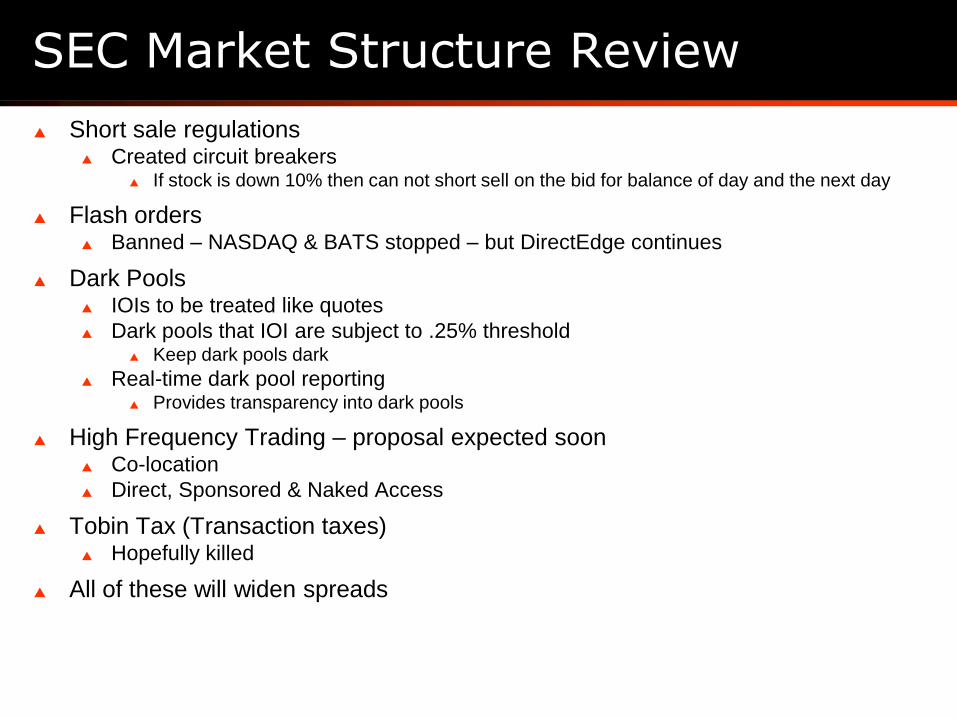
SEC Market Structure Review
Short sale regulations Created circuit breakers
If stock is down 10% then can not short sell on the bid for balance of day and the next day
Flash orders Banned – NASDAQ & BATS stopped – but DirectEdge continues
Dark Pools IOIs to be treated like quotes
Dark pools that IOI are subject to .25% threshold Keep dark pools dark
Real-time dark pool reporting Provides transparency into dark pools
High Frequency Trading – proposal expected soon Co-location
Direct, Sponsored & Naked Access
Tobin Tax (Transaction taxes) Hopefully killed
All of these will widen spreads

Other disjoint regulatory initiatives
The Volcker rule Eliminate banks proprietary trading desks - likelihood low
Bonus fever European bonus tax – done
US Windfall banking profits tax – likely
Transaction Tax Would be very detrimental to financial markets – hopefully not
Capital restrictions Increasing capital reserves for larger banks –likely
Speculator / CDS restrictions Restrictions on speculation most notably on “naked CDS” from the Greek debt crisis –
unclear
Lynch Amendment / Langen Initiative Restricting banks ownership in clearing houses to 20% collectively
Warner Langen of European Parliament initiative to ban bank ownership in European CCPs
European Private Equity restrictions Barring EU investments in non-EU private equity funds - unclear
Electronic Trading

Direct Feeds Black Boxes Algorithms DMAInternalization
& Crossing
Pre & Real
Time TCA
Electronic trading value chain has many components
Source: TABB Group
Market
Data
Analyzing data
from different
venues
Direct Feeds
Trade
Generation
What to buy
and sell - when
Black Boxes
HFT
Execution
Strategy
How to buy
and sell - where
Algorithms
Direct
Access /
Aggregation
Getting to the
right venue
DMA
Matching
Matching buyers &
sellers
Internalization
& Crossing
Transaction
Cost
Analysis
Did you made the
right decision?
Pre & Real
Time TCA
Market
Data
Trade
Generation
Execution
Strategy
Direct
Access /
AggregationMatching
Transaction
Cost
Analysis

Shares by Execution Venue (volume weighted)
1%
-5%
-22%
18%
-10%
37%
12%
14%
22%
15%
44%
11%
9%
24%
11%
38%
11%
9%
31%
12%
Sales Desk
Program
Desk
Direct To
Exchange
Algorithms
Crossing
Network
2007 2008 2009
2 Year CAGR
‟07-‟09
More than 50% of buy-side flow is direct & 40% is channeled through DMA or Algos
Source: TABB Group – Institutional Equity Trading in America ’09/’10

4.8%
9.1%
29.2%
Percentage of Share Volume Sent to Broker Algorithms
4 YR CAGR ‟05 – „09
+27%
90%
16.1%
Flow to algorithms continues to grow –significantly
5%
11%
21%22%
24%
31%
36%
2004 2005 2006 2007 2008 2009 2010E
Source: TABB Group – Institutional Equity Trading in America ’09/’10

US Equity Share Volume by Market Participant
High Frequency Trading accounts for 61% of Share Volume
Source: TABB Group Estimate
3% 6.8% 13.0% 16.2%
3.9% 28.0% 29.4%
Investors
Liquidity Providers
Retail
Hedge Funds
Investment Bank Prop
Long Only
HFT Hedge Funds
HFT Broker/ Market Makers
Independent HFT
Investors Liquidity Providers
The majority of trading is done by professional traders / liquidity providers
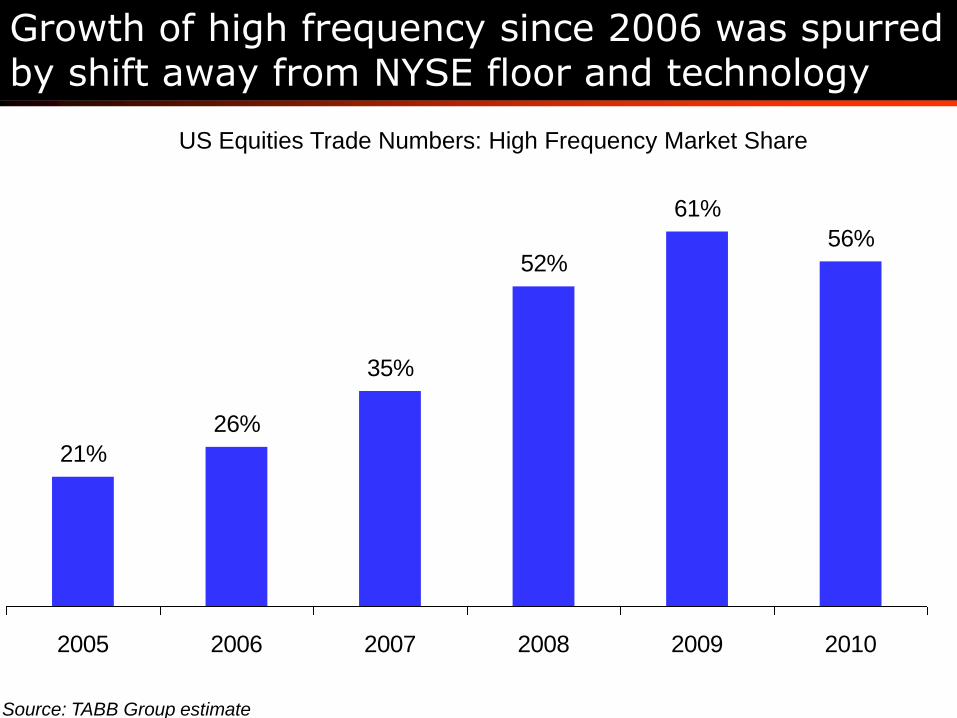
56%
61%
52%
35%
26%
21%
201020092008200720062005
US Equities Trade Numbers: High Frequency Market Share
Growth of high frequency since 2006 was spurred by shift away from NYSE floor and technology
Source: TABB Group estimate
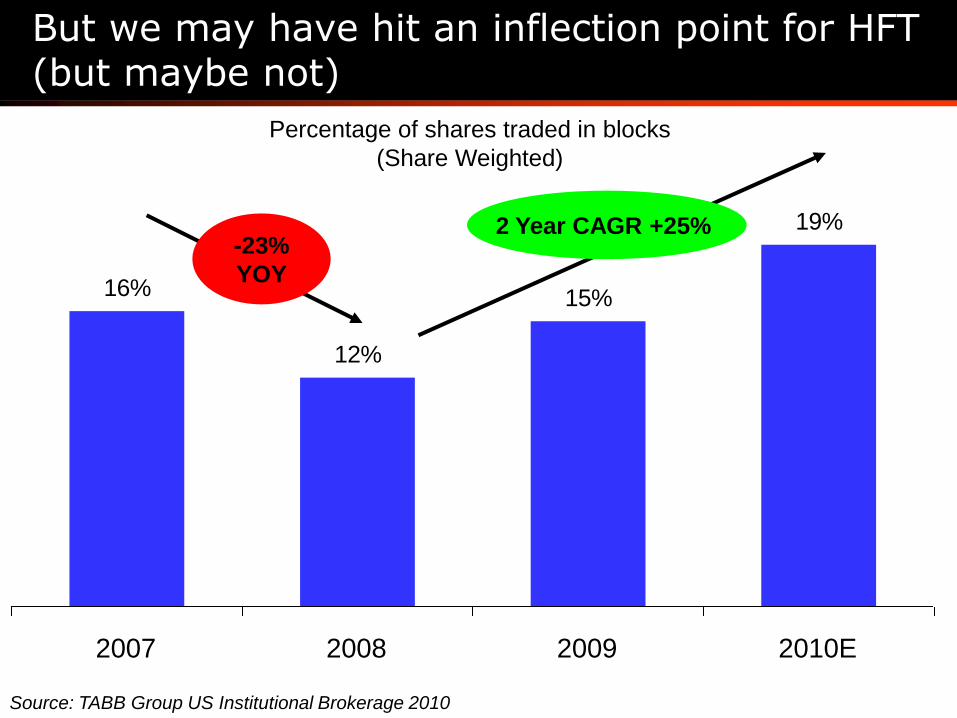
But we may have hit an inflection point for HFT (but maybe not)
19%
15%
12%
16%
2010E200920082007
2 Year CAGR +25%
Percentage of shares traded in blocks
(Share Weighted)
-23%
YOY
Source: TABB Group US Institutional Brokerage 2010

When it comes down to it – trading is now the battle of the trading bots Battlebots
Broker technologies protect the investor while fulfilling investors timeframe
Liquidity provider technologies determine supply and demand by bridging liquidity gaps The more liquidity providers, the greater the competition the more efficient the market
Liquidity provision is a zero sum game. Only one buyer and one seller match.
The three major constituents are well armed with technology Retail order flow usually goes to wholesales who compete heavily for this business
These providers fall under best execution guidelines
Institutional investors employ buy-side traders who focus on execution Buy-side traders are armed with algos, dark pools, and other liquidity finding technologies
Also fall under best execution guidelines
Firms average more than 20 brokers and switch on/off depending upon execution quality
Employ transaction cost analytics to measure execution cost This is a significant discussion point with their clients & investment consultants
Liquidity providers employ technology to find opportunities Co-location, high speed order routing and analysis engines, high speed market data, risk
management, and trading technology
The goal of investor-based order flow management is to balance investor protection vs. immediate execution

In last 3 years, exchanges have lost 32% market share to dark pools, ECNs, & regionals
89%
87%88
%
86%85
%85
%
82%83
%
73%76
%77
%76
%77
%
73%74
%
72%72
%71
%70
%
67%69
%69
%69
%
67%66
%66
%
62%
59%58
%57
%
53%53
%55%57
%58
%57
%
4% 5%3%
5% 6% 7% 8% 9%
15%14
%14
%14
%13
%14
%13
%15%15
%16
%18%19
%19
%19
%18
%21%22
%22
%24%25
%27%27
%30%29
%
26%25
%
22%22
%
5% 6% 6% 6% 6% 6% 7% 6%8% 8% 7% 8% 7% 8% 8% 9% 9% 9% 8%
10%
8% 7%9% 9%
11%10
%10
%10
%10
%10
%11
%11
%11
%10
%12%13
%
0%
20%
40%
60%
80%
100%
Jan-0
7
Mar
-07
May
-07
Jul-0
7
Sep
-07
Nov
-07
Jan-0
8
Mar
-08
May
-08
Jul-0
8
Sep
-08
Nov
-08
Jan-0
9
Mar
-09
May
-09
Jul-0
9
Sep
-09
Nov
-09
NYSE,
NASDAQ, &
Arca
BATS /
DirectEdge
Crossing /
Dark Pools
Regional
Exchanges
Source: TABB Group LiquidityMatrixTM
Matched US Equity Flow as a Percentage of Total US Equity Matched Flow

Market share of liquidity pools are beginning to converge
US Equity Market Share (includes Internalized)
Consolidated NYSE/NASDAQ Listed Equities
Jul 2008 – Jan 2010
4% 4% 4% 4%3% 3% 3% 3%
3%
5% 5% 5% 5%6%
7%8% 8%
7%
30%29% 29%
30% 30%
27% 27%
26%
23%
21%20% 20% 20%
19%19%
21% 21%20% 20%
16%
14% 14%15%
16%15% 15% 15%
14% 14% 14% 13% 13%
14% 14% 14% 14%
18.10%18.00%
19.90%20.10%19.90%
18.00%17.90%18.30%17.20%
16.40%16.00%15.10%14.60%14.00%
13.00%13.00%13.10%13.20%13.20%
10% 10% 11%11%
10%11%
11% 11%10%
10% 11% 11%10%
9% 9% 9% 9%10%
5%6% 5% 5%
6%6% 7% 7%
9%10%
10% 10%
12%13%
12%10% 10% 10%
8%7%
9%
7% 7%
9% 8%9% 9% 9% 9% 9% 8%
10% 9% 9% 10% 9% 9% 9%10%9% 9%
8%9%
11% 11%12%
14%
16%17%
17%
15%
16% 16%15% 15%
16%
18%
8%
14%15%
10%
-5.00%
5.00%
15.00%
25.00%
35.00%
Jul-08
Aug-0
8
Sep-0
8
Oct
-08
Nov-
08
Dec
-08
Jan-0
9
Feb-0
9
Mar-
09
Apr-
09
May-
09
Jun-0
9
Jul-09
Aug-0
9
Sep-0
9
Oct
-09
Nov-
09
Dec
-09
Jan-1
0
Regionals Nasdaq NYSE Arca BATS DirectEdge Dark Pools Internalized
Source: TABB Group LiquidityMatrixTM, Exchanges

Why is trading done by machines?
Liquidity has fragmented More than 50 places to electronically trade equities
No way to check each venue by hand
Order size had declined significantly Message traffic has increased significantly
Buy-side wants to execute this way Hide larger orders
Doesn‟t want to pay higher commissions
Brokers don‟t want staff
Measuring tools have allowed buy-side to better measure trading cost
Algorithms have improved to take complexity away from execution
Reg NMS preferences fast liquidity pools over slow

Conclusions
While market is up – money management has challenges Capital raising is more challenging
Investment strategies are more global Expanded operations – expanded complexity
Distribution channels compromised FoF & wirehouses brands tarnished
Rise of the independents
Shifting demographics
Declining commission dollars reduces buying power Research becoming more critical as managers cutting back expenses
Brokers will cut commissions but want more flow
Agency brokers have a more difficult time competing
Regulation will pass – it will be extensive – but not sure what will pass Will not be as extensive as the House version but will be significant
New trading technologies changes complexion of the market Market makers on the decline – high frequency traders on the increase
Need to be more careful with trading strategies / gaming
Changing the dynamics of the exchange fabric This is a globally phenomena

Citi Investment Mgt. CAB | Armonk NY | March 11, 2010
Industry Overview:
Market Evolution – Where are We and What Will Happen Next?
Presented by
Larry Tabb
Founder & CEO
TABB Group