industry outlook presentation to annual asa/afra … · industry outlook presentation to annual...
TRANSCRIPT

Industry Outlook Presentation to annual ASA/AFRA Conference
Adam Pilarski,
Senior Vice President, AVITAS, Inc.
July 10th, 2017
Reston, VA

2 topics to be covered
World developments
The forthcoming burst of a bubble
Page 2

World Developments
Using economics to understand them
Implication on our life
Page 3

Page 4

To help us understand reality we can use 4
economic concepts
Trade offs
Game Theory
Principal/Agent dilemma
Analytical thinking
Page 5

Analytical Thinking
Page 6

“For every simple problem there is an answer that is murky, complex and
wrong.”
Paul Krugman
“For every complex problem there is an answer that is clear, simple and
wrong.”
H. L. Mencken (1880-1965)
Trade-offs Page 7

Brexit
Trade off
Benefit – economies of scale, lower costs (€)
Cost – bureaucrats far away tell you what to do
Page 8

Principal Agent Problem
Can we find better implementers?
Page 9

Movement from central authority
Business people?
Military?
Page 10

Page 11
“Trump is CEO of the country”
Nikki Haley
May 14th, 2017
Page 12

Judging by results (concentrate on efficiency)
Plethora of billionaires in cabinet
Use/acceptance of business principles to guide our life
Education – Charter Schools
Can military run better government (plethora of
generals in cabinet)
Page 13

Make America Great Again not the
same as America World Leader
Page 14
If not the U.S…………
Page 15
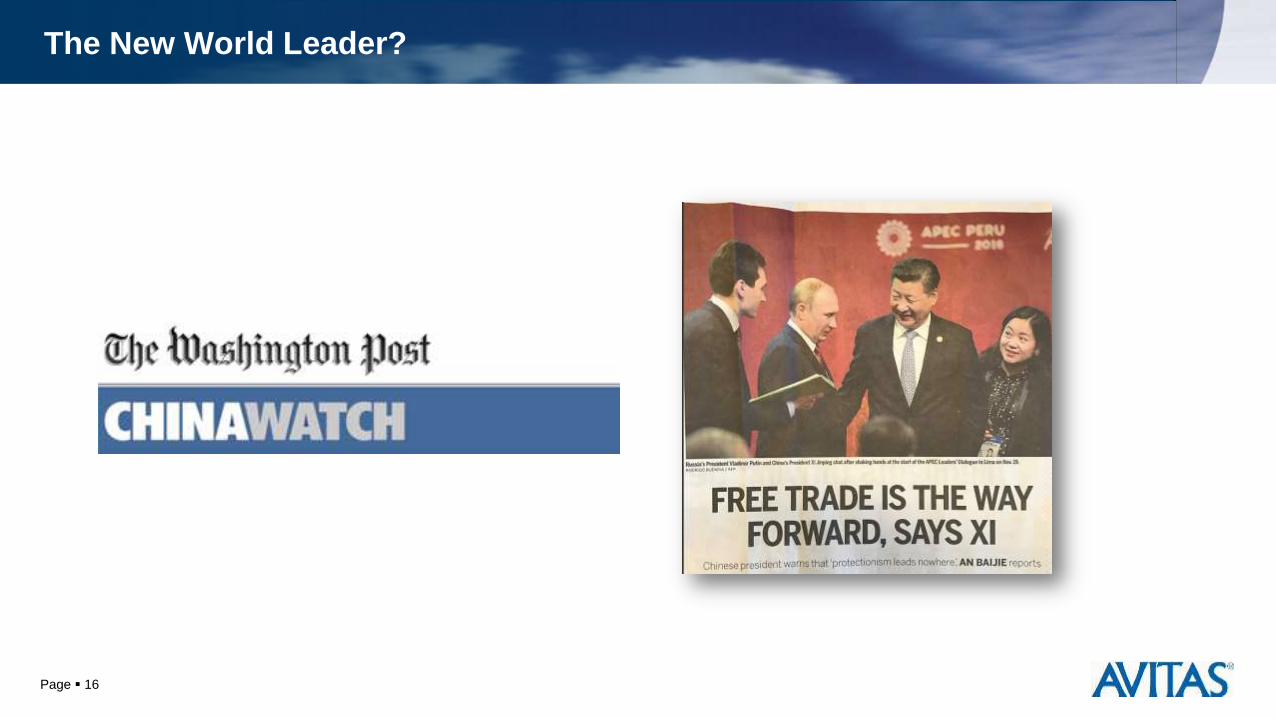
The New World Leader?
Page 16

Implications for business
Page 17

U.S. Share of World Traffic
67.6%
42.2%
31.8%
25.1% 21.4%
0%
10%
20%
30%
40%
50%
60%
70%
80%
1940 1950 1960 1970 1980 1990 2000 2010 2020
Page 18

Page 19

Page 20

2035 (Airbus/Boeing Forecasts)
World share of traffic
Asia (38-40%)
China 16.1% (B)
World share of GDP
Asia 40%
China 18.1% (B)
Page 21

Future role of dollar?
Demise has been predicted many times
Adam’s theory of tallest midget
Possible huge implication for our industry
Pricing of aircraft
Financing
Oil prices
Page 22

Possible bubble
Page 23

Concept of bubble
Irrational by definition
Both up and down
Impossible to predict
Burst usually caused by “wild developments”
Wars, policy mistakes……..
Page 24

0
1000
2000
3000
4000
5000
6000
7000
1970 1975 1980 1985 1990 1995 2000 2005 2010 2015
Annual World Passenger Air Traffic 1970-2016E
Historical World Passenger Traffic
Preliminary Model Results
Billions of RPKs
Sources: ICAO historical data and AVITAS forecast.
Note: Model results are preliminary and may be subject to change.
9/11 and 2008 Financial
Crisis Ln RPK = -12.88 + 1.95*Ln GDP - ...
Page 25
-6%
-4%
-2%
0%
2%
4%
6%
8%
10%
12%
14%
16%
-3%
-2%
-1%
0%
1%
2%
3%
4%
5%
6%
7%
8%
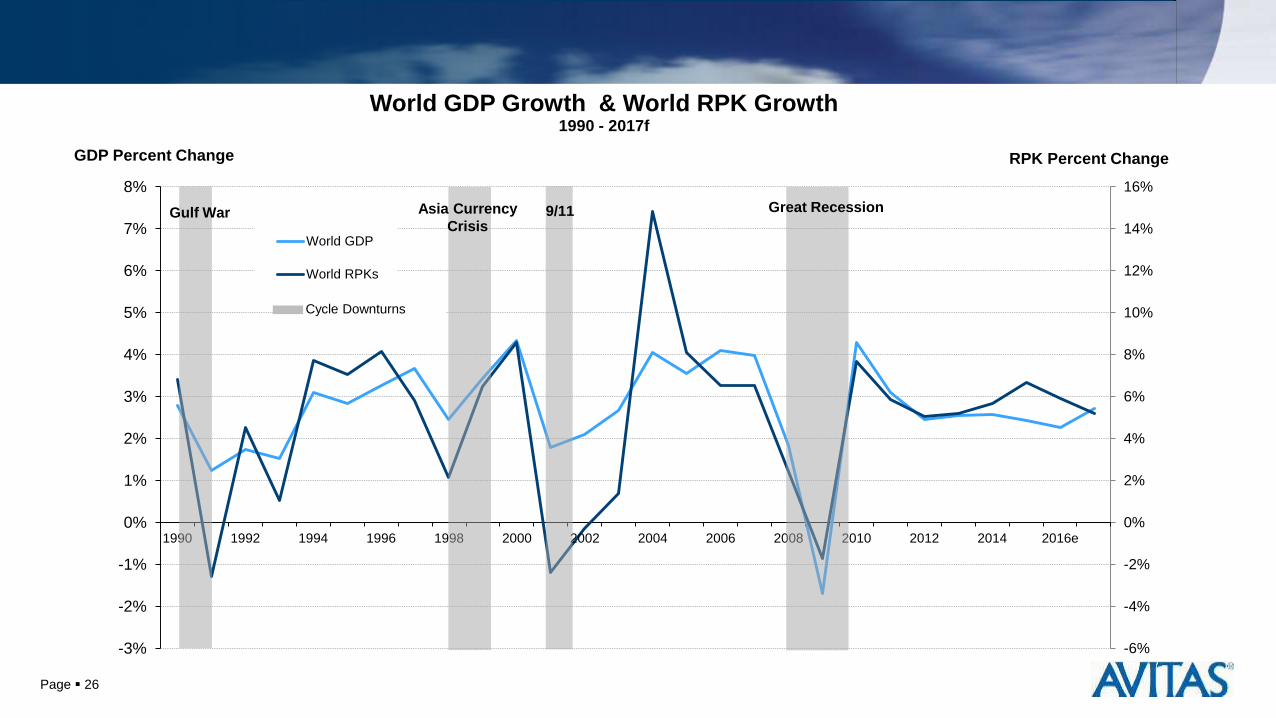
1990 1992 1994 1996 1998 2000 2002 2004 2006 2008 2010 2012 2014 2016e
RPK Percent Change GDP Percent Change
World GDP Growth & World RPK Growth 1990 - 2017f
World GDP
World RPKs
Gulf War Great Recession 9/11 Asia Currency
Crisis
Cycle Downturns
Page 26
-
500
1,000
1,500
2,000
2,500
3,000
3,500
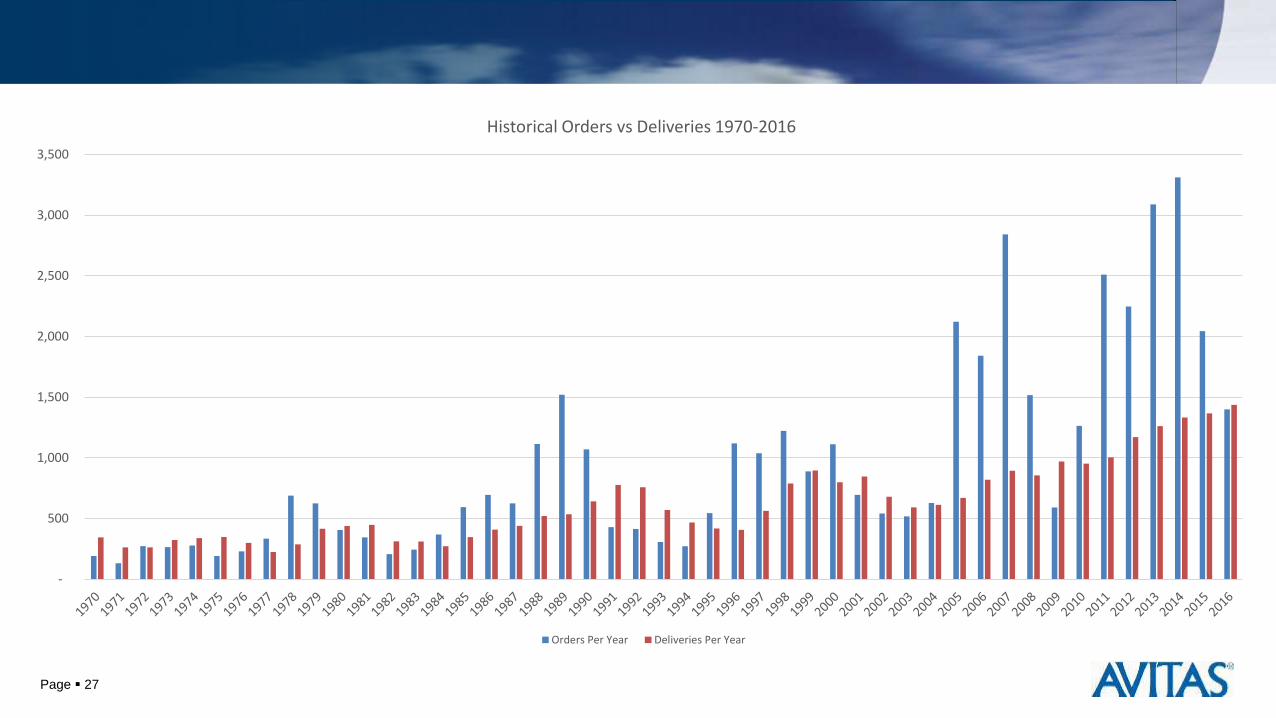
Historical Orders vs Deliveries 1970-2016
Orders Per Year Deliveries Per Year
Page 27

-
200
400
600
800
1,000
1,200
1,400
1,600
1984 1985 1986 1987 1988 1989 1990 1991 1992 1993 1994
Historical Orders vs Deliveries 1984-1994
Orders Per Year Deliveries Per Year
Page 28

-
500
1,000
1,500
2,000
2,500
3,000
3,500
2004 2005 2006 2007 2008 2009 2010 2011 2012 2013 2014 2015 2016
Historical Orders vs Deliveries 2004-2016
Orders Per Year Deliveries Per Year
Page 29

Why large orders
Double counting
Low interest rates
High oil prices
Proliferation of new narrow body models
Page 30

This time possible bubble pricks can be
identified
Stage One : Middle East
Stage Two : Leasing companies, especially in China
Page 31

Summary
“May you live in interesting times” is becoming reality
Heightened uncertainties may produce new opportunities
Coming to peak of cycle, though still positives likely

What to do?
Page 33

危 机 Crisis
Danger Opportunity

喂 鸡 Wei Ji
Hello Chicken

Washington 14520 Avion Parkway #300 Chantilly, VA 20151 USA
Phone: +1 703 476 2300 Fax: +1 703 860 5855
London PO Box 38
Betchworth Surrey RH3 7YZ UK
Phone/Fax: +44 1737 843 756 New York 857 Post Road #253 Fairfield, CT 06824 USA Phone: +1 703 480 0568
www.AVITAS.com @AVITASInc