industry case study: norm in the oil & gas...
TRANSCRIPT

1
Industry Case Study:NORM in the oil & gas sector
NORM and Natural Radiation Management, 19th - 20th April 2010Hilton Paddington, London
Mark Liddiard & Joe Toole – WorleyParsons
Overview
Recap previous Radon survey in Dec 2008
Follow-up Radon survey July 2009
Radon dose assessment
Review of in-situ radiation surveys 2005 – 2009
NORM waste accumulation (pending disposal)
Radiological risk assessment for platform

2
Background
Previous surveys on platform identified presence of NORM; elevated gamma dose rates at some separators and at waste drums.
Clients’ Regulator requested measurements of both Radon-222 and its alpha daughters (progeny) on the oil platform, both during ambient conditions and during work/maintenance activities.
The results of exploratory radon measurements are to be made to confirm or otherwise that inhalation doses due to radon and progeny are very much less than those from external gamma radiation.
Choice of Radon monitoring system
Several options explored
Track detectors – typically 3-month exposures, no daughters XElectret – typically 2-7 days exposure, no daughters XFemtoTech Pulsed ion chamber, real-time, no daughters XAlphaGuard +AlphaPM – real time, includes daughters
Real time measurements and use of DataExpert software package will allow results for all areas to be displayed and reported prior to leaving platform

3
Radon and Radon progeny measurements
AlphaGuard radon monitorRadon gas diffuses passively through a filter into an ionisation
chamberSampling period 10 minutesDetection limit ca 10 Bq/m3 radon-222
AlphaPM (progeny meter)Internal pump, high-precision flowmeter, filter intercepts Rn
progeny, alpha decays counted by semiconductor detectorSampling period 10 minutes, units EEC, Bq/m3
Synchronised to AlphaGuardDataExpert database software package
Instruments deployed

4
Detector display
WorleyParsons Office basement, Stirling

5
Oil/water sampling cabin
Oil/Water sampling cabin

6
Between separator tanks
Between separator tanks

7
Beside NORM solid waste drums
Beside NORM solid waste drums

8
Wellhead deck
Wellhead deck

9
sunrise
All Radon results (Dec 2008 survey)

10
Follow-up survey July 2009
A follow-up to the Dec 2008 survey sampling taking place in the summer period, on 28th and 29th July 2009temperatures were substantially higher than before (20-32 ºC compared to typically 12 -22 ºC in December) and much less wind. Most sampling locations were at or close to those which were sampled in December, although overall there were fewer samples since the survey was carried out over two days compared to four days in December. In total, eight sites on the Production deck were sampled using the same equipment as before.
All Radon results (July 2009 survey)
11
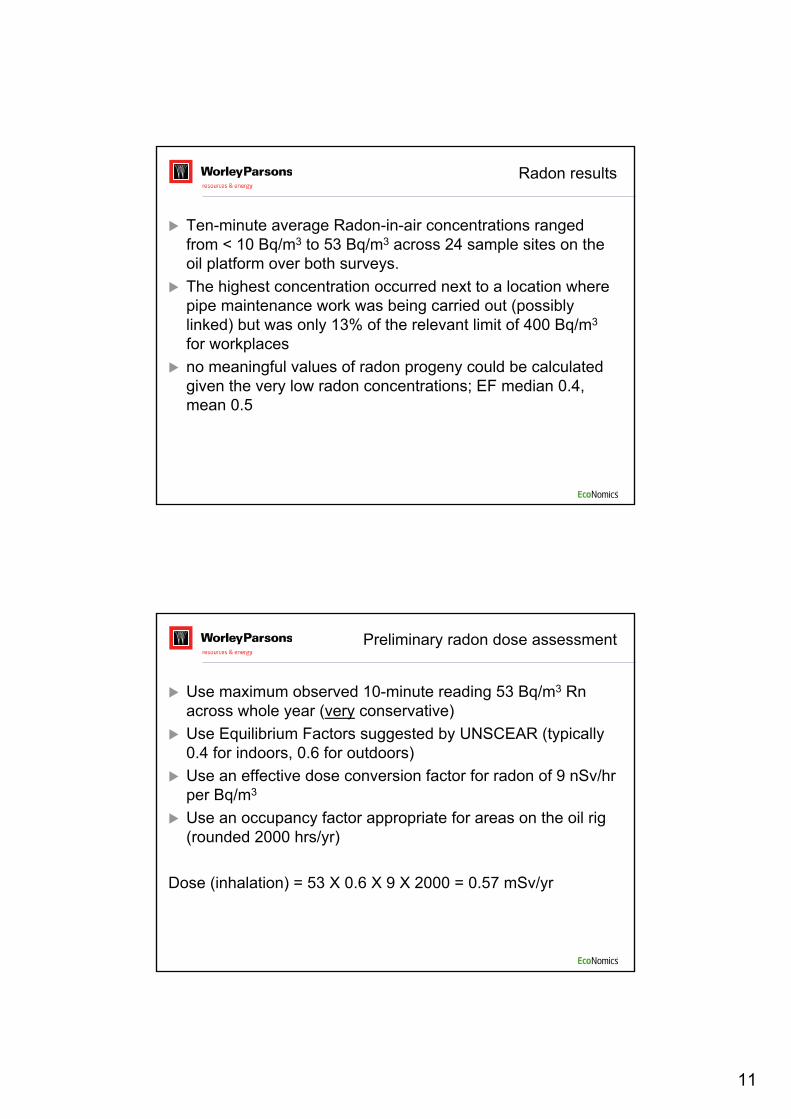
Radon results
Ten-minute average Radon-in-air concentrations ranged from < 10 Bq/m3 to 53 Bq/m3 across 24 sample sites on the oil platform over both surveys.The highest concentration occurred next to a location where pipe maintenance work was being carried out (possibly linked) but was only 13% of the relevant limit of 400 Bq/m3
for workplacesno meaningful values of radon progeny could be calculated given the very low radon concentrations; EF median 0.4, mean 0.5
Preliminary radon dose assessment
Use maximum observed 10-minute reading 53 Bq/m3 Rnacross whole year (very conservative)Use Equilibrium Factors suggested by UNSCEAR (typically 0.4 for indoors, 0.6 for outdoors)Use an effective dose conversion factor for radon of 9 nSv/hr per Bq/m3
Use an occupancy factor appropriate for areas on the oil rig (rounded 2000 hrs/yr)
Dose (inhalation) = 53 X 0.6 X 9 X 2000 = 0.57 mSv/yr

12
Review of 2005 -2009 in situ surveys
Since the first realisation in 2003 that naturally occurring radioactive material (NORM) was present on the oil & gas platform, the company initiated a series of radiological surveys. These were carried out between 2005 and 2009 and they continue under a scheduled annual programme. These surveys showed that NORM was present in tubulars, pumps, valves, separators and other top plant, consistent with the NORM issues seen on most other oil and gas platforms around the world. Using actual recorded measurements of radiation and radionuclide activity concentrations available for the platform, estimates of radiation exposure and effective doses have been made for the highest realistic potential exposure situations.
Example oil/water/gas separator

13
NORM drums, sludge transferred from separators
Interim waste accumulation
The clean-out of the Separators in September 2007 has had two effects:
1. The residual gamma dose rates at 1 metre at the two Separators dropped from between 1 - 4 µSv hr-1 to between < 0.16 to 0.6 µSv hr-1
2. Gamma contact dose rates measured in April 2008, December 2008 and April 2009 at the drums into which NORM sludge has been transferred from the Separators are as high as 60 – 75 µSv hr-1, some 4 to 5 times higher than when the material was in the Separator. This area is segregated.for one separator, recorded contact gamma dose rates were 0.1 to 0.7 µSv hr-1 after cleanout in Sept 2007 and 3.5 µSv hr-1 in April 2008 i.e. NORM is increasing again in separator.Company are in advanced discussions with Regulator to transfer NORM waste from drums to holding tank for slurry discharge to disused well.

14
Dose calculations
Skin dose estimateSkin dose (µSv) = (1.89 µSv hr-1 / Bq cm-2) X Bq cm-2 X hr (exposure time) [dose conversion factor ref Healy 1971, to be refined for more recent beta dose models]
Inhalation dose = (m3 hr-1) X (mg m-3 /1000) X (Bq g-1) X (Sv Bq-1 X 1,000,000) X (hr yr-1) = µSv yr-1 [summed for 3 radionuclides]
Ingestion dose = (mg hr-1) X (Bq g-1 /1000) X (Sv Bq-1 X 1,000,000) X (hr yr-1) = µSv yr-1[summed for 3 radionuclides]
Direct exposure to gamma rays in µSv are calculated using the measured dose rate in µSv hr-1 at a particular distance from the source and an assumed residence time at that distance (hours).
Maximum recorded activity concentrations/dose rates
75 µSv hr-1Contact dose rates at NORM drums
15 µSv hr-1Separators before cleaning
3000 cps17.3 Bq cm-2
Tubular from well
210Pb197 Bq g-1 dry wt
228Ra0.49 Bq g-1 dry wt
226Ra221 Bq g-1 dry wt
Sludge from drums
MeasurementSample type

15
Maximum readings, continued
222Rn53 Bq m-3
Radon at production deck level
210Pb0.47 Bq L-1
228Ra(2.02 Bq L-1)
226Ra150.4 Bq L-1
Water from feed tank effluent
5 µSv hr-1Dose rates 1 metre from NORM drums
MeasurementSample type
Dose summary
0.0035workerInhalation of radon and radon progeny on production deck, 12 hours sustained exposure
222Rn in air
0.04workerInadvertent ingestion of dried sludge following spill
226Ra, 228Ra and 210Pb in sludge
0.021workerInhalation of resuspended dried sludge following spill
226Ra, 228Ra and 210Pb in sludge
0.17workerGamma exposure 1 metre from isolated NORM waste drums, 10 minutes per day
226Ra in sludge
0.12workerGamma exposure 1 metre from separator after clean-out
226Ra in sludge
0.8workerGamma exposure 1 metre from separator prior to clean-out
226Ra in sludge
Estimated dose
(mSv yr-1)
ReceptorExposure routeSource

16
Unlikely/avoided exposure scenarios
23workerInhalation of radon and radon progeny in unventilated separator (estimated 3.5 GBq 226Ra) prior to clean-out, ten minutes exposure
222Rn in air
21.9workerInadvertent ingestion of water as potable water (500 litres per year)
226Ra, 228Ra and 210Pb in feed water
15workerGamma exposure at surface of NORM waste drums
226Ra in sludge
Estimated dose
(mSv yr-1)
ReceptorExposure routeSource
Conclusions
Under realistic exposure scenarios, estimated annual doses due to the presence of NORM, including Radon, on the studied platform range from 0.0035 to 0.8 mSv which is between 1 and 4 orders of magnitude lower than the annual (5-year) exposure limit of 20 mSv.In two unlikely exposure scenarios, the annual (5-year) exposure limit of 20 mSv is exceeded, however in one case the water considered is far from potable quality and in the other case, exposures in the confined space considered would not be realised due to standard risk mitigation procedures and ventilation.The use of written procedures, worker training and restricted area designation can avoid worker doses which approach the annual dose limit.

17
Contact details
[email protected]@worleyparsons.com+44 (0)1786 477320www.worleyparsons.com
40 Countries137 Offices29,100 Staff
Other offices currently involved in this area of work include Dubai, Abu Dhabi and Oman.