industrials and materials delta air lines, inc
TRANSCRIPT
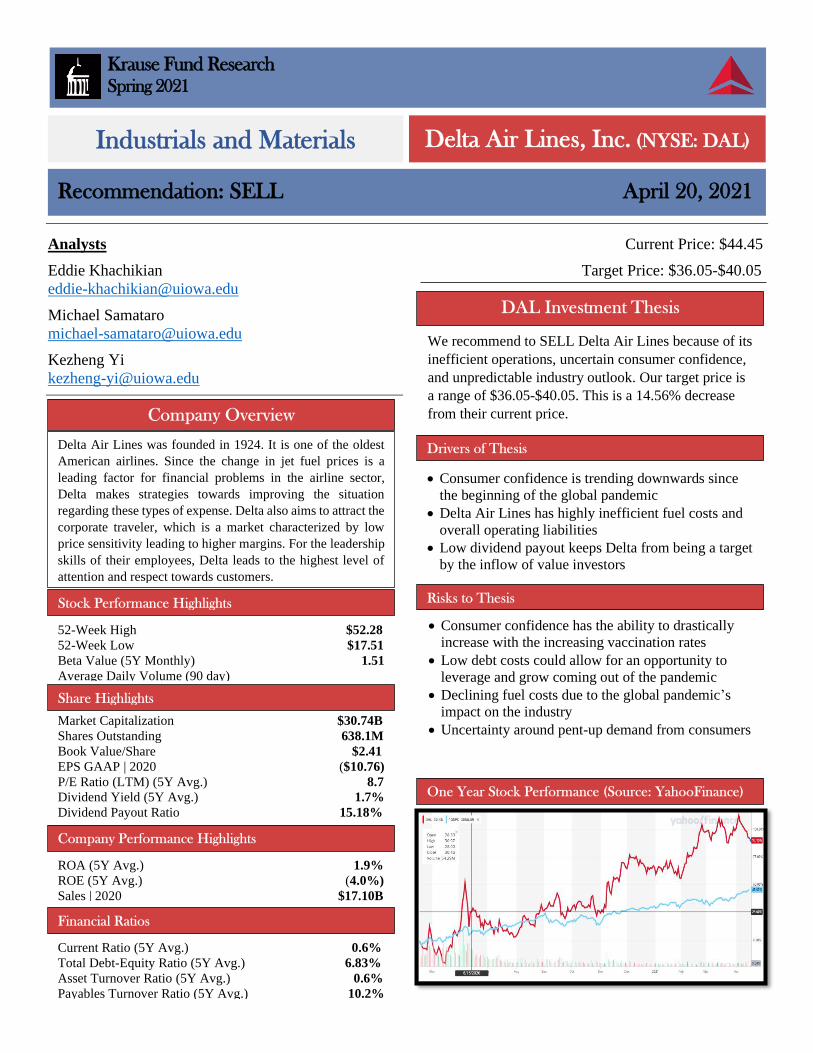
Analysts Current Price: $44.45
Eddie Khachikian Target Price: $36.05-$40.05
Michael Samataro
Kezheng Yi
Krause Fund Research Spring 2021
Industrials and Materials Delta Air Lines, Inc. (NYSE: DAL)
Recommendation: SELL April 20, 2021
We recommend to SELL Delta Air Lines because of its
inefficient operations, uncertain consumer confidence,
and unpredictable industry outlook. Our target price is
a range of $36.05-$40.05. This is a 14.56% decrease
from their current price.
52-Week High $52.28
52-Week Low $17.51
Beta Value (5Y Monthly) 1.51
Average Daily Volume (90 day)
13.6M
Market Capitalization $30.74B
Shares Outstanding 638.1M
Book Value/Share $2.41
EPS GAAP | 2020 ($10.76)
P/E Ratio (LTM) (5Y Avg.) 8.7
Dividend Yield (5Y Avg.) 1.7%
Dividend Payout Ratio 15.18%
Delta Air Lines was founded in 1924. It is one of the oldest
American airlines. Since the change in jet fuel prices is a
leading factor for financial problems in the airline sector,
Delta makes strategies towards improving the situation
regarding these types of expense. Delta also aims to attract the
corporate traveler, which is a market characterized by low
price sensitivity leading to higher margins. For the leadership
skills of their employees, Delta leads to the highest level of
attention and respect towards customers.
ROA (5Y Avg.) 1.9%
ROE (5Y Avg.) (4.0%)
Sales | 2020 $17.10B
Current Ratio (5Y Avg.) 0.6%
Total Debt-Equity Ratio (5Y Avg.) 6.83%
Asset Turnover Ratio (5Y Avg.) 0.6%
Payables Turnover Ratio (5Y Avg.) 10.2%
• Consumer confidence is trending downwards since
the beginning of the global pandemic
• Delta Air Lines has highly inefficient fuel costs and
overall operating liabilities
• Low dividend payout keeps Delta from being a target
by the inflow of value investors
• Consumer confidence has the ability to drastically
increase with the increasing vaccination rates
• Low debt costs could allow for an opportunity to
leverage and grow coming out of the pandemic
• Declining fuel costs due to the global pandemic’s
impact on the industry
• Uncertainty around pent-up demand from consumers
Company Analysis Notes:
-Connect Delta’s numbers to the industry analysis keys
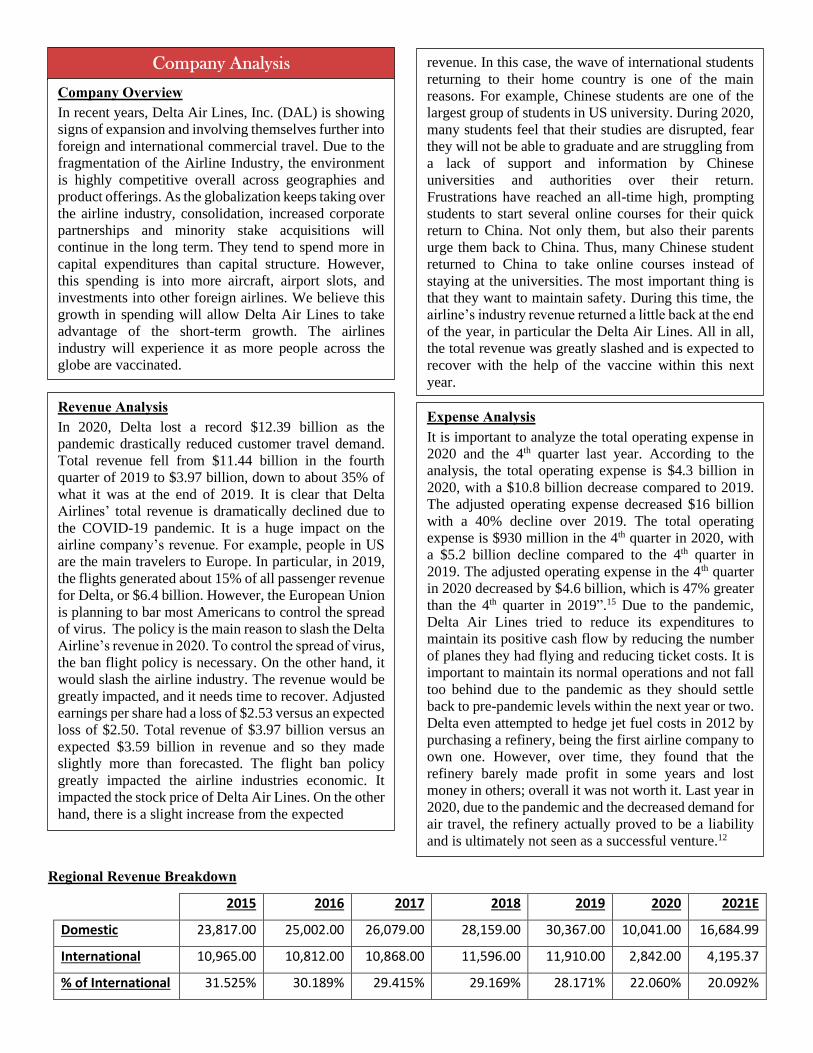
2015 2016 2017 2018 2019 2020 2021E
Domestic 23,817.00 25,002.00 26,079.00 28,159.00 30,367.00 10,041.00 16,684.99
International 10,965.00 10,812.00 10,868.00 11,596.00 11,910.00 2,842.00 4,195.37
% of International 31.525% 30.189% 29.415% 29.169% 28.171% 22.060% 20.092%
In recent years, Delta Air Lines, Inc. (DAL) is showing
signs of expansion and involving themselves further into
foreign and international commercial travel. Due to the
fragmentation of the Airline Industry, the environment
is highly competitive overall across geographies and
product offerings. As the globalization keeps taking over
the airline industry, consolidation, increased corporate
partnerships and minority stake acquisitions will
continue in the long term. They tend to spend more in
capital expenditures than capital structure. However,
this spending is into more aircraft, airport slots, and
investments into other foreign airlines. We believe this
growth in spending will allow Delta Air Lines to take
advantage of the short-term growth. The airlines
industry will experience it as more people across the
globe are vaccinated.
In 2020, Delta lost a record $12.39 billion as the
pandemic drastically reduced customer travel demand.
Total revenue fell from $11.44 billion in the fourth
quarter of 2019 to $3.97 billion, down to about 35% of
what it was at the end of 2019. It is clear that Delta
Airlines’ total revenue is dramatically declined due to
the COVID-19 pandemic. It is a huge impact on the
airline company’s revenue. For example, people in US
are the main travelers to Europe. In particular, in 2019,
the flights generated about 15% of all passenger revenue
for Delta, or $6.4 billion. However, the European Union
is planning to bar most Americans to control the spread
of virus. The policy is the main reason to slash the Delta
Airline’s revenue in 2020. To control the spread of virus,
the ban flight policy is necessary. On the other hand, it
would slash the airline industry. The revenue would be
greatly impacted, and it needs time to recover. Adjusted
earnings per share had a loss of $2.53 versus an expected
loss of $2.50. Total revenue of $3.97 billion versus an
expected $3.59 billion in revenue and so they made
slightly more than forecasted. The flight ban policy
greatly impacted the airline industries economic. It
impacted the stock price of Delta Air Lines. On the other
hand, there is a slight increase from the expected
revenue. In this case, the wave of international students
returning to their home country is one of the main
reasons. For example, Chinese students are one of the
largest group of students in US university. During 2020,
many students feel that their studies are disrupted, fear
they will not be able to graduate and are struggling from
a lack of support and information by Chinese
universities and authorities over their return.
Frustrations have reached an all-time high, prompting
students to start several online courses for their quick
return to China. Not only them, but also their parents
urge them back to China. Thus, many Chinese student
returned to China to take online courses instead of
staying at the universities. The most important thing is
that they want to maintain safety. During this time, the
airline’s industry revenue returned a little back at the end
of the year, in particular the Delta Air Lines. All in all,
the total revenue was greatly slashed and is expected to
recover with the help of the vaccine within this next
year.
It is important to analyze the total operating expense in
2020 and the 4th quarter last year. According to the
analysis, the total operating expense is $4.3 billion in
2020, with a $10.8 billion decrease compared to 2019.
The adjusted operating expense decreased $16 billion
with a 40% decline over 2019. The total operating
expense is $930 million in the 4th quarter in 2020, with
a $5.2 billion decline compared to the 4th quarter in
2019. The adjusted operating expense in the 4th quarter
in 2020 decreased by $4.6 billion, which is 47% greater
than the 4th quarter in 2019”.15 Due to the pandemic,
Delta Air Lines tried to reduce its expenditures to
maintain its positive cash flow by reducing the number
of planes they had flying and reducing ticket costs. It is
important to maintain its normal operations and not fall
too behind due to the pandemic as they should settle
back to pre-pandemic levels within the next year or two.
Delta even attempted to hedge jet fuel costs in 2012 by
purchasing a refinery, being the first airline company to
own one. However, over time, they found that the
refinery barely made profit in some years and lost
money in others; overall it was not worth it. Last year in
2020, due to the pandemic and the decreased demand for
air travel, the refinery actually proved to be a liability
and is ultimately not seen as a successful venture.12
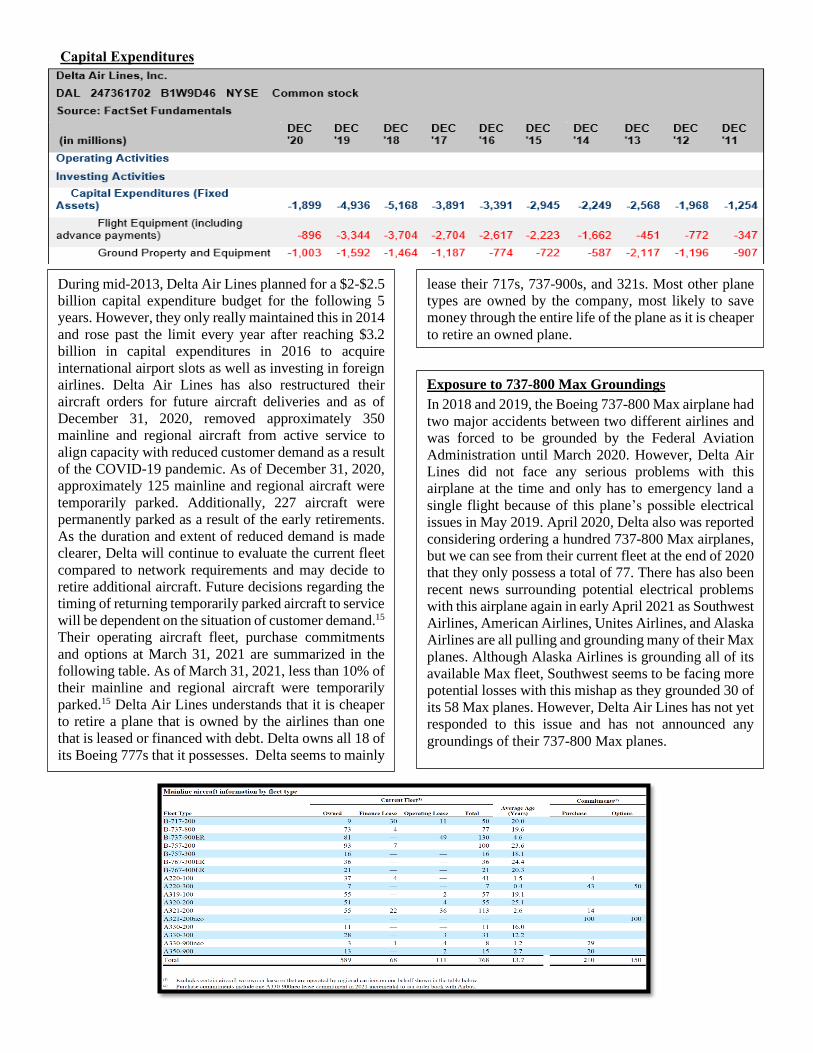
During mid-2013, Delta Air Lines planned for a $2-$2.5
billion capital expenditure budget for the following 5
years. However, they only really maintained this in 2014
and rose past the limit every year after reaching $3.2
billion in capital expenditures in 2016 to acquire
international airport slots as well as investing in foreign
airlines. Delta Air Lines has also restructured their
aircraft orders for future aircraft deliveries and as of
December 31, 2020, removed approximately 350
mainline and regional aircraft from active service to
align capacity with reduced customer demand as a result
of the COVID-19 pandemic. As of December 31, 2020,
approximately 125 mainline and regional aircraft were
temporarily parked. Additionally, 227 aircraft were
permanently parked as a result of the early retirements.
As the duration and extent of reduced demand is made
clearer, Delta will continue to evaluate the current fleet
compared to network requirements and may decide to
retire additional aircraft. Future decisions regarding the
timing of returning temporarily parked aircraft to service
will be dependent on the situation of customer demand.15
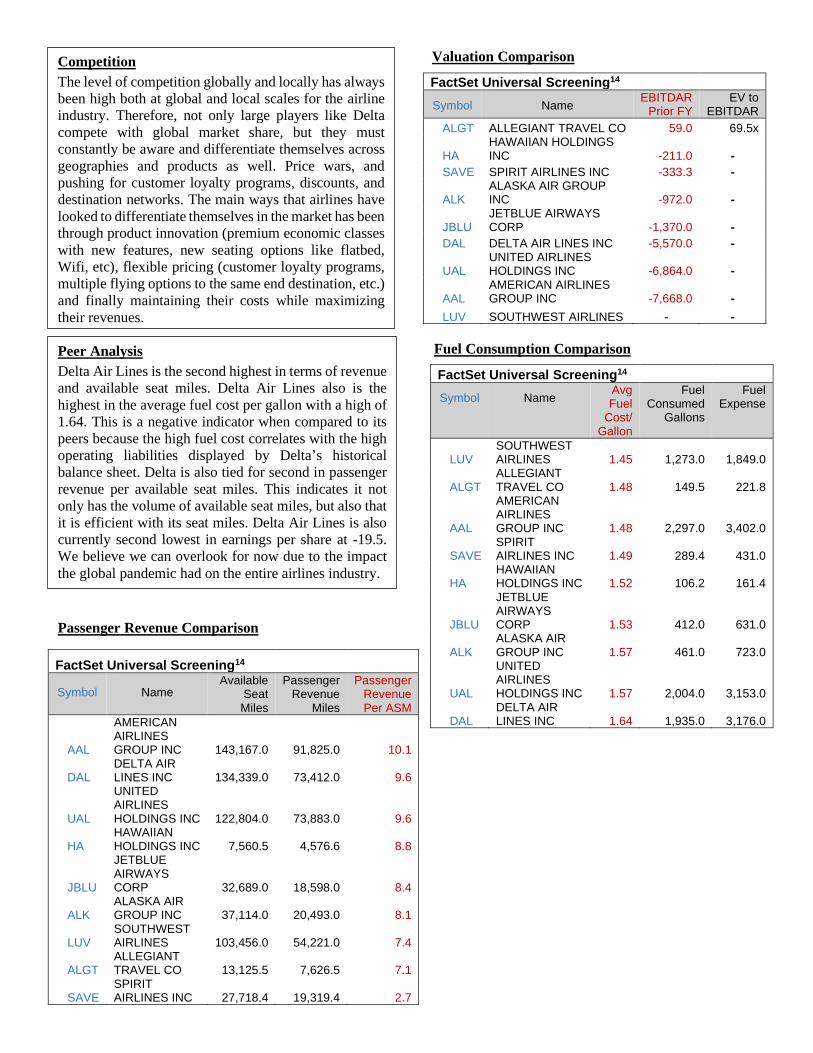
Their operating aircraft fleet, purchase commitments
and options at March 31, 2021 are summarized in the
following table. As of March 31, 2021, less than 10% of
their mainline and regional aircraft were temporarily
parked.15 Delta Air Lines understands that it is cheaper
to retire a plane that is owned by the airlines than one
that is leased or financed with debt. Delta owns all 18 of
its Boeing 777s that it possesses. Delta seems to mainly
lease their 717s, 737-900s, and 321s. Most other plane
types are owned by the company, most likely to save
money through the entire life of the plane as it is cheaper
to retire an owned plane.
Exposure to 737-800 Max Groundings
In 2018 and 2019, the Boeing 737-800 Max airplane had
two major accidents between two different airlines and
was forced to be grounded by the Federal Aviation
Administration until March 2020. However, Delta Air
Lines did not face any serious problems with this
airplane at the time and only has to emergency land a
single flight because of this plane’s possible electrical
issues in May 2019. April 2020, Delta also was reported
considering ordering a hundred 737-800 Max airplanes,
but we can see from their current fleet at the end of 2020
that they only possess a total of 77. There has also been
recent news surrounding potential electrical problems
with this airplane again in early April 2021 as Southwest
Airlines, American Airlines, Unites Airlines, and Alaska
Airlines are all pulling and grounding many of their Max
planes. Although Alaska Airlines is grounding all of its
available Max fleet, Southwest seems to be facing more
potential losses with this mishap as they grounded 30 of
its 58 Max planes. However, Delta Air Lines has not yet
responded to this issue and has not announced any
groundings of their 737-800 Max planes.

Fuel Costs
As shown in the quarter from 1 to 4 in 2020, the fuel cost
has declined dramatically. Normally, the average fuel
cost per quarter is above $1.2B. However, the situation
was different in 2020. The pandemic of COVID-19
started around March in 2020 in the US, which was close
to the end of the 1st quarter. The amount of fuel cost in
1st quarter reached above the normal level around
$1.6B. Afterwards, it slashed to below $400M. It
generally increased to 500 M in quarter 3 and to $700M
in quarter 4. According to the forecast, it still needs a
long time to reach the normal level. On the other hand,
Delta Air Lines did a good job to maintain its cash
streams and Revenue Passenger Mile (RPM) by
reducing its expenditures. Generally, it reached the top
level of RPM among its competitors during the
pandemic period. As shown in quarter 4 of 2020, real
GDP seems to have stabilized in the short-term for the
United States economy. We expect that in the short-
term, real GDP will see even higher increases when the
first half of 2021’s real GDP is reported. This is due to
the second round of stimulus checks flooding into the
economy as well as a positive increase in consumer
confidence due to the growing positive vaccination
results stemming from the federal government’s
research.
Global Airline Traffic Growth
Due to the pandemic of COVID-19, the global airline
traffic growth was slashed during the 2020. Comparing
to its main competitors, such as United, Southern
western, American Airlines, Delta gained its profit by
generating its positive brand. Many people tend to buy
Delta’s ticket, regardless of the pandemic. Therefore, it
gains its loyal customers and could generate its
profitability in the long run. This 5.7% year-over-year
growth decrease is due to the disruption from the global
pandemic. This sharp decline reveals that consumption
decreased as well as consumer confidence. For
industries to make up a high percentage of GDP, such
as financial services and airlines, the government needs
to make drastic changes to our economy to slow the
drop in GDP. Luckily, the federal government did just
that by increasing spending in the latter half of 2020 and
implementing stimulus checks. As shown below, this
increase in government spending created a quick and
positive impact on GDP.
Load Factor
In general, load factor is a key measure of the
company’s capacity utilization among industries. This
is a challenge for airline industry because people do not
tend to buy airline tickets for travelling during the
pandemic of COVID-19. Besides, there are some
airline-ban-policies in some countries, such as Spain,
UK, Italy, and so on. On the other hand, Delta did a
great job in this field among its competitors. Delta Air
Lines followed closely behind American Airlines
(Revenue Passenger Mile) RPM of 128.5 B with 121.7
B, as well as its RPM was closed by their industry-
leading load factor of 86.5%. In conclusion, Delta
generates a higher profitability than its competitors and
maintains the top level of its capacity utilization by its
highest load factor in the airline industry.
Consumer Confidence Index
In general, the Consumer Confidence Index (CCI) has
decreased due to the COVID-19 pandemic. The CCI
indicates the customers' confidence for their spending in
a specific industry. During the specific period, people
tend to stay in their safety at home instead of traveling
to other destinations. On the other hand, the CCI in Delta
Airlines is relatively higher than its competitors.
Because of COVID-19, people’s wages are slashed by
the economic recession. People do not have enough
money to spend in travel, such as personal and business
travel. Compared to its main competitors, such as United
and Southwestern Airlines, Delta Air Lines has a
relative lower price. Therefore, people might afford it
and it increases their CCI.
Valuation Comparison
FactSet Universal Screening14
Symbol Name EBITDAR
Prior FY EV to
EBITDAR
ALGT ALLEGIANT TRAVEL CO 59.0 69.5x
HA HAWAIIAN HOLDINGS INC -211.0 -
SAVE SPIRIT AIRLINES INC -333.3 -
ALK ALASKA AIR GROUP INC -972.0 -
JBLU JETBLUE AIRWAYS CORP -1,370.0 -
DAL DELTA AIR LINES INC -5,570.0 -
UAL UNITED AIRLINES HOLDINGS INC -6,864.0 -
AAL AMERICAN AIRLINES GROUP INC -7,668.0 -
LUV SOUTHWEST AIRLINES - -
FactSet Universal Screening14
Symbol Name Avg Fuel
Cost/ Gallon
Fuel Consumed
Gallons
Fuel Expense
LUV SOUTHWEST AIRLINES 1.45 1,273.0 1,849.0
ALGT ALLEGIANT TRAVEL CO 1.48 149.5 221.8
AAL
AMERICAN AIRLINES GROUP INC 1.48 2,297.0 3,402.0
SAVE SPIRIT AIRLINES INC 1.49 289.4 431.0
HA HAWAIIAN HOLDINGS INC 1.52 106.2 161.4
JBLU
JETBLUE AIRWAYS CORP 1.53 412.0 631.0
ALK ALASKA AIR GROUP INC 1.57 461.0 723.0
UAL
UNITED AIRLINES HOLDINGS INC 1.57 2,004.0 3,153.0
DAL DELTA AIR LINES INC 1.64 1,935.0 3,176.0
FactSet Universal Screening14
Symbol Name Available
Seat Miles
Passenger Revenue
Miles
Passenger Revenue Per ASM
AAL
AMERICAN AIRLINES GROUP INC 143,167.0 91,825.0 10.1
DAL DELTA AIR LINES INC 134,339.0 73,412.0 9.6
UAL
UNITED AIRLINES HOLDINGS INC 122,804.0 73,883.0 9.6
HA HAWAIIAN HOLDINGS INC 7,560.5 4,576.6 8.8
JBLU
JETBLUE AIRWAYS CORP 32,689.0 18,598.0 8.4
ALK ALASKA AIR GROUP INC 37,114.0 20,493.0 8.1
LUV SOUTHWEST AIRLINES 103,456.0 54,221.0 7.4
ALGT ALLEGIANT TRAVEL CO 13,125.5 7,626.5 7.1
SAVE SPIRIT AIRLINES INC 27,718.4 19,319.4 2.7
Competition
The level of competition globally and locally has always
been high both at global and local scales for the airline
industry. Therefore, not only large players like Delta
compete with global market share, but they must
constantly be aware and differentiate themselves across
geographies and products as well. Price wars, and
pushing for customer loyalty programs, discounts, and
destination networks. The main ways that airlines have
looked to differentiate themselves in the market has been
through product innovation (premium economic classes
with new features, new seating options like flatbed,
Wifi, etc), flexible pricing (customer loyalty programs,
multiple flying options to the same end destination, etc.)
and finally maintaining their costs while maximizing
their revenues.
Fuel Consumption Comparison
Passenger Revenue Comparison
Peer Analysis
Delta Air Lines is the second highest in terms of revenue
and available seat miles. Delta Air Lines also is the
highest in the average fuel cost per gallon with a high of
1.64. This is a negative indicator when compared to its
peers because the high fuel cost correlates with the high
operating liabilities displayed by Delta’s historical
balance sheet. Delta is also tied for second in passenger
revenue per available seat miles. This indicates it not
only has the volume of available seat miles, but also that
it is efficient with its seat miles. Delta Air Lines is also
currently second lowest in earnings per share at -19.5.
We believe we can overlook for now due to the impact
the global pandemic had on the entire airlines industry.
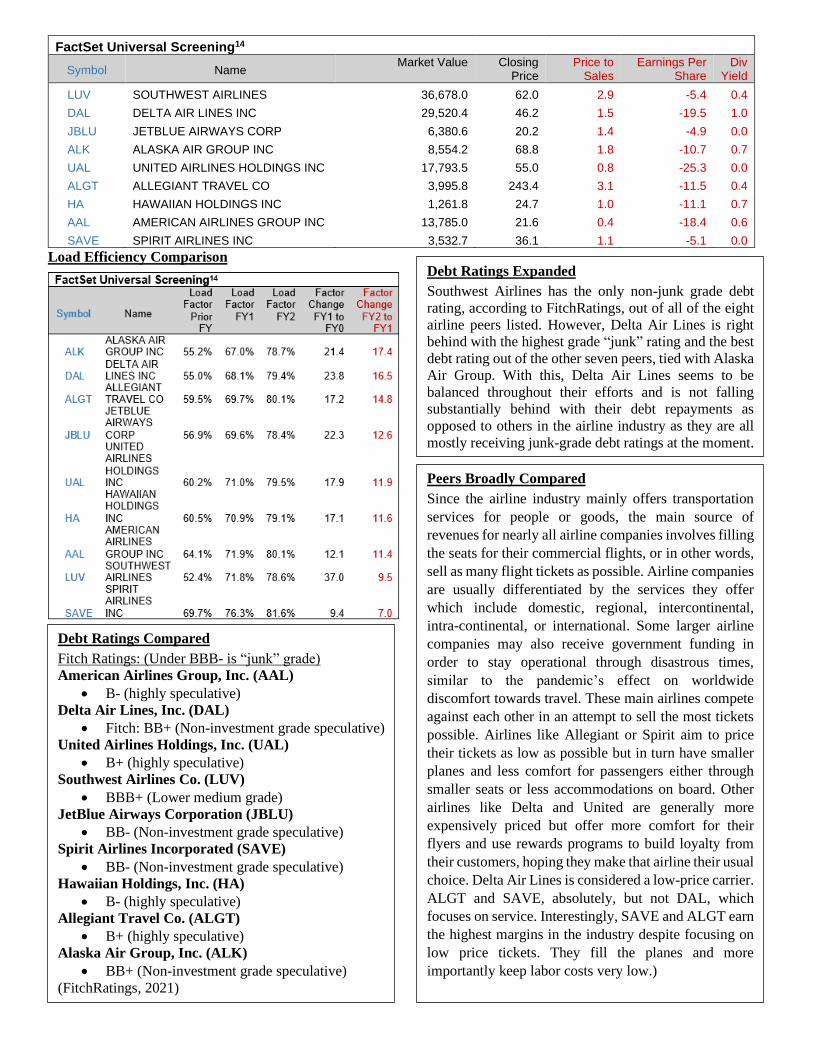
Load Efficiency Comparison
FactSet Universal Screening14
Symbol Name Market Value Closing
Price Price to
Sales Earnings Per
Share Div
Yield
LUV SOUTHWEST AIRLINES 36,678.0 62.0 2.9 -5.4 0.4
DAL DELTA AIR LINES INC 29,520.4 46.2 1.5 -19.5 1.0
JBLU JETBLUE AIRWAYS CORP 6,380.6 20.2 1.4 -4.9 0.0
ALK ALASKA AIR GROUP INC 8,554.2 68.8 1.8 -10.7 0.7
UAL UNITED AIRLINES HOLDINGS INC 17,793.5 55.0 0.8 -25.3 0.0
ALGT ALLEGIANT TRAVEL CO 3,995.8 243.4 3.1 -11.5 0.4
HA HAWAIIAN HOLDINGS INC 1,261.8 24.7 1.0 -11.1 0.7
AAL AMERICAN AIRLINES GROUP INC 13,785.0 21.6 0.4 -18.4 0.6
SAVE SPIRIT AIRLINES INC 3,532.7 36.1 1.1 -5.1 0.0
Debt Ratings Compared
Fitch Ratings: (Under BBB- is “junk” grade)
American Airlines Group, Inc. (AAL)
• B- (highly speculative)
Delta Air Lines, Inc. (DAL)
• Fitch: BB+ (Non-investment grade speculative)
United Airlines Holdings, Inc. (UAL)
• B+ (highly speculative)
Southwest Airlines Co. (LUV)
• BBB+ (Lower medium grade)
JetBlue Airways Corporation (JBLU)
• BB- (Non-investment grade speculative)
Spirit Airlines Incorporated (SAVE)
• BB- (Non-investment grade speculative)
Hawaiian Holdings, Inc. (HA)
• B- (highly speculative)
Allegiant Travel Co. (ALGT)
• B+ (highly speculative)
Alaska Air Group, Inc. (ALK)
• BB+ (Non-investment grade speculative)
(FitchRatings, 2021)
Debt Ratings Expanded
Southwest Airlines has the only non-junk grade debt
rating, according to FitchRatings, out of all of the eight
airline peers listed. However, Delta Air Lines is right
behind with the highest grade “junk” rating and the best
debt rating out of the other seven peers, tied with Alaska
Air Group. With this, Delta Air Lines seems to be
balanced throughout their efforts and is not falling
substantially behind with their debt repayments as
opposed to others in the airline industry as they are all
mostly receiving junk-grade debt ratings at the moment.
Peers Broadly Compared
Since the airline industry mainly offers transportation
services for people or goods, the main source of
revenues for nearly all airline companies involves filling
the seats for their commercial flights, or in other words,
sell as many flight tickets as possible. Airline companies
are usually differentiated by the services they offer
which include domestic, regional, intercontinental,
intra-continental, or international. Some larger airline
companies may also receive government funding in
order to stay operational through disastrous times,
similar to the pandemic’s effect on worldwide
discomfort towards travel. These main airlines compete
against each other in an attempt to sell the most tickets
possible. Airlines like Allegiant or Spirit aim to price
their tickets as low as possible but in turn have smaller
planes and less comfort for passengers either through
smaller seats or less accommodations on board. Other
airlines like Delta and United are generally more
expensively priced but offer more comfort for their
flyers and use rewards programs to build loyalty from
their customers, hoping they make that airline their usual
choice. Delta Air Lines is considered a low-price carrier.
ALGT and SAVE, absolutely, but not DAL, which
focuses on service. Interestingly, SAVE and ALGT earn
the highest margins in the industry despite focusing on
low price tickets. They fill the planes and more
importantly keep labor costs very low.)
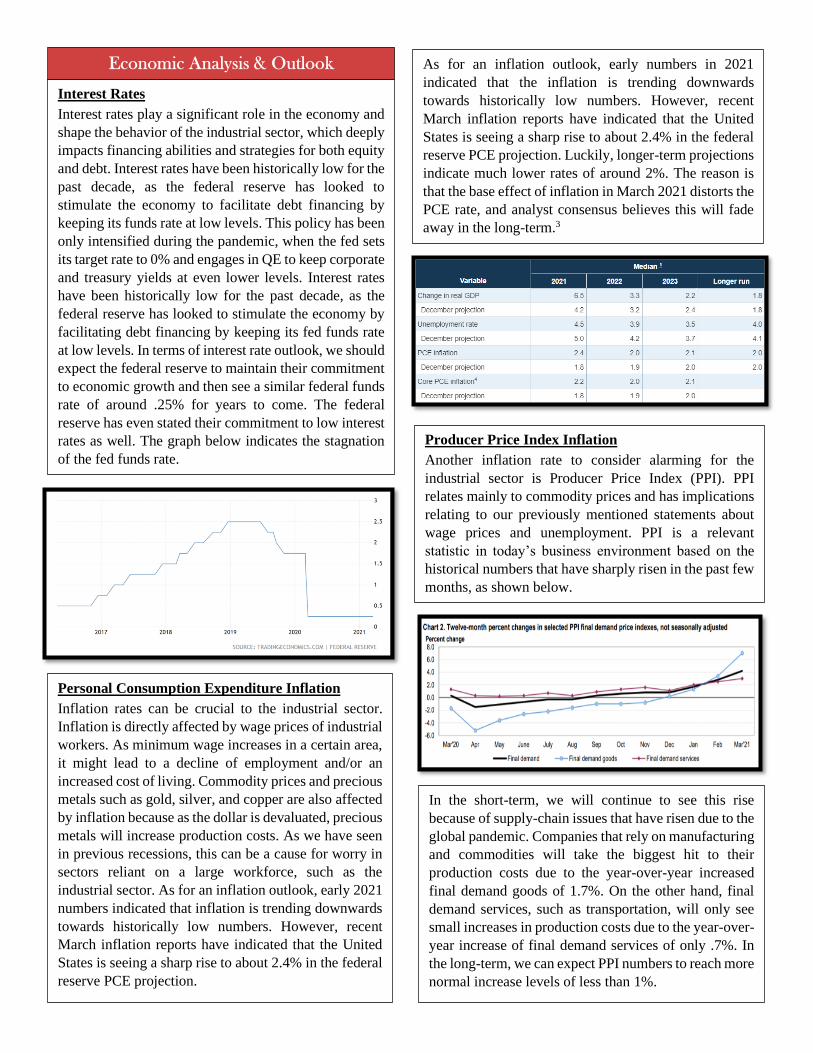
Interest Rates
Interest rates play a significant role in the economy and
shape the behavior of the industrial sector, which deeply
impacts financing abilities and strategies for both equity
and debt. Interest rates have been historically low for the
past decade, as the federal reserve has looked to
stimulate the economy to facilitate debt financing by
keeping its funds rate at low levels. This policy has been
only intensified during the pandemic, when the fed sets
its target rate to 0% and engages in QE to keep corporate
and treasury yields at even lower levels. Interest rates
have been historically low for the past decade, as the
federal reserve has looked to stimulate the economy by
facilitating debt financing by keeping its fed funds rate
at low levels. In terms of interest rate outlook, we should
expect the federal reserve to maintain their commitment
to economic growth and then see a similar federal funds
rate of around .25% for years to come. The federal
reserve has even stated their commitment to low interest
rates as well. The graph below indicates the stagnation
of the fed funds rate.
Personal Consumption Expenditure Inflation
Inflation rates can be crucial to the industrial sector.
Inflation is directly affected by wage prices of industrial
workers. As minimum wage increases in a certain area,
it might lead to a decline of employment and/or an
increased cost of living. Commodity prices and precious
metals such as gold, silver, and copper are also affected
by inflation because as the dollar is devaluated, precious
metals will increase production costs. As we have seen
in previous recessions, this can be a cause for worry in
sectors reliant on a large workforce, such as the
industrial sector. As for an inflation outlook, early 2021
numbers indicated that inflation is trending downwards
towards historically low numbers. However, recent
March inflation reports have indicated that the United
States is seeing a sharp rise to about 2.4% in the federal
reserve PCE projection.
As for an inflation outlook, early numbers in 2021
indicated that the inflation is trending downwards
towards historically low numbers. However, recent
March inflation reports have indicated that the United
States is seeing a sharp rise to about 2.4% in the federal
reserve PCE projection. Luckily, longer-term projections
indicate much lower rates of around 2%. The reason is
that the base effect of inflation in March 2021 distorts the
PCE rate, and analyst consensus believes this will fade
away in the long-term.3
Producer Price Index Inflation
Another inflation rate to consider alarming for the
industrial sector is Producer Price Index (PPI). PPI
relates mainly to commodity prices and has implications
relating to our previously mentioned statements about
wage prices and unemployment. PPI is a relevant
statistic in today’s business environment based on the
historical numbers that have sharply risen in the past few
months, as shown below.
In the short-term, we will continue to see this rise
because of supply-chain issues that have risen due to the
global pandemic. Companies that rely on manufacturing
and commodities will take the biggest hit to their
production costs due to the year-over-year increased
final demand goods of 1.7%. On the other hand, final
demand services, such as transportation, will only see
small increases in production costs due to the year-over-
year increase of final demand services of only .7%. In
the long-term, we can expect PPI numbers to reach more
normal increase levels of less than 1%.
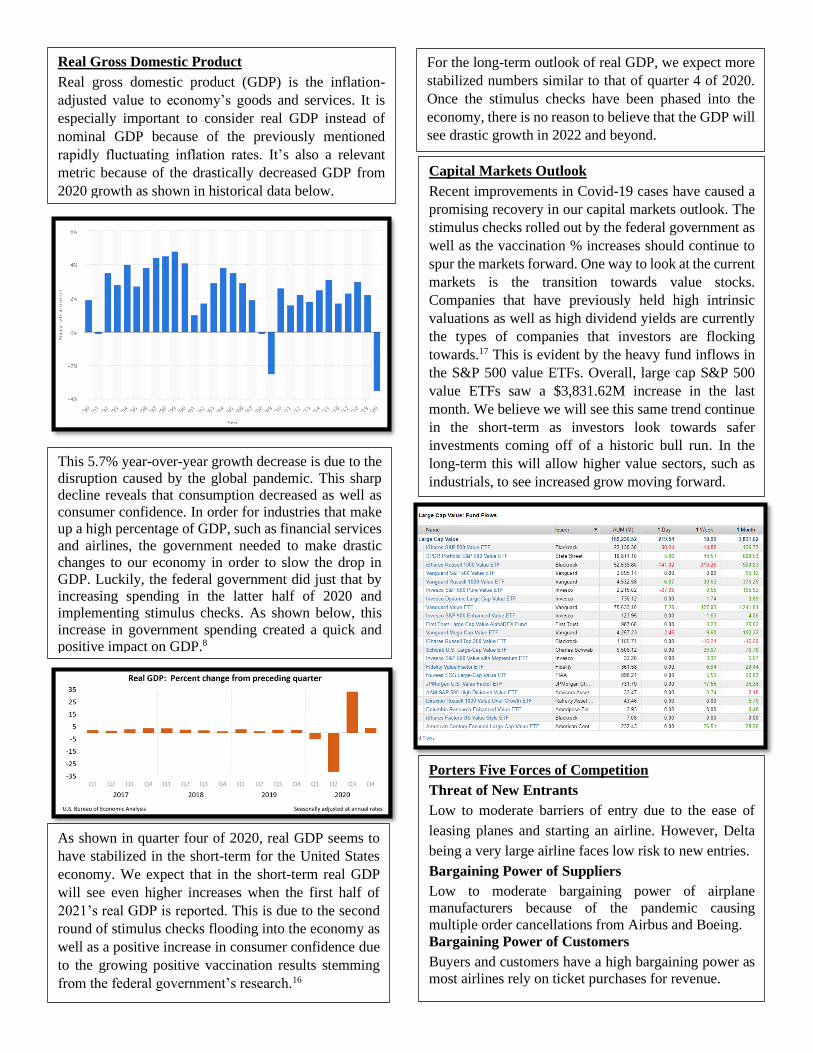
Real Gross Domestic Product
Real gross domestic product (GDP) is the inflation-
adjusted value to economy’s goods and services. It is
especially important to consider real GDP instead of
nominal GDP because of the previously mentioned
rapidly fluctuating inflation rates. It’s also a relevant
metric because of the drastically decreased GDP from
2020 growth as shown in historical data below.
This 5.7% year-over-year growth decrease is due to the
disruption caused by the global pandemic. This sharp
decline reveals that consumption decreased as well as
consumer confidence. In order for industries that make
up a high percentage of GDP, such as financial services
and airlines, the government needed to make drastic
changes to our economy in order to slow the drop in
GDP. Luckily, the federal government did just that by
increasing spending in the latter half of 2020 and
implementing stimulus checks. As shown below, this
increase in government spending created a quick and
positive impact on GDP.8
As shown in quarter four of 2020, real GDP seems to
have stabilized in the short-term for the United States
economy. We expect that in the short-term real GDP
will see even higher increases when the first half of
2021’s real GDP is reported. This is due to the second
round of stimulus checks flooding into the economy as
well as a positive increase in consumer confidence due
to the growing positive vaccination results stemming
from the federal government’s research.16
For the long-term outlook of real GDP, we expect more
stabilized numbers similar to that of quarter 4 of 2020.
Once the stimulus checks have been phased into the
economy, there is no reason to believe that the GDP will
see drastic growth in 2022 and beyond.
Capital Markets Outlook
Recent improvements in Covid-19 cases have caused a
promising recovery in our capital markets outlook. The
stimulus checks rolled out by the federal government as
well as the vaccination % increases should continue to
spur the markets forward. One way to look at the current
markets is the transition towards value stocks.
Companies that have previously held high intrinsic
valuations as well as high dividend yields are currently
the types of companies that investors are flocking
towards.17 This is evident by the heavy fund inflows in
the S&P 500 value ETFs. Overall, large cap S&P 500
value ETFs saw a $3,831.62M increase in the last
month. We believe we will see this same trend continue
in the short-term as investors look towards safer
investments coming off of a historic bull run. In the
long-term this will allow higher value sectors, such as
industrials, to see increased grow moving forward.
Porters Five Forces of Competition
Threat of New Entrants
Low to moderate barriers of entry due to the ease of
leasing planes and starting an airline. However, Delta
being a very large airline faces low risk to new entries.
Bargaining Power of Suppliers
Low to moderate bargaining power of airplane
manufacturers because of the pandemic causing
multiple order cancellations from Airbus and Boeing.
Bargaining Power of Customers
Buyers and customers have a high bargaining power as
most airlines rely on ticket purchases for revenue.

Valuation Reasoning
The final valuation range we arrived at was between
$36.05 and $40.05 per share. The way we arrived at this
range was mainly by using the DCF and EP models of
valuation and accounting for our sensitivity tables. The
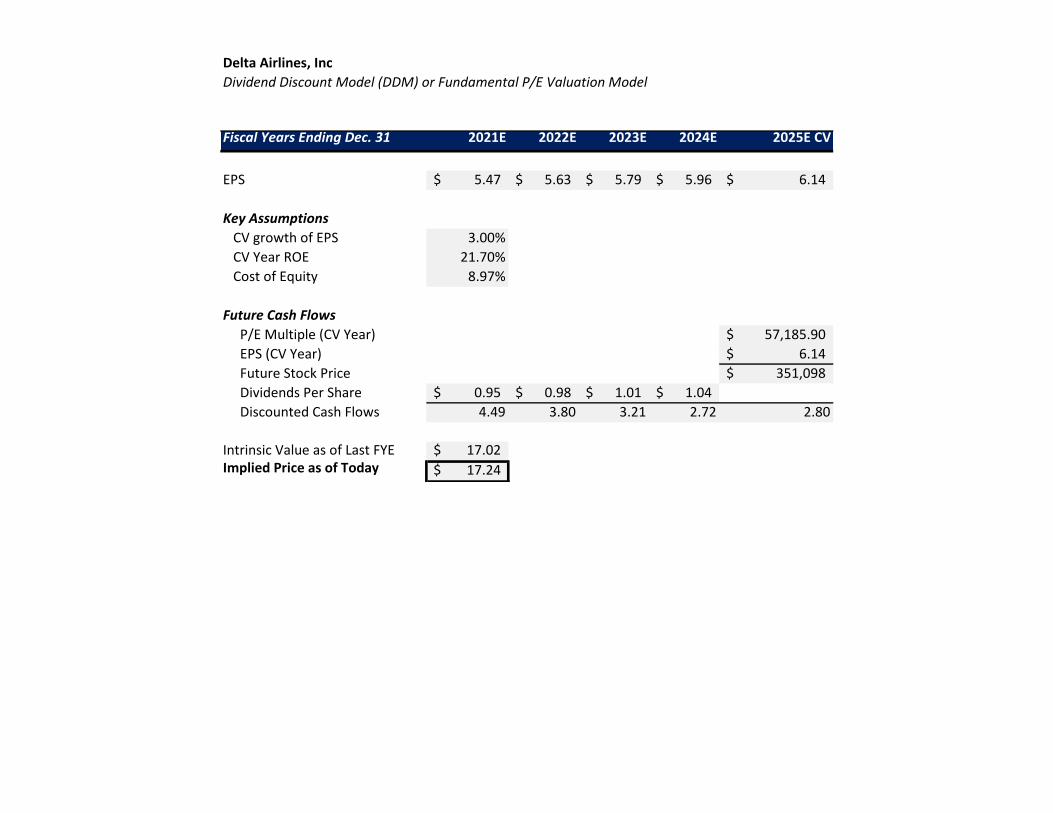
DDM model of valuation was not a technique our group
put a lot of stock into due to its low skewed valuation.
The reason for the low-skewed valuation is because
Delta is not a company with a high payout ratio. To
account for the low-skewed valuation, we made sure to
show a range on the lower side when compared to the
DCF and EP valuation of $40.05 per share. This is
abnormal for many companies with as strong of cash
flows as Delta has seen over the past decade. These
strong cash flows are also what caused us to put more
stock into the DCF and EP models.
Weighted Average Cost of Capital
The WACC our group arrived at was 9.69%. We
arrived at this percentage by weighing out the cost of
equity as well as the cost of debt. By doing so we could
account for the changes in Delta’s capital structure.
using a risk-free rate of 1.72%, a beta of 1.45, and an
equity risk premium of 5%. This WACC valuation
seems to come out on the high side for the airlines
industry. This indicates to us that Delta does not have
an overwhelming amount of debt in their structure.
When compared to a company like American Airlines
who does have this type of structure, we can expect
Delta to see much less risk to their growth in the coming
years.
Critical Assumptions
A crucial operations assumption we made was to lower
the of growth made by “Cargo” and “Other” revenue.
These segments of revenue growth decreasing are
something we are comfortable with as Delta transitions
back towards its passenger revenue segments. Other
income statement assumptions were to not utilize the
2020 historical accounts. These accounts would drop the
revenue growth forecasts and not line up with
reasonable assumptions for industry metrics. We also
made sure to include a steady growth of foreign revenue.
As Delta intends to move more into this area, it logical
to assume they are almost guaranteed to grow in this
segment. The same critical assumption to not include
2020 balance sheet accounts in our forecasted averages
was also made. The reasoning for this was because the
2020 accounts were far too inconceivable to forecast in
the coming years. This would have completely thrown
off the forecasting of our model. Another balance sheet
assumption we made was to not include the first seven
years of taxes payable. This is because the taxes
Application of Valuation Model
We feel very confident in the implied share price range
we decided on. Going into the valuation we expected
the range to trend towards at a lower point than what
Delta is currently trading at. While Delta does have
good parts of their business, like its available seat miles,
low debt, and potential to operate in foreign countries,
we felt that in order for Delta to become a buy rating
our valuation would have to trend closer to the upper
trends of our sensitivity analysis. A number closer to the
upper trends on the “Current Dividend Yield” and
“Beta” table would reverse the sell rating. The way that
Delta Air Lines can do this is by paying out a higher
dividend yield. A higher dividend yield makes Delta a
more attractive company to the inflow of value
investors and increase its DCF and EP valuation. Based
on our sensitivity tables, they could focus on improving
their dividend payout ratio. One thing I do believe our
valuation understated is the underfunded pensions.
Another way Delta could reverse the sell rating is by
providing consistently lower operating liabilities. In the
post-pandemic world, this is still likely to continue
based on the fact that many people are cancelling
passenger flights and Delta still has to pay for their
highly inefficient fuel obligations. One thing that was
understated by our model was the underfunded
pensions. Delta steal has to deal with underfunded
pensions today compared to other airlines. This could
potentially change its DCF and EP valuation.
Degree of Rivalry or Competition
Since the airline industry is highly competitive, there is
a high degree of competition as they all use different
strategies to convince consumers to fly with them and
eventually stay loyal.
Threat of Substitutes
The threat of substitutes is moderate because at times,
consumers may only have the option to fly where they
need to get to, other times if the destination is closer, the
consumer may turn to another form of transportation.
payable account was not present in the final three years
of Delta’s financials. We also did this with other line
items that were in the same situation as the taxes
payable account. This will give us a more accurate
outlook of how Delta is moving forward with their
balance sheet items.

Cost of Debt
We arrived at the cost of debt by using a risk-free rate
of 1.72%, an implied default premium of 11.67%, and a
marginal tax rate of 22.90%. The risk-free rate was
assumed by using the United States’ 10-year treasury
yield. The implied default premium was also found by
then subtracting the risk-free rate from the cost of debt.
The final piece, the marginal tax rate, we came to by
accounting for the domestic segments of Delta’s
business as well as their foreign segments.
Beta and Equity Risk Premium
This sensitivity table provided with a drastic range in
our company’s valuation. This is mainly because of the
fact that the beta is a key component in calculating
Delta’s WACC. The WACC is the number that can
skew the DCF and EP valuation the most. We took this
into consideration when analyzing this table, by
considering this to be a close range to our final valuation
range given the importance the beta has on the final
share price.
Cost of Equity
We arrived at the cost of equity by using a risk-free rate
of 1.72%, a beta of 1.45, and an equity risk premium of
5%. The risk-free was assumed the same way as our cost
of debt. The beta was taken from the average historical
beta for Delta Air Lines. The equity risk premium was
assumed by taking the difference between the average
market returns and the returns of Delta Air Lines stock
performance.
Risk Free Rate and CV Growth of NOPLAT
This sensitivity analysis had little effect on the final
valuation of our company. The overall NOPLAT
growth sees large increases up to .30% and only lightly
raises the valuation of the company. I believe this
comparison is a good benchmark showing that the
internal factors of the valuation were accurately
calculated.
Pre-tax Cost of Debt and WACC
The pre-tax cost of debt is especially important to
analyze because it is critical to the health of the airline
industry. However, Delta Air Lines has a WACC
indicates that it has a lower debt ratio meaning that the
Current Dividend Yield and Beta
This sensitivity analysis was an analysis that helped us
decide not to put much stock into the DDM model of
valuation. The dividend yield displayed here has an
extremely high amount of impact on the final stock
price and reaches either an unreasonably high price of
$51.64 or an unreasonably low price of $30.62. The
impact the dividend payout has on the final price
cannot be understated. These unreasonably low ranges
show that through the DDM model we will reach an
unreasonably low price due to Delta’s lacking dividend
payout.
WACC and Cost of Equity
In general, the WACC and Cost of Equity play an
important role in a company´s financial situation.
Because of the pandemic of COVID-19, WACC has
been slashed in Delta due to the fewer investors to invest
in airline industry. Because of the lower passenger, it
generates a relative lower revenue in this specific
sensitivity table. We consider this table to be of high
importance to the valuation because of the high amount
of equity in Delta’s capital structure.
The WACC considers of cost of debt and cost of equity.
It generally includes a company´s bonds and long-term
debt in the cost of debt and common and preferred stock
in the cost of equity. Comparing to Southwest Airlines
borrowing money from government bonds, Delta has
much less borrowing fonds from lenders. Furthermore,
due to the pandemic, the stock value does not have a
dramatically increase for Delta Airlines. Many people
tend to stay safety at home instead of travelling outside.
In general, the Airline industry cannot be able to attract
other investors to invest money. Therefore, the WACC
is gently slashed for Delta.
CV Growth of EPS and Pre-tax Cost of Debt
The EPS is critically important to the valuation. Delta
Air Lines EPS fell drastically in the final year of 2020
and revealed the large impact the pandemic had on the
company. As shown in the table the impact of the EPS
is shown by having extremely high and low valuation
with even the slightest changes. Pre-tax cost of debt did
not move the valuation much due to the low debt ratio
of Delta Air Lines. This kept the valuation consistent
across the table and strengthened our knowledge of the
effect of Delta’s EPS.
pre-tax cost of debt does not impact our valuation in a
large way. What this table does reveal is that the equity
going into our WACC is crucial to the valuation based
on the high changes in the valuation when we change
the WACC.
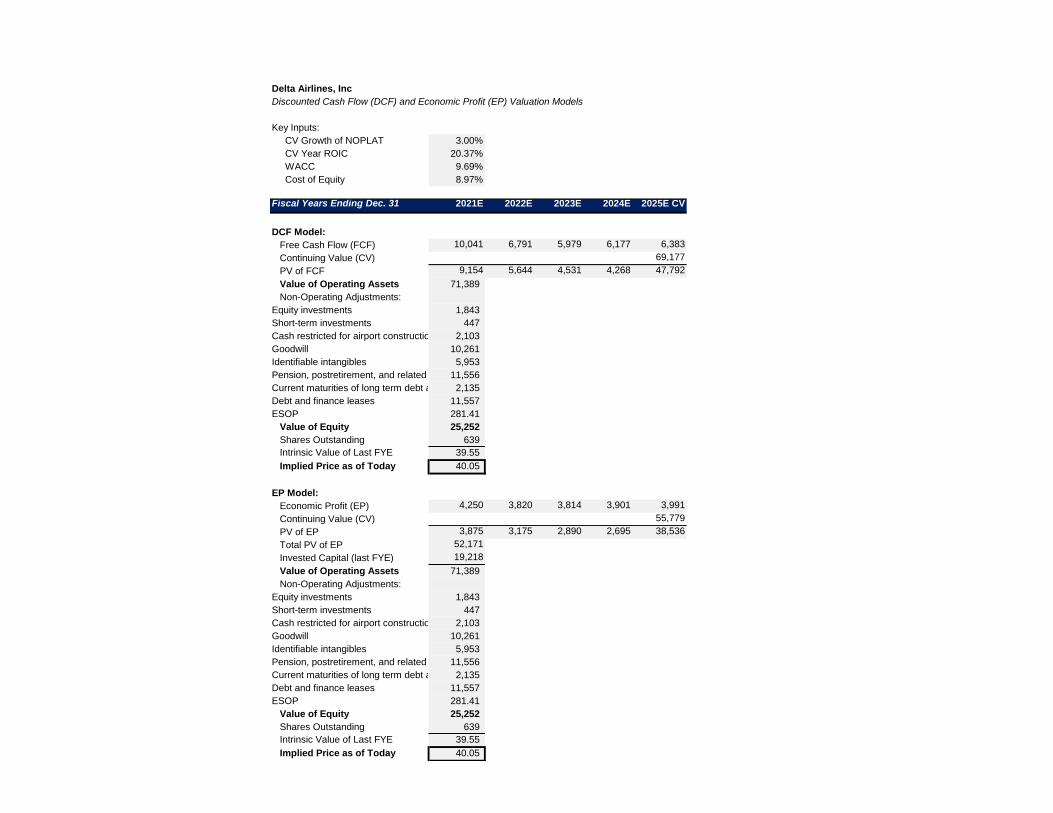
Delta Airlines, Inc
Discounted Cash Flow (DCF) and Economic Profit (EP) Valuation Models
Key Inputs:
CV Growth of NOPLAT 3.00%
CV Year ROIC 20.37%
WACC 9.69%
Cost of Equity 8.97%
Fiscal Years Ending Dec. 31 2021E 2022E 2023E 2024E 2025E CV
DCF Model:
Free Cash Flow (FCF) 10,041 6,791 5,979 6,177 6,383
Continuing Value (CV) 69,177
PV of FCF 9,154 5,644 4,531 4,268 47,792
Value of Operating Assets 71,389
Non-Operating Adjustments:
Equity investments 1,843
Short-term investments 447
Cash restricted for airport construction 2,103
Goodwill 10,261
Identifiable intangibles 5,953
Pension, postretirement, and related benefits11,556
Current maturities of long term debt and finance leases2,135
Debt and finance leases 11,557
ESOP 281.41
Value of Equity 25,252
Shares Outstanding 639
Intrinsic Value of Last FYE 39.55
Implied Price as of Today 40.05
EP Model:
Economic Profit (EP) 4,250 3,820 3,814 3,901 3,991
Continuing Value (CV) 55,779
PV of EP 3,875 3,175 2,890 2,695 38,536
Total PV of EP 52,171
Invested Capital (last FYE) 19,218
Value of Operating Assets 71,389
Non-Operating Adjustments:
Equity investments 1,843
Short-term investments 447
Cash restricted for airport construction 2,103
Goodwill 10,261
Identifiable intangibles 5,953
Pension, postretirement, and related benefits11,556
Current maturities of long term debt and finance leases2,135
Debt and finance leases 11,557
ESOP 281.41
Value of Equity 25,252
Shares Outstanding 639
Intrinsic Value of Last FYE 39.55
Implied Price as of Today 40.05
Delta Airlines, Inc
Dividend Discount Model (DDM) or Fundamental P/E Valuation Model
Fiscal Years Ending Dec. 31 2021E 2022E 2023E 2024E 2025E CV
EPS 5.47$ 5.63$ 5.79$ 5.96$ 6.14$
Key Assumptions
CV growth of EPS 3.00%
CV Year ROE 21.70%
Cost of Equity 8.97%
Future Cash Flows
P/E Multiple (CV Year) 57,185.90$
EPS (CV Year) 6.14$
Future Stock Price 351,098$
Dividends Per Share 0.95$ 0.98$ 1.01$ 1.04$
Discounted Cash Flows 4.49 3.80 3.21 2.72 2.80
Intrinsic Value as of Last FYE 17.02$ Implied Price as of Today 17.24$

Delta Airlines, Inc
Value Driver Estimation
Fiscal Years Ending Dec. 31 2018 2019 2020 2021E 2022E 2023E 2024E 2025E CV
NOPLAT:
Operating income 5,264 6,618 (12,469) 3,888 4,015 4,141 4,275 4,414
Operating lease interest 1,043 628 615 603 665 686 708 731 EBITA 6,307 7,246 (11,854) 4,491 4,680 4,827 4,983 5,145
Less: Adjusted Taxes:
Tax shield on interest expense (71) (69) (213) (175) (181) (186) (192) (199)
Tax shield on amortization of debt discount, net - - - (22) (23) (23) (24) (25)
Tax shield on loss on extinguishment of debt - - - (18) (18) (19) (19) (20)
Tax shield on impairments and equity losses (14) (14) (557) (3) (3) (3) (3) (3)
Tax shield on loss from investment - - (24) (3) (3) (3) (3) (3)
Tax on gains from investment 9 27 - - - - - -
Tax shield on miscellaneous, net 50 (40) 80 (20) (21) (22) (22) (23) Total Adjusted Taxes (127) (16) (825) (240) (248) (256) (264) (273)
Plus: Change in deferred taxes - 1,456 (1,456) 188 6 6 6 7 NOPLAT 6,434 8,717 (12,485) 4,919 4,934 5,089 5,254 5,424
Invested Capital (IC):
Operating Current Assets:
Normal cash 1,565 1,655 602 1,708 1,763 1,819 1,878 1,939
Accounts receivable 2,314 2,854 1,396 2,963 3,057 3,155 3,257 3,363
Fuel Inventory 592 730 377 803 829 855 883 912
Prepaid expenses 1,203 1,262 1,180 1,232 1,272 1,312 1,355 1,399
Expendable parts and supplies inventories 463 521 355 473 488 504 520 537
Total Operating Current Assets 6,137 7,022 3,910 7,179 7,408 7,646 7,893 8,149
Non Interest-Bearing Current Liabilities
Accounts payable 2,976 3,266 2,840 2,689 2,791 2,896 3,006 3,120
Air traffic liability 4,661 5,116 4,044 4,270 4,438 4,613 4,794 4,982
Accrued expenses 3,287 3,701 2,086 2,474 2,569 2,668 2,770 2,876
Deferred revenue 2,989 3,219 1,777 2,436 2,513 2,594 2,678 2,765
Income taxes payable - - - - - - - -
Fuel card obligation 1,075 736 1,100 456 471 486 502 518
Current maturities of operating leases 955 801 678 632 652 673 695 717
Noncurrent operating leases 5,801 5,294 5,713 1,948 2,042 2,140 2,241 2,347
Other accrued liabilities 1,117 1,078 1,670 1,618 1,670 1,723 1,779 1,837
Total Current Liabilities 22,861 23,211 19,908 16,523 17,146 17,793 18,464 19,161
Plus: Net PPE 28,335 31,310 26,529 29,248 30,182 31,151 32,157 33,201
Plus: Net Other Operating Assets
Capitalized PV of operating leases 4,687 4,589 4,502 4,964 5,122 5,286 5,457 5,634
Operating lease right-of-use assets 5,994 5,627 5,733 5,174 5,371 5,575 5,788 6,008
Other noncurrent assets 3,608 1,078 1,357 2,005 2,069 2,136 2,205 2,276
Net Other Operating Assets 14,289 11,294 11,592 12,142 12,562 12,997 13,449 13,919
Less: Other Operating Liabilities
Deferred revenue 3,652 3,509 5,405 2,707 2,809 2,916 3,026 3,141
Noncurrent air traffic liability - - 500 - - - - -
Other noncurrent liabilities 1,132 1,386 4,862 1,393 1,460 2,230 1,602 1,676
Net Other Operating Liabilites 3,652 3,509 5,905 2,707 2,809 2,916 3,026 3,141
Total Invested Capital (IC) 22,248 22,907 19,218 24,340 26,196 27,086 28,009 28,967
Free Cash Flow (FCF):
NOPLAT 6,434 8,717 (12,485) 4,919 4,934 5,089 5,254 5,424
Change in IC (3,444) 659 (3,689) 5,122 1,857 889 923 958
FCF 2,990 9,376 (16,174) 10,041 6,791 5,979 6,177 6,383
Return on Invested Capital (ROIC):
NOPLAT 6,434 8,717 (12,485) 4,919 4,934 5,089 5,254 5,424
Beginning IC 25,691 22,248 22,907 19,218 24,340 26,196 27,086 28,009
ROIC 25.04% 39.18% -54.50% 26.60% 21.27% 20.43% 20.40% 20.37%
Economic Profit (EP):
Beginning IC 25,691 22,248 22,907 19,218 24,340 26,196 27,086 28,009
x (ROIC - WACC) 15.36% 29.50% -64.19% 16.91% 11.58% 10.74% 10.71% 10.68%
EP 3,945 6,562 (14,704) 4,250 3,820 3,814 3,901 3,991
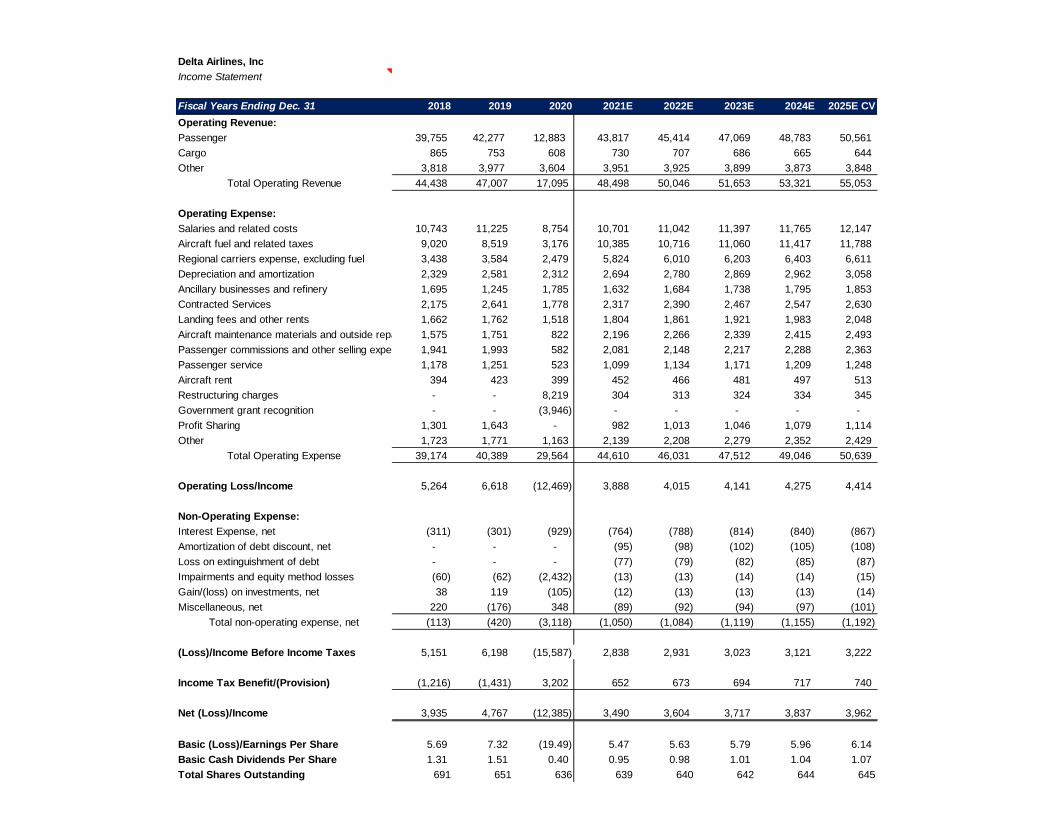
Delta Airlines, Inc
Income Statement
Fiscal Years Ending Dec. 31 2018 2019 2020 2021E 2022E 2023E 2024E 2025E CV
Operating Revenue:
Passenger 39,755 42,277 12,883 43,817 45,414 47,069 48,783 50,561
Cargo 865 753 608 730 707 686 665 644
Other 3,818 3,977 3,604 3,951 3,925 3,899 3,873 3,848
Total Operating Revenue 44,438 47,007 17,095 48,498 50,046 51,653 53,321 55,053
Operating Expense:
Salaries and related costs 10,743 11,225 8,754 10,701 11,042 11,397 11,765 12,147
Aircraft fuel and related taxes 9,020 8,519 3,176 10,385 10,716 11,060 11,417 11,788
Regional carriers expense, excluding fuel 3,438 3,584 2,479 5,824 6,010 6,203 6,403 6,611
Depreciation and amortization 2,329 2,581 2,312 2,694 2,780 2,869 2,962 3,058
Ancillary businesses and refinery 1,695 1,245 1,785 1,632 1,684 1,738 1,795 1,853
Contracted Services 2,175 2,641 1,778 2,317 2,390 2,467 2,547 2,630
Landing fees and other rents 1,662 1,762 1,518 1,804 1,861 1,921 1,983 2,048
Aircraft maintenance materials and outside repairs 1,575 1,751 822 2,196 2,266 2,339 2,415 2,493
Passenger commissions and other selling expenses 1,941 1,993 582 2,081 2,148 2,217 2,288 2,363
Passenger service 1,178 1,251 523 1,099 1,134 1,171 1,209 1,248
Aircraft rent 394 423 399 452 466 481 497 513
Restructuring charges - - 8,219 304 313 324 334 345
Government grant recognition - - (3,946) - - - - -
Profit Sharing 1,301 1,643 - 982 1,013 1,046 1,079 1,114
Other 1,723 1,771 1,163 2,139 2,208 2,279 2,352 2,429
Total Operating Expense 39,174 40,389 29,564 44,610 46,031 47,512 49,046 50,639
Operating Loss/Income 5,264 6,618 (12,469) 3,888 4,015 4,141 4,275 4,414
Non-Operating Expense:
Interest Expense, net (311) (301) (929) (764) (788) (814) (840) (867)
Amortization of debt discount, net - - - (95) (98) (102) (105) (108)
Loss on extinguishment of debt - - - (77) (79) (82) (85) (87)
Impairments and equity method losses (60) (62) (2,432) (13) (13) (14) (14) (15)
Gain/(loss) on investments, net 38 119 (105) (12) (13) (13) (13) (14)
Miscellaneous, net 220 (176) 348 (89) (92) (94) (97) (101)
Total non-operating expense, net (113) (420) (3,118) (1,050) (1,084) (1,119) (1,155) (1,192)
(Loss)/Income Before Income Taxes 5,151 6,198 (15,587) 2,838 2,931 3,023 3,121 3,222
Income Tax Benefit/(Provision) (1,216) (1,431) 3,202 652 673 694 717 740
Net (Loss)/Income 3,935 4,767 (12,385) 3,490 3,604 3,717 3,837 3,962
Basic (Loss)/Earnings Per Share 5.69 7.32 (19.49) 5.47 5.63 5.79 5.96 6.14
Basic Cash Dividends Per Share 1.31 1.51 0.40 0.95 0.98 1.01 1.04 1.07
Total Shares Outstanding 691 651 636 639 640 642 644 645

Delta Airlines, Inc
Balance Sheet
Fiscal Years Ending Dec. 31 2018 2019 2020 2021E 2022E 2023E 2024E 2025E CV
Assets
Current Assets:
Cash and cash equivalents 1,565 2,882 8,307 2,509 2,589 2,672 2,758 2,848
Short-term investments 203 - 5,789 447 461 476 491 507
Restricted cash - - - - - - - -
Accounts receivable 2,314 2,854 1,396 2,963 3,057 3,155 3,257 3,363
Fuel Inventory 592 730 377 803 829 855 883 912
Expendable parts and supplies inventories 463 521 355 473 488 504 520 537
Prepaid expenses and other 1,203 1,262 1,180 1,232 1,272 1,312 1,355 1,399
Hedge Derivative Asset - - - - - - - -
Hedge Margin Receivable - - - - - - - -
Total current assets 6,340 8,249 17,404 8,427 8,696 8,975 9,265 9,566
Noncurrent Assets
Property, plant, and equipment 28,335 31,310 26,529 29,248 30,182 31,151 32,157 33,201
Operating lease right-of-use assets 5,994 5,627 5,733 5,174 5,371 5,575 5,788 6,008
Goodwill 9,781 9,781 9,753 10,261 11,104 11,461 11,831 12,215
Identifiable intangibles 4,830 5,163 6,011 5,453 6,143 6,340 6,545 6,758
Cash restricted for airport construction 1,136 636 1,556 2,103 2,171 2,240 2,313 2,388
Equity investments - 2,568 1,665 1,843 1,902 1,963 2,027 2,092
Deferred income taxes, net 242 120 1,988 2,676 2,762 2,850 2,942 3,038
Other noncurrent assets 3,608 1,078 1,357 2,005 2,069 2,136 2,205 2,276
Total noncurrent assets 53,926 56,283 54,592 58,764 61,703 63,717 65,807 67,976
Total Assets 60,266 64,532 71,996 69,190 71,399 73,692 76,072 78,542
Liabilities and Stockholders' Equity
Current Liabilities:
Current maturities of long term debt and finance leases 1,518 2,287 1,732 1,937 1,999 2,063 2,130 2,199
Current maturities of operating leases 955 801 678 632 652 673 695 717
Air traffic liability 4,661 5,116 4,044 4,270 4,438 4,613 4,794 4,982
Accounts payable 2,976 3,266 2,840 2,689 2,791 2,896 3,006 3,120
Accrued Salaries and related benefits 3,287 3,701 2,086 2,474 2,569 2,668 2,770 2,876
Loyalty program deferred revenue 2,989 3,219 1,777 2,436 2,513 2,594 2,678 2,765
Taxes Payable - - - - - - - -
Fuel card obligation 1,075 736 1,100 456 471 486 502 518
Hedge Derivative Liability - - - - - - - -
Other accrued liabilities 1,117 1,078 1,670 1,618 1,670 1,723 1,779 1,837
Total current liabilities 18,578 20,204 15,927 16,512 17,103 17,716 18,353 19,014
Noncurrent Liabilities: -
Debt and finance leases 8,253 8,873 27,425 9,605 9,943 10,295 10,659 11,038
Noncurrent air traffic liability - - 500 - - - - -
Pension, postretirement, and related benefits 9,163 8,452 10,630 11,556 12,053 12,568 13,104 13,659
Loyalty program deferred revenue 3,652 3,509 5,405 2,707 2,809 2,916 3,026 3,141
Noncurrent operating leases 5,801 5,294 5,713 1,948 2,042 2,140 2,241 2,347
Deferred Income taxes, net - 1,456 - 188 194 200 206 213
Other noncurrent liabilities 1,132 1,386 4,862 1,393 1,460 2,230 1,602 1,676
Total noncurrent liabilities 28,001 28,970 54,535 27,398 28,502 30,348 30,839 32,074
Commitments and Contingencies
Stockholders' Equity:
Common stock at par value - - - - - - - -
Additional paid-in-capital 11,671 11,129 11,259 14,628 15,095 15,580 16,083 16,605
Retained earnings (deficit) 10,039 12,454 (428) 10,287 10,616 10,956 11,310 11,678
Accumulated comprehensive loss (7,825) (7,989) (9,038) (8,528) (8,800) (9,083) (9,376) (9,680)
Treasury stock (198) (236) (259) (306) (316) (326) (337) (348)
Total stockholders' equity 13,687 15,358 1,534 16,081 16,594 17,127 17,680 18,254
Total liabilities and stockholders' equity 60,266 64,532 71,996 69,190 71,399 73,692 76,072 78,542

Delta Airlines, Inc
Forecasted Cash Flow Statement
Source: FactSetFiscal Years Ending Dec. 31 2021E 2022E 2023E 2024E 2025E CV
Net Income 3,490 3,604 3,717 3,837 3,962
Adjustments to reconcile net income to cash from operating activities:
Depreciation and amortization 2,694 2,780 2,869 2,962 3,058
Changes in working capital accounts:
Restricted cash - - - - -
Accounts receivable (1,567) (95) (98) (102) (106)
Fuel inventory (426) (26) (27) (28) (29)
Expendable parts and supplies inventory (118) (15) (16) (16) (17)
Prepaid expenses and other (52) (39) (41) (42) (44)
Pension, postretirement, and related benefits (926) (497) (515) (535) (555)
Air traffic liability 226 168 175 181 188
Accounts payable (151) 102 106 110 114
Accrued Salaries and related benefits 388 95 99 102 106
Loyalty program deferred revenue 659 78 81 84 87
Taxes Payable - - - - -
Fuel card obligation (644) 15 15 16 16
Non current air traffic liability (500) - - - -
Deferred taxes (188) (6) (6) (6) (7)
Noncurrent operating leases 3,765 (94) (98) (101) (105)
Current maturities of operating leases (46) 20 21 22 23
Other accrued liabilities (52) 52 54 56 58
Net cash from operating activities 6,551 6,142 6,335 6,538 6,749
Change in cash from investing activities:
Change in short-term investments 5,342 (14) (15) (15) (16)
Capital expenditures (change in gross ppe) (25) 1,846 1,900 1,956 2,014
Capitalization of intangible assets 558 (690) (197) (205) (213)
Business acquisitions (change in goodwill) (508) (843) (357) (370) (384)
Long-term loyalty program deferred revenue (2,698) 102 106 110 115
Other noncurrent assets (648) (64) (66) (69) (72)
Other noncurrent liabilities (3,469) 67 769 (628) 75
Net cash from investing activities (1,448) 404 2,141 779 1,519
Cash from financing activities:
Hedge derivative asset - - - - -
Hedge margin receivable - - - - -
Common stock at par value - - - - -
Additional paid-in-capital (3,369) (467) (485) (503) (522)
Retained earnings (deficit) 10,715 328 341 354 367
Accumulated comprehensive loss 510 (272) (283) (293) (304)
Treasury stock (47) (10) (10) (11) (11)
Hedge Derivative Liability - - - - -
Equity investments (178) (59) (61) (63) (66)
Current maturities of long term debt and finance leases 205 62 64 67 69
Net cash from financing activities 7,836 (418) (433) (450) (467)
Increase/decrease in cash/cash equivalents 12,939 6,128 8,042 6,867 7,801
Cash/cash equivalents beginning of the year 8,307 2,509 2,589 2,672 2,758
End of the year cash balance 21,246 8,637 10,631 9,539 10,559
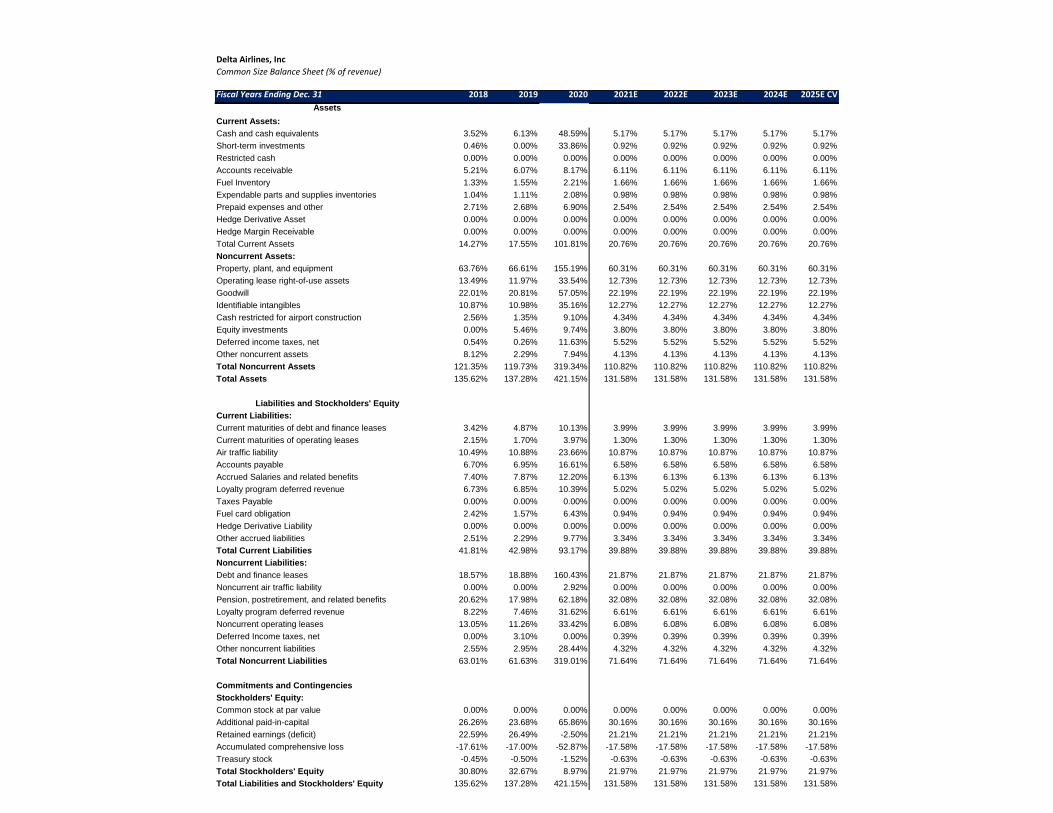
Delta Airlines, Inc
Common Size Balance Sheet (% of revenue)
Fiscal Years Ending Dec. 31 2018 2019 2020 2021E 2022E 2023E 2024E 2025E CV
Assets
Current Assets:
Cash and cash equivalents 3.52% 6.13% 48.59% 5.17% 5.17% 5.17% 5.17% 5.17%
Short-term investments 0.46% 0.00% 33.86% 0.92% 0.92% 0.92% 0.92% 0.92%
Restricted cash 0.00% 0.00% 0.00% 0.00% 0.00% 0.00% 0.00% 0.00%
Accounts receivable 5.21% 6.07% 8.17% 6.11% 6.11% 6.11% 6.11% 6.11%
Fuel Inventory 1.33% 1.55% 2.21% 1.66% 1.66% 1.66% 1.66% 1.66%
Expendable parts and supplies inventories 1.04% 1.11% 2.08% 0.98% 0.98% 0.98% 0.98% 0.98%
Prepaid expenses and other 2.71% 2.68% 6.90% 2.54% 2.54% 2.54% 2.54% 2.54%
Hedge Derivative Asset 0.00% 0.00% 0.00% 0.00% 0.00% 0.00% 0.00% 0.00%
Hedge Margin Receivable 0.00% 0.00% 0.00% 0.00% 0.00% 0.00% 0.00% 0.00%
Total Current Assets 14.27% 17.55% 101.81% 20.76% 20.76% 20.76% 20.76% 20.76%
Noncurrent Assets:
Property, plant, and equipment 63.76% 66.61% 155.19% 60.31% 60.31% 60.31% 60.31% 60.31%
Operating lease right-of-use assets 13.49% 11.97% 33.54% 12.73% 12.73% 12.73% 12.73% 12.73%
Goodwill 22.01% 20.81% 57.05% 22.19% 22.19% 22.19% 22.19% 22.19%
Identifiable intangibles 10.87% 10.98% 35.16% 12.27% 12.27% 12.27% 12.27% 12.27%
Cash restricted for airport construction 2.56% 1.35% 9.10% 4.34% 4.34% 4.34% 4.34% 4.34%
Equity investments 0.00% 5.46% 9.74% 3.80% 3.80% 3.80% 3.80% 3.80%
Deferred income taxes, net 0.54% 0.26% 11.63% 5.52% 5.52% 5.52% 5.52% 5.52%
Other noncurrent assets 8.12% 2.29% 7.94% 4.13% 4.13% 4.13% 4.13% 4.13%
Total Noncurrent Assets 121.35% 119.73% 319.34% 110.82% 110.82% 110.82% 110.82% 110.82%
Total Assets 135.62% 137.28% 421.15% 131.58% 131.58% 131.58% 131.58% 131.58%
Liabilities and Stockholders' Equity
Current Liabilities:
Current maturities of debt and finance leases 3.42% 4.87% 10.13% 3.99% 3.99% 3.99% 3.99% 3.99%
Current maturities of operating leases 2.15% 1.70% 3.97% 1.30% 1.30% 1.30% 1.30% 1.30%
Air traffic liability 10.49% 10.88% 23.66% 10.87% 10.87% 10.87% 10.87% 10.87%
Accounts payable 6.70% 6.95% 16.61% 6.58% 6.58% 6.58% 6.58% 6.58%
Accrued Salaries and related benefits 7.40% 7.87% 12.20% 6.13% 6.13% 6.13% 6.13% 6.13%
Loyalty program deferred revenue 6.73% 6.85% 10.39% 5.02% 5.02% 5.02% 5.02% 5.02%
Taxes Payable 0.00% 0.00% 0.00% 0.00% 0.00% 0.00% 0.00% 0.00%
Fuel card obligation 2.42% 1.57% 6.43% 0.94% 0.94% 0.94% 0.94% 0.94%
Hedge Derivative Liability 0.00% 0.00% 0.00% 0.00% 0.00% 0.00% 0.00% 0.00%
Other accrued liabilities 2.51% 2.29% 9.77% 3.34% 3.34% 3.34% 3.34% 3.34%
Total Current Liabilities 41.81% 42.98% 93.17% 39.88% 39.88% 39.88% 39.88% 39.88%
Noncurrent Liabilities:
Debt and finance leases 18.57% 18.88% 160.43% 21.87% 21.87% 21.87% 21.87% 21.87%
Noncurrent air traffic liability 0.00% 0.00% 2.92% 0.00% 0.00% 0.00% 0.00% 0.00%
Pension, postretirement, and related benefits 20.62% 17.98% 62.18% 32.08% 32.08% 32.08% 32.08% 32.08%
Loyalty program deferred revenue 8.22% 7.46% 31.62% 6.61% 6.61% 6.61% 6.61% 6.61%
Noncurrent operating leases 13.05% 11.26% 33.42% 6.08% 6.08% 6.08% 6.08% 6.08%
Deferred Income taxes, net 0.00% 3.10% 0.00% 0.39% 0.39% 0.39% 0.39% 0.39%
Other noncurrent liabilities 2.55% 2.95% 28.44% 4.32% 4.32% 4.32% 4.32% 4.32%
Total Noncurrent Liabilities 63.01% 61.63% 319.01% 71.64% 71.64% 71.64% 71.64% 71.64%
Commitments and Contingencies
Stockholders' Equity:
Common stock at par value 0.00% 0.00% 0.00% 0.00% 0.00% 0.00% 0.00% 0.00%
Additional paid-in-capital 26.26% 23.68% 65.86% 30.16% 30.16% 30.16% 30.16% 30.16%
Retained earnings (deficit) 22.59% 26.49% -2.50% 21.21% 21.21% 21.21% 21.21% 21.21%
Accumulated comprehensive loss -17.61% -17.00% -52.87% -17.58% -17.58% -17.58% -17.58% -17.58%
Treasury stock -0.45% -0.50% -1.52% -0.63% -0.63% -0.63% -0.63% -0.63%
Total Stockholders' Equity 30.80% 32.67% 8.97% 21.97% 21.97% 21.97% 21.97% 21.97%
Total Liabilities and Stockholders' Equity 135.62% 137.28% 421.15% 131.58% 131.58% 131.58% 131.58% 131.58%

Delta Airlines, Inc
Common Size Income Statement
Fiscal Years Ending Dec. 31 2018 2019 2020 2021E 2022E 2023E 2024E 2025E CV
Operating Revenue:
Passenger 89.46% 89.94% 75.36% 90.35% 90.74% 91.12% 91.49% 91.84%
Cargo 1.95% 1.60% 3.56% 1.50% 1.41% 1.33% 1.25% 1.17%
Other 8.59% 8.46% 21.08% 8.15% 7.84% 7.55% 7.26% 6.99%
Total Operating Revenue 100.00% 100.00% 100.00% 100.00% 100.00% 100.00% 100.00% 100.00%
Operating Expense:
Salaries and related costs 24.18% 23.88% 51.21% 21.26% 21.26% 21.26% 21.26% 0.00%
Aircraft fuel and related taxes 20.30% 18.12% 18.58% 21.41% 21.41% 21.41% 21.41% 21.41%
Regional carriers expense, excluding fuel 7.74% 7.62% 14.50% 12.01% 12.01% 12.01% 12.01% 12.01%
Depreciation and amortization 5.24% 5.49% 13.52% 5.55% 5.55% 5.55% 5.55% 5.55%
Ancillary businesses and refinery 3.81% 2.65% 10.44% 3.37% 3.37% 3.37% 3.37% 3.37%
Contracted Services 4.89% 5.62% 10.40% 4.78% 4.78% 4.78% 4.78% 4.78%
Landing fees and other rents 3.74% 3.75% 8.88% 3.72% 3.72% 3.72% 3.72% 3.72%
Aircraft maintenance materials and outside repairs 3.54% 3.72% 4.81% 4.53% 4.53% 4.53% 4.53% 4.53%
Passenger commissions and other selling expenses 4.37% 4.24% 3.40% 4.29% 4.29% 4.29% 4.29% 4.29%
Passenger service 2.65% 2.66% 3.06% 2.27% 2.27% 2.27% 2.27% 2.27%
Aircraft rent 0.89% 0.90% 2.33% 0.93% 0.93% 0.93% 0.93% 0.93%
Restructuring charges 0.00% 0.00% 48.08% 0.63% 0.63% 0.63% 0.63% 0.63%
Government grant recognition 0.00% 0.00% -23.08% 0.00% 0.00% 0.00% 0.00% 0.00%
Profit Sharing 2.93% 3.50% 0.00% 2.02% 2.02% 2.02% 2.02% 2.02%
Other 3.88% 3.77% 6.80% 4.41% 4.41% 4.41% 4.41% 4.41%
Total Operating Expense 88.15% 85.92% 172.94% 89.01% 89.01% 89.01% 89.01% 89.01%
Operating Loss/Income 11.85% 14.08% -72.94% 11.01% 11.01% 11.01% 11.01% 11.01%
Non-Operating Expense: 0.00% 0.00% 0.00%
Interest Expense, net -0.70% -0.64% -5.43% -1.58% -1.58% -1.58% -1.58% -1.58%
Amortization of debt discount, net 0.00% 0.00% 0.00% -0.20% -0.20% -0.20% -0.20% -0.20%
Loss on extinguishment of debt 0.00% 0.00% 0.00% -0.16% -0.16% -0.16% -0.16% -0.16%
Impairments and equity method losses -0.14% -0.13% -14.23% -0.03% -0.03% -0.03% -0.03% -0.03%
Gain/(loss) on investments, net 0.09% 0.25% -0.61% -0.03% -0.03% -0.03% -0.03% -0.03%
Miscellaneous, net 0.50% -0.37% 2.04% -0.18% -0.18% -0.18% -0.18% -0.18%
Total non-operating expense, net -0.25% -0.89% -18.24% -3.56% -3.56% -3.56% -3.56% -3.56%
(Loss)/Income Before Income Taxes 11.59% 13.19% -91.18% 8.87% 8.87% 8.87% 8.87% 8.87%
Income Tax Benefit/(Provision) -2.74% -3.04% 18.73% 1.34% 1.34% 1.34% 1.34% 1.34%
Net (Loss)/Income 8.86% 10.14% -72.45% 8.55% 8.55% 8.55% 8.55% 8.55%
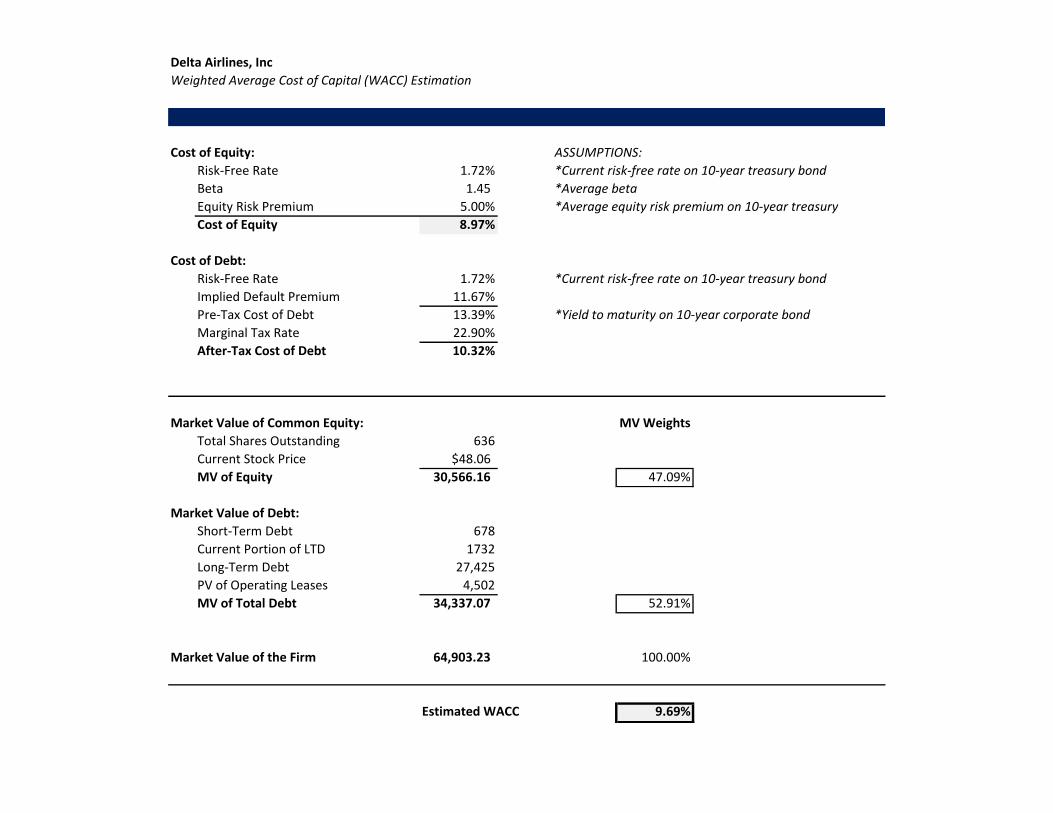
Delta Airlines, Inc
Weighted Average Cost of Capital (WACC) Estimation
Cost of Equity: ASSUMPTIONS:
Risk-Free Rate 1.72% *Current risk-free rate on 10-year treasury bond
Beta 1.45 *Average beta
Equity Risk Premium 5.00% *Average equity risk premium on 10-year treasury
Cost of Equity 8.97%
Cost of Debt:
Risk-Free Rate 1.72% *Current risk-free rate on 10-year treasury bond
Implied Default Premium 11.67%
Pre-Tax Cost of Debt 13.39% *Yield to maturity on 10-year corporate bond
Marginal Tax Rate 22.90%
After-Tax Cost of Debt 10.32%
Market Value of Common Equity: MV Weights
Total Shares Outstanding 636
Current Stock Price $48.06
MV of Equity 30,566.16 47.09%
Market Value of Debt:
Short-Term Debt 678
Current Portion of LTD 1732
Long-Term Debt 27,425
PV of Operating Leases 4,502
MV of Total Debt 34,337.07 52.91%
Market Value of the Firm 64,903.23 100.00%
Estimated WACC 9.69%
Delta Airlines, Inc
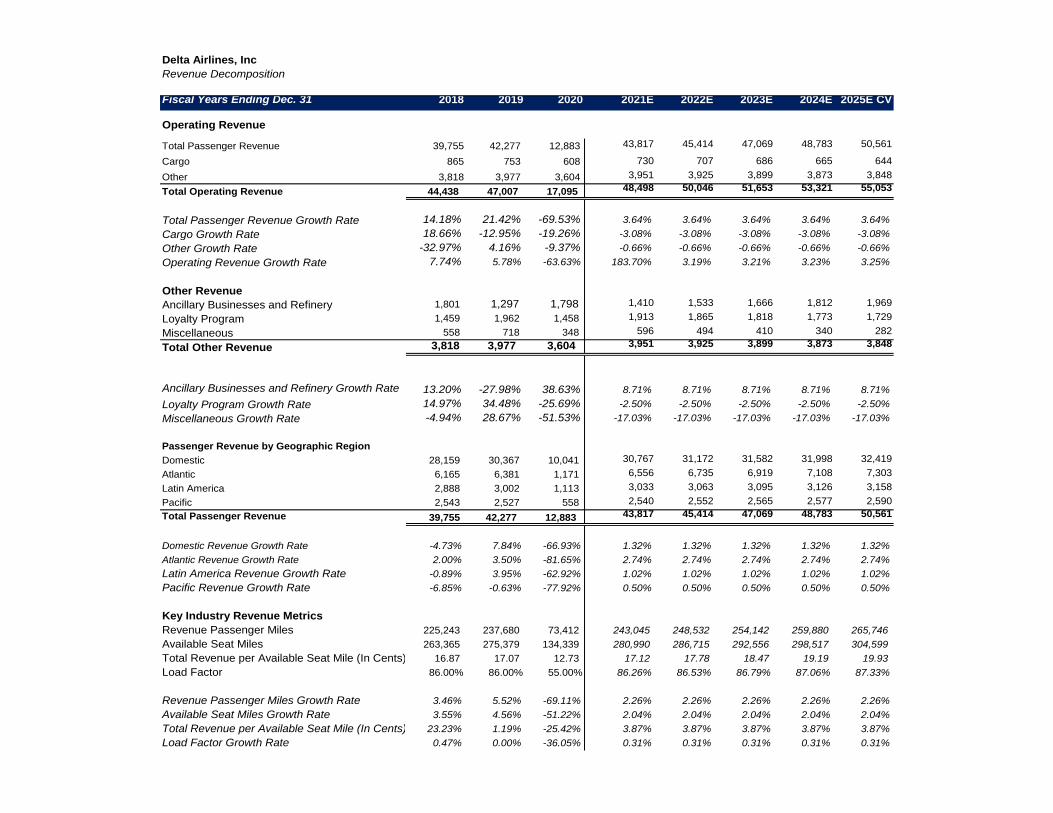
Revenue Decomposition
Fiscal Years Ending Dec. 31 2018 2019 2020 2021E 2022E 2023E 2024E 2025E CV
Operating Revenue
Total Passenger Revenue 39,755 42,277 12,883 43,817 45,414 47,069 48,783 50,561
Cargo 865 753 608 730 707 686 665 644
Other 3,818 3,977 3,604 3,951 3,925 3,899 3,873 3,848
Total Operating Revenue 44,438 47,007 17,095 48,498 50,046 51,653 53,321 55,053
Total Passenger Revenue Growth Rate 14.18% 21.42% -69.53% 3.64% 3.64% 3.64% 3.64% 3.64%
Cargo Growth Rate 18.66% -12.95% -19.26% -3.08% -3.08% -3.08% -3.08% -3.08%
Other Growth Rate -32.97% 4.16% -9.37% -0.66% -0.66% -0.66% -0.66% -0.66%
Operating Revenue Growth Rate 7.74% 5.78% -63.63% 183.70% 3.19% 3.21% 3.23% 3.25%
Other Revenue
Ancillary Businesses and Refinery 1,801 1,297 1,798 1,410 1,533 1,666 1,812 1,969
Loyalty Program 1,459 1,962 1,458 1,913 1,865 1,818 1,773 1,729
Miscellaneous 558 718 348 596 494 410 340 282
Total Other Revenue 3,818 3,977 3,604 3,951 3,925 3,899 3,873 3,848
Ancillary Businesses and Refinery Growth Rate 13.20% -27.98% 38.63% 8.71% 8.71% 8.71% 8.71% 8.71%
Loyalty Program Growth Rate 14.97% 34.48% -25.69% -2.50% -2.50% -2.50% -2.50% -2.50%
Miscellaneous Growth Rate -4.94% 28.67% -51.53% -17.03% -17.03% -17.03% -17.03% -17.03%
Passenger Revenue by Geographic Region
Domestic 28,159 30,367 10,041 30,767 31,172 31,582 31,998 32,419
Atlantic 6,165 6,381 1,171 6,556 6,735 6,919 7,108 7,303
Latin America 2,888 3,002 1,113 3,033 3,063 3,095 3,126 3,158
Pacific 2,543 2,527 558 2,540 2,552 2,565 2,577 2,590
Total Passenger Revenue 39,755 42,277 12,883 43,817 45,414 47,069 48,783 50,561
Domestic Revenue Growth Rate -4.73% 7.84% -66.93% 1.32% 1.32% 1.32% 1.32% 1.32%
Atlantic Revenue Growth Rate 2.00% 3.50% -81.65% 2.74% 2.74% 2.74% 2.74% 2.74%
Latin America Revenue Growth Rate -0.89% 3.95% -62.92% 1.02% 1.02% 1.02% 1.02% 1.02%
Pacific Revenue Growth Rate -6.85% -0.63% -77.92% 0.50% 0.50% 0.50% 0.50% 0.50%
Key Industry Revenue Metrics
Revenue Passenger Miles 225,243 237,680 73,412 243,045 248,532 254,142 259,880 265,746
Available Seat Miles 263,365 275,379 134,339 280,990 286,715 292,556 298,517 304,599
Total Revenue per Available Seat Mile (In Cents) 16.87 17.07 12.73 17.12 17.78 18.47 19.19 19.93
Load Factor 86.00% 86.00% 55.00% 86.26% 86.53% 86.79% 87.06% 87.33%
Revenue Passenger Miles Growth Rate 3.46% 5.52% -69.11% 2.26% 2.26% 2.26% 2.26% 2.26%
Available Seat Miles Growth Rate 3.55% 4.56% -51.22% 2.04% 2.04% 2.04% 2.04% 2.04%
Total Revenue per Available Seat Mile (In Cents) Growth Rate23.23% 1.19% -25.42% 3.87% 3.87% 3.87% 3.87% 3.87%
Load Factor Growth Rate 0.47% 0.00% -36.05% 0.31% 0.31% 0.31% 0.31% 0.31%
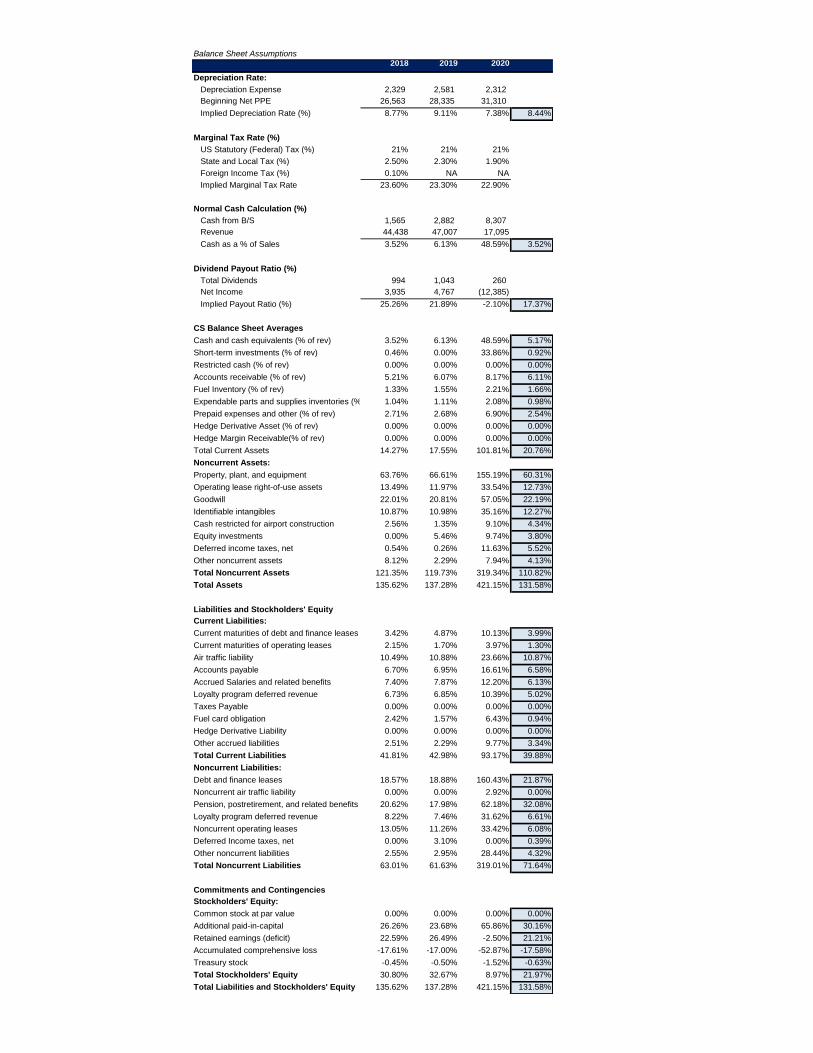
Balance Sheet Assumptions2018 2019 2020
Depreciation Rate:
Depreciation Expense 2,329 2,581 2,312
Beginning Net PPE 26,563 28,335 31,310
Implied Depreciation Rate (%) 8.77% 9.11% 7.38% 8.44%
Marginal Tax Rate (%)
US Statutory (Federal) Tax (%) 21% 21% 21%
State and Local Tax (%) 2.50% 2.30% 1.90%
Foreign Income Tax (%) 0.10% NA NA
Implied Marginal Tax Rate 23.60% 23.30% 22.90%
Normal Cash Calculation (%)
Cash from B/S 1,565 2,882 8,307
Revenue 44,438 47,007 17,095
Cash as a % of Sales 3.52% 6.13% 48.59% 3.52%
Dividend Payout Ratio (%)
Total Dividends 994 1,043 260
Net Income 3,935 4,767 (12,385)
Implied Payout Ratio (%) 25.26% 21.89% -2.10% 17.37%
CS Balance Sheet Averages
3.52% 6.13% 48.59% 5.17%
Short-term investments (% of rev) 0.46% 0.00% 33.86% 0.92%
Restricted cash (% of rev) 0.00% 0.00% 0.00% 0.00%
Accounts receivable (% of rev) 5.21% 6.07% 8.17% 6.11%
Fuel Inventory (% of rev) 1.33% 1.55% 2.21% 1.66%
Expendable parts and supplies inventories (% of rev)1.04% 1.11% 2.08% 0.98%
Prepaid expenses and other (% of rev) 2.71% 2.68% 6.90% 2.54%
Hedge Derivative Asset (% of rev) 0.00% 0.00% 0.00% 0.00%
Hedge Margin Receivable(% of rev) 0.00% 0.00% 0.00% 0.00%
Total Current Assets 14.27% 17.55% 101.81% 20.76%
Noncurrent Assets:
Property, plant, and equipment 63.76% 66.61% 155.19% 60.31%
Operating lease right-of-use assets 13.49% 11.97% 33.54% 12.73%
Goodwill 22.01% 20.81% 57.05% 22.19%
Identifiable intangibles 10.87% 10.98% 35.16% 12.27%
Cash restricted for airport construction 2.56% 1.35% 9.10% 4.34%
Equity investments 0.00% 5.46% 9.74% 3.80%
Deferred income taxes, net 0.54% 0.26% 11.63% 5.52%
Other noncurrent assets 8.12% 2.29% 7.94% 4.13%
Total Noncurrent Assets 121.35% 119.73% 319.34% 110.82%
Total Assets 135.62% 137.28% 421.15% 131.58%
Liabilities and Stockholders' Equity
Current Liabilities:
Current maturities of debt and finance leases 3.42% 4.87% 10.13% 3.99%
Current maturities of operating leases 2.15% 1.70% 3.97% 1.30%
Air traffic liability 10.49% 10.88% 23.66% 10.87%
Accounts payable 6.70% 6.95% 16.61% 6.58%
Accrued Salaries and related benefits 7.40% 7.87% 12.20% 6.13%
Loyalty program deferred revenue 6.73% 6.85% 10.39% 5.02%
Taxes Payable 0.00% 0.00% 0.00% 0.00%
Fuel card obligation 2.42% 1.57% 6.43% 0.94%
Hedge Derivative Liability 0.00% 0.00% 0.00% 0.00%
Other accrued liabilities 2.51% 2.29% 9.77% 3.34%
Total Current Liabilities 41.81% 42.98% 93.17% 39.88%
Noncurrent Liabilities:
Debt and finance leases 18.57% 18.88% 160.43% 21.87%
Noncurrent air traffic liability 0.00% 0.00% 2.92% 0.00%
Pension, postretirement, and related benefits 20.62% 17.98% 62.18% 32.08%
Loyalty program deferred revenue 8.22% 7.46% 31.62% 6.61%
Noncurrent operating leases 13.05% 11.26% 33.42% 6.08%
Deferred Income taxes, net 0.00% 3.10% 0.00% 0.39%
Other noncurrent liabilities 2.55% 2.95% 28.44% 4.32%
Total Noncurrent Liabilities 63.01% 61.63% 319.01% 71.64%
Commitments and Contingencies
Stockholders' Equity:
Common stock at par value 0.00% 0.00% 0.00% 0.00%
Additional paid-in-capital 26.26% 23.68% 65.86% 30.16%
Retained earnings (deficit) 22.59% 26.49% -2.50% 21.21%
Accumulated comprehensive loss -17.61% -17.00% -52.87% -17.58%
Treasury stock -0.45% -0.50% -1.52% -0.63%
Total Stockholders' Equity 30.80% 32.67% 8.97% 21.97%
Total Liabilities and Stockholders' Equity 135.62% 137.28% 421.15% 131.58%
Cash and cash equivalents (% of rev)
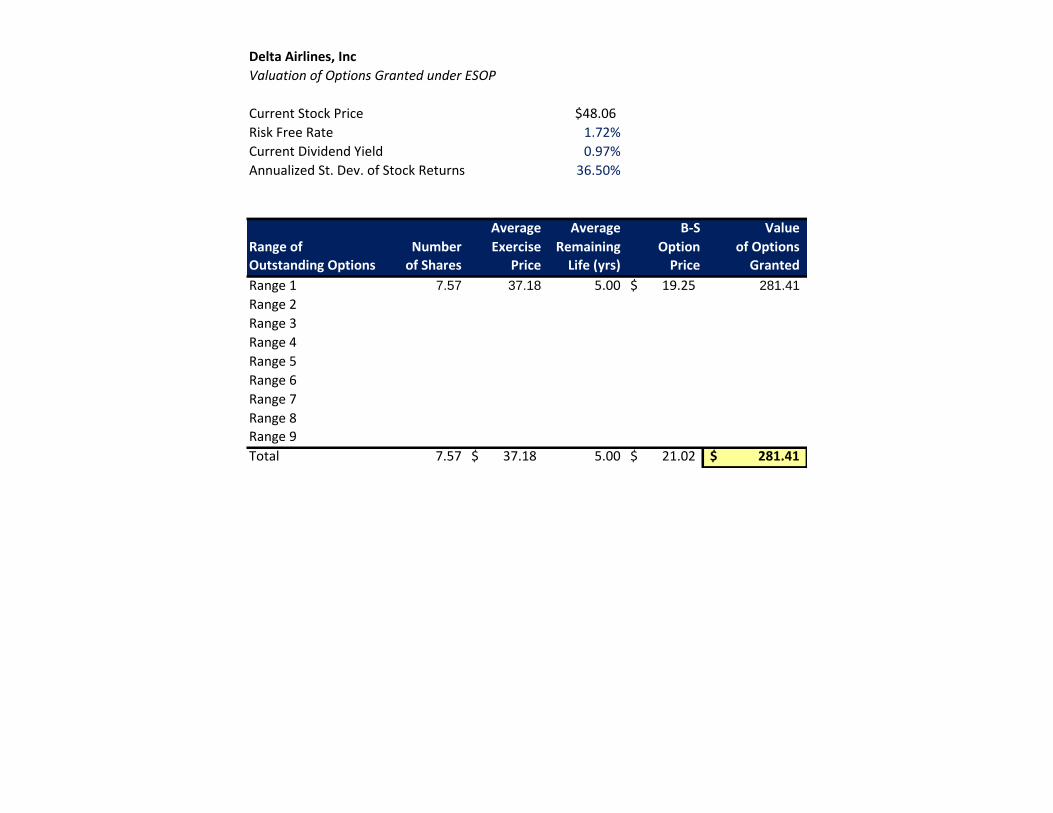
Delta Airlines, Inc
Valuation of Options Granted under ESOP
Current Stock Price $48.06
Risk Free Rate 1.72%
Current Dividend Yield 0.97%
Annualized St. Dev. of Stock Returns 36.50%
Average Average B-S Value
Range of Number Exercise Remaining Option of Options
Outstanding Options of Shares Price Life (yrs) Price Granted
Range 1 7.57 37.18 5.00 19.25$ 281.41
Range 2
Range 3
Range 4
Range 5
Range 6
Range 7
Range 8Range 9
Total 7.57 37.18$ 5.00 21.02$ 281.41$
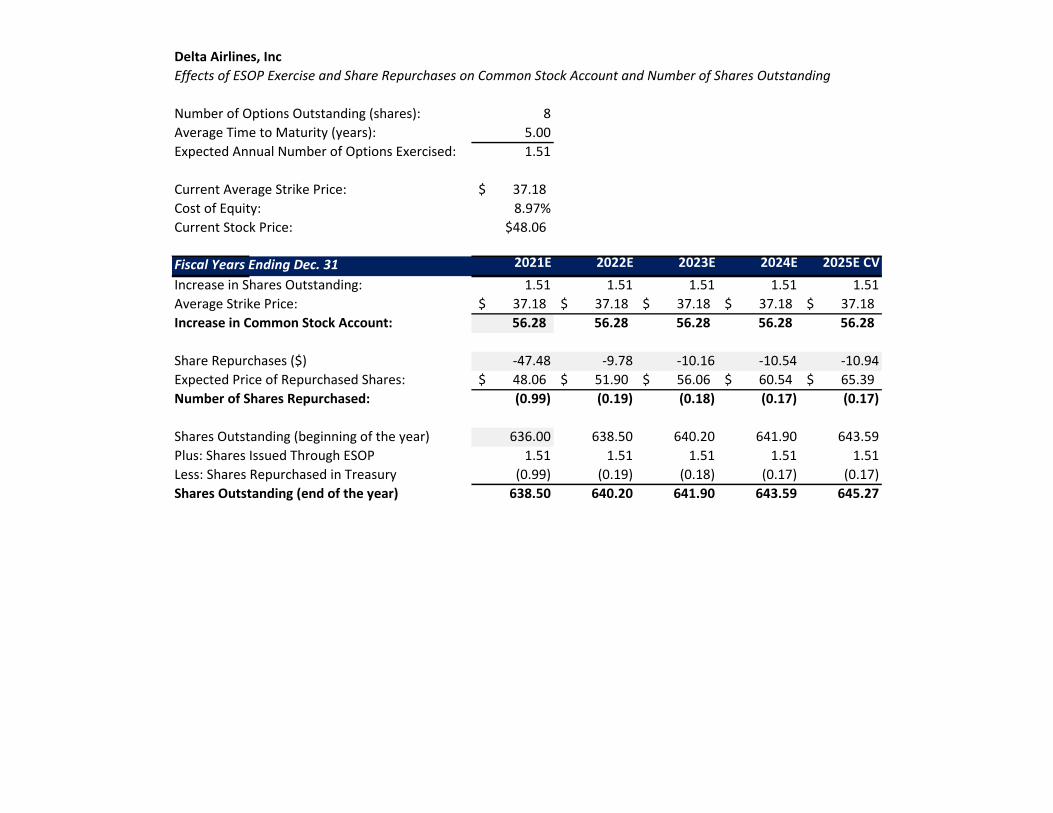
Delta Airlines, Inc
Effects of ESOP Exercise and Share Repurchases on Common Stock Account and Number of Shares Outstanding
Number of Options Outstanding (shares): 8
Average Time to Maturity (years): 5.00
Expected Annual Number of Options Exercised: 1.51
Current Average Strike Price: 37.18$
Cost of Equity: 8.97%
Current Stock Price: $48.06
Fiscal Years Ending Dec. 31 2021E 2022E 2023E 2024E 2025E CV
Increase in Shares Outstanding: 1.51 1.51 1.51 1.51 1.51
Average Strike Price: 37.18$ 37.18$ 37.18$ 37.18$ 37.18$
Increase in Common Stock Account: 56.28 56.28 56.28 56.28 56.28
Share Repurchases ($) -47.48 -9.78 -10.16 -10.54 -10.94
Expected Price of Repurchased Shares: 48.06$ 51.90$ 56.06$ 60.54$ 65.39$
Number of Shares Repurchased: (0.99) (0.19) (0.18) (0.17) (0.17)
Shares Outstanding (beginning of the year) 636.00 638.50 640.20 641.90 643.59
Plus: Shares Issued Through ESOP 1.51 1.51 1.51 1.51 1.51
Less: Shares Repurchased in Treasury (0.99) (0.19) (0.18) (0.17) (0.17)
Shares Outstanding (end of the year) 638.50 640.20 641.90 643.59 645.27

Delta Airlines, Inc
Key Management Ratios
Fiscal Years Ending Dec. 31 2018 2019 2020 2021E 2022E 2023E 2024E 2025E
Liquidity Ratios:
Current ratio=current assets/current liabilities 0.34 0.41 1.09 0.51 0.51 0.51 0.50 0.50
Quick ratio=(Cash & equivalents + Marketable securities + Account receivable)/Current liabilities0.21 0.28 0.61 0.33 0.33 0.33 0.33 0.33
Operating cash flow ratio=Non operating expenses/Current liabilities(0.01) (0.02) (0.20) (0.06) (0.06) (0.06) (0.06) (0.06)
Asset-Management Ratios:
AR turnover ratio=Sales/Account receivable net 16.93 14.15 21.18 15.06 15.06 15.06 15.06 15.06
Inventory turnover ratio=Sales/Avg. Inventory 66.17 55.33 78.42 55.55 55.54 55.55 55.54 55.54
Fixed assets turnover ratio=Net sales/Avg. Fixed assets 0.73 0.72 0.54 0.76 0.75 0.75 0.75 0.74
Financial Leverage Ratios:
Debt-Equity ratio=total liabillity/total shareholder's equity 3.40 3.20 45.93 2.73 2.75 2.81 2.78 2.80
Equity multipler=Total assets/total liabilities 1.29 1.31 1.02 1.58 1.57 1.53 1.55 1.54
Total debt to capitalization=Short-term debt + long-term debt/short-term debt + long-term debt + total shareholder's equity0.44 0.44 0.95 0.43 0.43 0.43 0.43 0.43
Profitability Ratios:
Return on Equity (NI/Beg TSE) 0.28 0.35 (0.81) 2.27 0.22 0.22 0.22 0.22
ROE=NI/Shareholder's equity 28.75% 31.04% -807.37% 21.70% 21.72% 21.70% 21.70% 21.70%
EBITDA Margin=(Earnings before interest and tax + depreciation + amortization)/total revenue4,840.05 5,897.05 (16,515.86) 2,073.91 2,143.06 2,209.02 2,280.83 2,354.57
Net profit margin=NI/Total revenue 8.86% 10.14% -72.45% 7.20% 7.20% 7.20% 7.20% 7.20%
Payout Policy Ratios:
Dividend Payout Ratio (Dividend/EPS) 23.02% 20.63% -2.05% 17.37% 17.37% 17.37% 17.37% 17.37%
Total Payout Ratio ((Divs. + Repurchases)/NI) 0.03% 0.03% 0.00% 94.92% 97.80% 100.60% 103.59% 106.66%
Divident Payout Ratio=Dividend/NI 0.03% 0.03% 0.00% 0.03% 0.03% 0.03% 0.03% 0.03%
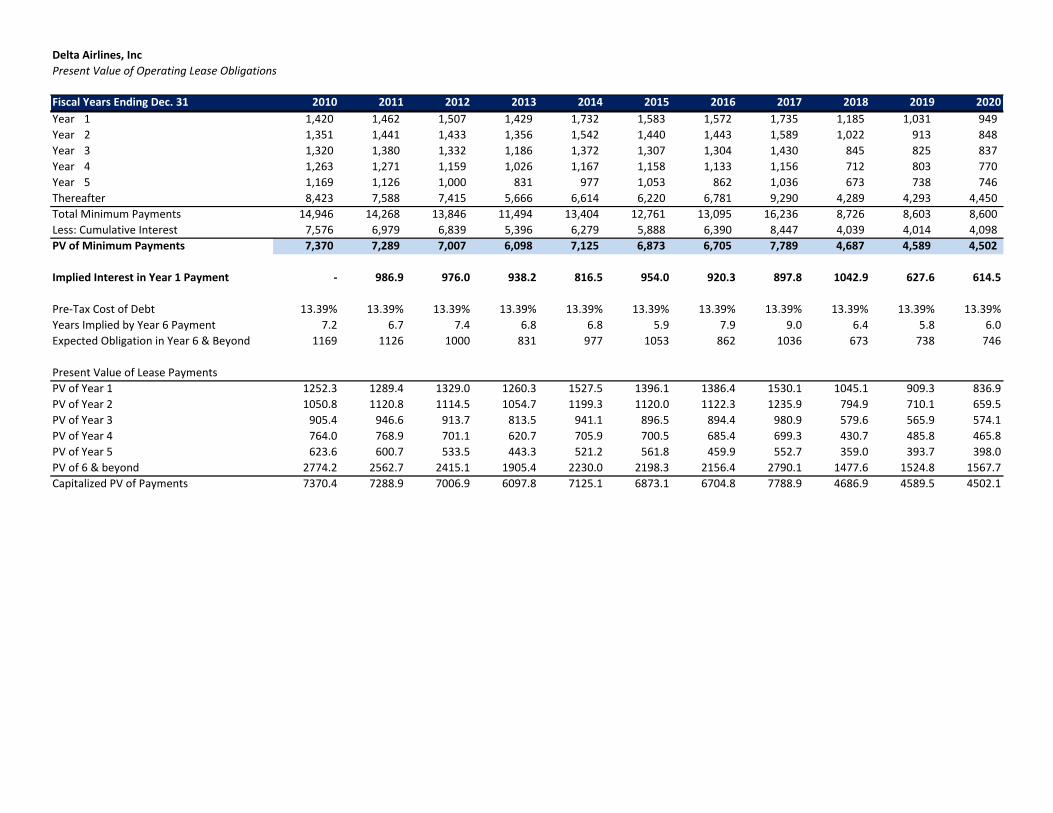
Delta Airlines, Inc
Present Value of Operating Lease Obligations
Fiscal Years Ending Dec. 31 2010 2011 2012 2013 2014 2015 2016 2017 2018 2019 2020
Year 1 1,420 1,462 1,507 1,429 1,732 1,583 1,572 1,735 1,185 1,031 949
Year 2 1,351 1,441 1,433 1,356 1,542 1,440 1,443 1,589 1,022 913 848
Year 3 1,320 1,380 1,332 1,186 1,372 1,307 1,304 1,430 845 825 837
Year 4 1,263 1,271 1,159 1,026 1,167 1,158 1,133 1,156 712 803 770
Year 5 1,169 1,126 1,000 831 977 1,053 862 1,036 673 738 746
Thereafter 8,423 7,588 7,415 5,666 6,614 6,220 6,781 9,290 4,289 4,293 4,450
Total Minimum Payments 14,946 14,268 13,846 11,494 13,404 12,761 13,095 16,236 8,726 8,603 8,600
Less: Cumulative Interest 7,576 6,979 6,839 5,396 6,279 5,888 6,390 8,447 4,039 4,014 4,098
PV of Minimum Payments 7,370 7,289 7,007 6,098 7,125 6,873 6,705 7,789 4,687 4,589 4,502
Implied Interest in Year 1 Payment - 986.9 976.0 938.2 816.5 954.0 920.3 897.8 1042.9 627.6 614.5
Pre-Tax Cost of Debt 13.39% 13.39% 13.39% 13.39% 13.39% 13.39% 13.39% 13.39% 13.39% 13.39% 13.39%
Years Implied by Year 6 Payment 7.2 6.7 7.4 6.8 6.8 5.9 7.9 9.0 6.4 5.8 6.0
Expected Obligation in Year 6 & Beyond 1169 1126 1000 831 977 1053 862 1036 673 738 746
Present Value of Lease Payments
PV of Year 1 1252.3 1289.4 1329.0 1260.3 1527.5 1396.1 1386.4 1530.1 1045.1 909.3 836.9
PV of Year 2 1050.8 1120.8 1114.5 1054.7 1199.3 1120.0 1122.3 1235.9 794.9 710.1 659.5
PV of Year 3 905.4 946.6 913.7 813.5 941.1 896.5 894.4 980.9 579.6 565.9 574.1
PV of Year 4 764.0 768.9 701.1 620.7 705.9 700.5 685.4 699.3 430.7 485.8 465.8
PV of Year 5 623.6 600.7 533.5 443.3 521.2 561.8 459.9 552.7 359.0 393.7 398.0
PV of 6 & beyond 2774.2 2562.7 2415.1 1905.4 2230.0 2198.3 2156.4 2790.1 1477.6 1524.8 1567.7
Capitalized PV of Payments 7370.4 7288.9 7006.9 6097.8 7125.1 6873.1 6704.8 7788.9 4686.9 4589.5 4502.1
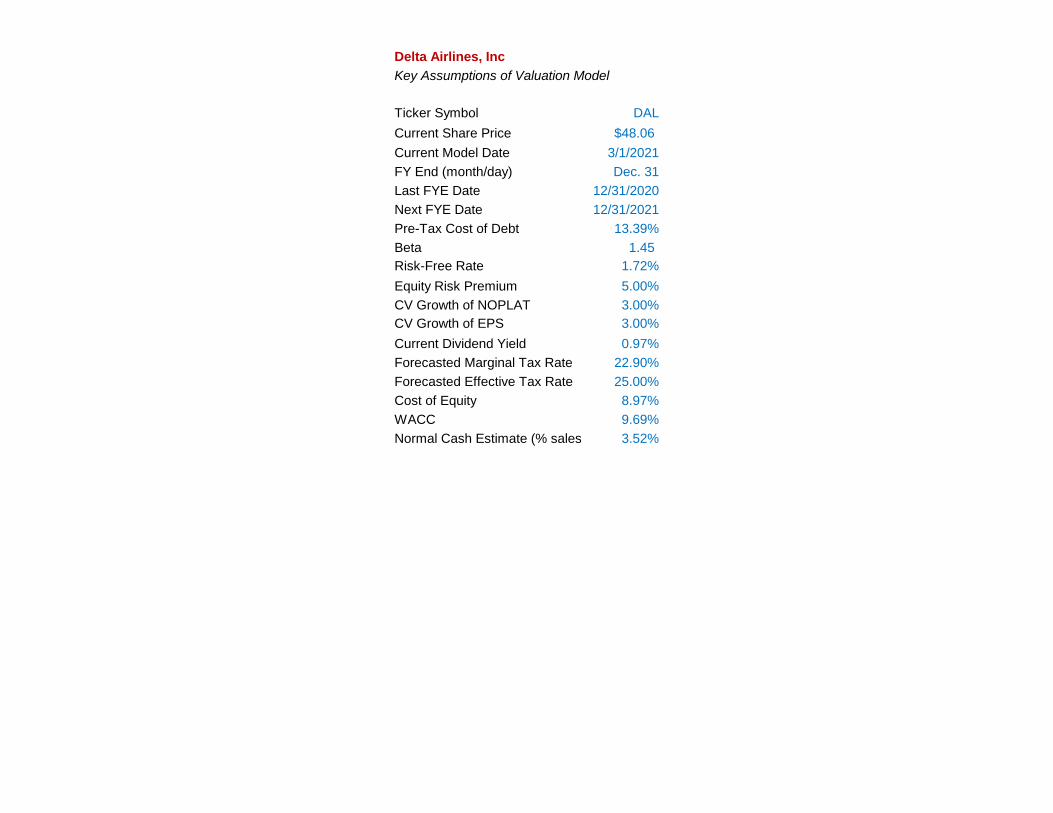
Delta Airlines, Inc
Key Assumptions of Valuation Model
Ticker Symbol DAL
Current Share Price $48.06
Current Model Date 3/1/2021
FY End (month/day) Dec. 31
Last FYE Date 12/31/2020
Next FYE Date 12/31/2021
Pre-Tax Cost of Debt 13.39%
Beta 1.45
Risk-Free Rate 1.72%
Equity Risk Premium 5.00%
CV Growth of NOPLAT 3.00%
CV Growth of EPS 3.00%
Current Dividend Yield 0.97%
Forecasted Marginal Tax Rate 22.90%
Forecasted Effective Tax Rate 25.00%
Cost of Equity 8.97%
WACC 9.69%
Normal Cash Estimate (% sales) 3.52%

Delta Airlines, Inc
Sensitivity Tables
40.05 1.15 1.25 1.35 1.45 1.55 1.65 1.75 40.05 0.67% 0.77% 0.87% 0.97% 1.07% 1.17% 1.27%
4.40% 57.91 53.83 50.02 46.46 43.12 39.98 37.03 1.15 51.66 51.65 51.64 51.64 51.63 51.62 51.61
4.60% 55.74 51.64 47.81 44.24 40.89 37.75 34.80 1.25 47.51 47.50 47.50 47.49 47.48 47.47 47.47
4.80% 53.65 49.52 45.68 42.10 38.75 35.61 32.66 1.35 43.66 43.65 43.65 43.64 43.63 43.63 43.62
5.00% 51.64 47.49 43.64 40.05 36.70 33.57 30.62 1.45 40.07 40.06 40.06 40.05 40.05 40.04 40.03
5.20% 49.69 45.53 41.67 38.08 34.73 31.60 28.67 1.55 36.72 36.71 36.71 36.70 36.70 36.69 36.69
5.40% 47.81 43.64 39.78 36.19 32.84 29.72 26.80 1.65 33.58 33.58 33.57 33.57 33.56 33.56 33.55
5.60% 45.99 41.81 37.95 34.36 31.02 27.91 25.00 1.75 30.64 30.63 30.63 30.62 30.62 30.61 30.61
40.05 1.42% 1.52% 1.62% 1.72% 1.82% 1.92% 2.02% 40.05 7.47% 7.97% 8.47% 8.97% 9.47% 9.97% 10.47%
2.70% 40.05 39.37 38.71 38.05 37.40 36.76 36.13 3.98% 607.91 608.38 608.85 609.31 609.77 610.24 610.69
2.80% 40.74 40.05 39.37 38.70 38.04 37.38 36.74 4.48% 383.57 383.87 384.16 384.45 384.75 385.04 385.33
2.90% 41.44 40.74 40.05 39.36 38.69 38.02 37.37 4.98% 272.46 272.67 272.88 273.09 273.29 273.50 273.71
3.00% 42.17 41.46 40.75 40.05 39.36 38.68 38.01 5.48% 206.09 206.25 206.41 206.56 206.72 206.88 207.03
3.10% 42.93 42.19 41.47 40.76 40.06 39.36 38.68 5.98% 161.95 162.07 162.19 162.32 162.44 162.56 162.69
3.20% 43.70 42.95 42.22 41.49 40.77 40.07 39.37 6.48% 130.45 130.55 130.65 130.75 130.85 130.94 131.04
3.30% 44.50 43.74 42.98 42.24 41.51 40.79 40.08 6.98% 106.83 106.91 106.99 107.07 107.15 107.24 107.32
40.05 10.39% 11.39% 12.39% 13.39% 14.39% 15.39% 16.39% 40.05 10.39% 11.39% 12.39% 13.39% 14.39% 15.39% 16.39%
2.70% 59.81 52.36 45.83 40.05 34.89 30.25 26.04 3.98% 594.21 599.72 604.73 609.31 613.49 617.32 620.82
2.80% 59.81 52.36 45.83 40.05 34.89 30.25 26.04 4.48% 374.55 378.16 381.45 384.45 387.19 389.70 392.00
2.90% 59.81 52.36 45.83 40.05 34.89 30.25 26.04 4.98% 265.75 268.43 270.87 273.09 275.11 276.97 278.66
3.00% 59.81 52.36 45.83 40.05 34.89 30.25 26.04 5.48% 200.77 202.88 204.81 206.56 208.17 209.63 210.97
3.10% 59.81 52.36 45.83 40.05 34.89 30.25 26.04 5.98% 157.54 159.28 160.87 162.32 163.64 164.84 165.95
3.20% 59.81 52.36 45.83 40.05 34.89 30.25 26.04 6.48% 126.69 128.17 129.52 130.75 131.87 132.89 133.82
3.30% 59.81 52.36 45.83 40.05 34.89 30.25 26.04 6.98% 103.56 104.84 106.01 107.07 108.04 108.93 109.74
WA
CC
Current Dividend Yield
Beta
Cost of Equity
WA
CC
Pre-tax Cost of Debt
CV
Gro
wth
of E
PS
Beta
ER
P
Risk Free Rate
CV
Gro
wth
of N
OP
LA
T
Pre-tax Cost of Debt
Citations
1. https://tradingeconomics.com/united-states/interest-rate
2. https://www.federalreserve.gov/monetarypolicy/fomcprojtabl20210317.html
3. https://www.whitehouse.gov/briefing-room/blog/2021/04/12/pandemic-prices-assessing-inflation-in-the-months-and-years-ahead/
4. https://www.investing.com/economic-calendar/core-pce-price-index-905
5. https://fred.stlouisfed.org/series/PPIACO
6. https://www.bls.gov/news.release/pdf/ppi.pdf
7. https://www.statista.com/statistics/188165/annual-gdp-growth-of-the-united-states-since-1990/
8. https://www.bea.gov/news/2021/gross-domestic-product-4th-quarter-and-year-2020-advance-estimate
9. https://businessquant.com/delta-airlines-fuel-and-other-costs
10. https://www.bea.gov/news/2021/gross-domestic-product-4th-quarter-and-year-2020-advance-estimate
11. https://businessquant.com/delta-airlines-fuel-and-other-costs
12. https://www.nytimes.com/2020/08/10/business/energy-environment/delta-oil-refinery-jet-fuel.html
13. Bloomberg Terminal
14. Factset Integrated Solutions
15. https://ir.delta.com/financials/default.aspx
16. https://www.pfizer.com/news/press-release/press-release-detail/pfizer-biontech-announce-positive-topline-results-pivotal
17. https://www.forbes.com/sites/investor/2021/04/01/value-stocks-showing-signs-of-awakening/?sh=4476ae90614d
18. https://www.fitchratings.com/entity/jetblue-airways-corporation-82391899 19. https://thepointsguy.com/news/delta-air-lines-fleet-plans-coronavirus/ 20. https://www.businessinsider.com/delta-boeing-737-800-flight-makes-emergency-landing-2019-5 21. https://onemileatatime.com/delta-boeing-737-max/ 22. https://www.washingtonpost.com/local/trafficandcommuting/boeing-737max-southwest/2021/04/09/df4ac0b2-992c-11eb-b28d-bfa7bb5cb2a5_story.html