industrial worker statistics
DESCRIPTION
statistics in thesisTRANSCRIPT

INDUSTRIAL WORKER
A. The Profile of the Industrial Worker in Terms of Age, Gender, Length Stay in Industrial Estate, Educational Attainment and Monthly Income
AgeAGE FREQUENCY PERCENTAGE
18-25 yrs. old 8 16%26- 33 yrs. old 26 52%34-41 yrs. old 12 24%42-49 yrs. old 2 4%50 yrs. old and
above2 4%
TOTAL 50 100%
Table 1. Profile of the Industrial Worker in Terms of Age
Table 1 shows the age range of the respondents. Fifty two percent (52%) of the respondents were 26-32 years old, showing that most of them were already considered as young adult. Twenty four percent (24%) of the respondents were between 34-41years old. Sixteen percent (16%) of the respondents were between 18-25 years old. On the other hand respondents' aged 42-49 years old is 4% of the total respondents. Lastly, 4% of the respondents are in the 50 and above status. The apparent diversity of the maturity of the respondents reflects several implications in the study's findings. To illustrate, fifty two percent of the respondents stated that they are currently working at industrial company. In relation of the age bracket of the respondents, the researcher could presume that in the said percentage, a considerable number could be among the young adult members of the population.
Gender
SEX FREQUENCY PERCENTAGE
Male 44 88%
Female 6 12%
TOTAL 50 100%
Table 2. Profile of the Industrial Worker in Terms of Gender
Based on the figure, the dominated gender among the respondents is male. Based on the gathered questionnaires, most of the population is composed of male respondents while only 6% is females. This shows that mostly male are working in industrial estate sector.
Length of Stay as Industrial Worker

LENGTH OF STAY FREQUENCY PERCENTAGE
Below 1 year 12 24%
1 year 0 0%
2 years 8 8%
3 years 6 12%
4 years 4 8%
5 years & above 20 40%
TOTAL 50 100%
Table 3. Profile of Industrial Worker in Terms of Length of Stay as Industrial Worker
The figure above shows the distribution of the respondents in terms of their length of stay in the company. Herein, it shows that 24% of the respondents are staying in the company in below 1 year as a new worker. From 2 years 8% are staying in the company while from 3 years are 12%. But 40% are servicing the company 5 years and above. The result indicate that majority of the respondents are expert and knowledgeable enough in being industrial worker.
Employment Status
EMPLOYMENT STATUS
FREQUENCY PERCENTAGE
Permanent 10 20%
Contractual 22 44%
Others 18 36%
TOTAL 50 100%
Table 4. Profile of Industrial Worker in Terms of their Employment Status
The table shows the employment status of the respondents. It indicates that 20% of their employment status is in permanent while 44% of them are contractual. On the other hand, 36% are in other which is extra, on-call-laborers, project based and employed in agency. The result illustrate that most of the industrial worker are contractual employment status in their company. The others that also high percentage is classified as seasonal employment which they have possibility to become unemployed.
Owner of Company

OWNERSHIP OF COMPANY
FREQUENCY PERCENTAGE
Private 30 60%Government 14 28%
Mixed 2 4%Cooperative 4 8%
TOTAL 50 100%
Table 5. Profile of Industrial Worker in Terms of Ownership of the Industrial Estate
It presents that sixty percent (60%) of the tenure of the industrial is in private ownership. Twenty eight (28%) is in government ownership. On the other hand, only four (4%) is in mixed ownership which both private and government are in charged; while in cooperative ownership is eight percent (8%). This shows that most of the respondents are currently working in private ownership.
Monthly IncomeMONTHLY INCOME FREQUENCY PERCENTAGE
Below 1,000 2 4%1,000- 5,000 4 8%
6,000- 10,000 8 16%11,000- 15,000 10 20%16,000- 20,000 14 28%Above 20,000 10 20%
TOTAL 50 100%
Table 6. Profile of Industrial Worker in Terms of Monthly Income
The figure indicates the monthly income of the respondents. Based on the collective result, it shows that only 4% have a monthly salary of below ₱1,000 while 8% have an income of ₱1,000- ₱5,000. On the other hand, 16% got ₱6,000- ₱10,000 monthly while in ₱11,000- ₱15,000 is 20%. Lastly, 28% got ₱16,000- ₱20,000 a month and above ₱20,000 has a respondent of 20%. Therefore, it appears that most of industrial worker have a minimum wage in their monthly salary. Julio de Vera Soberano Jr., a Rice Processing Center laborer in Sta. Barbara, Pangasinan states that working on this job generates welfare of their communities.

Educational Attainment
EDUCATIONAL ATTAINMENT
FREQUENCY PERCENTAGE
Illiterate 0 0%Elementary Graduate 2 4%High School Graduate 24 48%
College Graduate 20 40%Vocational Graduate 4 8%
TOTAL 50 100%
Table 7. Profile of Industrial Worker in Terms of Educational Attainment
Table 7. Likewise, the respondents were asked for their educational attainment and the report shows 48 % of them are high school graduate next of this is college graduate with 40%. The survey indicates that most of the respondents are high school graduate that is engage to the study. The diversity of the population is further asserted when the respondents were asked regarding their preferred experience. This data illustrate that any level of educational attainment is not a barrier to work in industrial sector.
B. Effectivity of Industrial Sector in Providing Jobs and Generating Income.
Table 8. Effectivity of Industrial Sector in terms of their income.
In the graph shown above the effectivity of industrial sector in terms of their
income. Seventy two percent (72%) of the respondents respond that their income
is enough to sustain the needs of their family and twenty eight percent (28%) of

them respond that it is not enough. Therefore, most industrial worker has enough
income to provide daily needs of their family because of their income that enough
to sustain their basic needs and priorities.
Table 9. Effectivity of Industrial Sector in terms of their skilled that enough to their job.
Table 9 shows that 100 % says yes that their skilled was enough to do their job. Table 3
state that most of the respondent was serving their company in almost 5 years so that
they experience was enough as industrial worker.

Table 10. Effectivity of Industrial Sector in terms of satisfaction to their job.
The pie graph indicates the effectivity of industrial sector in terms of satisfaction to the
respondents’ job. It state that 92% are said yes while only 8% said no. It means that
almost of the industrial worker was happy to do their job.
Table 11. Effectivity of Industrial Sector in terms of it is easy to work on their job.

The pie graph shows that 80% says yes that it is easy to work in their job to industrial estate while 20% says it is no. It explains that it will depend to their position if they are knowledgeable enough to their experience.
Table 12. Effectivity of Industrial Sector in terms of how their company provides their needs.
Table 12 shows the effectivity of industrial sector in terms of how their company
provides their needs. Seventy six percent (76%) said yes while twenty four percent
(24%) was said no. It illustrate that their company has given a benefit to their employee
like bonus salary and insurance.
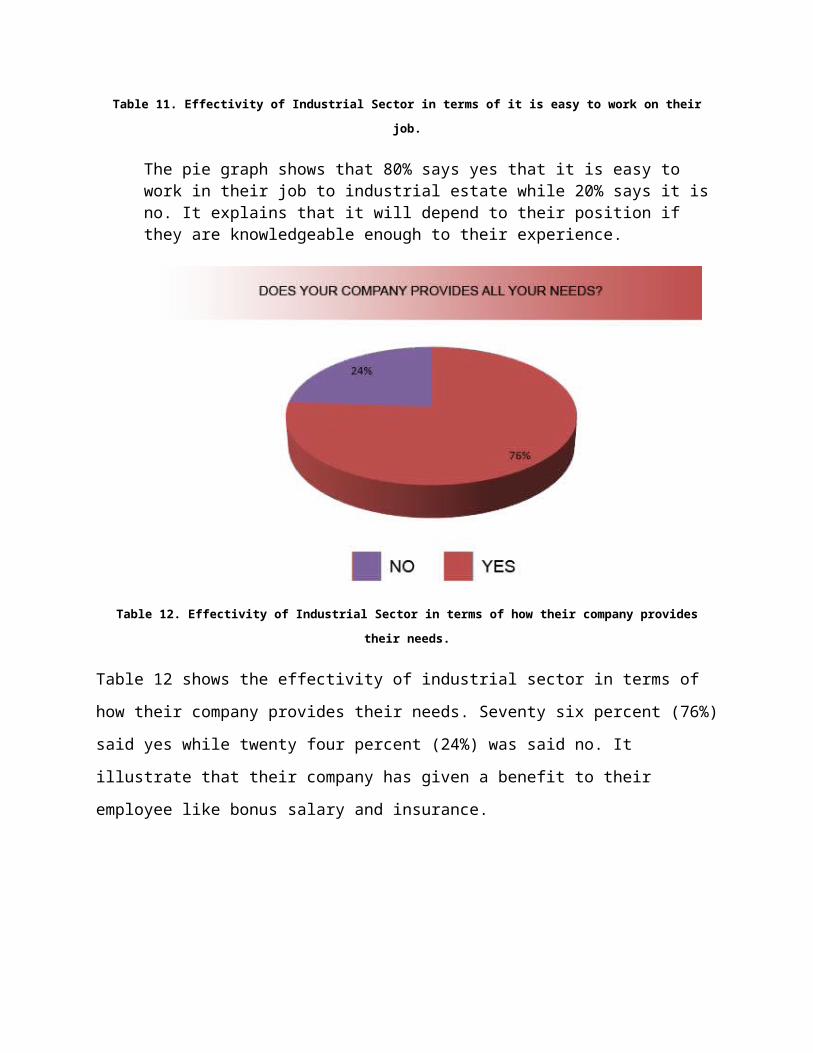
Table 13. Effectivity of Industrial Estate in terms of support to have their permanent job.
4.44 out of 5 is the computed average mean on the graph concluding that the industrial
workers agree that Industrial estates help them to have a decent and permanent job.
They approve that with the help of working in industrial estate, they have potential to
have a better job.

Table 14. Effectivity of Industrial Estate in terms of their opinion on how it provides job and
generate income.
4.48 out of 5 is the computed average mean on the graph concluding that the industrial workers agree that industrial estates will help their fellow citizen to provide jobs. According to Industrial Landscape of NE India, Industrial estates are expected to generate local employment and income to their areas of their location. The employment potential of an estate usually accounts for 4 stages namely, (i) construction of sheds and creation of infrastructure, (ii) manufacturing activity in industrial units, (iii) transportation, handling and other services connected with or arising out of manufacturing activities, and (iv) secondary and tertiary activities arising from operation of the multiplier. It tells that with the help of the number of employees and worker to have an industrial estate, they can provide more jobs and at the same time they can generate income.

C. Acceptability of Industrial Workers of Pangasinan to use Modern Technology.
Table 15. Acceptability of Industral Workers of Pangasinan in Terms of Effectiveness of Modern Technology
to make Their Job easy and faster.
4.56 out of 5 is the computed average mean on the graph concluding that the industrial workers agree that the use of modern technology makes their job easier and faster. It illustrate that all of them was approve that using modern technology can help them to be efficient to their job. They respond that the use modern technology is of great help in their industry. Modern industrial technology allows a small number of people to grow vast quantities of their products in a shortest period of time. Developments in material sciences will continue to enable the production of new materials for packaging, with the likely emphasis to be on biodegradable and compostable materials consistent with the sustainability agenda. Factors such as technical knowledge, skills of a country’s labor force, capital (either domestic or foreign) and machineries (through transfer of technology), are all indispensable for economic growth.

Table 14. Acceptability of Industrial Workers of Pangasinan in Terms of Effectiveness of Attending Seminars
and Trainings in Utilizing their Skills.
4.52 out of 5 is the computed average mean on the graph concluding that the industrial
workers agree that attending seminars and trainings help them to utilize their skills and
abilities in their work. This means that industrial as a sector of growth of a country really
helps in providing jobs and generating income. Though working in industrial is a hard
and tough job, learning of it is easy if a person is willing to be trained. Thus, they will
enhance their knowledge to utilize their skills.

D. Effectivity of Industrial Estate to the Agricultural Products of Pangasinan.
Table 14. Effectivity of Industrial Estate of Pangasinan in terms of Promoting Agricultural products
that help to Generate more Income.
The bar graph shows that. 4.40 out of 5 is the computed average mean on the graph concluding that the industrial workers agree that industrial estates promoting agricultural products help them to generate more income. The demand for food and agricultural products is changing in unprecedented ways. Increases in per capita incomes, higher urbanization and the growing numbers in workforce engender greater demand for high-value commodities, processed products and ready-prepared foods. This factor was creating an income that will generate to their economy.