industrial relations labour market report trade union
TRANSCRIPT

©2012 CfA business skills @ work
Anthea Hollist Research and Projects Officer CfA business skills @ work 6 Graphite Square Vauxhall Walk London SE11 5EE [email protected] T: 0207 0919620 F: 0207 0917340 www.cfa.uk.com
Industrial Relations Labour Market Report
Trade Union Representatives and Professionals
2012

Contents Page No.
Page 1 of 40
©2012 CfA business skills @ work
Foreword 4
Executive summary 5 1. Introduction 7 1.1 Defining Industrial Relations 7 1.2 Importance of Union Representatives and Professionals 12 2. Profile of the Industrial Relations Workforce 14 2.1 Profile of Union Professionals 14 2.2 Profile of Union Learning (ULRs) and Safety Representatives 15 3. Trade Union Membership 17 3.1 Number of trade unions 17 3.2 Occupational analysis 18 3.3 Status of the workforce 19 3.4 Gender of the workforce 19 3.5 Age of the workforce 21 3.6 Ethnicity of the workforce 22 3.7 Disability of the workforce 24 3.8 Salary Levels of the workforce 24 3.9 Qualification Levels of the workforce 25 3.10 Regional analysis 25 3.11 Industrial analysis 26 3.12 Collective agreement 28 4. Drivers of Skill Demand 29 5. Market Supply 30 5.1 Trade Union Provisions 30 5.2 Trade Union Qualifications 32 5.3 Trade Union National Occupational Standards 34 6. Current Needs 36
6.1 Recruitment needs 36 6.2 Competencies needed 36
7. Future Needs 38
7.1 Recruitment Needs 38 7.2 Skill Needs 38 7.3 Influences of Future Needs 38 7.4 Future Priorities 38
8. Bibliography 40

List of Tables Page No.
Page 2 of 40
©2012 CfA business skills @ work
Table 1: Trade union professionals by gender ......................................................... 14
Table 2: Trade union professionals by age.............................................................. 15
Table 3: Trade union professionals by ethnicity....................................................... 15
Table 4: Union learning and safety representatives.................................................. 16
Table 5: Distribution of Trade Unions by size .......................................................... 17
Table 6: Changes in Membership........................................................................... 18
Table 7: Trade union density by occupation............................................................ 18
Table 8: Trade Union density by occupation, gender, status and contract ................... 19
Table 9: Part-time/full-time.................................................................................. 19
Table 10: Trade Union density by sector and gender, 2005 - 2010 ............................ 20
Table 11: Trade Union membership levels by sector ................................................ 21
Table 12: Trade Union density by age.................................................................... 22
Table 13: average hourly earnings in £ by union status............................................ 24
Table 14: Trade union density by status................................................................. 26
Table 15: Trade union density by region 2005-2010 ................................................ 26
Table 16: Trade union membership by region 2005-2010......................................... 26
Table 17: Trade union density by industry 2009-2010 ............................................. 27
Table 18: Collective agreement coverage, 2010 ...................................................... 28
Table 19: TUC course provisions 2000-2010 ........................................................... 30
Table 20: Union workplace representatives: course and students 2010 ...................... 31
Table 21: Short courses by students, 2010............................................................. 31
Table 22: TUC course provisions 2000-2010 ........................................................... 32
Table 23: Trade Union Qualifications...................................................................... 32
Table 24: List of Trade Union National Occupational Standards ................................. 34

List of Figures Page No.
Page 3 of 40
©2012 CfA business skills @ work
Figure 1: Percent of unions by membership base .................................................... 17
Figure 2: Trade union density by gender, 1995 to 2010 ........................................... 20
Figure 3: Trade union density by age..................................................................... 22
Figure 4: Trade union density by ethnicity (%) ....................................................... 23
Figure 5: Trade union density by nationality and country of birth .............................. 23
Figure 6: Trade union density by disability ............................................................. 24
Figure 7: Density of qualification levels .................................................................. 25
Figure 8: Trade union presence............................................................................. 27

Foreword
Page 4 of 40
©2012 CfA business skills @ work
CFA Business skills @ work has been commissioned by the UK Commission for Employment and Skills (UKCES) to produce a Labour Market Intelligence (LMI) report on the Industrial Relations sector in the UK. This report focuses on presenting a picture of Trade Union Professionals and Representatives across the UK. It looks at:
the profile of trade union membership across the UK, including membership characteristics, qualification levels and national split
skills challenges and skills related issues facing employers including skills gaps and skill shortages where possible
learning provisions available for the sector
The principle purpose of this report is to provide a robust analysis of what the Trade Union Professionals and Representatives sector looks like in the UK, and where possible within each of the four Nations: England, Northern Ireland, Scotland and Wales.

Executive summary
Page 5 of 40
©2012 CfA business skills @ work
Key Findings
1. Trade Union representative and professionals provide benefits to
employers and employees by:
• improving the skills of employees, thereby enhancing the contribution they make at the workplace
• negotiating with employees on behalf of their members to reduce exit rates and
labour turnover in order to provide better outcomes for unfair dismissals for employees
• making employees aware of their rights and responsibilities in regards to health
and safety, thereby making them more engaged with the health and safety polices in the organisation
• reducing the number of exits, improving labour retention and reducing
absenteeism thus providing organisations with productivity gains.
2. Trade union professional and representatives
• The number of employees who engage in industrial relations activities are said to be severely underestimated due to the unusual nature of the occupation and the connection in official data sources with human resources.
• There are more male (54 per cent) trade union professionals than females
professionals (46 per cent). However, the number of female trade union professionals has increased from 2005 figures, while the number of male union professionals has decreased.
• More than half of all trade union professionals are over 45 years old.
• The majority of professionals are white–European (93.9 per cent). There are no
trade union professionals and representatives in the categories black African, black other, Pakistani or Chinese.
• There are more male union learning and safety representatives than female, and
a high percentage of representatives between 46 - 60 years old.
• More than half of all union learning and safety representatives have another union role.
3. Trade union membership
• Trade union density for employees in the UK has fallen to 26.6 per cent compared to 2009 figures. Trade union membership levels for UK employees fell by 2.7 per cent to 6.5 million compared with 2009.
• Associate professionals and technical professionals have the highest density of
trade unions (43.7 per cent). Sales occupations have the lowest (12.9 per cent) density of all occupations.

Executive summary
Page 6 of 40
©2012 CfA business skills @ work
• There has been a steady narrowing of the gap between men and women union density from 1995 to 2010. For the ninth consecutive year, women are now more likely than men to be trade union members.
4. Market supply
• There is a large provision of qualifications for trade union professionals and representatives. Unions have stated that they are happy with the quality of provision available for their representatives and professionals.
• Each year, TUC Education delivered training to 220,000 union workplace
representatives. There has been a doubling of courses and their take-up since 2000. Short courses continue to account for the most popular training course for representatives and professionals.
5. Current and future needs for union representatives and
professionals:
• Trade union representatives and professionals will be recruited as needs are identified. It is anticipated that over the next 10 years much of the workforce will retire and thus there will be a need to recruit and train more representatives and professionals.
• There is not much data on the specific skills required by trade union professionals
and representatives due to the unique nature of the occupation and the fact that data on unions’ workforce is said to be commercially sensitive.
1. Introduction
Page 7 of 40
©2012 CfA business skills @ work
1.1 Defining Industrial Relations The term industrial relations explains the relationship between employees and management which stems directly or indirectly from union-employer relationship.
Industrial relations are the relationships between employees and employers within the organisational settings. The field of industrial relations looks at the relationship between management and workers, particularly groups of workers represented by a union.
The term industrial relations has a broad as well as a narrow outlook. Originally, industrial relations was broadly defined to include the relationship and interactions between employers and employees. From this perspective, industrial relations cover all aspects of the employment relationship, including human resources management, employee relation, and union management. However its definition has now become more specific and restricted. Industrial relations now pertains to the study and practice of collective bargaining, trade unionism and labour management, whilst human resources management is a separate, largely distinct field which deals within non-union employment relationships and personnel practices and policies1.
1.1.1 The role of Trade Unions
Trade unions play a major role in improving the quality of industrial relations. Not only do they have to protect and safeguard the interests of workers through collective bargaining, but they have an equal responsibility to see that organisations do not suffer on account of their direct actions such as strikes. Trade unions therefore play an important role in mediating the relationship between employers and employees and ensuring that the differences of opinions do not turn into conflicts.
Collective bargaining is a process of negotiations between employers and trade unions in regards to terms and conditions of employment such wage scales, working hours, training, health and safety, overtime and grievance. When collective bargaining has led to an agreement, for example pay increases, these agreements are called collective agreements.
The following sections outline the role of trade unions in industrial relations.
1.1.1.1 Definition of a Trade Union A trade union is an organised group of workers. Its main purpose is to protect and advance the interest of its members.
According to the Trade Union and Labour Relations (Consolidation) Act 19922 a “trade union” means an organisation (whether temporary or permanent):
(a) which consists wholly or mainly of workers of one or more descriptions and whose principal purposes include the regulations of relations between workers of that description or those descriptions and employers or employers’ associations; or
(b) which consists wholly or mainly of—
1 Introduction to Industrial relations, 2007, http://industrialrelations.naukrihub.com/introduction.html 2 Trade Union and Labour Relations Consolidation, 1992, Legislation.gov.uk

1. Introduction
Page 8 of 40
©2012 CfA business skills @ work
i. constituent or affiliated organisations which fulfil the conditions in paragraph (a) (or themselves consist wholly or mainly of constituent or affiliated organisations which fulfil those conditions), or
ii. representatives of such constituent or affiliated organisations.
And whose principal purposes include the regulation of relations between workers and employers or between workers and employers’ associations, or the regulation of relations between its constituent or affiliated organisations.
1.1.1.2 What Trade Union Representatives and Professionals Do? Union representatives and professional carry out a wide range of roles. The following sub-sections present an overview of the roles they undertake.
Union Professionals3 Union professionals have a variety of job titles/roles including:
• National Officer • Regional Officer • Full Time Officer (FTO) • Regional Organiser • Union Staff • Union Education Officer • Union Project Worker • Case Worker.
Union professionals’ describe their main functions as:
• directly helping activists and branches to organise • providing back-up, advice and support on organising • casework and representing members to management • providing information and advice to members • providing direct support, e.g. training in organising, bargaining, workplace
learning or casework • national, regional or local bargaining • managing regional/national staff and/or resources • liaising with lawyers on legal cases • representing members at tribunals • organising union promotions, campaigns and/or events • representing the union.
Union Representatives4 The majority of Union Representatives hold paid employment at their workplace and perform the representative duties additionally in a voluntary capacity. On average they spend 6.2 hours a week on union work.
3 Ento (2009) Labour market intelligence for trade union professionals and representatives, page 11 4 ibid

1. Introduction
Page 9 of 40
©2012 CfA business skills @ work
The time spent in their union role varies considerably between representatives, depending upon the size and type of the union, employer, the facilities provided and the number of roles performed. Representatives include the following categories:
• Workplace Representatives (“Shop Steward”) • Union Learning Representatives • Safety Representatives • Equality Representatives • Environmental Representatives.
Some unions advised that their representatives are not divided into different categories but undertake a range of representatives’ tasks as members’ needs dictate.
Workplace representatives The Workplace Representatives carry out some, or all, of the following duties: Recruiting and Organising Members Activities include:
• building workplace organisation • recruiting new members • encouraging existing members to become more involved in the union • keeping members informed of what is going on in the union and their workplace.
Representing members Activities include:
• investigating members problems • discussing solutions with management • representing members regarding grievances, disciplinaries and other issues • attending meetings with management and reporting back to members • bargaining regarding wages and conditions.
Communication Activities include:
• taking union policies forward • communicating with members regarding policies • providing information, for example, using union leaflets and newsletters • ensuring the flow of information between the union and its members.
Representing the union to a range of public and private bodies, including: Activities include:
• trades councils • sector skills councils/standards setting bodies • public bodies

1. Introduction
Page 10 of 40
©2012 CfA business skills @ work
• schools/educational organisations • local councils • employers • european works councils.
Union Learning Representatives Union Learning Representatives (ULRs) are responsible for the promotion and representation of the collective and individual learning needs in their workplace. This may include activities such as negotiating with an employer for learning facilities or supporting someone learning a new skill. The primary role of ULRs is to raise demand for learning, especially among workers with low skills levels and Skills for Life needs – those who need help the most and who employers and training providers find it hard to reach. The Employment Act (2002) gives statutory recognition to Union Learning Representatives and rights to time off. Under this law ULRs are entitled to reasonable paid time off to:
• analyse their members' learning or training needs • provide their members with information and advice about learning or training
matters • arrange learning or training for their members • promote the value of learning or training to their members • consult the employer about carrying out these activities • prepare for carrying out any of the above activities • undergo training relevant to their functions as a learning representatives
Safety Representatives
Safety Representatives focus specifically on workplace health and safety issues. They usually cover a defined area or group of workers in the workplace where they themselves work. The issues they deal with can be very wide ranging, from the general workplace environment ( such as uncomfortable working temperatures, lack of breaks) to more specific health and safety hazards (such as manual handling, stress and repetitive strain injury (RSI)). Safety Representatives have specific rights enshrined in law, which enable them to:
• represent employees in discussions with the employer on health, safety or welfare and in discussions with Health & Safety Executive (HSE) or other enforcing authorities
• investigate hazards and dangerous occurrences • investigate complaints • carry out inspections of the workplace and inspect relevant documents • attend safety committees • be paid for time spent on carrying out their functions • receive paid time off for union approved safety training.

1. Introduction
Page 11 of 40
©2012 CfA business skills @ work
Employers are required to consult safety representatives, especially about:
• the introduction of any new measures at a workplace that may substantially affect health and safety
• arrangements for appointing competent persons to assist the company with health and safety and implementing procedures for serious and imminent risk
• any health and safety information required to be provided to employees • the planning and organisation of health and safety training for the workforce,
such as induction training • health and safety implication of the introduction of new technology.
Equality Representatives
Equality Representatives work to promote diversity and eliminate discrimination in the workplace, relating to the following areas:
• women's Programmes • tackling Racism & Discrimination • equal Opportunities • lesbian & Gay Issues • disability • equal Pay • countering the Far Right
The role of the equality representative is still evolving, but duties include:
• identifying equality issues • raising awareness of the equality agenda among members and the union • where appropriate, encouraging employers to include equality and diversity as
part of their collective bargaining agenda • supporting and advising other representatives and members with the aim that
every worker receives fair treatment, irrespective of gender, race, disability, gender reassignment, religion, age or sexuality
• monitoring policies and procedures in the workplace and the impact they have on different groups.
Environmental Representatives/Union Green Representatives
Driven by global pressures on the environment and widespread recognition that the environment is a serious concern at every level of society, a more recent development is the creation of Environmental/Green representatives who:
• address the climate change challenge • raise awareness of green issues in the workplace • support shifts to sustainable production and consumption • ensure green issues are included in the bargaining agenda • support GreenWorkplaces projects.
Environmental Representatives do not, at present, have specific legal rights to time off to carry out the role or undertake training. However, some unions are seeking to establish these rights through voluntary agreements.

1. Introduction
Page 12 of 40
©2012 CfA business skills @ work
Union Organisers The primary function of these organising roles is to build union organisation, recruit new members and activists and strengthen and revitalise union workplaces structures. Over the last ten years, the TUC and a number of affiliated unions have developed new recruitment and training programmes for union organisers. Over time many of these new organisers may move into more generalist full-time officer positions. This places demand on unions to provide broader training and support for these staff in areas such as collective bargaining and individual representation.
1.2 Importance of union representatives and professionals Not only do trade union representatives and professionals make a difference to workers, they also bring benefits to employers and the wider community. Trade unions are especially important in negotiating with employers on behalf of their members. The follow sub-sections outline their main benefits. 1.2.1 Skills and training5 Union learning representatives are important because they bring benefits by helping individual employees develop their skills, thereby enhancing the contribution they make at the workplace. In 2007 the Department for Education and Employment (DfEE) estimated that the benefits of ULRs to businesses in the form of improved productivity ranged from around £11 million to £49 million in the first year. Further research indicated that ULRs actively encouraged colleagues in the workplace to undertake training. An evaluation of the Union Learning Fund (ULF) between 2001 and 2005 conducted by the Department for Education and Schools (DfES) found that there had been over 153,000 learning opportunities delivered as a result of the fund. Where ULRs are present in recognised workplaces, employees are eight per cent more likely to report having received two to five days training annually. Where a workplace has ULRs, recognition and a representative structure that includes employee representatives, employees are 14.9 per cent more likely to report receiving training, and 6.7 per cent more likely to report receiving 10 or more days training6. As such, trade union representatives improve the skill level of employees and, in turn, increase the productivity of the workforce. 1.2.2 Labour turnover, exit rates and dispute resolutions7 Research suggests that the ‘voice’ that union representatives provide for employees can reduce exit rates and labour turnover, and can bring substantial benefits by avoiding costs such as support during job search (unemployment benefits), firm recruitment costs and a reduction in labour productivity (due to a loss of job skills).
5 DTI (2007) Consultation Document: workplace representatives: a review of their faculties and facility time, page 82 – 3 6 TUC (2010) The Road to Recovery: how effective union can help rebuild the economy, page 6 7 DTI (2007) Consultation Document: workplace representatives: a review of their faculties and facility time, page 83 – 5

1. Introduction
Page 13 of 40
©2012 CfA business skills @ work
Union representatives play a vital part in meditating potential disputes; they offer support and valuable experiences to employees and can often prevent or support employees leaving an organisation. In cases where they prevent staff leaving they are estimated to save employers between £107 million to £213 million from fewer dismissals, £72 million - £143 million from voluntary exits and £22 million – £43 million as a result of fewer employment tribunal applications. For employees, unfair dismissals awarded by trade unions are over three times higher than the average in a non-union backed dismissal case. In 2007, unions won a record £330 million in compensation for members through legal action. They also won £1 million in equal pay claims – an average of £15,000 per member affected8. 1.2.3 Workers safety9 Health and safety representatives encourage workers to investigate and tackle hazardous or impeding work conditions, as well as reduce the number of injuries in a workplace and work-related illness. They inform employees of their rights and responsibilities in regards to health and safety thus making them more engaged with the health and safety polices in the organisation. It is estimated that they save employers round £340 to £530 per working day lost through illness, and £136 million - £371 million in the number of days lost through workplace injury. On average, union members receive higher pay, better sickness and pension benefits, more holidays and more flexible working hours than non-members. They also earn more than 12.5 per cent more per hour than non-union members10. 1.2.4 Productivity11 By reducing the number of exits, improving labour retention and reducing absenteeism, union representatives provide organisations with productivity gains in so far as skill attribution is higher in workplaces with lower labour turnovers. Furthermore, employees that are listened to have a greater commitment to the company and are more productive. The DTI estimated that this greater productivity is worth between £3.4 billion and £10.2 billion to the economy. As this section shows, trade union representatives and professionals undertake a number of roles to protect their members as well as the interests of the organisations. Through their numerous roles, trade union professionals and representatives promote skills, negotiate terms of conditions and generally protect the needs of their members and employers in all aspects of employment.
8 TUC (2010)The Road to Recovery: how effective union can help rebuild the economy, page 6 9 DTI (2007) Consultation Document: workplace representatives: a review of their faculties and facility time, pages 85 – 88 10 TUC (2010)The Road to Recovery: how effective union can help rebuild the economy, page 6 11 TUC (2011) TUC Education Annual Report 2011, page 2

2. Profile of the Industrial Relations Workforce
Page 14 of 40
©2012 CfA business skills @ work
In the SOC2010 codes industrial relations officers are combined with human resources and therefore we are unable to state with accuracy the exact number of industrial relations officers in the UK. In the period April – June 2011, there were 129,000 human resources and industrial relation officers in the UK. This was made up of 88,000 female workers and 41,000 male workers with the vast majority working full time12. This number is said to severely underestimate the number of workers involved in industrial relations activities, particularly because a large number of those who undertake industrial relations activities work for trade unions and do so in a voluntary capacity. Many individuals who undertake trade union representative and professional roles do so voluntarily and in conjunction with other full time employment. As such when identified through standard occupational classification codes (SOC), it is their paid (often full time) employment and not their voluntary position which is measured. This section presents a profile of trade union representatives and professional across the UK. It uses data from the Ento (2009) report, as data on unions’ workforce is said to be commercially sensitive in nature and thus CFA was unable to collect up to date data. It is expected that due to the commercially sensitive nature of trade unions’ workforce data, establishing the exact number of union professionals and representatives is not possible. Therefore the number of employees who engage in trade union activities either as an ‘industrial relations officer’ or a trade union professional or representative is unknown. However the following section presents an idea of what the workforce may look like. 2.1 Profile of union professionals 2.1.1 Gender In 2005, there were significantly more male trade union professionals than female professionals. In 2007, this gender balance changed significantly, so that there were almost more than twice the number of female professionals than in 2005 (27 per cent to 46 per cent). The number of male professional fell from 73 per cent in 2005 to 54 per cent in 2009, reducing the gap between male and female professionals. Table 1: Trade union professionals by gender
(%) 2005 2007 Female 27 46 Male 73 54 Source: Ento (2009) Labour market intelligence for trade union professionals and representatives, page 18 Whether the gender balance has continued to shift with an increasing number of female union professionals and a decreasing number of male professionals is unknown. Further research must be undertaken to identify whether this is the case, and what the reasons for the shift may be.
12 Office of National Statistics (2011) EMP16: All in employment by status, occupation and sex

2. Profile of the Industrial Relations Workforce
Page 15 of 40
©2012 CfA business skills @ work
2.1.2 Age In 2007, more than half of all trade union professionals were over 45 (57 per cent), with the majority falling within the ages of 45 – 54 years old (33 per cent). 24 per cent of professionals were over 55 years old and a quarter between 35 – 44 years old. Union professionals are least likely to be between the ages of 25 to 34 (18 per cent). Table 2: Trade union professionals by age
(%) 25-34 35-44 45-54 55+ 2007 18 25 33 24 Source: Ento (2009) Labour market intelligence for trade union professionals and representatives, page 18 The age profile of union professionals is considered by many unions to be of concern because they expected that many experienced professionals will retire during the next 10 years. Therefore, there is a need to recruit and train more trade professionals. 2.1.3 Ethnicity The ethnicity of trade union professionals can be broken down as such:
• ‘White European’ (93.9 per cent) • ‘Indian’ (2.6 per cent) • ‘White – other’ and ‘Other’ (1.3 per cent respectively) • ‘Black Caribbean’ and ‘Mixed’ (0.4 per cent respectively).
There are no Black African, Black Other, Pakistani or Chinese trade union professionals. Table 3: Trade union professionals by ethnicity
Percentage White – European 93.9 Indian 2.6 Other 1.3 White – Other 1.3 Black Caribbean 0.4 Mixed 0.4 Prefer not to say 0.1 Black African 0.0 Black Other 0.0 Pakistani 0.0 Chinese 0.0 Source: Ento (2009) Labour market intelligence for trade union professionals and representatives, page 19 2.1.4 Qualifications Union professionals are generally well qualified with almost one in four declaring qualifications at HE Certificate level or above. However, it should be noted that the qualifications held do not necessarily relate to the union role but may be a reflection of a paid position.
2.2 Profile of Union Learning Representatives and Safety Representatives The total number of ULRs who have been trained up to March 2008 is 20,589. The number of union learning reps aged between 46 and 60 years old increased from 2005 to 2007, though the number of male and female reps stayed the same. There was a
2. Profile of the Industrial Relations Workforce
Page 16 of 40
©2012 CfA business skills @ work
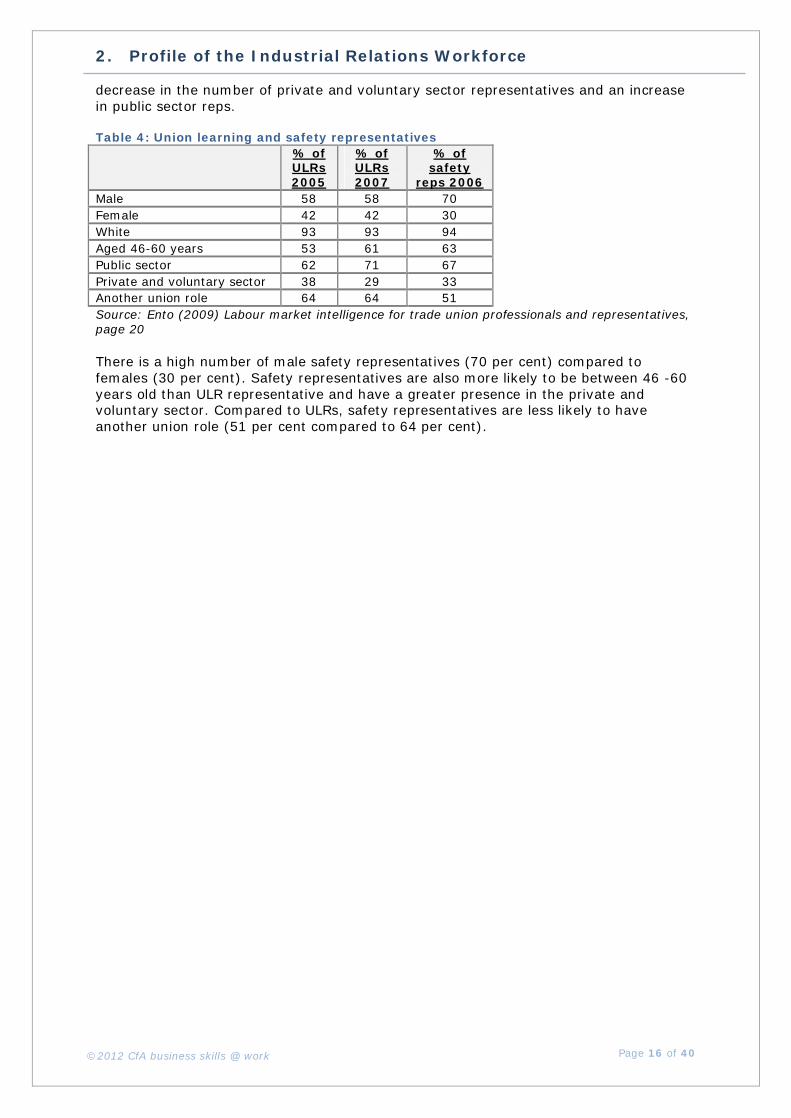
decrease in the number of private and voluntary sector representatives and an increase in public sector reps. Table 4: Union learning and safety representatives
% of ULRs 2005
% of ULRs 2007
% of safety
reps 2006 Male 58 58 70 Female 42 42 30 White 93 93 94 Aged 46-60 years 53 61 63 Public sector 62 71 67 Private and voluntary sector 38 29 33 Another union role 64 64 51 Source: Ento (2009) Labour market intelligence for trade union professionals and representatives, page 20 There is a high number of male safety representatives (70 per cent) compared to females (30 per cent). Safety representatives are also more likely to be between 46 -60 years old than ULR representative and have a greater presence in the private and voluntary sector. Compared to ULRs, safety representatives are less likely to have another union role (51 per cent compared to 64 per cent).

3. Trade Union Membership
Page 17 of 40
©2012 CfA business skills @ work
3.1 Number of trade unions There are 176 trade unions in the UK, representing 7,328,905 members. The 14 unions with a membership of over 100,000 accounted for 87.5 per cent of the total, while the 162 unions with a membership under 100,000 only accounted for 12.5 per cent of the total. Table 5: Distribution of Trade Unions by size Number of unions Membership of all
unions Numbers of members
Numbers of unions Membership % Cumulative
per cent % Cumulative per cent
Under 100 34 1,139 19.3 19.3 0.0 0.0 100 – 499 30 8,270 17.0 36.4 0.1 0.1 500 – 999 20 14,678 11.4 47.7 0.2 0.3
1,000 – 2,499 22 41,146 12.5 60.2 0.6 0.9 2,500 – 4,999 17 61,930 9.7 69.9 0.8 1.7 5,000 – 9,999 11 81,246 6.3 76.1 1.1 2.8
10,000 – 14,999 4 55,604 2.3 78.4 0.8 3.6 15,000 – 14,999 8 162,177 4.5 83.0 2.2 5.8 25,000 – 49,999 14 482,907 8.0 90.9 6.6 12.4 50,000 – 99,999 2 140,092 1.1 92.0 1.9 14.3
100,000 – 249,000 6 929,100 3.4 95.5 12.6 26.9
250,000 + 8 5,350,616 4.5 100.0 73.1 100.0 Total 176 7,328,905 100 100 100 100
Source: The Certification Officer (2011), Annual Report of the Certification Officer, page 24 Most unions (19.3 per cent) have a membership size under 100, although there are also a large number of unions which have a membership base between 100 – 499 (17.0 per cent) and 1,000 – 2,499 (12.5 per cent). Figure 1: Percent of unions by membership base
17.0%
12.5%
11.4%
9.7%
8.0%
6.3%
4.5%
4.5%
3.4%
2.3%
19.3%
1.1%
0.0% 5.0% 10.0% 15.0% 20.0% 25.0%
Under 100
100 – 499
1,000 – 2,499
500 – 999
2,500 – 4,999
25,000 – 49,999
5,000 – 9,999
15,000 – 14,999
250,000 +
100,000 – 249,000
10,000 – 14,999
50,000 – 99,999
Source: The Certification Officer (2011), Annual Report of the Certification Officer, page 24

3. Trade Union Membership
Page 18 of 40
©2012 CfA business skills @ work
The following table shows unions whose membership has increased or decreased by 10,000 or more since the previous year (2009-2010). Table 6: Changes in Membership Total Membership (000’s) 2009-2010 2008-2009 % change Inrceases Union of Shop Distributive and Allied Workers 387 371 +4.3 National Union of Teachers 377 367 +2.7 UNISON: The Public Services Union 1,375 1,362 +1.0 Decreases Unite the Union 1,573 1,635 -3.8 Communication Workers Union 218 231 -5.6 Source: The Certification Officer (2011), Annual Report of the Certification Officer, page 25 The biggest increase in membership was from the Union of Shop Distributive and Allied Workers (+ 4.3 per cent), followed by the National Union of Teachers (+2.7 per cent) and UNISON, the public service union (+1.0 per cent). The biggest decrease was in the Communication Workers Union (-5.6 per cent) followed by Unite the Union (-3.8 per cent). 3.2 Occupational analysis Table 7 indicates that union density was highest in the professionals’ occupations at 43.7 per cent whilst sales occupations had the lowest density of union members at 12.9 per cent. Across most occupations except the associate professionals and technical occupation there has been a decline in the density of trade unions. Table 7: Trade union density by occupation
2005 2006 2007 2008 2009 2010 Managers and senior officials 18.7 16.8 17.4 17.1 16.5 15.1 Professionals occupations 48.3 46.8 47.1 44.3 44.9 43.7 Associate professionals and technical occupations 41.5 42.7 41.5 39.6 40.2 40.2 Administrative and secretarial occupations 24.1 23.6 22.8 23.1 22.5 21.0 Skilled trades occupations 24.2 23.8 24.7 23.3 22.2 21.8 Personal services occupations 29.9 30.4 30.4 30.6 30.8 30.6 Sales and customer services occupations 11.6 12.7 12.2 13.2 13.1 12.9 Process, plant and machine operatives 34.3 33.3 29.9 31.9 30.7 28.6 Elementary occupations 20.4 20.4 20.3 19.2 19.1 18.3 Source: Achur, J (2010), Trade Union Membership 2010, page 27 Table 8 shows that the highest density of males is within the associate professionals and technical occupation (34.4 per cent), while the highest density for females is in professional occupations (57.3 per cent). Across all occupations apart from administrative and secretarial, skilled trades, process, plant and machine operatives and elementary occupations the density of male trade union members is higher than the density of female trade union members. The density of full-time workers was highest in all occupations apart from managers and senior officials. The density of permanent employers was high in all occupations apart from professionals and associate professionals where there was a higher density of temporary employees.

3. Trade Union Membership
Page 19 of 40
©2012 CfA business skills @ work
Table 8: Trade Union density by occupation, gender, status and contract
Gender Status Contract All Male Female Full-time Part-time Permanent Temporary
Managers and senior officials 15.1 12.6 19.7 15.0 19.2 15.3 13.2 Professionals occupations 43.7 31.5 57.3 44.3 37.7 42.5 48.9 Associate professionals and technical occupations 40.2 34.4 45.3 40.9 26.0 39.6 42.4
Administrative and secretarial occupations 21.0 24.5 20.0 21.8 8.4 23.6 16.8
Skilled trades occupations 21.8 22.1 19.0 22.3 # 23.0 # Personal services occupations 30.6 29.2 30.9 31.5 21.5 33.8 26.7 Sales and customer services occupations 12.9 11.8 13.5 13.8 1.4 16.2 #
Process, plant and machine operatives 28.6 30.3 16.2 29.7 12.5 30.5 11.2
Elementary occupations 18.3 20.7 15.5 19.9 3.9 25.6 10.7 Source: Achur, J (2010), Trade Union Membership 2010, page 24 3.3 Status of the workforce 77.9 per cent of union members work full-time, whilst 22.1 per cent work part time. Trade union members are more likely than non-union members to work full time, while non-union members are more likely to work part time. Table 9: Part-time/full-time
Union members Non-union members All employees Full-time 77.9 70.2 73.0 Part-time 22.1 29.8 27.0 Source: Achur, J (2010), Trade Union Membership 2010, page 34 3.4 Gender of the workforce
Figure 2 presents a picture of union density for UK employees by gender. In 1995, union density for UK male employees was 35.0 per cent while for females it was 29.7 per cent. The gap between men and women union densities stood at 5.3 percentage points, as men were more likely to be trade union members.
There was a steady narrowing of the gap until 2001, when union density for females overtook men’s and then continue to widen till 2010. In 2010 trade union density for men fell further by 1.4 percentage points compared with 2009, whilst for females it fell by 0.1 percentage points leading to the gap between male and females increasing to 5.6 percentage points in 2010. This showed that for the ninth consecutive year, women are now more likely than men to be a trade union member.

3. Trade Union Membership
Page 20 of 40
©2012 CfA business skills @ work
Figure 2: Trade union density by gender, 1995 to 2010
Source: Achur, J (2010), Trade Union Membership 2010, page 4 Table 10 presents a picture of trade union density in the UK by gender for public and private sector employees from 2005 to 2010. The table shows that trade union density has generally been falling in both the private and public sectors during this period. In 2010, trade union density for public sector employees fell marginally by 0.3 percentage points to 56.3 per cent from 56.6 per cent in 2009, and down 1.9 percentage points compared with 2005. This represented a slight fall in membership in the public sector. For private sector employees, 14.2 per cent were union members in 2010, a decline of 0.9 percentage points compared with 2009, and down 2.6 percentage points compared with 2005. The greatest shift in density of trade unions took place in the private sector. Table 10: Trade Union density by sector and gender, 2005 - 2010 Private sector Public sector
(%) All Male Female All Male Female 2005 16.9 19.5 13.4 58.2 60.6 56.9 2006 16.5 19.1 13.1 58.7 61.0 57.5 2007 16.1 18.5 12.8 59.0 61.3 57.8 2008 15.5 17.6 12.7 57.1 58.7 56.3 2009 15.1 17.2 12.4 56.6 56.2 56.8 2010 14.2 15.9 11.9 56.3 54.9 57.0
Source: Achur, J (2010), Trade Union Membership 2010, page 21 Overall union density in the UK is higher for female employees, because a greater proportion of women work in the public sector compared with only a minority of men. Moreover the pattern of change from 2005 to 2010 in both the public and private sector shows a greater fall in the density of male union members than females. In the private sector, the density for males was 15.9 per cent in 2010 a fall of 1.3 per cent from 2009 and 3.6 per cent from 2005. Likewise in the public sector, the density of males stood at 54.9 per cent compared to 2009 where it was 56.2 per cent and 2005 where it was 60.6 per cent.

3. Trade Union Membership
Page 21 of 40
©2012 CfA business skills @ work
Female density in the private sector stood at 11.9 per cent, with the male figure at 15.9 per cent. However the fall from 2009 was only 0.5 per cent for females compared to the 1.3 per cent that occurred with men. In the public sector, female density stood at 57.0 per cent, higher than males 54.9 per cent. Unlike the fall of 1.3 per cent that happened for males from 2009 to 2010, for females there was an increase of 0.2 per cent. The table below shows trade union membership levels in the UK by gender for public and private sector employees. In 2010, 2.5 million private sector employees in UK were union members, down 145 thousand from 2.6 million in 2009, and 529 thousand from 2.9 million in 2005. In the public sector, 4.1 million public sector employees in the UK were union members, down by around 34 thousand compared with 2009, but up from 4.0 million in 2005. Table 11: Trade Union membership levels by sector Private sector Public sector
(%) All Male Female All Male Female 2005 2,996 1,980 1,017 4,060 1,495 2,565 2006 2,970 1,974 996 4,051 1,456 5,595 2007 2,914 1,926 988 4,091 1,453 2,638 2008 2,787 1,816 971 4,091 1,463 2,628 2009 2,612 1,687 926 4,102 1,435 2,667 2010 2,467 1,583 884 4,068 1,393 2,676
Source: Achur, J (2010), Trade Union Membership 2010, page 22 By gender, male membership was higher in the private sector than the public sector from 2005 to 2010. Male membership fell from 2009 to 2010 in both the private sector and public sector. While the private sector saw a greater fall in male membership than the public sector, there are more males members from the private sector than the public. In the private sector, female membership fell from 2009 to 2010, while membership in the public sector increased during the same period. Public membership accounted for a larger share of membership from females than, than in the private sector. It is anticipated that the decline in trade union membership will accelerate in the next few years due to planned budget reductions in the public sector, although it is unclear what the impact on trade union density might be. 3.5 Age of the workforce More than half (64.3 per cent) of union members are believed to be above the age of 35, with 30.9 per cent between 35 – 49 years old and 33.4 per cent over 50 years old.

3. Trade Union Membership
Page 22 of 40
©2012 CfA business skills @ work
Figure 3: Trade union density by age
35%
33%
22%
10%
16 – 2425 – 3435 – 4950 +
Source: Achur, J (2010), Trade Union Membership 2010, page 22 Trade union members who are between 16 – 24 years old are more likely to be female, work full time and hold a temporary contract than those who are above 25 years old. Those above 25 are more likely to hold a permanent work contract than those under 25 years old. They are, however, still more likely to be male than female and work full time rather than part-time. Table 12: Trade Union density by age
Gender Status Contract All Male Female Full-time Part-time Permanent Temporary
16 – 24 9.6 9.2 9.9 10.0 7.2 12.8 4.9 25 – 34 21.0 17.7 24.7 21.3 17.0 21.5 18.6 35 – 49 30.9 27.5 34.3 31.3 23.4 32.0 27.6
50 + 33.4 31.3 35.4 33.9 24.6 37.2 25.7 Source: Achur, J (2010), Trade Union Membership 2010, page 22 3.6 Ethnicity of the workforce The chart below shows that union density was highest in Black/Black British employees at 29.8 per cent, followed by White employees at 27.0 per cent and by Mixed ethnic background employees at 23.9 per cent. Chinese and other ethnic groups had the lowest union density at just 16.1 per cent. An analysis by gender showed a similar pattern, with the highest density of males and females in the Black/Black British category followed by the White category and then the Mixed category.

3. Trade Union Membership
Page 23 of 40
©2012 CfA business skills @ work
Figure 4: Trade union density by ethnicity (%)
27.0
23.9
20.2
29.8
16.1
24.3
17.4 16.9
27.1
15.1
29.7 29.2
24.7
32.3
17.4
0.0
5.0
10.0
15.0
20.0
25.0
30.0
35.0
White Mixed Asian or Asian British Black or Black British Chinese and other ethnicgroups
All Male Female
Source: Achur, J (2010), Trade Union Membership 2010, page 25 Employees of UK nationality have a higher density (27.2 per cent) compared with non-UK nationals at 23.1 per cent. Similarly, UK born employees have a higher union density (27.5 per cent) compared to non UK born employees (20.3 per cent). Density for males and females is also higher for UK born employees and UK nationals. Figure 5: Trade union density by nationality and country of birth
27.2
21.3
27.5
20.3
24.6
18.0
24.8
17.4
29.9
25.0
30.2
23.5
0
5
10
15
20
25
30
35
UK, British Other UK Other
Nationality Country of Birth
All Male Female
Source: Achur, J (2010), Trade Union Membership 2010, page 25

3. Trade Union Membership
Page 24 of 40
©2012 CfA business skills @ work
3.7 Disability of the workforce Those with a disability (32.0 per cent) were more like than those without a disability (25.6 per cent) to be union members. Likewise, for both males and females there was a higher density of union members who had a disability than those who did not. Figure 6: Trade union density by disability
32.0
29.8
34.0
25.6
22.8
28.5
0.0
5.0
10.0
15.0
20.0
25.0
30.0
35.0
40.0
All Male Female
Disabled Not disabled
Source: Achur, J (2010), Trade Union Membership 2010, page 25 3.8 Salary levels of the workforce The table below shows the average hourly earnings by trade union membership for UK employees from 2005 to 2010. Union members earn a higher hourly rate on average than non members in both the private and public sector. This has been the case since 2005. 2010 saw the average hourly earnings of non-member and members at its highest level since 2005, indicating an overall increase in wages. Table 13: average hourly earnings in £ by union status
Private sector Public sector Member Non-member Member Non-member
2005 10.89 10.24 12.72 10.51 2006 11.60 10.67 13.01 10.64 2007 11.85 11.03 13.41 10.97 2008 11.86 11.58 13.92 11.87 2009 12.40 11.80 14.40 12.10 2010 12.70 11.90 14.90 12.30 Source: Achur, J (2010), page 33

3. Trade Union Membership
Page 25 of 40
©2012 CfA business skills @ work
3.9 Qualification levels of the workforce Employers with higher education and degrees reported higher rates of union membership. Those with a higher education reported a 37.6 per cent density compared with 33.6 per cent for those with a degree or equivalent. Female employees with a degree had a significantly higher union density (42.0 per cent) compared to their male counterparts (25.2 per cent). Male employees with a GCE or equivalent reported a higher density than females. Male employees were also more likely to report higher union density if they had no qualification or ‘other’ qualifications. Figure 7: Density of qualification levels
33.6
37.6
24.3
20.7
20.2
16.7
25.2
29.6
25.7
20.3
20.4
17.7
42.0
43.7
22.2
20.9
20.0
15.6
0.0 5.0 10.0 15.0 20.0 25.0 30.0 35.0 40.0 45.0 50.0
Degree or equivalent
Higher education
GCE A level or equiv
GCSE grades A-C or equiv
Other qualification
No qualification
FemaleMaleAll
Source: Achur, J (2010), Trade Union Membership 2010, page 25 3.10 Regional analysis Table 14 shows trade union density and membership by nation from 2005 to 2010. Among nations, in 2010 Northern Ireland had the highest union density (35.7 per cent) followed by Wales (34.5 per cent) and Scotland (32.3 per cent), whilst England had the lowest density (25.2 per cent). Over time, union density rose in Scotland, but all other nations saw a fall in the density of their union membership. In terms of membership, England was the nation that had the highest numbers of membership (5,217), followed by Scotland (704), Wales (389) and then Northern Ireland (225). While membership fell in England and Northern Ireland from 2009 to 2010, it increased in both Wales and Scotland.

3. Trade Union Membership
Page 26 of 40
©2012 CfA business skills @ work
Table 14: Trade union density by status 2005 2006 2007 2008 2009 2010
Density 27.3 26.8 26.6 26.1 26.1 25.2 England Membership 5,671 5,593 5,607 5,504 5,381 5,217
Density 34.2 35.8 37.3 37.3 35.4 34.5 Wales Membership 392 408 426 424 386 389
Density 34.0 34.4 32.6 32.8 31.8 32.3 Scotland Membership 742 768 719 724 693 704
Density 40.9 39.6 39.8 35.7 39.9 35.7 Northern Ireland Membership 252 253 257 231 254 225
Source: Achur, J (2010), Trade Union Membership 2010, page 27 By English region, the north east continued to have the highest union density (32.8 per cent), whereas London (21.5 per cent) and the South East (21.3 per cent) continued to have the lowest. Table 15: Trade union density by region 2005-2010 2005 2006 2007 2008 2009 2010 North East 36.5 38.6 35.7 25.4 35.7 32.8 North West 32.9 34.2 34.2 32.1 32.1 31.4 Yorkshire and The Humber 30.5 28.4 30.0 29.6 29.6 28.0 East Midlands 28.6 26.7 26.8 26.8 26.8 26.1 West Midlands 29.6 28.2 28.0 26.5 26.5 27.1 East of England 23.7 23.3 22.3 22.0 22.0 22.7 London 24.3 24.7 24.2 23.7 23.7 21.5 South East 21.7 21.4 21.0 21.5 21.5 21.3 South West 26.5 24.7 24.4 24.9 24.9 23.3
Source: Achur, J (2010), Trade Union Membership 2010, page 26 By English regions, the North West had the highest number of membership, compared with the North East who had the lowest. Membership numbers fell in all regions from 2009 to 2010, except London where it rose. Table 16: Trade union membership by region 2005-2010 2005 2006 2007 2008 2009 2010 North East 336 392 371 357 362 330 North West 912 956 955 885 864 851 Yorkshire and The Humber 645 596 638 626 589 574 East Midlands 532 608 493 215 490 469 West Midlands 648 533 616 570 589 567 East of England 553 734 533 527 530 530 London 711 754 734 130 652 669 South East 757 754 745 770 761 739 South West 546 522 523 527 544 488
Source: Achur, J (2010), Trade Union Membership 2010, page 26 3.11 Industrial analysis The table below presents a picture of trade union density by industry from 2009 to 2010. The industry with the highest density of members is Education (52.3 per cent) followed by Public administration and defence (51.6 per cent). This follows the same pattern of membership as recorded in 2009.

3. Trade Union Membership
Page 27 of 40
©2012 CfA business skills @ work
From 2009, membership in nearly all industries has decreased apart from in ‘Other services’ where it increased by 0.1 per cent and mining & quarrying where is increased by 2.8 per cent. Table 17: Trade union density by industry 2009-2010 2009 2010 Mining & quarrying 18.0 20.8 Manufacturing 21.2 19.8 Electricity, gas, steam & air conditioning supply 47.6 43.7 Water supply, sewerage, waste & remediation activities 34.7 33.1 Construction 14.6 14.5 Wholesale, retail trade and motor repair 12.4 11.8 Transport and storage 43.3 41.8 Accommodation & food services 3.9 3.8 Information & communication 12.9 12.8 Financial & insurance activities 20.5 17.4 Real estate activities 17.4 14.1 Professional & administrative services 11.6 10.4 Public administration and defence 52.2 51.6 Education 53.1 52.3 Human health & social work 41.9 41.4 Other services 14.8 14.9 Agriculture, forestry and fishing was removed due to a lack of data
Source: Achur, J (2010), Trade Union Membership 2010, page 28 Public administration and defence is the industry which has the largest number of trade unions (82.9 percent), followed by Education (81.2 per cent) and Electricity, gas, steam and air-condition supply (77.1 per cent). Agriculture, forestry and fishing have the lowest number of trade unions presents in the workplace (8.5 per cent). Figure 8: Trade union presence
8.5
10.0
22.5
27.3
27.3
27.8
29.4
34.0
40.7
40.7
42.3
57.2
61.5
63.4
77.1
81.2
82.9
0 10 20 30 40 50 60 70 80 90
Agriculture, forestry & fishing
Accommondation & food services
Professional & administrative services
Construction
Wholesale, retail trade and motor repair
Other services
Information & communication
Real estate activities
Mining & quarrying
Manufacturing
Financial & insurance acitvities
Water supply, sewerage, waste & remediation activities
Transport and storage
Human health & social work
Electricity, gas, steam & air conditioning supply
Education
Public administration and defence
Source: Achur, J (2010), Trade Union Membership 2010, page 31

3. Trade Union Membership
Page 28 of 40
©2012 CfA business skills @ work
3.12 Collective agreement Collective agreement is defined as the proportion of employees whose pay and conditions are agreed in negotiations between the employer and a trade union. The table below shows that full-time employees had a higher proportion of collective agreement coverage at 32.4 per cent compared with part-time employees at 26.5 per cent. Similarly, collective agreement coverage was higher for permanent employees at 31.1 per cent compared with temporary employees at 25.7 per cent. Collective agreement coverage was also higher in the public sector at 64.5 per cent than the private sector at 16.8 per cent. Females had a marginally higher percentage of collective agreement coverage (32.9 per cent) than males (28.8 per cent). Table 18: Collective agreement coverage, 2010 Status Contract
All Full
time Part time Permanent Temporary
All employees 30.8 32.4 26.5 31.1 25.7 Gender
Male 28.8 30.2 18.5 29.2 21.6 Female 32.9 36.0 28.7 33.1 29.0
Sector Private 16.8 18.7 11.4 17.2 10.7 Public 64.5 67.7 57.0 65.8 48.7
Source: Achur, J (2010), Trade Union Membership 2010, page 32

4. Drivers of Skills Demands
Page 29 of 40
©2012 CfA business skills @ work
The following sub-sections set out the key drivers of skills demand for Union Representatives and Professionals13.
The main drivers for the demand for union representatives and professionals are reported by unions and the TUC to be the:
replacement of retiring/leaving professionals and representatives It is anticipated that a large number of current union
representatives will be leaving the post due to retirement. As such there will need to be a large supply of appropriately trained individuals to replace those leaving the posts.
demand from union members on the skills they require to do their job employers needs and requests
Changes in the number and type of representatives needed i.e. Health and Safety. Equality and Environmental.
workplace changes Changes in the demographics of the workplace may lead to a
change in the requirements of trade unions. unionlearn/ union learning fund priorities union initiatives government and legal initiative.
The following are anticipated to be drivers of skill demand: o Government and Unionlearn targets on the number of individuals
who should be trained and the number of union learning representatives who should be in post by 2010.
o Union learning funding priorities o New coalition government initiatives, strategy and priorities o Changes in the UK employment / trade union law to do with: dispute and grievance procedures health and safety.
o Changes in European legislation on: working time directive agency workers directives acquired rights.
o Union modernisation fund initiates . As the above shows, the drivers of skills for trade union staff come from:
‘union members’ who identify the skills that are needed in their workplace and requests training in that area
employers who requires their trade union officials to have particular skills targets set out by government or other bodies which require union staff to
have particular skills or knowledge legislation and initiatives which require all union members to be trained up
with new knowledge or skills.
13 Ento (2009) Labour market intelligence for trade union professionals and representatives, page 24 -27
5. Market Supply
Page 30 of 40
©2012 CfA business skills @ work
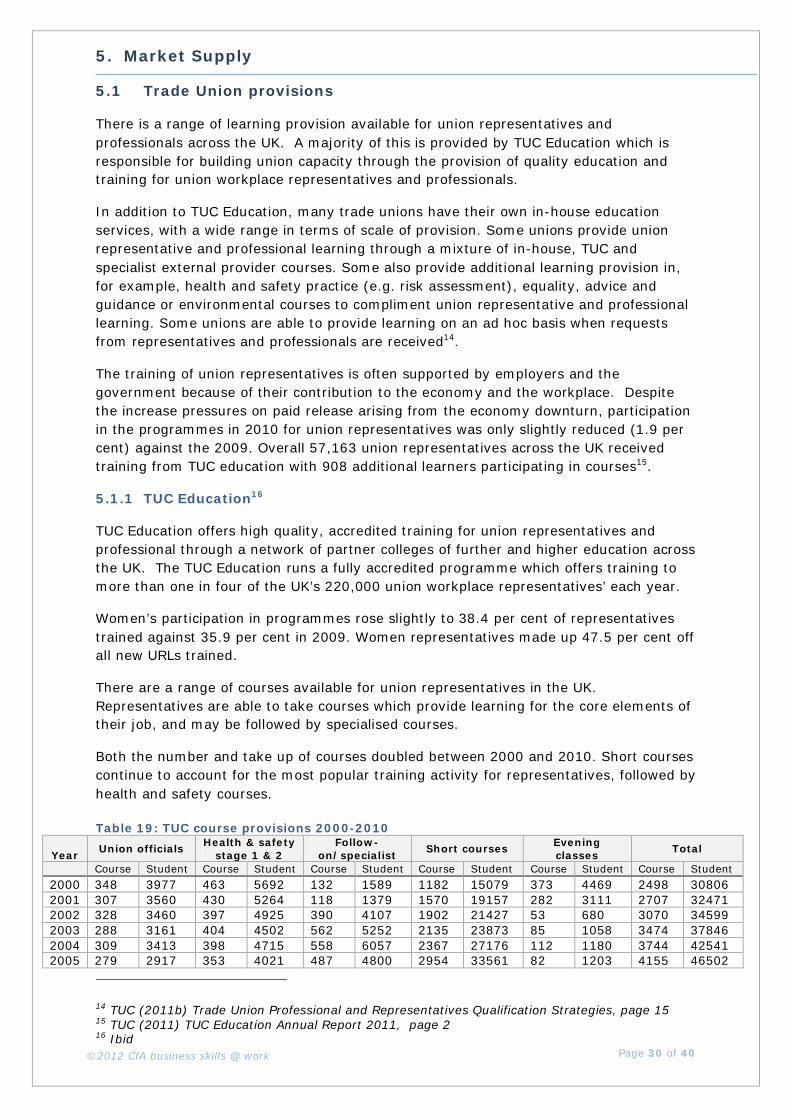
5.1 Trade Union provisions There is a range of learning provision available for union representatives and professionals across the UK. A majority of this is provided by TUC Education which is responsible for building union capacity through the provision of quality education and training for union workplace representatives and professionals.
In addition to TUC Education, many trade unions have their own in-house education services, with a wide range in terms of scale of provision. Some unions provide union representative and professional learning through a mixture of in-house, TUC and specialist external provider courses. Some also provide additional learning provision in, for example, health and safety practice (e.g. risk assessment), equality, advice and guidance or environmental courses to compliment union representative and professional learning. Some unions are able to provide learning on an ad hoc basis when requests from representatives and professionals are received14.
The training of union representatives is often supported by employers and the government because of their contribution to the economy and the workplace. Despite the increase pressures on paid release arising from the economy downturn, participation in the programmes in 2010 for union representatives was only slightly reduced (1.9 per cent) against the 2009. Overall 57,163 union representatives across the UK received training from TUC education with 908 additional learners participating in courses15.
5.1.1 TUC Education16
TUC Education offers high quality, accredited training for union representatives and professional through a network of partner colleges of further and higher education across the UK. The TUC Education runs a fully accredited programme which offers training to more than one in four of the UK’s 220,000 union workplace representatives’ each year.
Women’s participation in programmes rose slightly to 38.4 per cent of representatives trained against 35.9 per cent in 2009. Women representatives made up 47.5 per cent off all new URLs trained.
There are a range of courses available for union representatives in the UK. Representatives are able to take courses which provide learning for the core elements of their job, and may be followed by specialised courses.
Both the number and take up of courses doubled between 2000 and 2010. Short courses continue to account for the most popular training activity for representatives, followed by health and safety courses. Table 19: TUC course provisions 2000-2010
Year Union officials Health & safety stage 1 & 2
Follow-on/specialist Short courses Evening
classes Total
Course Student Course Student Course Student Course Student Course Student Course Student 2000 348 3977 463 5692 132 1589 1182 15079 373 4469 2498 30806 2001 307 3560 430 5264 118 1379 1570 19157 282 3111 2707 32471 2002 328 3460 397 4925 390 4107 1902 21427 53 680 3070 34599 2003 288 3161 404 4502 562 5252 2135 23873 85 1058 3474 37846 2004 309 3413 398 4715 558 6057 2367 27176 112 1180 3744 42541 2005 279 2917 353 4021 487 4800 2954 33561 82 1203 4155 46502
14 TUC (2011b) Trade Union Professional and Representatives Qualification Strategies, page 15 15 TUC (2011) TUC Education Annual Report 2011, page 2 16 Ibid

5. Market Supply
Page 31 of 40
©2012 CfA business skills @ work
2006 262 2784 339 3778 316 3032 2854 38585 79 933 3850 49112 2007 268 2667 355 3781 359 3730 3097 41085 130 1367 4209 52630 2008 213 2251 284 3105 302 4537 3359 46466 147 1298 4305 57657 2009 202 2155 394 3120 314 3105 4018 48483 155 1458 4983 58321 2010 210 2194 252 2710 246 2094 3510 47888 168 1467 4386 57163 Total 3014 32539 4069 45613 3784 39682 28948 362780 1666 18224 41381 499648
Source: TUC (2011) TUC Education Annual Report 2011, page 16 By region, the North West and the South & East were the two regions with the highest uptake of students, and greatest number of courses available.
The North West had the highest number of Union Official courses and student placements, as well as the highest number of short courses and students on them. By contrast the South & East had the highest number of courses and students on the Health and safety stage 1 & 2 and the specialist course.
Across all regions, Northern Ireland and the East Midlands offered the lowest number of courses, and had the fewest number of students undertaking courses.
Table 20: Union workplace representatives: course and students 2010
Year Union officials Health & safety stage 1 & 2 Specialist Short courses Total
Course Student Course Student Course Student Course Student Course Student South & East
42 391 53 562 61 644 834 14945 990 16542
South West 13 148 27 287 7 83 177 2358 224 2876 West Midlands
23 266 32 229 18 164 488 5452 551 6111
East Midlands
5 49 11 132 17 161 83 961 116 1303
Yorks & Humber
23 291 29 345 32 380 521 6094 605 7110
North West 59 555 47 516 26 517 943 116611 1095 13249 Northern 12 135 17 189 30 617 178 2063 237 3004 Wales 9 83 14 120 11 91 233 2845 267 3139 Scotland 19 202 30 307 21 211 187 2157 257 2877 Northern Ireland
5 74 2 23 3 36 34 819 44 952
Total 210 2194 252 2710 246 2904 3678 49355 44386 57163 Red indicates the highest course/highest student intake
Source: TUC (2011) TUC Education Annual Report 2011, page 13 - 14 Table 21 shows the number of students who took part in TUC short courses. Industrial relations/ collective bargaining was the most subscribed course, with 17,263 students undertaking it in 2010. Table 21: Short courses by students, 2010
Course title Students Industrial Relations/Collective Bargaining 17263 Health & Safety 8345 Induction 5997 Equality 2939 Skills/Languages 3175 Pensions 1181 Information Communication Technology 7076 Other 3379 Total 49355 Source: TUC (2011) TUC Education Annual Report 2011, page 15 In 2010, TUC Education had 7,808 students attending TUCs day release courses and 49,355 students attending TUC short courses.

5. Market Supply
Page 32 of 40
©2012 CfA business skills @ work
UNISON (19.94 per cent), Unite (14.32 per cent), PCS (11.21 per cent), GMB (8.25 per cent) and RMT (5.64 per cent) were the organisations most likely to attend the 10 day course.
UNISON (19.12 per cent), Unite (16.76 per cent), USDAW (11.74 per cent), GMB (11.10 per cent) and PCS (5.87 per cent) were the most likely organisations to attend TUC short courses.
Table 22: TUC course provisions 2000-2010 % of TUC course places % of total TUC membership 10 – day courses Short courses Unite 22.04 14.32 16.76 UNISON 22.40 19.94 19.12 GMB 9.81 8.25 11.10 USDAW 6.30 4.79 11.74 PCS 4.92 11.21 5.87 NUT 4.82 0.68 0.97 NASUWT 4.54 0.10 5.87 CWU 3.55 1.46 3.53 UCATT 2.08 2.02 0.59 ATL 2.05 0.24 0.37 Prospect 2.01 1.51 0.92 UCU 1.95 1.01 2.85 RMT 1.30 5.64 0.90 Community 1.10 0.46 0.35 EIS 0.98 0.14 0.04 FBU 0.72 3.36 2.75 Equality 0.60 0.06 0.10 CSP 0.59 0.06 0.21 POA 0.58 1.64 0.43 Accord 0.51 0.00 0.01 Source: TUC (2011) TUC Education Annual Report 2011, page 17 By membership, the majority of TUC course places were occupied by UNISON and Unite for both the 10 day course and the short course. They were also the two organisations which held the largest share of TUC membership.
5.2 Trade Union qualifications Trade union qualifications are currently provided by only one awarding body, the National Open College Network (NOCN). The following table shows the qualification currently available as per the Register of Regulated Qualifications (as of 21 February 2012). Table 23: Trade Union Qualifications
Qualification Number Qualification Title Type Level Awarding
Body
500/3426/1 Award for Trade Union Health and Safety Representatives QCF Level 1 NOCN
500/5574/4 Award for Trade Union Representatives QCF Level 1 NOCN 500/5621/9 Award in Trade Unions Today QCF Level 1 NOCN
500/5570/7 Certificate for Trade Union Health and Safety Representatives QCF Level 1 NOCN
500/5571/9 Certificate for Trade Union Representatives (stage 1) QCF Level 1 NOCN
500/5573/2 Award for Trade Union Health and Safety Representatives QCF Level 2 NOCN
500/5556/2 Award for Trade Union Learning Representatives QCF Level 2 NOCN
500/5576/8 Award for Trade Union Representatives QCF Level 2 NOCN

5. Market Supply
Page 33 of 40
©2012 CfA business skills @ work
500/5575/6 Award in Trade Unions Today QCF Level 2 NOCN
500/5577/X Certificate for Trade Union Health and Safety Representatives (Next Step) QCF Level 2 NOCN
500/5572/0 Certificate for Trade Union Health and Safety Representatives QCF Level 2 NOCN
501/0765/3 Certificate for Trade Union Learning Representatives QCF Level 2 NOCN
500/5627/X Certificate for Trade Union Representatives (stage 1) QCF Level 2 NOCN
500/5626/8 Certificate for Trade Union Representatives (stepping up) QCF Level 2 NOCN
500/5597/5 Certificate in Trade Unions Today QCF Level 2 NOCN
500/3420/0 Diploma for Trade Union Health and Safety Representatives - Occupational Health and Safety
QCF Level 2 NOCN
500/5551/3 Diploma for Trade Union Representatives – Contemporary Trade Unionism QCF Level 2 NOCN
500/5552/5 Diploma for Trade Union Representatives – Employment Law QCF Level 2 NOCN
500/7788/0 Diploma in Organising and Recruitment for Trade Unions QCF Level 2 NOCN
500/5550/1 Award for Trade Union Health and Safety Representatives QCF Level 3 NOCN
500/5607/7 Award for Trade Union Representatives QCF Level 3 NOCN 500/5607/4 Award for Trade Union Representatives QCF Level 3 NOCN 500/5598/7 Award in Trade Unions Today QCF Level 3 NOCN
500/5615/3 Certificate for Trade Union Health and Safety Representatives (next step) QCF Level 3 NOCN
500/5594/X Certificate for Trade Union Learning Representatives QCF Level 3 NOCN
500/5596/3 Certificate for Trade Union Representatives (stepping up) QCF Level 3 NOCN
500/7784/3 Certificate in Organising and Recruitment for Trade Unions QCF Level 3 NOCN
500/5569/0 Certificate in Trade Union Tutor Training QCF Level 3 NOCN 500/5613/X Certificate in Trade Union Today QCF Level 3 NOCN
500/5564/1 Diploma for Trade Union Health and Safety Representatives – Occupational Health and Safety
QCF Level 3 NOCN
500/5678/5 Diploma for Trade Union Representatives – Contemporary Trade Unionism QCF Level 3 NOCN
500/5568/9 Diploma for Trade Union Representatives – Employment Law QCF Level 3 NOCN
500/1345/X Diploma in Equalities for Trade Union Representatives QCF Level 3 NOCN
500/7787/9 Diploma in Organisation and Recruitment for Trade Unions QCF Level 3 NOCN
500/5593/8 Diploma in Trade Union Tutor Training QCF Level 3 NOCN Source: Ento (2009) Labour market intelligence for trade union professionals and representatives, page 68 Unions report that they are happy with the quality of provision available for their representatives and professionals. They state that it is sufficient, meets their needs and that their representatives and professionals are qualified to meet the needs of members17.
17 Ento (2009) Labour market intelligence for trade union professionals and representatives, page 120

5. Market Supply
Page 34 of 40
©2012 CfA business skills @ work
5.3 Trade Union National Occupational Standards The National Occupational Standards (NOS) for Trades Union Representatives and Professionals were first developed by the TUC in collaboration with the former Standard Setting Body Ento. The last review t was approved in August 2008. With the transition to the Qualification Credit Framework (QCF) in August 2010, a full NOS review was undertaken by CFA in partnership with the TUC in 2011 to ensure that the NOS were still fit for purpose and reflected the industry’s need. The most current suite of NOS are listed in Table 24. Table 24: List of Trade Union National Occupational Standards
Unit Title CORE UNITS
UC1 Represent the union and promote its policies
UC2 Develop, organise and contribute to the recruitment and retention of union members
UC3 Provide information and advice to union members UC4 Contribute to the effective administration of the union UC5 Support and contribute to the policy-making processes of the union UC6 Support activities and campaigns within the policies of the union UC7 Enhance the role of the union representative UC8 Promote equality and fair treatment for all union members
UC9 Establish and monitor equality policies and initiatives within the union and workplace
ORGANISING UO1 Maintain the efficiency of local union organisation UO2 Develop and support union organisation in the workplace
UO3 Plan, implement and co-ordinate local union participative structures and processes
UO4 Prepare and present information to the media UO5 Leadership in a democratic organisation
LEARNING UNITS UL1 Promote learning and union initiatives UL2 Develop a learning agenda and strategy for the promotion of union learning UL3 Support union members in planning and managing their learning UL4 Enable union members to access learning opportunities and resources
HEALTH & SAFETY UNITS US1 Represent the health and safety interests of those at work US2 Contribute to the control of risks as a union health and safety representative US3 Contribute to workplace health and safety committees
US4 Present health and safety cases to employers and assist in negotiations in the workplace
REPRESENTING UNITS
UR1 Support and advise on the representation of individual union member and collective interests
UR2 Contribute to the formulation and implementation of the union collective bargaining strategy
UR3 Develop union recognition rights with employers UR4 Establish and maintain union collective agreements with employers UR5 Contribute to the resolution of industrial disputes in the workplace

5. Market Supply
Page 35 of 40
©2012 CfA business skills @ work
UR6 Prepare for workplace negotiations UR7 Advise on workplace negotiations UR8 Support workplace negotiations UR9 Lead workplace negotiations UR10 Prepare and present cases on behalf of union members UR11 Provide specialist advocacy services on behalf of union members

6. Current needs
Page 36 of 40
©2012 CfA business skills @ work
This section provides an overview of the current skill needs of union representatives and professionals. There is no data available which provides a breakdown of the skill needs of the profession by nation. As such, this section present a UK overview of the skills needs of the profession.
6.1 Recruitment needs Unions have a varied approach to identifying their needs for union representatives and professionals. They:
recruit as needs are identified train anyone who would like to be a representative or professional identify needs to meet workplace agreements.
It is not possible to establish the exact number of Union Representatives and Professionals currently needed in the UK, as Unions are unable to provide this data and generic literature on skills demands do not have any data in relation to skills demand in this area. Most unions state that they have sufficient union representatives and professionals but could always use more. When vacancies occur they are not likely to be hard to fill. There is a greater need for trade union professionals and representatives in urban areas where there is a greater concentration of businesses/employers18 6.2 Competencies needed19 Union have identified competencies needed as:
recruitment and retention organising advising members in legal, contractual and professional issues casework it dealing with disciplinary and grievance issues representing members project management communication negotiation management and leadership policy development and implementation advocacy training and development equality health and safety pensions legislation and employment law partnership working
18 Ento (2009) Labour market intelligence for trade union professionals and representatives, page 28 19 TUC (2011b) Trade Union Professional and Representatives Qualification Strategies, page 18

6. Current needs
Page 37 of 40
©2012 CfA business skills @ work
continuous Professional Development (CPD) finance and budgeting
7. Future needs
Page 38 of 40
©2012 CfA business skills @ work
There is no data on the specific skills required by trade union professionals and representatives in the future, either UK-wide or by country20. However from the data that is available, it is anticipated that unions would:
recruit as needs are identified train anyone who would like to be a representative or professional identify needs such as to meet workplace agreements and other initiatives.
7.1 Recruitment needs In the future it is anticipated that trade unions representatives and professionals will be recruited as needs are identified. The age profile of union representatives and professionals shows that more than half of all trade union representatives and professionals are over 45 years. This is of concern because it means that a large number of experienced representatives and professionals will retire during the next 10 years. The unions will require considerable resource in recruitment and training/accreditation to maintain the optimum numbers.
7.2 Skill needs21 Unions have stated that the future skill needs for trade union representatives and professions will be the same as the current competencies needs plus:
reflecting the needs of our members when there are changes in how they work, for example home working
creative ways of recruiting and retaining members identifying, developing and encouraging more people to become reps partnership working developing positive negotiating relationships strategic planning.
7.3 Influences of future need Some unions identified the following which may influence the future needs for union representatives and professionals:
increasing membership, more recognition agreements the economic climate an increased emphasis on partnership working and developing positive
negotiating relationships strategic planning changes in education policy/sector specific legislation adult learning requirements member companies requirements.
7.4 Future priorities The priorities of unions are:
20 Ento (2009) Labour market intelligence for trade union professionals and representatives, page 29 21 TUC (2011b) Trade Union Professional and Representatives Qualification Strategies, page 19

7. Future needs
Page 39 of 40
©2012 CfA business skills @ work
to ensure that there are sufficient union representatives and professionals to:
o fully represent their members o meet employers’ needs and requests o meet the requirements of individual union initiatives, agendas and structures o meet the requirements of Government initiatives/requirements o recruit and replace union representatives and professionals who retire/leave
and reduce the average age of union representatives and professionals The above is taken from the 2008 labour market report undertaken by Ento. Due to the nature of data on trade unions, CFA was unable to provide an update on the future skill needs of the sector. However it is expected that budget cuts imposed by the government will have a significant impact on the future skills of trade union professional across the UK.

8. Bibliography
Page 40 of 40
©2012 CfA business skills @ work
Achur, J (2010), Trade Union Membership 2010. Department for Business, Innovation & Skills.
DTI (2007), Consultation Document: workplace representatives: a review of their facilities and facility time.
Ento (2009), Labour market intelligence for trade union professionals and representatives, Ento.
Industrial relations (2007) Introduction to Industrial Relations, http://industrialrelations.naukrihub.com/introduction.html, viewed 22 February 2012.
Legislation.gov.uk (1992), Trade Union and Labour Relations (Consolidation) Act 1992, viewed 31 January 2012.
Office of National Statistics (2011) EMP16: All in employment by status, occupation and sex.
The Certification officer (2011), Annual report 2010-2011. Certification Office for Trade Unions and Employers’ Associations.
TUC (2010) The Road to Recovery: how effective unions can help rebuild the economy. Trade Union Congress.
TUC (2011), TUC Education Annual Report 2011.Trade Union Education.
TUC (2011b) Trade Union Professional and Representatives Qualification Strategies. Trade Union Congress.