industrial engineering faculty master of sciences in ... thesis.pdf · industrial engineering...
TRANSCRIPT

POLITECNICO DI MILANO
Industrial Engineering Faculty
Master of Sciences in Mechanical Engineering
Design of a MPS planning process to plan order per order and implemented with the Lean organization approach.
Relatore: Prof. Marco GARETTI Co-relatore: Ing. Natalia DUQUE CICERI
Master thesis of: Romain LE MAREC Matr. 736994
Academic year 2009 - 2010

Index
1. INTRODUCTION............................................................................................... 6
2. THE COMPANY ................................................................................................ 9
2.1 AREVA ..................................................................................................................... 9
2.2 AREVA T&D ......................................................................................................... 10
2.3 RPV-PASSONI....................................................................................................... 11
3. THE PROCESS................................................................................................. 12
3.1 The product ............................................................................................................ 12
3.2 Assembly lines ........................................................................................................ 14
3.3 Manufacturing and assembling processes ........................................................... 17
4. STATE-OF-THE-ART ..................................................................................... 22
4.1 Operations management and planning over the different horizons.................. 23 a. General assumptions 23 b. Operations strategy 24 c. Design in Operations management 25 d. Planning systems 26 e. The Sales and Operations Planning 29 f. Master Production Schedule 35 g. Scheduling systems 38 h. Production Planning and its integration to production scheduling 39 i. Integrated Process of Planning and Scheduling 42 j. Just-in-Time 43 k. Integrated MRP/JIT systems 45
4.2 Key performance indicators and follow-up......................................................... 47 a. Performance key parameters 47 b. Key performance indicators 56
5. PLANNING SECTION .................................................................................... 61
5.1 The situation........................................................................................................... 61 a. External issues 61 d. Internal issues 62

Page 3
c. A complex planning strategy 63 d. Tactic planning “assets” 64
5.2 Sales and Operations planning ............................................................................. 69 a. Definition of the sales and production plans 70 b. Introduction of the past performance 73 c. Improvement of the Big Carta Olio charts 73
5.3 Master Production Schedule: tool and Process................................................... 74 a. general concerns 74 b- Low Voltage Line 76 c- High voltage line 84 d- MPS Process 98 e- Conclusion 107
6. BUSINESS PERFORMANCE....................................................................... 112
6.1 Business Strategy ................................................................................................. 112 a. AREVA strategy 112 b. RPV – PASSONI E VILLA strategy 115
6.2 Key performance indicators................................................................................ 117
7. CONCLUSION................................................................................................ 124
8. ACKNOWLEDGMENTS .............................................................................. 126
9. BIBLIOGRAPHY ........................................................................................... 128
10. ANNEX ............................................................................................................ 131
Annex 1: Product Mix ............................................................................................... 131
Annex 2: Bushings applications................................................................................ 132
Annex 3. MPS Low Voltage details .......................................................................... 132
Annex 3. MPS Low Voltage details .......................................................................... 133

Page 4
Tables of figures Figure 1: Representation of the different AREVA business unit……………………….9 Figure 2: Representation of the various activities of AREVA T&D………….............10 Figure 3: Traditional aspect of wounded core conductor of an oil-impregnated paper insulation condenser bushing…………………………………………………………..13 Figure 4: Representation of the shop floor and manufacturing flows…………………15 Figure 5: Winding machine in phase of paper drying................................................... 18 Figure 6: Autoclave……………………………………………………………………17 Figure 7: Winding machine in phase of paper drying…………………………………18 Figure 8: Operations interactions, adapted from “Operations Management”…………21 Figure 9: Planning system interactions………………………………………………..25 Figure 10: Planning Process Presentation in AREVA T&D…………………………..29 Figure 11: Description of the MPS time fences……………………………………….32 Figure 12: Porter’s Generic Strategies (adopted from www.mindtools.com) .............. 50 Figure 13: Typology of Manufacturing Structure and Types of Fit Between Manufacturing Structure and Business Strategy……………………………………….44 Figure 14: The three spheres of Sustainability………………………………………...45 Figure 15: Input and output of the operations planning and the production activities………………………………………………………………………………..54 Figure 16: Representation of an S&OP chart for the “Small Carta Olio” family............59 Figure 17: Expected workload for the “Small Carta Olio” family adopted from the S&OP for the sales persons…………………………………………………………….60 Figure 18: MPS inputs and outputs…………………………………………………....63 Figure 19: Detail of the machines used to process products of the 2 S&OP families running on the low voltage line………………………………………………………...64 Figure 20: Representation of the planning window (spreadsheet “Backlog”)…...........66 Figure 21: Representation of the planned workload in assembling…………………...69 Figure 22: End of production representation analyzing the late orders and the alignment S&OP/MPS…………………………………………………………………71 Figure 23: Detail of the machines used to process products of the 2 S&OP families running on the high voltage line…………………………………………………….….73 Figure 24: Detail of the capacity in case UHV to wind…………………………….…76 Figure 25: Gantt chart of the UHV batches assessing their impacts on the capacity………………………………………………………………………………...80 Figure 26: Representation of the planning window (spreadsheet “Backlog”)………...81 Figure 27: RCCP of the various resources performing the treatment………………...82 Figure 28: Entities interactions around the production and the planning……………..86 Figure 29: Gantt chart of the MPS planning process………………………………….89 Figure 30: Details of threefold aim of profitable growth, social responsibility and respect for the environment (adopted from www.areva.com) ..................................... 114 Figure 31: RPV manufacturing definition on the Porter matrix…………………......101 Figure 32: Trends current service rate vs. foreseen one…………………………......102 Figure 33: weekly invoicing share, actual/foreseen matching.................................... 122

Page 5
Tables Table 1: Detail of the capacity of the various workcenters on LT.....................79 Table 2: Detail of the capacity in the different workcenters on HT...................88 Table 3: Detail of the capacities with the winding saturated .............................89 Table 4: Features of the autoclave on the high voltage line...............................92 Table 5: Analysis of the demand entering in the autoclave A7 .........................93

Page 6
1. Introduction The manufacturing industry has grown up very quickly during the 20th century; it was born with the industrialization era illustrated for instance by the car manufacturer Ford with its T-model and it has gradually improved to become more integrated as regard its suppliers, its customers, the environment, etc. Over the 5 last decades the companies took a slight turn on their focus and their strategy and they decided to be market orientated, instead of being simply product-orientated of which the primary focus was the firms’ products, its useful skills, knowledge and systems that support these products. Until the eighties, the product orientation had still dominated and many companies failed to understand the change of the clients’ needs in an increasingly competitive marketplace. Hence, a major swing towards market-orientation has led to intensified market research and product ranges carefully designed to fit customer preferences.
To fulfil customer satisfaction, companies do not only leverage their new products freshly designed according to the market expectations because this is not a sufficient condition of success, contrary to what Henri Ford had stated earlier “A market is never saturated with a good product but it is very quickly saturated with a bad one.”[6]. However, orientation toward the product remains important in keeping an emphasis on quality, safety and investment in new technology. Successful firms admit the relevance of putting both approaches in phase. Products must start with the needs and wants of customers. These last points rely on the operations and beyond, on the production system competence because the production response to the demands from the marketplace is prone to provide the customers’ satisfaction.
Therefore the underlying issue would be the productivity of the manufacturing line, in other words its ability to efficiently transform raw materials into sellable outputs, what lays stress on the “five M” [5] (men, machines, methods, materials and money) that must be mastered to process goods and meet the clients' will.
When viewed as a process, a production system may be further characterized by its flows and/or its paces in the process. Nonetheless, “flows” cannot be reduced to the meaning of the physical throughput on the assembling line, work in stage

Page 7
of manufactures and finished goods but the information flow (paperwork) running during, before and after has to be taken into account as well. The first limit expressed by the production is its physical capacity; the channel of the production system strangles the company's desire to meet an expected level of outputs. The resources (men, machines, money) define this critical level that constrains the whole production system. The management of the information flows (driving the physical one) is so-called planning and it controls the system to achieve an acceptable output quantity. Even though the capacity of the system is the main factor in determining whether output expectations are met, the evaluation of the planning viability also depends on the qualitative factors. Quality here has the meaning of quality of the product, measured against some objective standard, includes the appearance, performance characteristics, durability, timeliness of delivery, cost, etc. In addition the production system evolves in a non-deterministic ambit and so, the planning cope with the disturbances inherent to the daily routine of the operations: lack of materials, defects, absenteeism, machine break-down, etc.
These events lead to discrepancies between the physical flow and the planned one, later on this could drive to an incorrect synchronization between its inputs and its output which could generate significant damages on production system performances; for instance an excessive inventory level, a non-optimized purchase policy, non-controlled work-in-progress level, and above all, the probable clients’ dissatisfaction. The production competence is set and ruled by the planning system, so it is a core element of a successful business since it interacts with the products and the customers. On the other hand, its decision guided the purchasing, the inventory level, and therefore it has a significant impact on the operating working capital.
Therefore, the opportunity to think to a planning system adapted to the production of a company which has a profile far from an academic case study sounded as an interesting and exciting experience and the following sections attempt to summarize what was done at RPV-PASSONI E VILLA during these last 8 months. The internship is entitled “Design of a MPS planning process to plan order per order and implemented with the Lean organization approach. Definition of a dashboard depicting the daily performances of the Operations”, and the thesis follows this topic as guideline for the various sections. The first two sections are devoted to understand the company profile through its presentation and a brief introduction of its product mix and its

Page 8
manufacturing process. Then, the State of the Art intends to give an overview of the topics dealt during the internship; to do so, it divides the literature review into two parts to describe how evolved the planning systems and how to evaluate the performance indicators. The core evokes the existing planning tools and then, it details the work done over the internship period. In a third time, the key performance indicators used today to assess production competence are discussed.
Page 9
2. The Company
2.1 AREVA
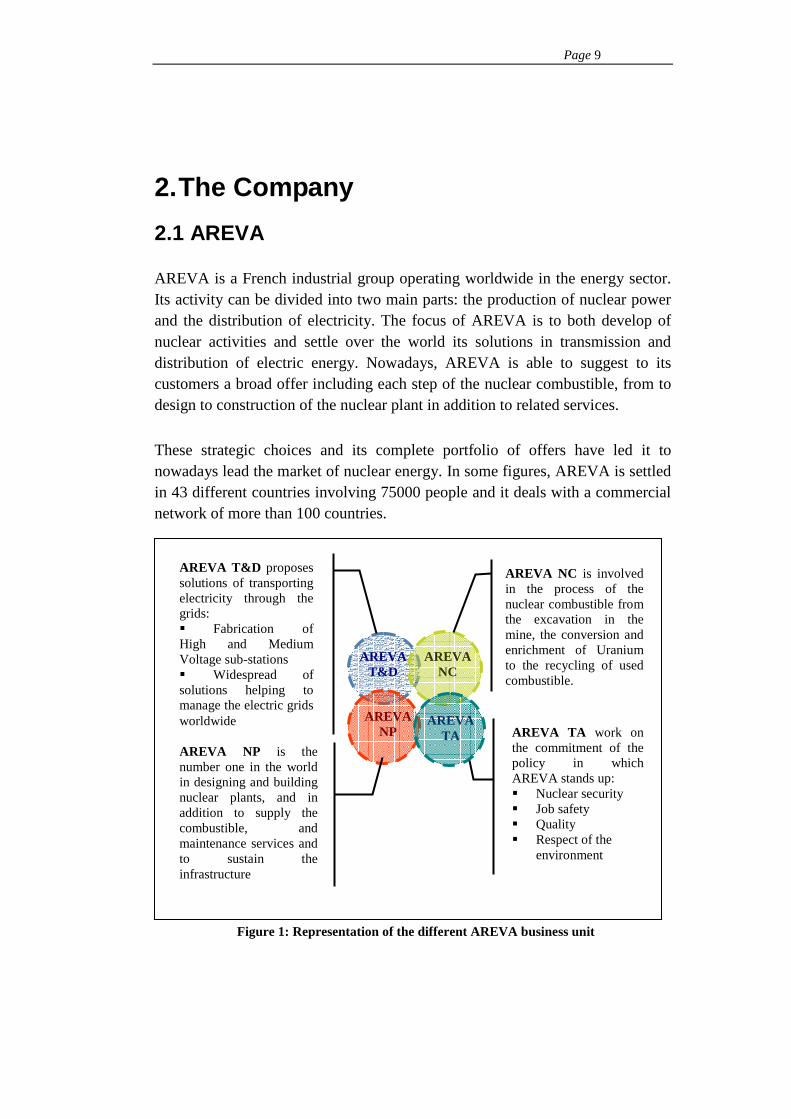
AREVA is a French industrial group operating worldwide in the energy sector. Its activity can be divided into two main parts: the production of nuclear power and the distribution of electricity. The focus of AREVA is to both develop of nuclear activities and settle over the world its solutions in transmission and distribution of electric energy. Nowadays, AREVA is able to suggest to its customers a broad offer including each step of the nuclear combustible, from to design to construction of the nuclear plant in addition to related services.
These strategic choices and its complete portfolio of offers have led it to nowadays lead the market of nuclear energy. In some figures, AREVA is settled in 43 different countries involving 75000 people and it deals with a commercial network of more than 100 countries.
AREVA T&D
AREVA NC
AREVA TA
AREVA NP
AREVA NC is involved in the process of the nuclear combustible from the excavation in the mine, the conversion and enrichment of Uranium to the recycling of used combustible.
AREVA TA work on the commitment of the policy in which AREVA stands up: � Nuclear security � Job safety � Quality � Respect of the
environment
AREVA T&D proposes solutions of transporting electricity through the grids: � Fabrication of High and Medium Voltage sub-stations � Widespread of solutions helping to manage the electric grids worldwide
AREVA NP is the number one in the world in designing and building nuclear plants, and in addition to supply the combustible, and maintenance services and to sustain the infrastructure
Figure 1: Representation of the different AREVA business unit

Page 10
Therefore, the company’s operations are classified in two principle activities that are the Nuclear and the T&D (Transmission and Distribution of electricity). The Nuclear can be split itself into three sub-parties: AREVA NC, AREVA NP and AREVA TA. The T&D is more independent since its work is quite different. The scheme beneath summarize this description.
2.2 AREVA T&D
After the brief presentation of the overall group AREVA, one will detail more about the sub-division in which PASSONI E VILLA depends on. However, AREVA T&D is currently being transferred by AREVA. This sub-division dedicated to the transmission and distribution of electricity holds today the third rank on its market behind ABB and SIEMENS Power, it employs 31,000. It aims at proposing to its customers reliable, efficient and environmentally-friendly solutions so as to improve the network stability and offer the electricity availability wherever. Therefore AREVA T&D develops products, equipments and utilities for its partners. It offers a broad portfolio of products and services and owns more 91 industrial sites over the world. Its activities are separated in
TRANSMISSION AND DISTRIBUTION
Substation equipment: such as high and medium voltage transformers, circuit breakers, disconnectors and instrument transformers.
Turnkey substations: bringing together the right mix of products, expert engineering and complete project management.
Network management : protection and control solutions.
Network consulting : asset management, refurbishment and spare-part solutions to manage electrical installations in a secure and efficient way throughout their lifecycle.
Figure 2: Representation of the various activities of AREVA T&D

Page 11
four different business units, which are: Product, Systems, Automation and Services.
RPV-PASSONI E VILLA, the company in which the internship was done depends on the Business Unit Product. It aims at producing all the required equipment to build and exploit the electric grids. Its products are organized in 8 different Product Line (PL), and particularly, the firm RPV belongs to the one so-called “Instrument Transformers”.
The international activity of Instrument Transformers manages all the High Voltage Instrument Transformers and it groups 3 sub-families in charge of the design, development and production the following equipments:
- Conventional and unconventional Instrument transformers
- Medium and high Voltage Bushings
- Circuit Breakers and disconnectors
2.3 RPV-PASSONI
In Italy AREVA T&D, through its Business Unit "Product" (Substation Equipment), is well-settled since it counts 5 industrial sites on this territory.
Initially PASSONI E VILLA was a family-running company founded in 20th century in Milan. It was specialized in the production of medium and high voltage equipments (condenser bushings, transformers). When in 2007 AREVA T&D wanted to widen the product portfolio of its product line (PL) “Bushing”, they bought PASSONI E VILLA and it decided to make the production of bushing the core activity of what became RPV-PASSONI. By this acquisition, the PL “Bushing” made a huge step forward; it has become capable to offer condenser bushing until 1700kV while proposing a broad product mix to its clients that cover all the applications. By now, its operations capacity is around 8000 bushing per year and its turnover was 30M€ in 2009.

Page 12
3. The Process
As a part of the study is dedicated to the definition of a Master Production Schedule (MPS), it is necessary to present the manufacturing process and give an accurate description of the assembly lines in order to well-understand how should be carried out the planning process. As it will be presented below, the process is stressed by the product features as well as technical as dimensional. So in a first part we will present the product, “Condenser bushing”, explaining what a transformer bushing is, how it works, and what the RPV products offer is.
3.1 The product
After PASSONI E VILLA was bought by the sub-division AREVA T&D, the company focused only on transformer bushings. This kind of items is used to insulate a wire under high tension (from one kilo to a thousand of kilovolt (kV)), high current while they must pass through a wall or switch from one medium to another. So they insure that the electricity will not spread over the medium that it crosses. It is located at the interface of two medium, so we can have different patterns: Air to Air, Air to Oil, Oil to Oil, Oil to Gas, etc.
Based on the given configuration and on the characteristics on electrical grid on which the bushings are connected, one uses different technologies. The condenser bushings can be classified by design as follows:
- Oil-Impregnated paper insulation, with interspersed conducting (or condenser) layers of oil-impregnated paper insulation continuously wounded with interleaved lined paper layers. They can work under tension up to 1700 kV for power transformers (Oil-to-Air, Oil-to-Oil, and Oil-to-SF6) and as through-wall insulators.
- Epoxy Resin-bonded paper insulation, with interspersed conducting. They work up to 170kV for high current step-up transformers, power transformers (in case Oil-to-Oil and Oil-to-Air), and AC generators and finally they are also used in case of through-wall insulator.

Page 13
- Resin-Impregnated paper insulation, those have the major insulation insured by impregnated with Epoxy resin. They can be used up to 170 kV in case of power transformers and for through-wall applications.
- SF6 Insulated condenser bushings, they are chosen for circuit breaker such as GIL and GIS and dead tanks where the medium are Air-to-SF6 and be executed till 550 kV.
The product mix and applications are presented in Annex 1 and 2.
In a nutshell, the interspersed foils of aluminium, so-called screens behave as voltage equalizer and they enable to get an electric stress control. The screens are placed coaxially inside the wounded part surrounding the conductor and they provide the optimal balance in the field gradient all along the bushing between external flashover and internal puncture strength (See Figure 3.). The performance offered by the final product will mainly depend on the quality of manufacturing and the cleanup of the wounded part around the central conductor.
Bushings must respect some standards giving the requirements of which should be its mechanical and its electrical performances. It mainly stresses the quality of the core of the bushing: the wounded part around the core of conductor. It could be roughly described as below:

Page 14
3.2 Assembly lines
Three different assembly lines which are the Low-Voltage Line (ISBT), the High-Voltage line (ISAT) and the Gas one (ISGA) spread the workload.
On the first one is managed two general families that correspond to the two main insulating solutions produced in RPV and introduced above which are Oil Impregnated Paper, named “Small Carta Olio” and Epoxy Resin Bonded Paper named “Small Carta Resina”. This latter will be, indeed, progressively substituted (within the first semester 2011) by a new technical solution, so-called Resin Impregnated Paper (RIP), also grouped in this general family of Small Carta Resina.
Porcelain or composite cover
Flange
Araldite
Paper
Voltage Equalizers
Voltage Tap Stud
Figure 3: Traditional aspect of wounded core conductor of an oil-impregnated paper insulation condenser bushing
Page 15
The assembly line ISAT only deals with Oil Impregnated Paper insulator but two subdivisions are distinguished. On one side all the bushings having a tension lower than 800kV are clustered and one will call them “Big Carta Olio” while the bigger ones (> 800kV) called “Ultra High Voltage”. They were separated because the Ultra High Voltage family is launched on production in batch and impact significantly the capacity of the ISAT line, this issue will be developed further.
Finally, the ISGA line only produces “PABS” referring to gas-SF6 insulated bushings.
These three lines run independently one to each others; only the winding workcenter is common for the “Small Carta Resina”, “Small Carta Olio” and “Big Carta Olio” but they have a the usufruct of specific winding machine, then the lines merge again at the moment of the tests (sealing, electrical, etc). RPV has three tests rooms:
- SPI dedicated to bushing with operating tension lower 170kV
- SP245 operating until 245 kV
- SPE able to perform tests up to 1700 kV
In addition, the distribution of the bushings over the three tests rooms is based on their availability and the technical criteria of the bushing: size, tension.
The following map the layout helps on understanding the flow of the parts over the Low Voltage and High Voltage lines.

Page 16
Tests room SPI (LV)
Winding (LV)
Treatment (ovens)
Assembling (LV)
Pre-assembling (LV)
Treatment (oven, autoclaves) (HV)
Assembling (High Voltage)
Winding (HV)
Gluing/Cementing (HV)
Tests room SPE (HV)
Figure 4: Representation of the shop floor and manufacturing flows
Page 17
3.3 Manufacturing and assembling processes
RPV offers a broad choice of condenser bushings, nowadays, it counts hundreds of different references and with the view to satisfying as many customers as possible (this is an absolute necessity of the market). But on the other hand, it prompts several issues on operations management such as: the challenge of implementing standards, the high variability of the processing times and components (consequently a large number of Bill-of-Materials), and the skill-level of the operators, etc. In the following section, the process features will be discussed in three points; firstly the common characteristics of the assembly lines shared between the products, then their differences and finally the induced impact on their scheduling.
1. The assembling process, shared by every product unless they are not fixed up, can be roughly described in five stages: winding, autoclave, assembling, testing in lab, finishing.
- The winding consists in wrapping around an aluminium or copper tube a particular paper and creeping aluminium foils in between layers. As it will be discussed further on, the paper is used as an insulator, so the contained moisture must be removed as much as possible. Before it is wounded, the paper roll is preliminary unrolled over dryers (fans blowing warm air), and after the winding process, the parts go to autoclaves or ovens if they run on the “High Voltage” line or they go to the assembling. This element is the core of the condenser bushing so its quality as well as its cleanup must be executed perfectly.

Page 18
Figure 5: Winding machine in phase of paper drying
- The autoclave or oven aim is to get rid off the water contained in the wounded paper so as to insure to the high insulation capacity of core part. To do so, the wounded part with the conductors, so-called PC in RPV, are put together inside a large hole so-called autoclave or in individual pipes gathered in an oven, and they are enclosed from one week to 6 weeks according to the thickness of paper layers.

Page 19
Figure 6: Autoclave
- The assembling consists in enclosing the PC in a “package” made of porcelain or resin epoxy or composite and a flange by means of a press. Later they filled them up with oil or gas SF6.
- The electrical tests are performed in test rooms where one executes several tests on the bushing in order to verify their conformity with the norms and other customers’ requirements. The performed tests are of three types: sealing, electrical and Megger one. This stage is the watchdog of the process since here, in accordance with the required norms one decides if the bushing can be sent to the customer or must be fixed up in order to fulfil the requirements later on.

Page 20
Figure 7: Test room SPE (in background device simulating wet test)
- The finishing performs the customization of the bushing and “closes” it once the tests have been executed.
The stage of assembling and autoclave/oven is swapped for the Small Carta Olio. The Big Carta Olio bushings enter in the autoclave or ovens once they are wounded, then exiting it they are assembled to and finally filled up this oil whereas the Small Carta Olio bushing are first assembled and then they are dried and filled in the ovens with their cover around.
2. It can be easily understood that the process may differ from one product typology to another owing to their inner features and customers’ requests. Indeed this latter has the possibility to customize its bushing on some references, for example it can select a composite surrounding instead of brown porcelain.
Three main differences are identified:

Page 21
- Technical solutions, means the families: OIP, RIP, GAS, ERPB. The technical solution involves applying different processes, made of different parts and raw materials. For what concerns the ISBT
- The size of the bushing has a huge incidence since the bushing height can vary from half meter to about ten meters. The way of carrying and managing all along the process will be really different.
- Norms and customers’ request or origin imply large differences in terms of throughput time in the test rooms.
3. These differences from either a technical or a size standpoint will impact the smoothness of the flow along the production lines. Therefore the pace of the lines is rather difficult to assess and it implies a correct understanding the processes and a precise and careful load/capacity in phase of planning as it will be explained in a further section. On ISBT, the main issue is the mix between the references and families (OIP, ERBP and soon the RIP) at the assembling workstation; we observe large differences in the tack times from one reference to another. The size will not have such a significant impact even if some items, wider than the average, prompt a reduction of the capacity of the autoclave since they occupy it more. Even though ISAT works only with OIP, the interactions on ISAT are more complex to manage. First, owing to the absence of a test room associated to ISGA, the PABS assembled there, merge toward the ISBT or ISAT test rooms according to their characteristics (tension and dimensions). Second, the bushings grouped in UHV family are launched in batch. This family has a longer throughput time. In addition, during some critical jobs they significantly lower the average pace of the production flow. For instance, a complete batch of UHV (16 800kV bushings or 9 1100kV bushings) totally fills one autoclave and so nearly cut by half the total autoclaves capacity during a period of 40 days. When a complete batch is assembled and tested, the biggest test room (SPE) available capacity is nearly equal to zero. It can be actually noticed that the tricky point of ISAT planning is the shift of the bottleneck along the line related with the presence of the UHV batches. These interactions between the batches of UHV and the other Big Carta Olio on ISAT will be further discussed in the section dedicated to the planning (cf. 5.3.c High voltage line).

Page 22
4. State-of-the-art
The introduction presented the aims of the internship that are the design of a Master Production Scheduling (MPS) and the definition of a dashboard depicting the daily situation of the production in RPV. The MPS is a planning tool dedicated mainly to the operations team to assess which orders are to deal with, during a period of few months while the dashboard is used as a tool offering an insight of the overall activities for not only the operations managers but also for the other entities of the company. Through a literature review, one will attempt to propose a State-of-the-art of the works already done in these fields. In a first section the issues regarding the planning will be developed with further details about Master Production Schedule then, a second section will be devoted to the performance indices and the measurements in order to respect the guideline of the internship topics.
The first section will start from a general description of the operations management so as to have a general sight of the elements interacting with the Operations activities. Next, it will gradually drop into the details of planning, unfolding the various milestones of this process from strategic planning to the tactic one and at last the production scheduling stressing each of them to well-understand how they communicate and interfere each other. Progressively the state-of-the-art orients the analysis toward the core of the thesis: the planning of production at the MPS level. One will describe how the planning committed on the MPS level influences with the material procurement planning and they are synchronized, and finally it will see in a nutshell, how MPS can be put in phase with the Just-in-Time system set up on the shop floor.
Furthermore, the second section will focus on the performance of the operations. This part attempts to show how important it is to lean the bottom line throughput and the current value of the ongoing production based on the actual companies needs to compete nowadays. That enables to define a set of relevant measurements and indices to provide a clear status overview of the daily operations activities.

Page 23
4.1 Operations management and planning over the different horizons
a. General assumptions
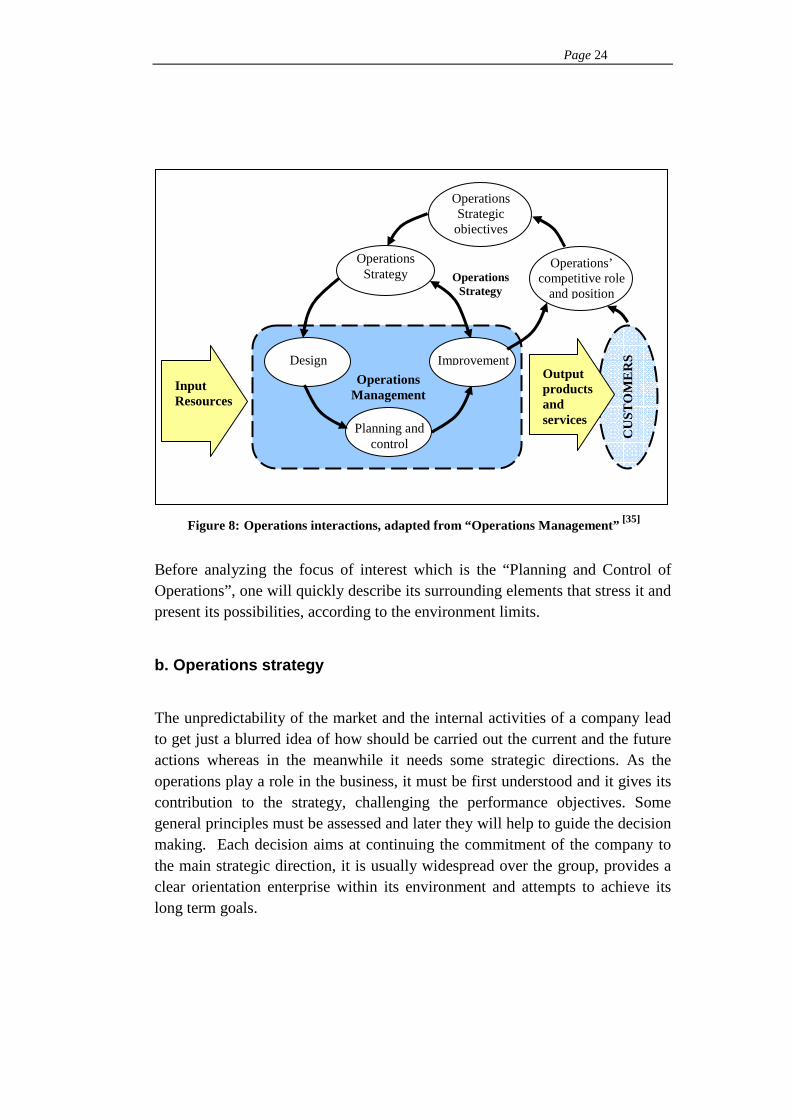
Whatever the market and the activities of a company, all operations produce goods or services creating a process which convert inputs (for instance a set of raw materials or information) to produce outputs. The nature of operations implies this transformation process model which targets to satisfy the needs of the company’s customers. All the activities share important implications for how the operations need to be managed. Their functions are to be effective; it must use its resources efficiently to produce goods or service filling the satisfaction of their customers. The quality, the creativity, the ability of putting the market innovative solutions are the keys of the competitive advantages, but an effective operation gives to fulfil the organization’s long-term strategic goals. That is why the operations management has to be fully chased and handled. Obviously, this definition remains to general and must be detailed according to the types of production, the activities, and the size of the companies… The proposed guideline is mainly inspired from the Operations management insight introduced by Slack, Chambers, & Johnson [35].The scheme beneath provides a rough idea of the operations management in its overall context, including the links between the company, its shareholders and its stakeholders.
Page 24
Figure 8: Operations interactions, adapted from “Operations Management” [35]
Before analyzing the focus of interest which is the “Planning and Control of Operations”, one will quickly describe its surrounding elements that stress it and present its possibilities, according to the environment limits.
b. Operations strategy
The unpredictability of the market and the internal activities of a company lead to get just a blurred idea of how should be carried out the current and the future actions whereas in the meanwhile it needs some strategic directions. As the operations play a role in the business, it must be first understood and it gives its contribution to the strategy, challenging the performance objectives. Some general principles must be assessed and later they will help to guide the decision making. Each decision aims at continuing the commitment of the company to the main strategic direction, it is usually widespread over the group, provides a clear orientation enterprise within its environment and attempts to achieve its long term goals.
Operations Management
Operations Strategic objectives
Operations Strategy
Input Resources
Planning and control
Design
Operations’ competitive role
and position
Operations Strategy
Improvement
CU
ST
OM
ER
S
Output products and services
Page 25
The strategy, in the recent years, aims no more at standing the fluctuations and coping with disturbances affecting the company or its environment but instead it attempts to understand the root causes and make fit its plans with. One of the main concerns of the strategy will be the performance objectives which will be strongly influenced by the customers. Operations strategy should try to satisfy their expectations through the 5 performance objectives which are:
- Quality
- Speed
- Dependability
- Flexibility
- Cost
But they must cope with other factors such as the specific needs of the organization’s customers group and the activities of the organization’s competitors. All these requirements go directly to influence the operations strategy decisions making. Whether it is clear that the preferred strategy will come down to the workshop later, it is necessary to understand how it is transformed from a goal to a set of tangible decisions influencing for example the operations
c. Design in Operations management
The product design and the process design are interrelated because even the smallest changes on the product design could lead to deep change in the way to produce the item. Reciprocally, the design of the process stresses the products design and bounds the freedom of its designers. Under some conditions it would be really convenient to overlap these two activities, the product and its process design. As every decisions taken during the design of the product (or service) and the process could impact on the part. The paper “Marrying Product and Process Design” [7] puts in evidence the relevance of associating these jobs:

Page 26
Developing manufacturing processes early in the product-definition phase ensures that product designers benefit from manufacturing knowledge to produce high-quality products quickly and at low cost. Working concurrently in this manner prevents the problems that usually develop when product design and manufacturing processes are developed in isolation.
For instance the standardization and the modularization of the products are carried out by designers in order to improve the process. The standardization will attempt to reduce the complexity and therefore the costs sharing parts or sub-parts between different items.
The design of the process is imposed by the volumes to produce, the variety of the products, but some other considerations can be taken into account such as the strategy implies by the company. In manufacturing 4 different types exist:
- Project process
- Jobbing process
- Batch process
- Mass process
- Continuous process
From the top to the bottom, one deals with larger volumes and higher varieties of items and obvious the flows, the layout will look totally different.
d. Planning systems
The planning is the key point of the production, it provides the pace and monitors the bottom line throughput as well as it attempts to grant the company's decisions with its clients' desires. Nowadays it is a software-assisted job however its fundamental approach comes off multiple-staged method that implies a perfect understanding of the productive process. E.M Goldratt has written a successful novel “The Goal” [18] in which he expanded his theory of

Page 27
constraints (bottlenecks) and from the positive testimonies of the production managers who had read it, he has concluded by the following comment:
By now the letters, and even more so the visits, forced me face an unpleasant fact. Reality showed that the software, my cherished baby that I was so proud of, was an impediment to achieving results. The plants that were exposed only to the Goal and succeeded to put it to work achieved better results and in a shorter time than our clients who had spent so much money on our software and education. How come? It took me some time to figure out, but at last I couldn’t escape a simple explanation: the efforts to install the software distracted the plant people from concentrating on the required changes in fundamental concepts, measurements and procedure. [18] (p.342)
After one has been seen the strategy plan, its orientation, and the set of associated decisions, one enters in the tactic phase. The operations management duty is to plan and control the production with a view to matching the customers’ demand in accordance with the company's capability and its production capacity.
It must find the adequate balance between capacity and demand to satisfy the customers but without breaking this unstable equilibrium; being in over or under capacity could drive to disastrous situations. But the production planning can be also seen from an economical point of view as the challenge to fulfil customers demand at a minimum total cost. In early twenties, H. Ford nicely illustrated this issue telling “I am looking for a lot of men who have an infinite capacity to not know what can't be done” [6].
The decisions taken by the planning and control will involve various functional managers for several reasons:
- The capacity decisions have a significant and wide impact on the whole company.
- As it was explained previously and illustrated (see Figure 8.), the generic functions provide inputs to the planning process.

Page 28
- Each business has to make fit its planning and control the capacity of its own “micro-operations” in order to work according to the main operations function.
The goal of the capacity planning is to supply an appropriate capacity to a given level of demands at a general and aggregated level so as to satisfy them. This stage is the cornerstone of operations management because afterward, one will deal with the inventories. Once again a good balance will have to be found between the lowest acceptable levels (mainly to limit the increase of the amount of working capital, preventing the inventories from being obsolete, etc) and the sufficient level of stock (to supply the items, on-time, to be produced). Here we observe the overall chain between the suppliers and the customers, where the planning will attempt to match the supply with the demand while the inventories will enable to smooth the production flow behaving as buffers.
Therefore the operations planning progressively shifts from a tactical planning to an operational, in addition making analysis from long term data to medium-short term ones, gradually reducing the level of aggregation of the families. After the definition of a clear strategy one goes down from one level to deal with tactic issues based on the market data and available resources. The following sections will be dedicated to the introduction of the two main planning tools which are the Sales and Operations Planning (so-called S&OP) and the Master Production Schedule (MPS) included in the tactic stage. The tactic planning insures the joints between the long term policy, the will of the management teams and the activities performed daily in the plant. The overall outline of the planning process is illustrated below:

Page 29
e. The Sales and Operations Planning
While opening the Sales and Operations Planning section of “Operations Management for Competitive Advantage” [32], the authors has introduced as followed:
“Back orders, dissatisfied customers, high inventories, late shipments, finger-pointing, cash-flow problems, demand and supply out of balance, missing the business plan. This is the norm of many companies. It does not, however, have
Physical flow Information flow
Procurement Production Distribution Sales
• Purchase program • Suppliers choice • Cooperation
• Plants locations • Production
system
• Physical structure of the distribution network
• Marketing plan • Strategic Sales
plan
• Sizing the work
• force
• Assessment of the needs
• MPS
• Definition of the capacities
• Distribution • Medium term
sales
• procurements
• Lot size computations
• Settings of machine
• Replenishment of the warehouse
• Transport plan
• Short term sales plan
ST
RA
TE
GIC
T
AC
TIC
O
PE
RA
TIO
NA
L
Figure 9: Planning system interactions, adapted from “Operations Management for Competitive Advantage” [32]

Page 30
to be that way. Today many companies are using a business process called Sales and Operations Planning (S&OP) to help avoid such problems.”
The S&OP could be also defined as the “Mean to gradually accomplish the Annual Operations Plans (AOP) targets by linking monthly sales and marketing planning directly to the operations side of a business” in “Orchestrating Success: Improve Control of the Business with Sales & Operations Planning”[19]. The name itself shows that it is more than a production planning but instead, a function to coordinate all the critical activities of the supply chain. S&OP provides an efficient mean to coordinate all key functions in a Unit and therefore enables to manage risks on uncertainty on the long term. In other words, the S&OP must:
- Establish the objectives of the different operations functions
- Develop a better balance for the whole supply chain
- Challenge the Sales/Marketing, the costs, the production plans and the financial objectives of the inventories
- Develop the strategic objectives
This work is performed thanks to the known resources and features of the micro-operations such as financial resources, capacity, production rate, procurements, working costs and those latter are conditioned by the various plans (procurements, suppliers, inventory and distribution planning…). The sales are unpredictable data; they can fluctuate randomly and suddenly especially while the time horizon is 12 or 18 months that is also a reason why S&OP works at a high level of aggregation, it is much easier to know how larger families of similar product should be sold. Ideally, one attempts to forecast the sales in a long term it provides an idea of could be the workload and the resources requirements over the analyzed period. Unfortunately, Sales scope fluctuates while the operations systems is rather stiff, (fixed capacity of the machine, fixed labour, etc) and it may wonder how the production system capacity could cope with the sales variations.
S&OP is a process that rules commitments from principally the Sales and the Operations management, with a view to proposing reliable and relevant decisions, S&OP has three key stages:

Page 31
- Definition of the S&OP tool
- S&OP Pre-meeting
- Executive S&OP meeting
Definition of the S&OP tool
In their article, Genin, Lamouri, & Thomas [19] have described two different tools to process the S&OP. Usually S&OP is done on spreadsheets to realize a graphical analysis that is simple and easily readable. Before the decision meeting, the S&OP protagonists of the firm withdraw different potential scenarios for each family of product or for the whole company by means of iterations. In this case the S&OP plans are build up in 5 steps:
1. Evaluation the monthly demand (usually 18 months) gathering the orders, the forecast, and the pending offers.
2. Evaluation the monthly capacity referred to the standard working time, overtime and subcontracting.
3. Estimation of the labour costs and overhead costs…
4. Strategic assessment of changing labour force or inventories level
5. Development of alternatives and balancing total costs
The graphical method cannot generate the different strategies but instead it helps to illustrate the ideas to figure out the feasibility and impacts. This approach got an overwhelming acceptance within the companies decision makers until now even if it seems a raw one.
Another approach consists in using linear programming. First it must be decided the parameters taken into account. Then, the aim is to minimize the function making the sum of the assumed costs factors. In the example developed in the paper, case study of the company “Vallourec Precision Etirage” (Steel tube supplier for automotive industry), they considered the costs of production in overtime and for non production, subcontracting, inventories, backlogs. Then

Page 32
each factor is ruled by an equation or an inequality. For instance the stock level cannot be higher than the stock capacity.
This method does not require so powerful solver and it could be executed under the Excel solver.
The main advantage of using the Linear Programming is to generate automatically an optimum solution taking into account multiple factors, such approach cannot be done by the graphical method. However in the case study they showed that if an event occurs on production, the optimal solution given the day the next day might diverge a lot regarding to the one given the day before. In case of S&OP, this kind of drawback is really critical and it cannot be used without being aware of its limits since the solution provided at first glance led to long or mid-term decisions and actions.
By definition the S&OP is the decision tool orienting the choice in actions of the firm; it assesses the capacity levels and the decisions that must be applied on the MPS. Thus, the suggested scenario must be robust to changes since modifications could be expensive later on. Consequently the mathematical optimum will not be selected by the decision-makers; they will prefer an “average” plan stable under variability. Nonetheless, they offer the possibility to better-simulate the opportunities offered by the planners’ levers what is nearly impossible under a simple graphical method.
S&OP Pre-meeting
During this meeting, only the Sales and Operations meet, together they will first check the data. Then, they will check, validate the plans suggested by the first step of the process, or eventually they assess new ones. Sales and Operations managers discuss each other to agree in order to solve discrepancies on plans before defining recommendations for future decisions.
Executive S&OP meeting
This monthly process ends with a high-level meeting where the medium-long term key decisions are made, and it involves the general management, sales, operations, finance and product development. The aim of this closing meeting will be to make agree to all the parties of the various areas of the company “On

Page 33
the best course of action to achieve the optimal balance between supply and demand” as suggested by Chase and Jacobs [32]. During it, the operational plan must put in line with the business plan, and must be consistent with the budget. Then everybody must validate the new S&OP and grant their commitments. Finally, a minute-of-meeting formalizes and summarizes all the actions and decisions previously shared.
Once Sales and Operations are coordinated around a common guideline, from operations point of view, the production plan goes further down to MPS. Nevertheless, the assumptions taken into account in S&OP (time bucket of a month, aggregate level of the families, rolling horizon…) impose to check several parameters before dropping down the production plan into the MPS level. This task would be perform by an aggregate operations plan and in the same time a clear knowledge of the internal and external factors, related to the production activities, will be required and will be supplied by the production planning environment. These links are illustrated on the following representation:
Sales Plan
SALES AND OPERATIONS (AGGREGATE) PLANNING
Aggregate operations
plan
MR
P
Production Planning Environment
(Rough Cut Capacity Planning)
SALES AND OPERATIONS (AGGREGATE) PLANNING
Figure 10: adapted from a sketch presented in “Planning Process Presentation in AREVA T&D” (F. Gsell, 2010)

Page 34
The aggregate operations plan targets the optimal combination of the production rate with the current and future work force level and the available inventory in house. To do so, it relies on the demand forecast over the rolling horizon a bit shorter than the one considered in the S&OP. It attempts to determine how best to meet the requirement though a minimum cost and the resources on hand. Then, the work load and capacity on the lines can vary by effects of internal and external factors. As for the outer one, they do not depend usually on the production managers unless sales and operations have a really close relationship. In this case, they can find a strategy to fill up the “holes” within the workload by promotional offers or to smooth out the production system over the year in case of seasonally demand. Regarding the internal factors, the levers are different and they are no more commercial. Indeed, in a short term the capacity is nearly fixed nevertheless, the production planner can get out some flexibility in managing these factors by choosing to make sub-contracts for part of the production activities somewhere else or by implementing production planning strategies; three main models exist:
- Chase Strategy is based on hiring and laying off workers to match load and capacity. Obviously there are some issues of fast adaptation of the operators and in the management of motivational impact.
- Stable workforce – Variable hours proposes to vary the capacity by a flexible number of scheduled worked hours or overtime. It provides workforce stability and avoids tangible costs of hiring and firing as it could be in chase strategy.
- Level strategy, the output remains steady (same number of worker and worked hours) and when a discrepancy between capacity and produced orders is expected, inventories are used to absorb it.
From these data the feasibility can be check by means of Rough Cut Capacity Planning. Beyond the need of having a good correlation between the load and the capacity, the aggregate operations plan stresses on the relative costs of production. It would be wrong to imagine that the production costs are fixed, and beside the basic production cost, other features could vary such as the costs associated with the level of production (cost of hiring and firing people for instance), the inventory holding costs (in it are include for example the cost of storing, the obsolescence, the insurance…) and another relevant one, but less

Page 35
tangible, is the back ordering costs (penalty of late shipment, loss of credibility among the customers…).
So this preliminary task would be as a levelling and a translating process to convert from the S&OP decisions in what is to be produced weekly at the level of MPS, in finished goods and no more in aggregate families, in terms of production plan, workforce availability, production rate, targeted invoiced order, etc.
f. Master Production Schedule
Below the S&OP, the MPS follows. S&OP targeted to draw the foreseen of the Sales plan and the production one in order to somehow, challenge these entities of a company. However the MPS would have logic of contract aiming at “freezing” the production and the quality of service with which will be delivered the final product to the customers. As it acts at the interface of the Sales Service and the production management it offers the basis for the discussion between these protagonists. It is the tool to realize the commercials’ objectives. That will be through the MPS we will measure the feasibility of a planning because the MPS, established in advance, gives the details for each item, in which quantity to produce it and where place it, in the time buckets. In the E.M Goldratt’s novel [18] describes a traditional situation happening in production about a tough customer’s request, at first glance impossible to fit with the planning through the following chat:
“But look at the chain of the events. Johnny [a vendor] called you with an impossible client wish. He didn’t believe it could be done, and neither did the client. And on the surface, it was impossible. But we looked into it. We considered the bottleneck availability, we considered the vendor limitations, and we came back with something pretty unusual.
We didn’t say a flat no, or flat yes, and then miss the due date by a mile, as we used to do. We re-engineered the deal; we came back with a counter-offer that was feasible and the client likes even more than his original request.” [18]
In few words Bob Donovan, the production manager protagonist in the novel described the final purpose of the MPS. In other words, “The MPS is the time
Page 36
phased plan specifying how many and when the firm plans to build end item”
[32]. It has to be realistic and indeed, its role is to adapt the production to the needs:
- Translating the will of the company targeted through the S&OP in an operational response, it means in terms of quantity of item either to produce or to buy
- Insuring the service rate expected by the customers leveraging the stock and/or the production plan.
- Assigning the raw materials resources, labour forces and equipments at the adequate locations
- Respecting a low level of work-in-progress.
The Master Production Schedule takes part in the tactic plan since it assesses the volume to produce to purchase and tries to fit with the resources of the operations to satisfy its customers. Nevertheless, it is strongly linked with the production activities and so it makes the transition between tactic and executing plan. The communication the S&OP and the MPS is done by the Backlog (the portfolio of the firm orders) and the production plan, the main job of MPS would be further on to grant the consistence of S&OP decisions at a more detailed and so more realistic level. Whether the suggested production plan cannot be realistically executed a feedback is sent to the S&OP to apply corrections. Therefore they should work in closed loop feedback control.
Owing to that, many changes could occur during its construction: cancellation of an order by a customer, break down of a machine, suppliers unreliability, higher scrap rate than expected, etc. These troubles could lead to an increase of the cost, a lowering of the service rate or a loss of credibility of the planning tools. That is why it is to be defined with correct time buckets and moreover, most of its users decided to create three zones inside: frozen, negotiable and free. The horizon of time covered by MPS has different time fences (there are three) within which the MPS decisions depend on several factors allowing or not flexibility in the change of the planning, these parameters are:
- Production lead time
- Relationship between customers/vendors
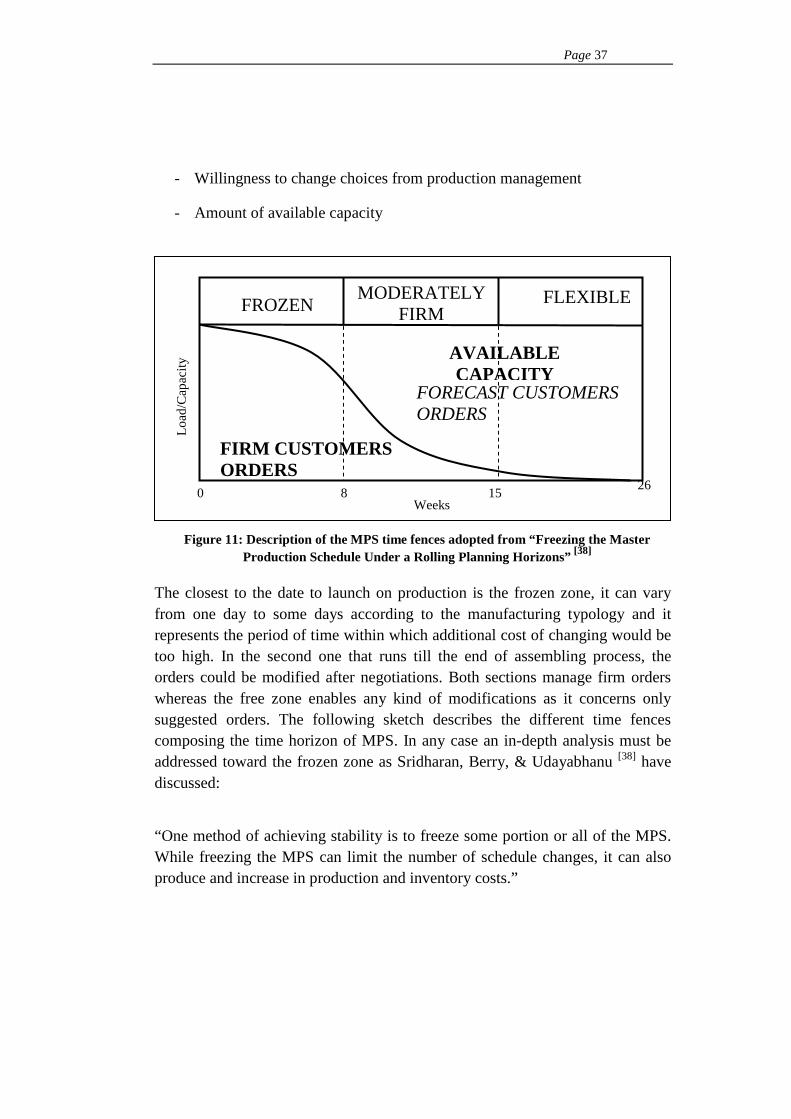
Page 37
- Willingness to change choices from production management
- Amount of available capacity
The closest to the date to launch on production is the frozen zone, it can vary from one day to some days according to the manufacturing typology and it represents the period of time within which additional cost of changing would be too high. In the second one that runs till the end of assembling process, the orders could be modified after negotiations. Both sections manage firm orders whereas the free zone enables any kind of modifications as it concerns only suggested orders. The following sketch describes the different time fences composing the time horizon of MPS. In any case an in-depth analysis must be addressed toward the frozen zone as Sridharan, Berry, & Udayabhanu [38] have discussed:
“One method of achieving stability is to freeze some portion or all of the MPS. While freezing the MPS can limit the number of schedule changes, it can also produce and increase in production and inventory costs.”
FROZEN MODERATELY
FIRM FLEXIBLE
AVAILABLE CAPACITY
FIRM CUSTOMERS ORDERS
FORECAST CUSTOMERS ORDERS
Weeks 0 8 15
26
Lo
ad/C
apac
ity
Figure 11: Description of the MPS time fences adopted from “Freezing the Master Production Schedule Under a Rolling Planning Horizons” [38]

Page 38
Another relevant point of concern is the level of aggregation that must be chosen in the MPS. At first glance the level of the finished product seems be the best to be in accordance with the Sales Service and the contract date. But, practically the nature of the production, the quantity of the raw materials with respect to the final products can push to draw the MPS in an other way, different MPS structures exist : pyramidal, divergent, linear, T-structured and with two stages. The rule is to drive the MPS where the number of references over the process is the narrowest.
In conclusion, both MPS and S&OP are performance oriented, so the actual results are compared with the objectives defined before, a root cause analysis is triggered in case of gap and can drive corrective actions.
Further down the disaggregation process is the Material Requirement Planning (MRP) program that calculates and schedules all raw materials, parts and supplies needed to make the finished specified by the MPS. The process planning and scheduling are the two most important sub-systems in the process control of the operations. As seen before the planning process assessed when the order is to be launched on production to satisfy the customer. The planning creates the link between the product design and its manufacturing phase, for example to a design of a given reference can be attached a throughput time, going backward from the due date to deliver to the customer we can assess the latest date to start it on production. The scheduling task is to define the operations of all the jobs on each machine while the constraints imposed by the process plans are satisfied. Scheduling links the two production steps: prepare processes and put them in action. Even though the scheduling phase is not included in this study, it has to be presented because planning and scheduling share a strong relationship (input/output and closed-loop feedback control) and their integration is an important matter of concern and a challenge in both research and applications.
g. Scheduling systems
Scheduling, downstream the planning, at the operational level must be carried out the issues of allocations of the labour, the control of the physical flow in the

Page 39
short term (from hour to one day). Here one must drive the operations and most of all, supply the right quantity, at the right time to fulfil the objectives imposed by the production plan guided by the S&OP and frozen by the MPS. This level of control enables the flexibility to react on-time according the assigned targets upstream. Under these general assumptions everybody agree thereby they admit the need of having:
- The workload crossing each work station
- The planning of the shifts
- The capacity of each work station
It must always respect the decisions committed in the planning process and the service rate required for the customers. Either the strategic level or the tactic one receives an overwhelming acceptance of the companies operations management, however the operational level has mutated a lot over the years and evolves still now, it divides the people as well in terms of philosophy as in terms of used tools. That is what we will try to discuss beneath.
Until the 60s, most of the researches focused on how to optimize problems on several functional areas, working on algorithms, aggregate capacity planning, inventory control, etc. But these studies remained formal and never linked to practical cases. In the early 60s while the computers appeared, it quickly provided a relevant answer to operational problems for instance the problem of the production control [23] unfolded in J. Orlicky. Then one was developed the MRP and step by step the computers had taken a larger place to treat databases bigger and bigger and to solve problems more and more complex. Nowadays, the increase of computer power affords a higher degree of integration of the production problems.
h. Production Planning and integration to producti on scheduling
MRP system is the most spread in the industries, if its history is considered over the decades, one figure out that it grew up to become a “Fully integrated, interactive, real time system capable of multisite global application”[32]. This

Page 40
growth was guided by two main reasons. The first is the change of doing business in Manufacturing from the early 80’s to the late 90’s companies switched smoothly from a build-to-stock to build-to-order, with significant consequences. Within their book Chase, Aquilano, & Jacobs pointed out some underlying issues of the build-to-stock [32]:
“The weak links in the model of build-to-stock is inventory management and this can be traced to even weaker link, reliance upon sales forecast.”
In other word there is a breakage between the Sales and the Operations, a lack of communication between them. Obviously, the issues of operations such as procurements of parts, production and shipping of the products are inherent to MRP approach and therefore they remain true in build-to-order. The second reason that can be seen as a consequence of the first one is the change in the way of managing the operations that shifted progressively from a push method, to a pull approach. It gave birth to hybrid system, coupling MRP with JIT Kanban system where the MRP and its planning capability are fed by the response of the Kanban system. It was so-called flow management with a view to illustrating the improvement in terms of smoothness of the production pace, and shrinkage of the buffers (work-in-progress).
In traditional approaches, the planning and the scheduling are conducted successively; once the planning process is generated the scheduling phase can be performed. However, those two steps methods have to cope with several obstacles which lead not the optimal solution but to one of the realistic solutions, with the results of lowering the improvements on productivity, responsiveness of the operations system and caused the following that could be called structures synchronization weaknesses as developed for instance by Kumar & Rajotia [26] or Génin, Lamouri, & Thomas [20]:
- Capacity Requirements synchronization: In many cases production planning with integrated scheduling such as the MRP II planning. Assuming the example of the MRP II, it reaches its limits while it plans at infinite capacity going further on the jobs scheduling, assuming their limited capacity. The weaknesses frequently pointed out on MRP II are
Page 41
the assumption of having an unlimited capacity. That leads to make the system iterate many times until it reaches a feasible plan. The proposed solution will not be the optimal one but only an executable one.
- Vertical integration and plans synchronization: The MRP II opponents criticized its time precision and its frequency to regenerate a plan that is not in accordance with the reactivity of the actual needs. Because of the time delay between the planning phase and the execution one, the constraints assumed during the first stage (planning level) may have greatly changed and moreover make the plan no more feasible. The non-synchronization could occur at each level; for instance between the S&OP and the MPS due to the disaggregation of the volume to produce (in S&OP) converted to objectives by references (in MPS). Generally a lack of coordination in planning processes or between the planning and the scheduling can drive to opposite decisions. The tactic would suggest reducing the manufacturing processes costs, while the production increases the capacity at high costs to insure a high service rate for the customers.
- Horizontal integration and plans coordination: This point becomes nowadays significant because the company deals with a complex network of suppliers. Actually in the MRP II the computations are performed from downstream to upstream they provide a realistic plan for each entities but often not optimized or even unfeasible considering the overall supply chain due to the lack of coherence between the plans.
- Rigidity of the computing algorithm: One of the most recurrent critics pronounced against the system MRP II is to assume that operations processes have fixed features and is stable over a long period of time. Then, the system designers have defined a sequencing algorithm based on specific criteria such as the order value, the overdue, whatever the market or the clients (these rules of priority may differ). Therefore the MRP II operates like a black box, providing a solution made of choices not expressively expected from operations planners. In addition, the real

Page 42
production environment is best represented by considering more than one criterion simultaneously.
Obviously the constant improvement of the computer tends to overcome these problems improving the manufacturing efficiency by reducing the horizontal and vertical conflicts with the results of reducing the throughput time, the work-in-progress and in the same time improving the utilization of the machines and enhancing the flexibility to the disturbances. But on the other hand the recent trend is a high level of customization and diversification of the products; this imposes to the companies to share on the same lines several references and led them to manage multi-product facilities with a complex process networks, setting and changeover times and costs, etc. Therefore these iterative methods have to cope with a broader flexibility which a larger multi degree of freedom system. Thus they must iterate an important number of times to seek out possible (and not optimized) planning and scheduling plans.
i. Integrated Process of Planning and Scheduling
The recent researches related to Computer Integrated Manufacturing System attempted to carry out both the planning and the scheduling process in a tighter way and no more sequentially to supply better solutions and it is so called Integrated Process of Planning and Scheduling (IPPS). Following this philosophy 3 different sorts of models were addressed:
- The Non Linear Process Planning (NLPP), its methodology consists in providing many alternative plans for each job with a rank according to the process planning optimization criterion. The first ranked is the optimal one and its associated scheduling is ready but if the current status of the job floor does not match its conditions it is left and, the second one (that must be submitted to the scheduling) is provided and so one… Many researches are involved in this methodology and develop methods to generate many possible and feasible plans. However, a recent study showed that even if a large number of plans are mandatory to provide a robust solution over to eventual status of the shop floor, in the meanwhile after a given level of alternative plans, the benefits of this strategy lower.

Page 43
- The Closed loop Process Planning (CLPP) is strongly related to the shop floor activities because it leans it dynamically by means of a feedback mechanism. So, every plan is realistic and respects the current availability of production facilities. This dynamic simulation system can enhance the real-time, intuition and manipulability of process planning system and it also can enhance the utilization of alternative process plans. The main drawback is to have first production lines fully monitored.
- The Distributed Process Planning (DPP), its methodology is to perform simultaneously both the planning and the scheduling with a hierarchical approach. It divides the process planning and the scheduling tasks into two phases. The first one is the planning phase when the features and the links of the different parts of the final item are taken account. The process resources are evaluated in the same time. The second phase is the detailed one when the plans must fit with the current state of the shop floor. One finally gets simultaneously both the planning and the scheduling in accordance between them and most of all with the production line.
Nowadays, one of the most promising ways of generating feasible plans is to work with genetic algorithms. This mathematical tool is inspired from the nature where only the most adapted and strongest elements remain and the others disappear.
j. Just-in-Time
Just-in-Time (JIT) is the Toyota Production system and it was founded to provide the right parts needed by the assembly line at the time it is needed and in a limited quantity to achieve the absolute elimination of all forms of waste, the whole theory is expanded by T. Ohno [36]. JIT stand up for the “zero concept” which means the achievements of the goals of zero defects, zero queues, zero inventories, zero breakdowns, etc. The whole management philosophy of JIT will not be developed in detail here, but the focus of interest will be the Kanban system which gives a controlled mechanism to the shop floor activities by means of pull logic. This choice is mainly because nowadays few companies used the JIT philosophy but instead they work with an integrated

Page 44
MRP/JIT system trying to fruit the benefits of both systems as one will present later. The main reasons of not implementing it alone would be:
- The cultural differences between Japanese and Western companies
- The geographical dispersion of the suppliers
- The differences in management approaches
Kanban description
In a pull system, the product moves from one workstation to another one only if the job is pulled, and no more pushed, by the successive workstation. The Kanban controlled production system aims at mitigating the waste and tackles the Work in Progress and Work ion Progress issues. To have the control of the flow of the parts throughout the production line, the so-called Kanban cards are used. The Kanban Card system can be executed in two different ways; with a “single-card” system or a “two-card” system. Actually Kanban is a plastic card on which all the information needed to produce the part is available. Kanban is related to a given storable quantity of parts, when the buffer capacity at the workstation is filled, no further storage is possible. Thus the workstation cannot release any more pieces and stops processing, it behaves as if each workstation has its own suppliers (the job upstream) and customers (the station downstream). This system clearly controls and limits the WIP and the inventories. In order to process in proper and not too risky way, an adapted number of Kanban must be estimated, a too small quantity of Kanban lead to store out while a too large one drives to excessive WIP, inventories, etc.
1K D L
C
α+≥ ⋅ ⋅
Where:
Page 45
K : number of Kanban D: Demand per unit time L : Lead time C: container capacity α: Safety coefficient (usually between 5-10%)
The Kanban card also permits to lean the production of the components and it has the relevant advantage to provide accurate information in terms of performance of the process for the pieces associated (controlled) to the Kanban card.
Many testimonials of companies showed that lowering the WIP quantities contributed to improve production efficiency and quality, and therefore to reduce the overall costs of production. Practically, it enables to smooth the production process, push the designers to standardize both their items as their jobs, etc. Its biggest challenge remains to adopt a philosophy of continuous improvements and Total Quality Management [39] where either the managers or the operators must collaborate to together find the adequate solutions of improvements. However it proved its limits two while a pull-type system is applied on a case of medium large demand variation since the storage level of the semi-finished is short, actually Kanban cope with a demand variation until 10%.
k. Integrated MRP/JIT systems
Actually this is a relatively new trend to combine MRP with JIT since during a long period of time; people thought that MRP was related to push method while JIT was linked with the Pull method. As JIT and MRP own their singular advantages and drawbacks, using a hybrid approach allows taking advantages of both to achieve better performance. Moreover many studies confirmed that those latter are effectively compatible in a global system where MRP must be considered a framework that can upgrade the JIT production more efficiently. Several factors drove the companies to choose this solution:

Page 46
- The accumulated operating problems of adopting only JIT management
- The better understanding of the researchers and companies of the compatibility of these two approaches
- The MRP flexibility on the long term capacity planning and the JIT agility in daily production control
On the early literature dedicated to this topic, Cochran & Kim [22] have distinguished two different types of hybrid push-pull (MRP-JIT) systems and they categorized them into vertically and horizontally integrated systems.
The first one is based on two levels system, an upper one working from a pushed production ordering system and a lower level which is a pull-type production system. The MRP is applied for production and operations planning while the JIT is used at the level of the shop floor to control the execution. Some features and disturbances, such as the effect of setup, variation in the processing time, the breakdowns of a machine, and their impacts must be known to set under what condition it is appropriate to phase in a JIT into an MRP. Thanks to this approach the stocks keep a low level and the reactivity of the production to the customer demands remain fast enough.
The horizontally push-type hybrid method proposes to integrate push elements at the beginning of the assembly line while the end of the line would be led by pull-type approach. In the shop floor this approach could be translated in a series of pure push-type workstations upstream and, downstream a set of pull-type stations. The work orders (based on forecast) are released at fixed frequencies (monthly) and the first workstations work in consequence, they would feed a safety stock at level of semi-finished products till it would fill at maximum level. The push-type workstation would not process unless the stock level goes below a threshold. From the other side, a customer’s order triggers the processing at the pull-type workstations. After the last workstation, the items are stored. Once a finished product fulfils the customer’s demand, it frees a Kanban generating a replenishment order of the finished product storage at the last

Page 47
workstation, and so one. Its advantages are a reduction of the inventory costs and late costs and it enables to keep offering a high level of customer service.
4.2 Key performance indicators and follow-up
The word performance has a broad sense, however it could be briefly defined as “The act of performing; the carrying into execution, or action; execution; achievement; accomplishment; representation by action; as, the performance of an undertaking of a duty” [4]. The definition points out that the performance is articulated around an “execution” and an “undertaking”, in other words the performance shows how an action contributes to the duty initially targeted. Then, the underlying issue is the definition of the concept of “goal” that will provide the objective while the way to reach it will draw the guideline of the performance. The previous statements help on structuring the first part of this section dedicated to performance key parameters. It will deal with the definition of company’s goal, the relationship between the company’s goal and its features to finally pull out a selection of relevant performance indicators. Afterward the second section will focus on the performance follow-up and how to use performances.
a. Performance key parameters
Once M. Porter has purported “The thing is, continuity of strategic direction and continuous improvement in how you do things are absolutely consistent with each other. In fact, they're mutually reinforcing”. Nowadays with the modern measurement systems and software, everything can be acquired and monitored so as to track performed actions. Despite this easier data measurement, an excessive quantity of data leads to supply meaningless data and therefore, a blurred insight. That is why it is important to respect a guideline, the strategy, headed by the goal and developed in a set of commitments tracked by performance indicators.
Definition of the goal

Page 48
The goal will be defined from a business standpoint, the profit is targeted and the business strategy will state decisions to orient differentiation of the company. “A strategy delineates a territory in which a company seeks to be unique.” [6] This milestone is necessary to set the key performance indicators later, their definition will derive from it and they will be oriented toward this target. Eliyahu M. Goldratt has illustrated the importance of this point while at the beginning the protagonists argued about the definition of the productivity in the following dialogue:
«Just tell me, what does it mean to be productive? […] To you personally what does it mean? » […] On the far side, I am telling: «Well I guess it means that I am accomplishing something. » «Accomplishing in terms of what? » «In terms of goals» I say […] «My compliments», he says «When you are productive you are accomplishing something in terms of your goal» [18] (p: 31-32, 2004)
The goal and its related strategy are the key point of the enterprise would perform and “In the absence of good performance management we can expect confusion, wasted effort and resources, and off-target performance. In the extreme, poor performance management leads to organizational failure.” [31] As for most of the company, their respective goal merges toward how to get money (in a financial or non-financial way). Even though they share a common purpose, they individuate one from another, in their definition of the strategy.
The strategy
As the core of this thesis deals with a particular kind of organizations, the focus will be put on the firm having manufacturing activities. In the section dedicated to Operations management and planning over the different horizons, the second paragraph entitled “Operations strategy” argued that “The operations play a role in the business; it first must be understood and gives its contribution to the strategy, challenging the performance objectives”. However its purpose is not

Page 49
only limited to operations concerns and business performance evokes 3 key points to evaluate business performance:
- the profitability
- the growth
- the production competence
These later are developed beneath, to well-understand what the relationship between the various strategic aspects is and how the key performance indicators enable a proper monitoring of the firm’s abilities.
General assumptions
The paper K. Choe & al reminded the two fundamental types of competitive advantages [13] that a manufacturing company could and ought to pursue: the cost leadership and the innovative differentiation. These concepts developed by Porter, are presented because they encompass all decisions and choices made later on, and especially the production competence. The so-called Porter’s generic strategies matrix is presented here below and will be commented further on:

Page 50
Figure 12: Porter’s Generic Strategies (adopted from www.mindtools.com)
The business strategy can be oriented toward two kinds of strategy, when it pursues the cost leadership, the company will show an emphasis to mitigating significantly the cost, focusing on having an efficient production, using the scale effect so as to achieve a sustainable advantage regarding the costs whereas it will put aside the innovation. At the opposite, whether the company leans on Differentiation, it would strive for product innovations, to manufacture a unique item respecting the customer’s desires however the backlash of this singularity would be a higher price. Then there are two hybrid categories, the first one here named “cost focus” corresponds much more to the situation in which does cope with the decision making and has no strategy or so few. The last “differentiation” also called “Integration” describes a company strategy prone to differentiate its products while maintaining acceptable prices.
Profitability
C. Hills and G. Jones have stated the profitability was the key measure of the company’s financial performance [33] as it captures the return that the company gets on its investments. Applying a strategy leads company to do investments and its profitability puts in evidence its ability to take benefits of them.

Page 51
Growth
One talks about growth when the economy of the company expands, in other words the firm generates a significant positive cash flow, it corresponds to the situation in which the amount of the intake orders is larger than the delivered ones.
Production competence
Cleveland, Schroeder, & Anderson suggested the fit between the manufacturing structure and the business strategy of the firm [14]. Although the survey was mainly empirical, it has introduced the influence of the production competence on the business performance. The authors of “Production Competence and Its Impact on Business Performance” [13] strove to highlight the degree of consistence between the manufacturing structural decisions and business strategy. The adequate choices of production process, product design enable to mesh easily the business plan and reciprocally it suggests a range of structural manufacturing priorities. It matched the typology of the manufacturing structure with the Porter’s generic strategies and showed the stringent correlation between them.

Page 52
Therefore the objectives of the business strategy can be converted in a set of key performance indicators that monitor the performance of the production and they allow to track the alignment between the manufacturing output performance of the company and its strategic expectations.
Sustainability
Until now the business performance were evaluate according to its economy, the concept of sustainability has popped up during the last decade, and it has partly changed the business performance prospects. What is sustainability? At first glance, one may limit the sustainability scope uniquely to an environmental concern born with the awareness of the global warming. Actually, the concept of sustainable development goes further; many people have extended its definition among which Geoff Lye has assessed how new forms of social, environmental and economic liability, they demand a new approach to strategic risk management. A system can be stated sustainable whether the environmental,
Process Innovative Integrative
Non-Innovative Product Innovative
High
High Low
Low
Product Complexity
High
High Low
Low
Product Complexity/Innovative differentiation
Process Complexity
Process Complexity /
Cost Leadership
Cost Leadership TYPE I
Process-Innovative
Integration TYPE III Integrative
No Strategy TYPE IV
Non Innovative
Innovative Differentiation
TYPE II Product-Innovative
Figure 13: Typology of Manufacturing Structure and Types of Fit Between Manufacturing Structure and Business Strategy adopted from “Production Competence and Its Impact on
Business Performance” [13]

Page 53
social and economic capitals are balanced within liable project over a long term (see Figure 14.)
D. A. Koehler has pretended that the inclusion of data on ethical, social, environmental and economic information into decision-making processes is a significant progression for an organisation [16]. Recently the companies figured out that society acceptance pops up if they make sustainable decisions, their organisations would serve the interest of the environment and the society. Throughout the two subsequent points one intends explain the social and environmental dimensions and most of all they put in evidence how nowadays the strategy takes these issues into account.
Sustainability and environmental capital
During this decade, the issue of global warming has arisen and the sustainability has been booming. Therefore it is nowadays a flourishing competitive advantage
Figure 14: the three spheres of Sustainability adopted from the 2002 University of Michigan Sustainability Assessment

Page 54
for the companies. The environmentalist Paul Hawken has written "Sustainability is about stabilizing the currently disruptive relationship between earth’s two most complex systems, human culture and the living world.” [30] (p.172). Being environmental-oriented is a strategic decision that most of the companies promotes, through a green policy, the respect of norms such the ISO 14001, scrubbers, etc. The body of knowledge breadth dealing with the relationship between environmental management and business performance proves the growing interests from both researchers and the entrepreneurs concerning this issue. The paper of S.X Zeng & al intended to show the trade off between the firms’ efforts on a cleaner production and the competitive advantages by means the structure equation models [40]. They assumed two different types of involvement, the low-cost and high-cost cleaner production activities and the authors analysed the impact on business performance as well as financial as non-financial. As Porter and Van Der Linde, Molina-Azorìn & al. did previously, they concluded that the low-cost respectively high-cost cleaner production enable to provide business advantage on non-financial performance respectively on financial performance [27]. Today the firms, shareholders, investors are willing to make efforts to be greener, the following extract witness this trend:
“Investors are also putting forward ideas of their own. On September 16th a group of 181 institutional investors, together representing $13 trillion in assets under management and including national, state, private pension funds, called on world leaders to agree stringent carbon cutting targets at the Copenhagen meeting.” [41] (p.76)
Sustainability and the social capital
The social system is the third pillar of the sustainability and it comes in balance with the environmental and the economic systems (see Figure 14, here above). Until now, this dimension has not been so much explored but the pressure rises from the governments, authorities and customers, for a more significant attention on social impact of corporations’ policies. The social sustainability also called corporate social responsibility is somehow a policy dictated by a kind of auto-regulation whereby the firm provides its supports to law; it
Page 55
enhances its ethical approach and accepts to be ruled by some internal and external norms. It can be viewed as a business model that encourages the community growth, and voluntarily eliminating practices that harm the public sphere, regardless of legality. According to the nature, the market of the company the benefits can be different. Even if according to M.J Hutchins and J.W Sutherland concluded that the linkages between business and the society are not yet well-understand, they acknowledged that the corporate social responsibility (CSR) outlines the consistency toward the morals and the values of the society [21]. Moreover they agreed in accordance with Caroll that “Societal expectations are in fact social responsibilities, and that the corporations must assume a wide range of economic and social responsibilities”. A duty tempered by Matè Kriza (Director of the Hungarian Business Council for Sustainable Development) who has noticed that the companies’ main motivation was the profits and the sustainable company stand up for the social investments as a business opportunity [27]. The correlation between business performance and the CSR is difficult to establish even though two benefits can be cited; regarding the risk management where an enhanced culture of “doing-the-right-thing” helps on mitigating the fatality number, incidents that could drive to a conspicuous event widely reported. Then in the companies where ethical approach and social vision, are considered the CSR plays a relevant role in differentiating the brand of a firm. In any case, the corporation investing part of its strategy on the social sustainability does not look for short-run financial returns [8] as remarked C.A Adams and G.R Frost. The following example provides the evidence of sustainable approach on business strategy based on social and ecological-oriented.
In 2005, two youths, François-Ghislain Morillion and Sébastien Kopp, decided to create their own brand, on the really competitive market of the trendy basket-shoes, however they based their strategy on an innovative approach encompassing social and ecological initiatives as key of differentiation. Beyond the worthy objectives, this choice revealed to be a clever business opportunity too. The two young entrepreneurs advocated the following philosophy while introducing the Veja project:
“Action,
Page 56
And despite this green-fronted economy, let's try to offer a different vision which combines fair trade and ecology and links together economy, social initiatives and the environment. A vision that proposes cultural change.” In fact, their action strives for mitigate the carbon footprint of their manufacturing activities and they attempt to use biological and ecological materials, at maximum, coming from fair trade and where the social rights are respected. Actually, they have met an overwhelming success that proves sustainability could be a liable pathway to a successful business.
b. Key performance indicators
M.M Ahmad and N. Dhafr have defined the key performance indicators (KPI) as a “Number or value that can be compared with internal or external target Benchmarking to give an indication of performance” [9]. Obviously this range of indicators must be selected according to the profile of the company, the targeted strategy but it matters that these acquirements permit to evaluate the performance of the company relatively to its opponents competing on its area (market). Then, the chosen indicators must be appropriate and one makes sure that there is a balance between each of them so as to prevent one dimension performance from being stressed to the detriment of the others. Another concern would be the objectivity of the selection of KPI because a biased choice would distort the reality and could finally lead to non-adapted decisions to the situation. This part explores the 4 dimensions of the strategy (profitability, growth, production competence and sustainability) to introduce the different possible KPI that are advised to respect a given strategy. Moreover, a particular attention is put on the manufacturing performance and its related KPI, as it is the core of the thesis.
Production competence
The cornerstone of the production competence is the output because the value provided by a manufacturing company are the products coming out from the bottom line. In addition the goods are considered as outputs while they are

Page 57
invoiced, thus when they “Generate money through Sales” [18] (p.60). The objective is to remain consistent regarding to the goal and also for the following reasons, explained by G. Azzione and U. Bertelè [11]:
- The firm works mainly in function of its outputs,
- The competitiveness of the company can be only observed throughout its outputs,
- The economic analysis of financial flow of the company and the construction of the budget come from its outputs,
- The categorization of the company’s activities and the identification of the market in which it competes are articulated by its outputs.
Then management team may take into account many parameters linked to the output, one can randomly cite the productivity, the throughput, the inventory levels, the work-in-progress, the flexibility, the utilization, etc. Some of them are general and fit with all strategies whereas some others can be useful and meaningful on specific purposes.
The throughput illustrates the pace of the bottom line from the operational point of view while from the business standpoint it is the rate at which the system delivers outputs through sales.
The productivity represents the overall efficiency of the production since it is the ratio between the output and the input, but the approach may vary according to the meaning attached to the words input and output. So the definition of the input could be “All the money that the system has invested in purchasing things which it intends to sell” [18] (p.60) and the output would be the money through invoiced sales. The main problem of the productivity as defined above, this is a too general parameter that hides plenty of factors such as the inventory level, the WIP, the degree of utilization, etc.

Page 58
Consequently, it is recommended to limit its use at the bottleneck, because the critical resource must be optimised, and it is so-called Overall Equipment Effectiveness (OEE). It describes how an asset is reliable and the ability of this latter to deliver the expected performance:
OEE = Product Rate x Quality rate x Availability
Assuming:
- The product rate is ratio between the average rate at which the machine operates and a reference rate (usually the best has ever been achieved).
- The quality rate corresponds to the division between the amounts of first-pass-yield products and the total amounts of produced items.
First Pass Yield PieceQuality Rate =
First Pass Yield Piece Non Conform Piece+∑
∑ ∑
- The availability is defined as the ratio between the effective worked hours and the total available hours.
8760 - Total number of lost hoursAvailability =
8760
Afterward one distinguishes the KPI useful for the process innovative-Cost leadership strategy and the ones advised to used in case of the product innovative – Differentiation strategy. Their measurements are different because the performance expectations vary and operational system works in totally different way and thus their KPI have to be adapted. The process innovators intend to produce in an optimized and efficient way (process-focused), to do so; these corporations are likely to have high capital-intensive process technologies. According to K. Choe and al. [13] this company profile must evaluate:

Page 59
- The standardization rate
- The number of different references for key parts
- The throughput
- The Work-in-Progress level
- The inventory level
- The OEE
Because all of these are key sources of cost reduction and they intend to mitigate the required operating working capital.
Instead, the product innovators cope with an important breadth of their production line, nevertheless requiring less expensive machines, its flow is often non-linear, and the level of WIP inventory is rather high. They focus on quality, flexibility of the production and service rate, therefore the KPIs ought to illustrate the complexity of the mix of product running over the lines on one side, and assess the customer satisfaction. These indicators give a pattern of the ongoing performances and can often be published: daily or weekly.
The service rate indicates the ability to response on-time and correctly to the customer and it is defined as:
Quantity of right orders delivered on-time
Service Rate = Total quantity of due orders
The overall quality can be checked at the bottom line (the quality rate, defined above) but also over the life cycle of the goods, thanks to the feedback of the

Page 60
customers (by opinion-polls, product returns, etc). Going more in details, the scrap rate on the machines depicts the critical machines from a qualitative point of view. To respect the highest clients’ standards, providing a reliable product can generate high expenses if the quality is not perfect the first time, therefore the product innovators must monitor the First Pass Yield, it means that the piece must be good the first time.
The flexibility is difficult a feature to evaluate and the way of performing may vary from one company to another. Two were mentioned several in the body of knowledge; the number of ongoing Bill-Of-Materials and the lead time variability. The first helps on having an idea of the breadth of the production line whereas the second indicates the level of non-linearity of the production.
Besides, another group of KPIs updated at a lower frequency intends to measure the emphasis of the production competence on the business strategy. K. Choe and al. [13] have underlined some less dynamic key indicators such as the firm's R&D performance, product-market innovation, product innovation frequency, innovation orientation and competitive aggressiveness. These parameters cannot be estimated easily and they mainly come under benchmark of the opponents and the markets.
Page 61
5. Planning section
5.1 The situation
a. External issues
As it was described before the portfolio of products offered by RPV is rather broad and it tends to be still enlarged. This internal policy aims at fitting with the market needs and mutations in this period of deep changes and it has to cope with new less stable environment.
In general the globalization and the recent financial (and industrial) crisis slashed the customer’s investment, most of all it changed or accelerated the client’s way of purchasing and investing. They wait until the last moment to confirm their orders so as to enhance the competition. Besides, the market can be split into two distinct entities the western countries where the demand is mainly to renew or upgrade old bushings and the emerging economy that invest a lot on brand new power plant infrastructure. The first one requires a custom-made product fitting with former technical and geometrical features where the ordered amount of pieces is limited while the second represents larger orders gathering a complete set of bushing for the different applications.
Nowadays, RPV is competing with many competitors, coming even from low cost countries since the know-how formerly owns by few companies now spreads. Actually, the smallest condenser bushings on which standardization can be done and where the engineering phase is limited are no more produced in large quantity in Europe. Instead this production merges toward low cost countries such as India and China.
In parallel the RPV products mix is about to be refreshed. The ERBP products will be partially substituted by the RIP soon with two deals:

Page 62
- The level sales plan for the “Small Carta Olio” should shrink progressively
- The RIP products will be introduced gradually
From an operations point of view these 4 events impact significantly on the backlog, the deterministic horizon for most of the families is mitigated by the late decisions of the customers. Then, the foreseen part made of forecast and pending offers is blurred by the absence of similar situations in background. Thus the formulated objectives cannot be very consistent and operations decisions cannot base its analysis only on this data. One imposes to the operations to be reactive and really flexible.
So in short term this leads to a shrink of market investments but beyond the customers has changed behaviours.
b. Internal issues
A further analysis will not be detailed in this study but this brief description of the present situation allows for well-understanding the position of RPV in its context. The company focus is to propose a technical product with a high degree of customization and therefore where the engineered part has a relevant role in terms of added value. RPV does not work in mass production but Engineer-to-order production where the products are processed in a hybrid way between mass and batch process. However until now, a quite important part of its activities (in terms of quantity) is provided by these small bushings. Only the UHV bushings are indeed processed in batches. The particular design of the operations leads to several issues:
- Broad portfolio of products

Page 63
- Higher variability of the customer demands
- Operations process includes engineering phase
- Engineering capacity must be considered as it takes part of the process
- High variability of the overall lead time within the items running on the production lines
Typically, the first and second points drive to lead time issues, to more complex procurement management and further to critical supply chain one. RPV production has to manage a high variability of the overall lead time within the items running on the production lines. On the other hand more specific bill-of-materials, operator skills, accuracy, availability and reliability of the resources will be critical points that have to be handled to offer high quality of services to the customers (reliability of the products, service rate and so on).
c. A complex planning strategy
One of the first challenges the operations management will have to face with should be the planning phase. The choices and decisions are constrained by many factors. As it was described in the section entitled “planning systems”, the challenge of the planning managers will be to seek an optimal solution, to find a balance between the various requirements and unfortunately, it is often impossible to totally satisfy each “customers” of the operations planning.

Page 64
d. Tactic planning “assets”
Before further development about the aim of the internship, one will briefly describe what has already been done on both tactic plans: Sales and Operations Planning (S&OP) and Master Production Schedule (MPS).
Sales & Operations planning
It was developed more than a year ago by J. Piediscalzi, the approach was global and aimed at proposing both a tool and a clear, formal process. Practically, S&OP illustrates for each aggregate family (Small Carta Olio, Small Carta Resina, PABS, and Big Carta Olio) the graphics matching load and capacity over a period of one year (13 months). The loads data (got and foreseen) are fed by the Marketing and Sales Department and are split into 4 categories: the firm orders (backlog) and the forthcoming ones in which there are the Pending Offers A (Probability higher than 50%), the Pending Offers B (Probability lower than 50%), and the Rolling Forecast (corresponding to orders with verbal agreements and not yet contractual). The capacities were assessed after the identification and the clear understanding of the bottlenecks. If the bottleneck to process the Small Carta Olio, Small Carta Resina were clearly known and given by the oven
Internal Customers
� Contracts � EHS � Quality � Finance � ...
� Sales � Workforce � Suppliers � Procurements � Maintenance � UTI � UTM
OP
ER
AT
IO
NS
PL
AN
NIN
G
PR
OD
UC
TIO
N
External Customers
Internal and external suppliers
Cu
sto
mer
s
Figure 15: Input and output of the operations planning and the production activities

Page 65
that impose a production level at 108 equivalent pieces a week. Instead, regarding to the bottleneck identification for the Big Carta Olio, this requires a more accurate analysis. As it is discussed on the section entitled “Process”, it is a “dynamic” one, according to the position of the UHV batches and the mix of high voltage PABS, the capacity levels of the workcenter may change along high voltage line and therefore make shift the bottleneck from one workcenter to another level with a change of lowest capacity. Besides the capacity can be modified monthly and takes into account the availability of the resources (machines, test rooms, etc), the number of worked shifts, etc.
As for the S&OP process, it occurs in two steps: a pre-meeting S&OP and the meeting it-self. During the first one E. Falcone, the Marketing & Sales manager meets Charles Lanthier, the Operations manager and together, they share their insights about the situations depicted on the charts and they lay down some hypothesis based on market and shop floor status in order to correctly manage (and coordinate) the activities, in accordance to the sales and the operations for the running year. This meeting finishes with a set of hypothesis to submit during the S&OP meeting. Few after, the general S&OP meeting is carried out, it gathers the management team (Human Resources, Supply Chain, Production, Operations, Marketing and Sales, Quality and Finance) around the UMD, Z. Benhammou. This meeting starts with a brief review of the previous decisions and commitments and their achievements. Then, the operations manager presents every chart of the S&OP families, the hypothetic actions suggested at the time of the pre-meeting and all together they agree for the most adapted decisions to take. A "Minute-of-Meeting" is later written so as to provide a contractual form; it outlines the decisions and commitments of each protagonist and it will be further used as a checked list during the meeting of the next month.
From this existing tool, one can highlight many advantages among which it enables to:
- Well-understand which the bottlenecks are.
- Figure out how the mixes of products impact on the production capacities.

Page 66
- Provide a clear medium-long term prospects of the RPV activities.
Then in the meeting the focus was on the long term (and not on the first incoming months, MPS window) that testifies its proper use. In spite of the good and reliable base of work built, some drawbacks must be underlined such as:
- The lack of Production Plan
- The lack of Sales Plan
- A lack of consistency in the forthcoming orders (due to the previous point)
- The Engineering capacity is not taken into account
- No agglomerated vision linked the foreseen turnover to consolidate the budget plan (so-called flexibility plan)
In a nutshell, S&OP was correctly executed and helped to take decisions but the planning purpose had to be enhanced and create a synergy amid the tactic planning (S&OP and MPS). Until now the S&OP was too sales-oriented whereas it must drive the production planning since it is its first milestone.
Mater Production Schedule
It was designed independently from S&OP by F. Vigo, this tool takes into account only the backlog over a time window of 13 weeks for low voltage line and 25 weeks for the high voltage one. The approach is different; whether the S&OP thinks with the contractual dates; even though conventionally the MPS to match it with the S&OP one is expressed as the end-of-production date, it had been decided for tool MPS to consider the assembly production date. Actually

Page 67
the planning was done directly reading the backlog and implementing an assembling date manually.
As for Small Carta Olio produced on low voltage line, their bottleneck is treatment workcenter composed of 2 ovens (F1 and F2) that together offer an overall weekly capacity of 108 equivalent pieces (the OIP bushings stay inside 5 days), eventually if it is really necessary this capacity can increase by the use of the autoclaves. Therefore the capacities of the machines composing the other workcenters are set at the same level to avoid a too high work-in-progress. The Small Carta Resina family suffers from a high scrap rate, so it was decided to pass through the bottlenecks constraints what usually impose the maximum capacity (here it is around 100 equivalent), to define a lower level of 70 equivalent pieces in order not to put into jeopardy the whole the production line.
On MPS the aggregation rate of the product families must be lower in order to be more precise comparing with S&OP, here are assumed 10 families on the high voltage line, 20 on low voltage one in which every items have a comparable lead time and close procurement needs. To get a reliable comparison between the different aggregate MPS families and a common unit of measurement, the takt-time assesses by a reference item was 20 minutes. Then all references are expressed regarding to this piece normalizing by the takt-time (hence one gets the time of any item as a percentage of our reference one).
Conventionally the MPS is expressed by the end-of-production date, in the studied case the MPS decision is made at the assembling workcenters for several reasons. Even though the Small Carta Olio and Small Carta Resina items are processed both on low voltage line, their various stages and used resources belong to the same workcenters but they often use different machines (for instance on the winding and in the ovens) and therefore, they merged in assembling (details presented further in the “Capacity Analysis and bottleneck identification” part in the section dedicated to the “low voltage line”), then further in the test rooms and downstream (finishing and packing). The main reason why they phased the MPS with the beginning-of-assembling dates is because at the level of the assembling workcenter the level of differentiation from one item to another is lower (with respect to the other workcenters where

Page 68
merge the different products). Then, from an accuracy point of view, it is more relevant and precise to commit on ongoing production date such as the assembling date instead of estimating it “mathematically” from the end-of-production date. In the meanwhile many disturbances could occur and enlarge the throughput time between these two stages.
As it can be read, the planning tools exists yet but both S&OP and MPS, tool and process must be enhanced, and updated in accordance with the mutations inside and outside the company as described here above. Regarding the MPS, the main concerns would be to improve its “communication” with S&OP, to consolidate the role of SIGIP as only information source. Then, one will introduce the changes made on S&OP and will introduce the tool MPS suggested. With a view to justifying the selected choices and the followed orientation on S&OP and then MPS this part will start with a paragraph dedicated to a load/capacity analysis since this is the core of the deal.
Several advantages can be extracted from this tool:
- A clear identification of the bottleneck and its hindering capacity level
- A precise estimation of the actual capacity on the planned workcenter (assembling)
- A manual monitoring of the planned dates
- A planning by order
However some drawbacks impose to update this tool:
- An absence of link between S&OP and MPS
- An absence of high voltage line

Page 69
- A lack of information supplied by SIGIP
- A low accuracy of the estimated workload
- A lack of a clear MPS process
The disadvantages spelt here above and especially regarding the S&OP and the MPS process impose to renew the MPS tool based on the positive points presented to enhance the reliability of the planning and the reasoning of the production planners.
5.2 Sales and Operations planning
Only few changes were applied on the Sales and Operations Planning, and this is more an upgrade to correct the weaknesses presented here above than a redefinition of the tool. The first objective was to clearly separate the sales part to the production in their representations in order to well-understand if they are aligned one to the other or not. Actually they have to be split so as to be confronted on the S&OP, its aim is not to propose a rough cut capacity planning (RCCP) but much more to put in phase the sales and the operations toward a common outline. The sales’ vision is expressed in contractual date whereas the operations think in terms of the end-of-production date, in the best case these later are related to the number of days defined by the INCOTERM. Unfortunately, both are not often synchronized for plenty of reasons:
- The overdue of the production generates the breakage of this link because the end-of-production date exceeds the contractual date.
- The production works at finite capacity (even if it may fluctuate) while the intake orders level depend on the market demands which may lead to an excessive demand compared with the firm’s capacity. In this case, the operations need to anticipate part of the workload to get a smoother workflow.

Page 70
The chart provides an insight of the next 12 months plus the ongoing on. The histograms represent the actual and foreseen orders in contractual date while the red and the green lines suggest respectively the sales and the production plans. The core of the discussion was to introduce the concept of production plan to give some more information and to have a follow-up the performance of the production at the MPS level. Nevertheless, the definition of a production plan depends on the sales plan that was missing.
a. Definition of the sales and production plans
The sales plan drives the operations; the sales manager provides an idea of the level of the workload month by month to the production, then he formulates and commits on objectives. For each S&OP family, a level of pieces is communicated; it is important to precise “level of pieces” and not “level of
Invoiced orders
Backlog
Rolling Forecast
Pending Offers Prob. > 50%
Pending Offers Prob. < 50%
Production Plan
Sales Plan
Past performance
Rolling horizons of 13 months + 3 past months
Current month
End of production month
Equ
ival
ent w
orkl
oad
Figure 16: Representation of an S&OP chart for the “Small Carta Olio” family

Page 71
equivalent pieces” because in high tension there is a big difference between the smallest bushing (245 kV) and the biggest (550 kV) bushings of the “Big Carta Olio” family. As introduced in header with the S&OP family the depicted workload is meaningless. To do so, a mere tool was designed to help the sales persons on monitoring how they fill up the backlog of orders in accordance with their objectives.
In short, this tool represented the workload “translates” in equivalent pieces (of S&OP) and converts into the equivalent quantity that it weighs in function of the type of bushing, the range of tensions and the quantity. The grey histograms illustrate the frozen zone in which no order can be added, shifted or cancelled unless the changes are agreed with UPR. This frozen area has to be respected
Targeted Sales Plan
Conversion in equivalent pieces
Invoiced orders
Backlog
Rolling Forecast
Pending Offers Prob. > 50%
Pending Offers Prob. < 50%
Production Plan
Sales Plan
End of production month
Equivalent workload
S&OP Family selection Product and quantity selection
Sales Plan (frozen)
Figure 17: Expected workload for the “Small Carta Olio” family adopted from the S&OP for the sales persons

Page 72
since in this short horizon corresponding to the overall lead time of critical items (purchasing plus manufacturing lead time) grouped in the represented family. The obtained results were a more homogeneous backlog with a steadier level. Thanks to it, RPV starts to define production plans and the steadier level of the backlog enables to set some products mix rules.
The production plan will show how the operations plan to manage the backlog all over the horizon. Actually it can be divided into three sections; the first one regards the short term from the current month till the second or the third one, according to the manufacturing lead time of the S&OP family, then the second where the backlog is not totally filled up and new orders could pop up, the last contains foreseen orders in general. The production plan on the short term is built from the MPS, instead, for the second and the third sections, the operations manager defines it in agreement with the expectations of the sales a production plan by which he attempts to respond to two different constraints, the capacity and the workload supplied by the sales persons. At this level of aggregation the purpose is not to schedule accurately but to check if this workload could be absorbed by the production respecting, in the meanwhile, a fair service rate. This objective is to define a production level that later must be respected by UPR while its planning managers will define when they expect to produce the orders. If it is not feasible they must give a feedback above, at S&OP level in order to re-process the hypothesis. This job is the cornerstone of the good communication between the S&OP and the MPS and it has to be fulfilled either by the operation manager and UPR.
Both plans are inserted manually, for each family, moreover, as for the “Big Carta Olio” one, it is split into 3 sub-families Air-to-Oil bushings with a tension of 245kV, Air-to-Oil bushings greater than 245kV and medium and high voltage bushings Oil-to-Oil and Oil-to-SF6 technologies. Even if it may be difficult for the sales to assess how many bushings of these sub-categories they are going to sell, it is necessary information to draw a realistic production plan. For instance assuming a PNO 245kV equivalent to 45% of PNO 550kV at the level of the autoclave (this ratio is obtained from their respective diameter) but also they have significant difference on their manufacturing lead times. On the MPS tools, a spreadsheet called "Riepologo" provides the values of the production plans based on the scheduled orders (See Figure 22.).
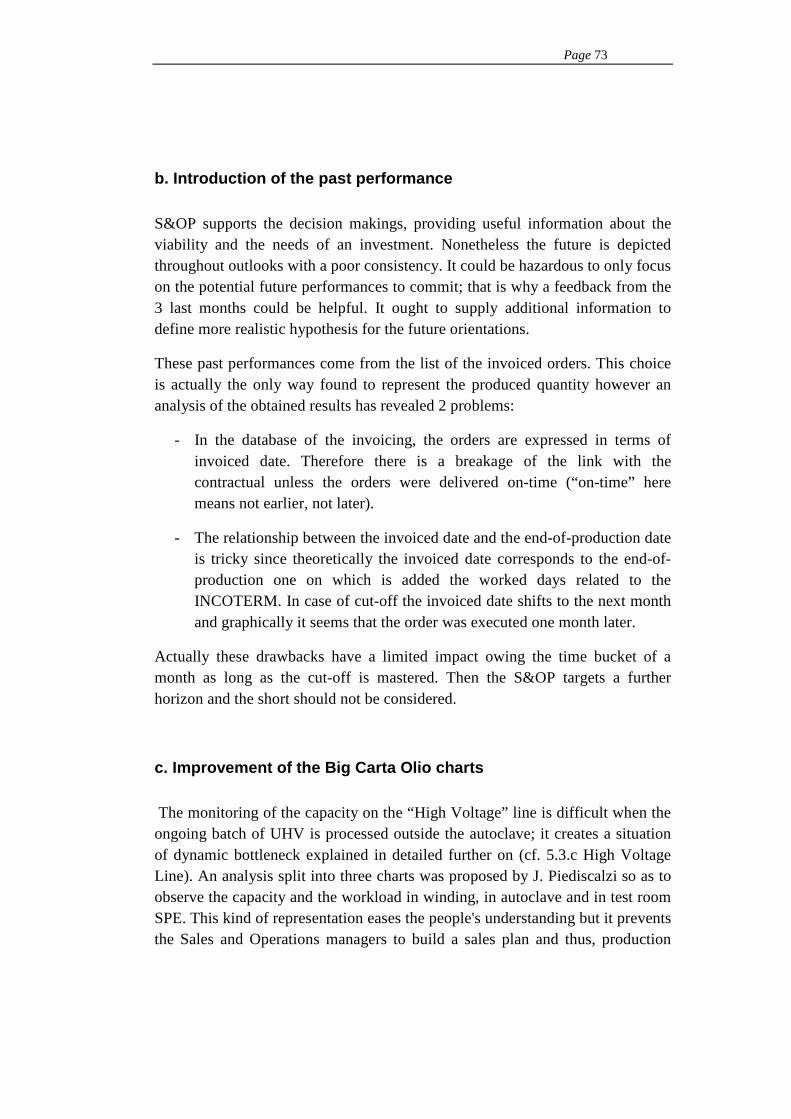
Page 73
b. Introduction of the past performance
S&OP supports the decision makings, providing useful information about the viability and the needs of an investment. Nonetheless the future is depicted throughout outlooks with a poor consistency. It could be hazardous to only focus on the potential future performances to commit; that is why a feedback from the 3 last months could be helpful. It ought to supply additional information to define more realistic hypothesis for the future orientations.
These past performances come from the list of the invoiced orders. This choice is actually the only way found to represent the produced quantity however an analysis of the obtained results has revealed 2 problems:
- In the database of the invoicing, the orders are expressed in terms of invoiced date. Therefore there is a breakage of the link with the contractual unless the orders were delivered on-time (“on-time” here means not earlier, not later).
- The relationship between the invoiced date and the end-of-production date is tricky since theoretically the invoiced date corresponds to the end-of-production one on which is added the worked days related to the INCOTERM. In case of cut-off the invoiced date shifts to the next month and graphically it seems that the order was executed one month later.
Actually these drawbacks have a limited impact owing the time bucket of a month as long as the cut-off is mastered. Then the S&OP targets a further horizon and the short should not be considered.
c. Improvement of the Big Carta Olio charts
The monitoring of the capacity on the “High Voltage” line is difficult when the ongoing batch of UHV is processed outside the autoclave; it creates a situation of dynamic bottleneck explained in detailed further on (cf. 5.3.c High Voltage Line). An analysis split into three charts was proposed by J. Piediscalzi so as to observe the capacity and the workload in winding, in autoclave and in test room SPE. This kind of representation eases the people's understanding but it prevents the Sales and Operations managers to build a sales plan and thus, production

Page 74
plan because they do not have a view in end-of-production. In addition the sub-family S&OP of the Oil-to-Oil bushing 245kV appears and “weights” only in winding and in the autoclaves because it has a dedicated test room, the SP245kV. The idea was to introduce a fourth chart summarizing the situation and to express it in end-of-production date where both Sales and Operations could discuss, however the three charts remain to clearly explain the decisions.
5.3 Master Production Schedule: tool and Process
a. general concerns
The MPS tool must help to make decisions in planning and also to favour the communication between the production and the sales. Regarding the planning, the aim is to offer a picture of the load imposed by the planners matching it with the actual capacity and answer to the question “Am I able to produce what I plan to put on production that week?” As for the link between Operations and Sales the late planned orders must be highlighted and the Sales should be informed of the delay early enough to communicate in correct conditions to the customers and provide a reliable rescheduled date to them.
MPS can be split into two parts where the first one would be the MPS tool that allows building a suggestion of possible planning in accordance to the technical and operative constraints. But the commitment of the planners and more widely of the production comes later after the second phase when the suggested planning is submitted to the protagonists related to the process such as: the department in charge of the procurements, the one providing the bill-of-materials, the sales department, etc. The process ends with the agreement and the commitment of everybody around a common planning.
Another goal, introduced previously, is to enhance the role of the SIGIP database, it means that the information have to come from it and once they are processed they turn back into the system, never SIGIP should be by-passed. It is the necessary condition of an updated and therefore, reliable database system.
So as to perform the planning suggestion, several inputs must feed MPS. The decision making cannot be done just only on end-of-production-date applying systematically a first-in-first-out strategy and so the planners must have an

Page 75
access to various other data such as the customer, the value of the order, the item, the key components composing it, etc.
- The backlog listing all the items due to produce with their related data (supplied by SIGIP),
- The manufacturing lead time so called throughput divided by work orders (given by SIGIP)
- The RPV calendar (providing the worked days) (SIGIP)
- The planning of presence of the operators
- The production plan for the each S&OP family
- The availability of the BOM
- The key component of the BOM necessary to assemble the bushing
The main output formulated by the MPS will be an end-of-production date associated to each item composing the total order; this information drops down in SIGIP by means of work orders. These data can be implemented in two different ways according to the situation. If the manufacturing of the bushings is not already launched on production that means the different work orders related to it are not already frozen; in this case, it is only necessary to modify the final work order linked with the finished products, and the WO upstream will be changed in consequence. If it is anticipated, procurements must be checked to avoid potential problem of stock out whereas it is postponed the conflict will be between the delivery date and the contract date. The overall structure of how MPS interacts with SIGIP is represented beneath.

Page 76
In the next parts of this sections would be presented for the low tension line and high tension one approach proposed by the tool. Both will have the same outline in which will be explained the selected rolling horizon (the time bucket remaining the week), a short charge capacity analysis to highlight and assess the criticality of the main workcenters then. Then having a clearer knowledge of the interactions, and bottlenecks one can decide which is (are) the criterion (a) to build the planning to finally present how the MPS tool works for both low and high tension line work.
b- Low Voltage Line
Rolling horizon selection
MPS
S&OP
- Planning of presences - Material Procurement Planning
End-of-production date
SIGIP
- throughput times - coefficient of
equivalence - calendar of the
worked days
- Backlog - Main sub-parts of
the bills-of-Materials
- Production plan
- Pre MRP - MRP
Production Plan within the frozen horizon (10 weeks)
OTHERS
Figure 18: MPS inputs and outputs

Page 77
The rolling-horizon framework corresponds to the time window in which the planners must sequence the orders based on the given contractual and operational constraints. Its length must be carefully selected and two main criteria help in choosing it: the manufacturing lead time and the procurement lead time. The longest overall lead time provide a rough idea of how wide should be the rolling horizon at least.
- The longest manufacturing lead time regards the oil-to-oil (POBO) and oil-to-SF6 (PCTO) bushings: 4 weeks
- Among its parts, the longest procurement lead time concerns its porcelain: 8 weeks
The rolling horizon must cover a minimum period of time of 12 weeks; based on this data the length of the rolling-horizon was defined at 13 weeks.
Capacity Analysis and bottleneck identification
This paragraph will not be an attempt of Rough cut capacity planning at the various workcenters composing the shop floor but much more a way to figure out the point of concerns that led to the decisions made on MPS and S&OP on ISBT.
The Small Carta Resina and the Small Carta Olio share the line ISBT where along it even if the process steps are close, they have in common only two resources: the assembling and the SPI test room for the rest, they run along separated resources, either for machines or for operators. The sketch tries to represent the actual situation. On the other hand, the throughput times vary not only from one family to another but also from within the Small Carta Olio.
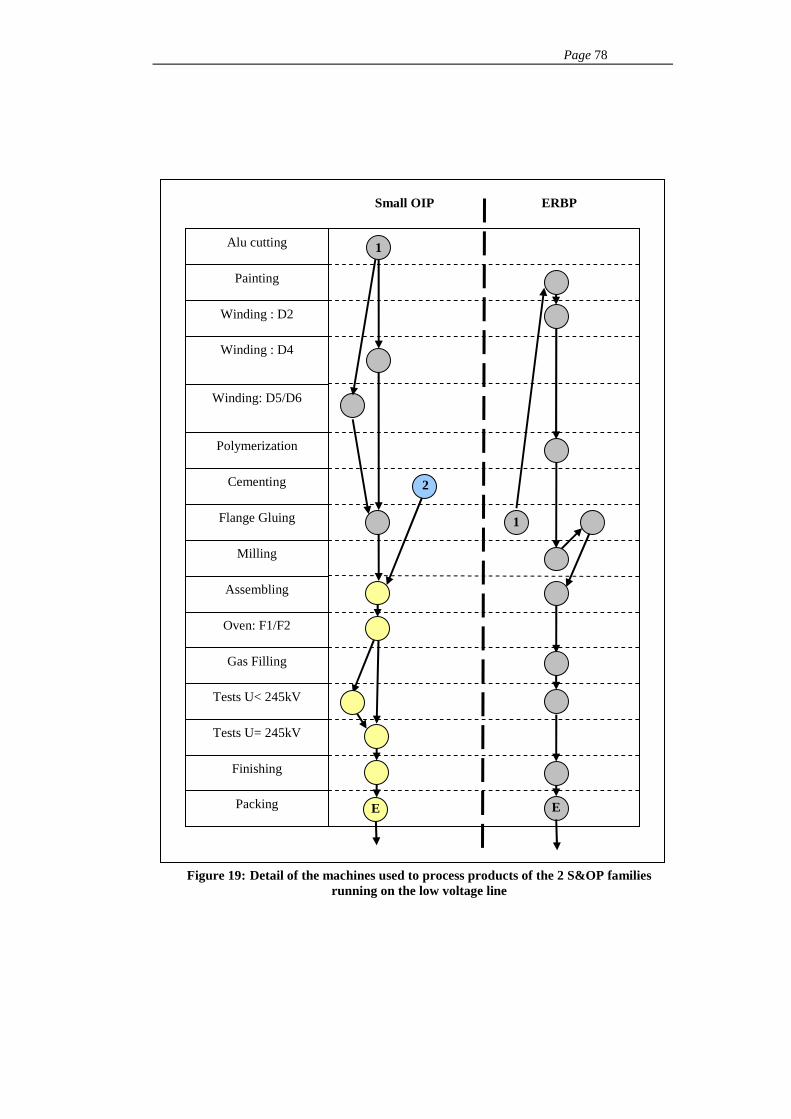
Page 78
Alu cutting
Painting
Winding : D2
Winding : D4
Winding: D5/D6
Polymerization
Cementing
Flange Gluing
Milling
Assembling
Oven: F1/F2
Gas Filling
Tests U< 245kV
Tests U= 245kV
E E
Small OIP ERBP
Finishing
Packing
1
2
1
Figure 19: Detail of the machines used to process products of the 2 S&OP families running on the low voltage line

Page 79
Table 1: Detail of the capacity of the various workcenters existing on the low voltage line
(Test room utilization assumes both SPI and SP245) Why MPS is build in beginning of assembling date?
At first glance it appears curious to have chosen the assembling date as the reference to build the MPS, and the following paragraph will attempt to justify this choice. To plan and further to level in an accurate and simple way it is mandatory to consider a workstation that clusters all the products-in-process on the line. Another matter of concerns is the rate of aggregation over the process because the more the product will be differentiated, the harder the levelling will be.
As described before, the low tension line gathers two families (technologies), ERBP and OIP that have manufacturing processes slightly different. Therefore they use several resources as well as the workforce as the machine, where they do not meet, and they only merge during the pre-assembling, assembling and at the end while the bushings are tested in SPI. Nonetheless the differentiation level is much higher at the end of the process (possible customization in finishing), consequently the assembling (the pre-assembling is included into) seemed the most relevant choice to build the MPS. Besides, the assembling requires to be executed while the two core components composing the bushings are available: the wounded tube (insulating core) and the cover (porcelain or composite). Imposing when the planner decides to assemble; he knows precisely when these components will be required without any back-scheduling (real advantage to optimize the purchase of these elements).
% Utilization Winding
50 %
Assembling 100 % 100 % Oven 100 %
Test room 70 %

Page 80
How it works?
UPR works with an extraction of the backlog that depicts the current situation of the items on production associated to their orders, and so these data must be considered to eventually correct the planning some late orders. While the production is running, UPR chases all the items in-process and they update with the useful information such as the problems of materials, the validation of the assembling, and some other notifications.
When the planner wants to work on the MPS planning, he proceeds in eight stages:
1- Importation of the backlog with the updated notifications
2- Control of the consistency of the data
3- Update of the planning of presence of the operators
4- Re-scheduling of the tricky orders and confirmation of the others in the frozen zone (5 weeks) from the assembling date.
5- Planning of the assembling dates of during the next 8 weeks (from week 6 to week 13)
6- Validation
7- Control of load/capacity in the table of synthesis grouped by MPS family
8- Control of the consistency between the planned orders and the production plan provided by the aggregate families S&OP
The importation is nearly fully automated during the opening phase of the spreadsheet, the BOM, throughput times are updated (time between the winding and the assembling, time between the assembling and the test room, time between the test room and the end-of-production and cycle times of the winding and assembling) whereas the importation is executed once the user clicks on a push button entitled “Import”.
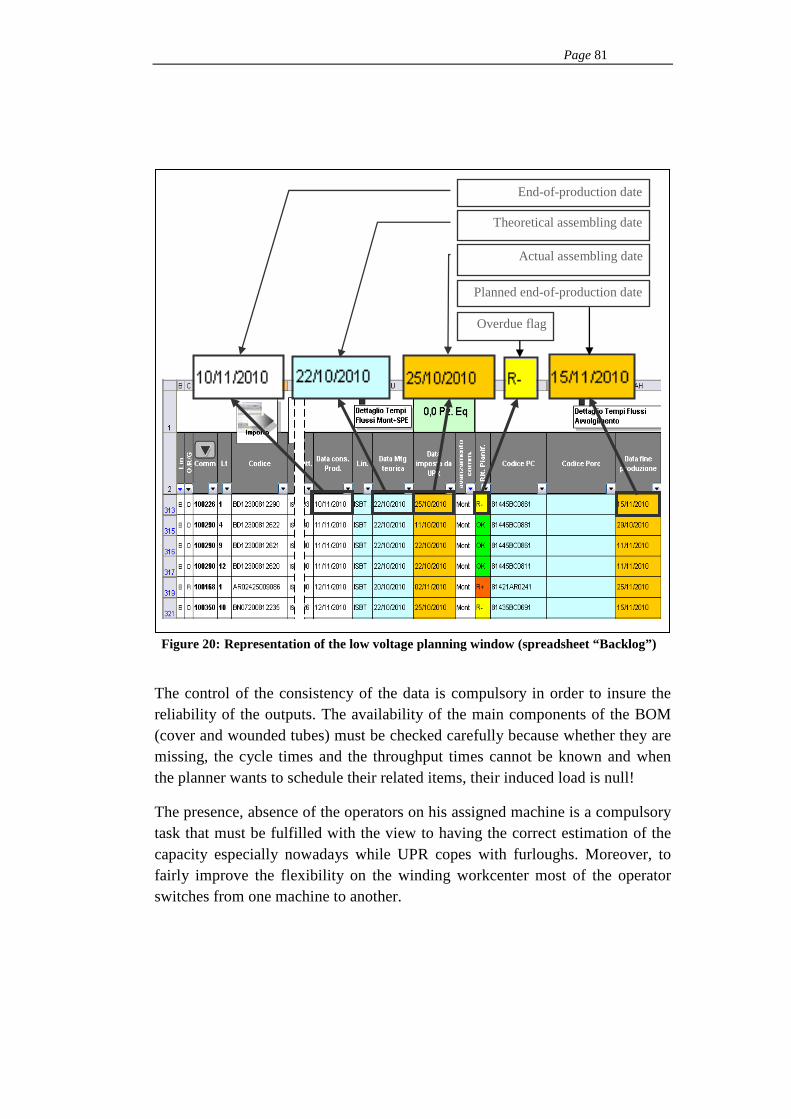
Page 81
The control of the consistency of the data is compulsory in order to insure the reliability of the outputs. The availability of the main components of the BOM (cover and wounded tubes) must be checked carefully because whether they are missing, the cycle times and the throughput times cannot be known and when the planner wants to schedule their related items, their induced load is null!
The presence, absence of the operators on his assigned machine is a compulsory task that must be fulfilled with the view to having the correct estimation of the capacity especially nowadays while UPR copes with furloughs. Moreover, to fairly improve the flexibility on the winding workcenter most of the operator switches from one machine to another.
End-of-production date
Theoretical assembling date
Actual assembling date
Planned end-of-production date
Overdue flag
Figure 20: Representation of the low voltage planning window (spreadsheet “Backlog”)
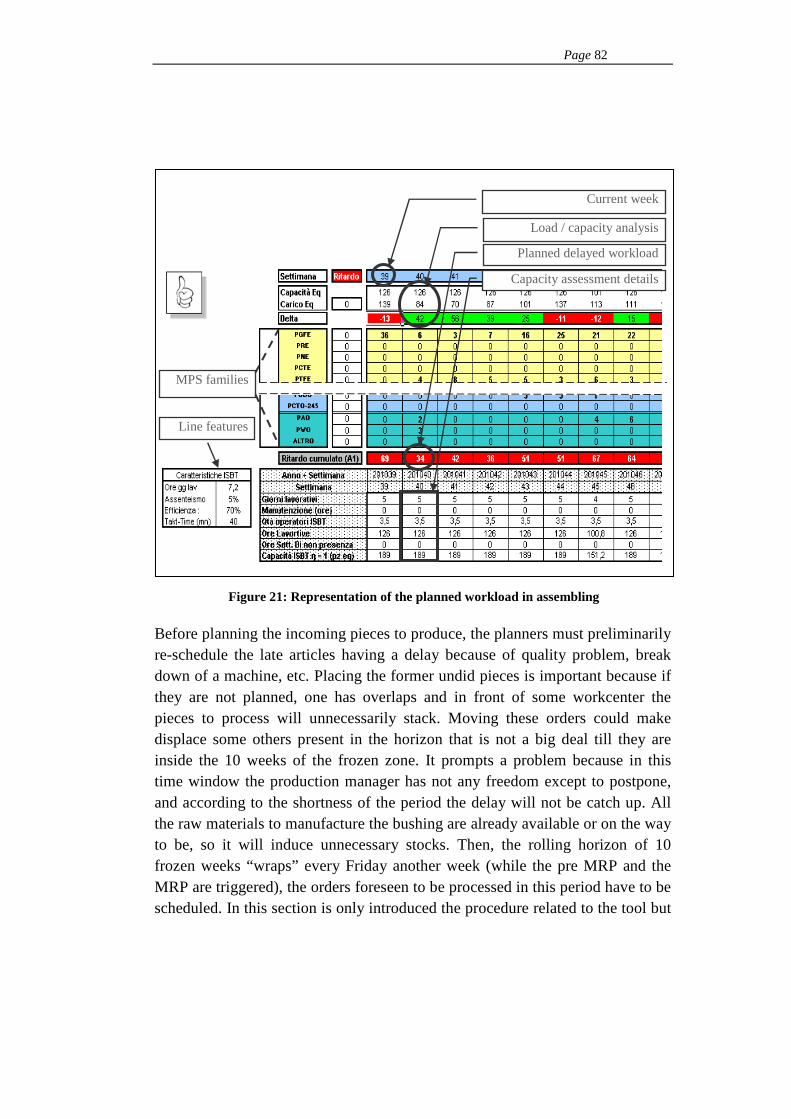
Page 82
Before planning the incoming pieces to produce, the planners must preliminarily re-schedule the late articles having a delay because of quality problem, break down of a machine, etc. Placing the former undid pieces is important because if they are not planned, one has overlaps and in front of some workcenter the pieces to process will unnecessarily stack. Moving these orders could make displace some others present in the horizon that is not a big deal till they are inside the 10 weeks of the frozen zone. It prompts a problem because in this time window the production manager has not any freedom except to postpone, and according to the shortness of the period the delay will not be catch up. All the raw materials to manufacture the bushing are already available or on the way to be, so it will induce unnecessary stocks. Then, the rolling horizon of 10 frozen weeks “wraps” every Friday another week (while the pre MRP and the MRP are triggered), the orders foreseen to be processed in this period have to be scheduled. In this section is only introduced the procedure related to the tool but
Planned delayed workload
Capacity assessment details
Load / capacity analysis
Current week
MPS families
Line features
Figure 21: Representation of the planned workload in assembling

Page 83
a set of meeting grants the consistency of the decision and communicate the situation of each order to the sales department.
The planning of the 8 other weeks is really important. First the engineering will check the availability and the thoroughness of the BOM and the workcenter where should be processed the parts (for example the machine to wind the tube for the OIP, D2 or D5/D6). Then the procurement works on preventing any stock out and so it insures the availability of every parts and raw materials at the needed moment.
Clicking on the button “Control”, the tool sends to the summarized insight where orders are aggregated and sorted by MPS family, while the load matches the capacity (See Figure 21.). On the left, a column evidences the late assembled pieces; in phase of validation it must be empty. Right below the table, a row represents the planned to be assembled late items. The table under the main one depicts how the theoretical load at the various machines performing the winding is. The winding works by Kanban system; so this table should be only used to check the thoroughness between the needs in wounded tubes induced by the planning of the assembling, the quantity of Kanban cards and the stock in RAV.
The target of this tool is to progressively untied the link between the backlog and the production, and enhance the role of steady production plan, so after a first iteration the planner has to check how consistent is the load of the items planned to be produced with the production plan expressed by S&OP. The S&OP family “Small Carta Olio” production plan aims 200 equivalent pieces a month, and assuming for instance 22 worked day in July, one gets the run rate of 9 equivalent pieces per day. This figure must agree with the load of the OIP planned to be produced on the low voltage line. The spreadsheet untitled “Riassunto” offers this vision depicting the MPS in end-of-production matching the load and the S&OP production plan, spreadsheet, ERBP, RIP and OIP are separated since each of them has its own production plan (See Figure 22.). The planned late orders are also represented; it means that the production team has a foreseen of the service rate that can be challenged and it completes the information given by the current service rate (See Performance section). This picture can be relevant tool of discussion with the commercial.

Page 84
c- High voltage line
The bushings manufactured on this line are technically close one to each other but they suffer from a huge disparity in their lead time. In addition another family runs onto, the batches of Ultra High Voltage which effects will be shown in the second paragraph of this part. These elements drive to manage the planning on this line in a different way with respect to the low tension line.
Rolling horizon selection
Similarly to the low voltage line, the overall lead time, summing up the longest procurement lead time and the longest manufacturing lead time, one estimates
Weekly run-rate defined in S&OP
Weekly planned workload
Alignment MPS/S&OP
S&OP family Planned late orders
Figure 22: End of production representation analyzing the late orders and the alignment S&OP/MPS
Page 85
how large should be the time window covered by MPS. The references coming from really specific customers’ requests were not taken into account in order to have a reasonable width on the analyzed horizon. Here the UHV bushings are put aside because they are managed as project. The most critical (longest) overall lead time of the bushings processed on the high voltage line is the PNO 550kV.
- The porcelain needs 14 weeks to be stored in RPV while it is ordered and purchased.
- The longest manufacturing lasts 10 weeks
These two lead times must not be summed directly up because there is an overlap between them. Actually the porcelain must be cleaned and cemented some days before the assembling (occurring 31 days after the launch on production) that means the effective manufacturing lead time to assume is 6 weeks. The MPS horizon of time should be more than 20 weeks and it actually covers 25 weeks. The length of the period creates the problem of the density of the backlog and the foreseen orders should be added, this should be followed in the future to enhance the reliability of the MPS.
Capacity Analysis and bottleneck identification
Both UHV and Big Carta Olio share the high voltage line, and the UHV batches prompts significant variation of the workload. Previously the purpose of the load/capacity analysis was to put in evidence the bottleneck and therefore the throughput of the line while here, it will to attempt to highlight and quantify the impacts of the UHV over the process. This situation clearly depicted will enable a better understanding of the bottleneck.
The graphic beneath tries to show what the shared resources between the two families are:
- the plotter cutting the aluminium screens
- the operators and machine to cement the porcelain
- the operators and machine to glue
- the operators and machine to check the glue quality

Page 86
- the operators in charge of assembling
- the test room SPE
Then, owing to the size of an UHV bushing, it is assembled by the operators usually performing this job but in the test room SPE. The autoclave dedicated to dry the core of the bushing is located in SPE as well. Thus, during the period of loading, unloading of the autoclave, the assembling, the finishing and packing the test activities are all stopped for safety reasons (no one can be on the testing while tests are performed) but it can run normally once the autoclave is filled.
As for the winding of an UHV bushing, even if it is performed on M9 that have its own team, it affects the activities on D5 and D6. Its winding needs simultaneously two rolls of paper that must be preliminarily warmed up on D5 or D6 (according to the model 800 kV and 1100 kV 1 or 2 set of rolls of paper must be used). Moreover an 1100 kV insulator requires a “filler” so as to reduce the amount of oil in the bushing, it is made on D5 or D6 and the used roll of paper is heated on D5/D6. Finally once a condenser core is ended, operators from the other machines (again D5/D6) help to bring it out. The loads induced by all these activities are summarized on the table here below.

Page 87
Alu cutting
Winding: D5/D6
Winding: M9
Autoclave/Oven (l < 8000mm)
Autoclave SPE (l>8000mm)
Cementing
Gluing
Glue testing
Assembling
Impregnation
Tests U≤ 245kV
Tests U≥ 245kV
Finishing
Packing
1
2
E
1
2
E
Big OIP UHV OIP
Figure 23: Detail of the machines used to process products of the 2 S&OP families running on the high voltage line

Page 88
Workcenter %Utilization Winding D5/D6 43% Assembling ISBT 100% Oven F3 100%
A7 100% A8 100% A12 100% A5 100%
Autoclave
A6 100% SP245 variable
Test room SPE 40 % Table 2: Detail of the capacity in the different workcenters of the high voltage line
Regarding the UHV batches, the most critical resource, the bottleneck, would be the autoclave located in the SPE for two reasons. First it can only host a limited quantity (9x1100 kV or 800 kV DC, 16x800 kV or a mix), then the treatment duration is 40 (solar) days to which must be added the loading and unloading times. That means about 8 batches can be manufactured over a year. The rest of the required jobs to manufacture the UHV insulating bushings must be put in phase around. Therefore the available capacity over the line to produce the “Big Carta Olio” family corresponds to the residual capacity remaining after the batches were planned on the various workcenters. According to the position of the current batch on production the capacity will vary in saw teeth and so, some changes must be done to shrink the negative impacts and to improve the throughput. The protagonist of Eliyahu M. Goldratt states “Every time a bottleneck finishes a part, you are making it possible to ship a finished product” [18], this statement can be directly applied to the RPV- PASSONI E VILLA case, barely a batch goes outside the autoclave it must keep running until it will be shipped; the bottom line throughput has to be equal to the bottleneck one. Consequently the effect on SPE cannot be buffered but the one in winding can be drastically limited anticipating and so spreading this job over a longer period (almost 8 worked weeks) instead of running in a short period the whole batch.
Hypothesis: winding all the batch pieces in row
- Assuming a batch of 9x 1100kV
- Worked shifts: 8.5 shifts per piece
- Available shifts on winding: 100 shifts per month

Page 89
- Total workload: 76.5 shifts
� The winding of a batch in once can load 75% of the monthly capacity of the workcenter.
Pursuing this logic the bottleneck switches from the treatment to the winding. In addition the demand is pulled by the oven and the autoclaves, therefore the winding must be anticipated.
Workcenter %Utilization Winding D5/D6 100% Assembling ISBT 60%
Autoclave and Oven
A7 A8 A12 A5 A6
60%
SP245 variable Test room
SPE 27%
Table 3: Detail of the capacities with the winding saturated In addition, the batch must be wounded within 45 days that corresponds to the duration between two launch of big autoclave. Therefore the workload induced by the batch can be spread out or given amount of “Big Carta Olio” has to be anticipated to supply the demand. The two hypotheses are developed here below and the excess inventory cost is computed to determine what the best solution is.

Page 90
Figure 24: Representation of the 2 hypothesis
Winding production: Hypo. 1 & 2
Equ
ival
ent w
orkl
oad
Month
Capacity delta created by a batch of UHV
Anticipation of Big Carta Olio bushings
Capacity Demand Production Plan
Equ
ival
ent w
orkl
oad
Month
Cost inventory comparison (Hypo. 1 vs. Hypo. 2)
Cos
t of E
xces
s In
vent
ory
(k€)
Month
Inventory cost in Hypo. 1 Inventory cost in Hypo. 2

Page 91
Even though, this brief explanation simplifies the problem, the benefits of the second hypothesis are important. First, the activity on the winding machine D5/D6 is smoother and the anticipation of the UHV wounded tube production enables to align the winding capacity with the treatment one. Then the second interrogation is about the cost induced by this anticipation, because of a similar holding cost, the planners should get advantages on applying the second hypothesis (spread of the UHV winding over the treatment duration)
The electrical tests are performed in the test rooms, they are two; SP245 checking all the insulators until 245kV, they represent 42% of the mix of products running on the high voltage line and SPE controlling every bushing above 245kV. As it was described here above, the capacity in SPE depends on the presence of a processed batch and its activities must be carefully planned.
Why MPS is built in the entrance day of treatment?
Contrary to the low voltage line, the pieces entering in the autoclave/oven has not already been assembled and the differentiation does appear further on when the porcelain, the flange are coupled around the core and during the finishing (ultimate step of the process). So the planner deals with a high aggregation rate (few codes of products) and the main matter of concerns would be the length and the diameter of the wounded tubes to select the right autoclave. The current data allows stating that to 1200 finished goods codes can be associated to 646 codes on winding therefore the level of aggregation is higher and it will be easier to plan and to level with the date while the cores are put into the autoclave.
Before going further on detailing how to control the average pace and the mix of processed pieces, more explanation about the autoclaves and the oven ought to be delivered.
The treatment time is actually conditioned by the diameter of the wounded tubes, the thicker is and the longer it takes to dry the overall. On the high voltage line this time may vary in a range from 10 to 24 days and to do so an autoclave or an oven can be used.
One puts into the autoclave the “bared” cores (whatever is its diameter) and they remain a given period of time, it is important to mention that ideally the

Page 92
elements enter and exit together but it can be opened, later on, in order to add in or take out pieces. The planner will attempt to wounded tubes requiring the length in treatment. RPV owns 5 autoclaves dedicated the big OIP bushing with the following characteristics:
Autoclave Eq. Capacity Eq. diameter Length Control A8 50 Eq. Pieces 138 mm <4000mm Imposed A7 42 Eq. Pieces 138 mm <5000mm Free A12 10 Eq. Pieces 254 mm <6590 mm Free A5 10 Eq. Pieces 254 mm <8000 mm Imposed A6 10 Eq. Pieces 254 mm <8000 mm Imposed ASPE 9 Eq. Pieces 550 mm < 13500 Imposed
Table 4: Features of the autoclave performing the treatment of the bushings on the high voltage line
The oven offers much more flexibility since a wounded tube can be put into and come off over whenever. It is still limited in length (6800mm) and moreover in diameter because the core is crept in a hollow blind tube and two sizes are available (258 mm and 318 mm).
The target of the planning is to provide a pace to the production flow, in this case as the goods are stuck in treatment workcenter for a long time regarding to the rest of the process, the current flow is full of crests and therefore it is better to deal with an average throughput. Nonetheless, one would attempt to create a flow as smooth as possible that can be performed by a wise scheduling of the launches of the autoclaves and in the meanwhile because of their restrictions it will impose a mix of products to the whole production line.
An analysis gathering all the invoiced orders from September 2009 to July 2010 and the backlog from August to December (period when it is consolidated) gives some information about the mix requested by the market. It highlights that in average around 50% of the demand (an amount of 735 bushings) concerns bushing requiring a treatment duration of 10 days (diameter less than 160mm) and their lengths are less than 5000 mm as reported on the table beneath:
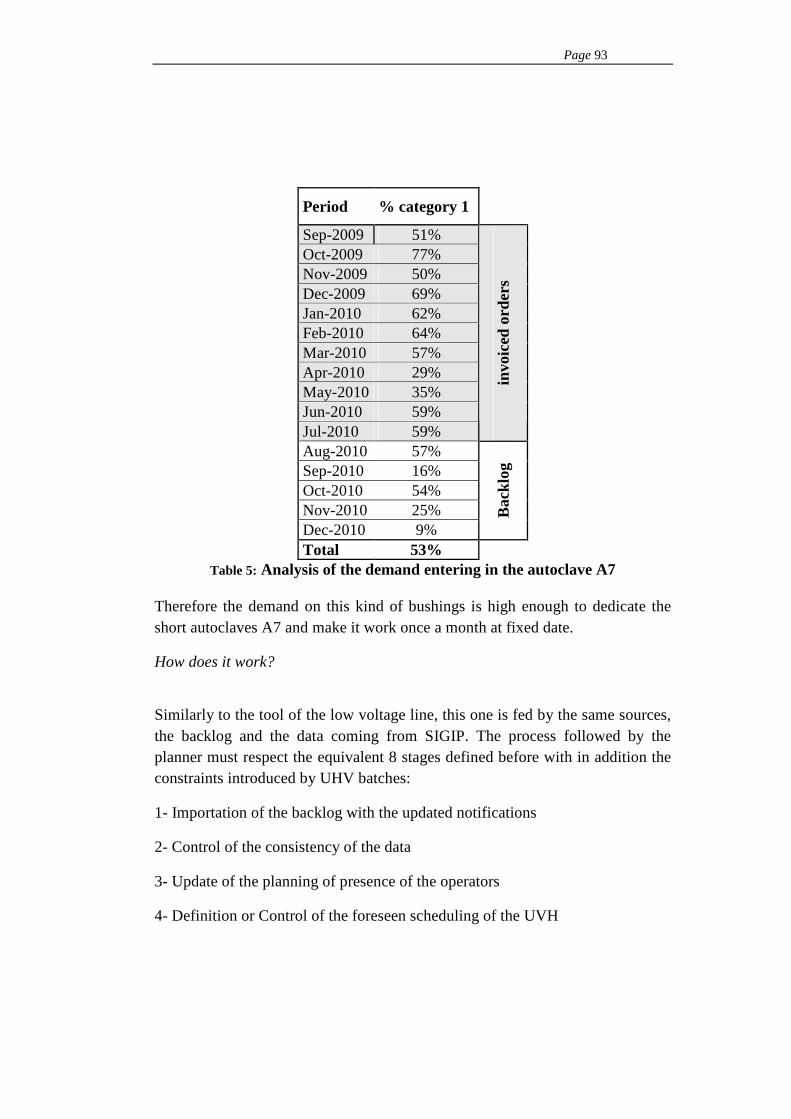
Page 93
Period % category 1
Sep-2009 51% Oct-2009 77% Nov-2009 50% Dec-2009 69% Jan-2010 62% Feb-2010 64% Mar-2010 57% Apr-2010 29% May-2010 35% Jun-2010 59% Jul-2010 59%
invo
iced
ord
ers
Aug-2010 57% Sep-2010 16% Oct-2010 54% Nov-2010 25% Dec-2010 9%
Bac
klog
Total 53% Table 5: Analysis of the demand entering in the autoclave A7
Therefore the demand on this kind of bushings is high enough to dedicate the short autoclaves A7 and make it work once a month at fixed date.
How does it work?
Similarly to the tool of the low voltage line, this one is fed by the same sources, the backlog and the data coming from SIGIP. The process followed by the planner must respect the equivalent 8 stages defined before with in addition the constraints introduced by UHV batches:
1- Importation of the backlog with the updated notifications
2- Control of the consistency of the data
3- Update of the planning of presence of the operators
4- Definition or Control of the foreseen scheduling of the UVH

Page 94
5- Re-scheduling of the tricky orders and confirmation of the others in the frozen zone (10 weeks) from the assembling date.
6- Planning of the assembling dates of during the next 8 weeks (from week 6 to week 13)
7- Validation
8- Control of load/capacity in the table of synthesis grouped by MPS family
9- Check of the load/capacity in winding and SPE tables
10- Control of the consistency between the planned orders and the production plan provided by the aggregate families S&OP
Here it is meaningless to expand again the 8 common steps shared with the other line. Instead the focus will be put on the points 4 and 9. As repeated above a UHV batch influences a lot the overall production process and the 4th point suggests to know and impose in anticipation exactly when, where, and how will be stricken the capacity on the line by scheduling it.
Practically for each batch the main steps of the process are detailed, once the planner has inserted the mix quantity, the various dates associated to each step, a Gantt chart is automatically built in accordance. The bottleneck is the autoclave, thus to optimize its utilization and have a good overall efficiency it is easier to plan from it. The first date, to be logged in, would be the one on which the UHV
Figure 25: Gantt chart of the UHV batches assessing their impacts on the capacity

Page 95
bushings are put into their dedicated autoclave. Then by back and fore-scheduling the other dates can be assessed, but in any case the implemented dates must be defined from its linked loads and the available capacity on the workcenter at the concerned time buckets. It is possible to spread out the gross load by winding over a longer period than suggested by the gross load. This aims at preventing the winding from being a new bottleneck later for big OIP passing through this workcenter too.
Afterward, the big OIP can be planned by their entrances of autoclave or oven starting from the late orders (not already treated) to re-schedule. The tool will find the winding code with its diameter and its length associated to the finished good code. These data supply information to suggest an autoclave whose has a trigger date. Actually A7, A8, A12 are ruled to create an average pace to run throughout the line with a mix of products. One can compare it with the wagon of a train, leaving and arriving at fixed date, if for some reasons, good misses it, according to its status (will be late or not) it can be put into the oven where each piece runs independently to each other (like taking a taxi cab) or wait for its recommended autoclave. So the autoclaves, based on the rules, will be filled in priority and both particular and late products will go to the oven F3 or A5 and A6. Under “particular” all the products having a too poor yearly demand or having particular features (large diameter and short length…) are clustered.
Suggested and actual assembling dates
Planned end of production date and overdue flag
Autoclave or oven suggestion Actual treatment date and resource selection
Suggested and actual treatment dates
End of production date
Figure 26: Representation of the planning window (spreadsheet “Backlog”)

Page 96
This job done, the planner has to click on “Controllo” to trigger the computation and it shows the actual sight of the autoclaves situation. Although it could be acceptable here, an accurate checking of the other workcenters will be mandatory for the reasons mentioned in the previous paragraph. These Rough cut capacity planning are depicted below the main one as represent here below.
In case of trouble downstream the treatment, some leverages allow an easy correction. When a bushing comes off the autoclave/oven, it will not be necessary assembled right ahead and it could wait for better time. This correction can be set on the spreadsheet “Backlog” shifting the Assembling date
Oven
Autoclaves
Equivalent capacity
Equivalent pieces in treatment
Equivalent capacity
Planned late orders
Figure 27: RCCP of the various resources performing the treatment

Page 97
forward and consequently its tests one, the direct consequence would be to postpone the end-of-production date (See Figure 26.). On a contrary, upstream the treatment the only possibility would be anticipating; this possibility from a planning standpoint does not make sense because a Kanban system drives the wounded tubes production to match the treatment demand. A too stiff planning on winding would lead to by-pass the effect of the Kanban system. The prospect that the winding table illustrates, ought to be considered as the amount of cores stored or in progress to pursue treatment demand. Within its novel Eliyahu M. Goldratt has highlighted the main mistake to avoid on trying planning and optimizing the utilization of a production line.
“‘Utilizing’ a resource means making use of the resource in a way that moves the system toward the goal. ‘Activating’ a resource is like pressing the ON switch of a machine; it runs whether or not there is any benefit to be derived from the work it’s doing. So, really, activating a non-bottleneck to its maximum is an act of maximum stupidity. […] we must not seek to optimize every resource of a system, […] A system of local optimums is not an optimum system at all; it is a very inefficient system.” [18]
The auxiliary views must be used to verify the feasibility (the load remains below the available capacity) but the planner should never attempt to optimise the utilization of the non-bottleneck because it will only create excess work-in-progress.
Finally, the spreadsheet so-called “Riassunto” enables a common base of work around which the Sales and the Operations can discuss about the short and mid-term contracts on process or planned to be processed (Not presented but equivalent to Figure 22.). Once an order goes into the frozen zone of the 8 weeks it cannot be moved unless it is to postpone it outside the frozen zone. In this case, this shift would release space that unfortunately the planner would not be willing to catch up (mainly for procurement reasons) with the consequence of a loss in the overall efficiency.
The information turns back into SIGIP implementing the production plan; the next section tackling about the MPS process will develop among other this point.

Page 98
d- MPS Process
It was introduced that the Master Production Scheduling can be divided into two different entities: a tool and a process. Actually, the tool helps the production planner to build suggestions that have to be validated or invalidated after meetings with all the involved protagonists. By a set of meetings the planning is updated and consolidated with a view to being effective right back. AREVA T&D advises to proceed in three meetings covering the most probable issues met in production:
- Detailed demand
- Supply and Resource Planning
- MPS reconciliation meeting
The next parts will present the theoretical contents of each meeting and how it will be adapted in RPV based on its inner constraints. These appointments are like milestone of the MPS and they expect to enhance the decision and the planning.
Meeting 1: Detailed Demand
Through this appointment between the sales/contracts manager, the production manager and the operations manager will have a look on the backlog, they pay particularly attention to the forthcoming orders to be produced. The sales/contract manager should put in evidence the orders with special customer’s request, and aside he must formulate his list of priority. This discussion occurs every Monday and it is done around the backlog and the planning of the previous week then the managers browse a checklist of the planned orders to see those finished and those late. Therefore a draft of the future planning including the new frozen week of the rolling horizon can be sketched.
Once the foreseen end-of-production date will be stabilize, in a medium/long term production and sales should try to improve the analysis of the orders from their Inco term to avoid, or least to reduce, the cut-off, this job would be the next stage after the planning process will be handled and the overdue eliminated from the backlog.

Page 99
Nonetheless some rules must be respected; no orders can be hurriedly incorporated to the frozen horizon since it could lead to significant problem of availability such as materials, capacity, resources, etc. In the meanwhile operations and production ought to assure a good steadiness of the planning over the weeks (especially in the frozen zone) in order to give a reliable visibility to the sales/contracts manager and so to the customers.
The goal of this meeting does not expect any commitment from one of the sides but it attempts to phase the demand plan with the updated production plan under construction and thus to enhance the tight link between the demand and the production (be more customer oriented).
Meeting 2: Supply and Resource Planning
This meeting is the main one because it enables to state for each planned orders if the production would be able to manufacture it or not at the expected planned date. This appointment will be carried out every Thursday and it can be seen like a production meeting because it gathers all the actors of the production life:
- Safety
- Quality
- Time and method
- Technical office
- Maintenance manager
- Supervisors
- Production manager
- Procurement managers
- Operations manager
The outline of the meeting targets to cover two aspects of the operations: the production performances and the feasibility of the planned orders. The first part should be a review of what has happened in the unit last week, with the efficiency of the workcenters, the current scrap rate and the explanation for each

Page 100
MPS family… The service rate of RPV (named A1) with the late orders detail and the service rate of its suppliers (so-called A2) indicate the input and output performances. This section of the appointment permits to improve the accuracy of the MPS tool, modifying some input parameters such as the efficiency, the planning of the presences so as to build the most representative model and to consolidate it.
The second part aims at checking the likelihood of the planned orders at two levels, the scheduling of the incoming week and further on the rolling horizon. It may wonder why the next week is observed; from a planning point of view there is not any leverage. Actually the purpose of this control is to prepare the beginning of the week to reduce the delay risks at their maximum and to start smoothly producing on Monday. A late order in the frozen period could indeed spoil the planning and the least is to ensure the stability of this short term horizon. To do so, the production proposes a short review of the delays on orders that popped up on production till now. Then he refers to the concerned workcenter to understand why they are stuck in process here (lack of materials, lack of capacity regarding with the load…) with the purchase department (replenishment), the quality (scrap), the maintenance (break down, maintenance activities). This part of the meeting will end with a set of decisions and actions around which everybody grant and commit so as to prevent these events from happening again in a long term.
Afterward, the focus will be on the production plan not already wrapped in the frozen period (5 weeks or 8 weeks according to the product line). This section of the appointment prepares the planning of the orders before they enter in the frozen zone. Actually many conditions put into jeopardy the viability of the sketched production plan, the earlier (so the further from the current day) these troubles are highlighted and treated, the more sustainable will be the production plan will be in a short/medium term (the frozen and the moderately firm zones). The chart as follow represents the dependency of the various entities acting in executing the orders:

Page 101
Having the order planned in a reliable way once they enter in the frozen zone means upstream these departments have checked if all the elements necessary to process the requested items are available or ready.
Firstly the Engineering department in charge of releasing the bill-of-materials must control all the forthcoming order in the weeks 12/13 for the low tension line and weeks 21/22 for the high voltage one in the rolling horizon. The sooner they are available, the more the others can anticipate as well. It does not matter whether the final customization is stated or not on the BOM whereas the critical elements requiring long procurement lead times must be known rapidly to be stored on-time. Actually most of the articles (finished product codes) have ever been engineered and they do not need checking any longer.
At that time from the bill-of-materials and their data (scrap rate, suppliers’ service rate) the quality can warn the folks in charge of purchasing or the production of potential issues or they need of samples to carry out statistical analysis.
The time and method controls the thoroughness of the cycle time, the length and the diameter of the wounded tubes, the different throughput times so as to be sure that the induced load of the orders would be adequate and send to the right machine among the workcenters. They also need the feedback from the
Engineering Release of the BOM
Quality Scrap rate, A2
Procurement Purchase of materials
Time and Method Cycle time/code features
Maintenance Resource availability
Storage Shortage and availability
Production Production plan
Figure 28: Entities interactions around the production and the planning
Page 102
maintenance to eventually find a parallel way in case of foreseen breakdown of a machine. All these considerations must applied on SIGIP since the MPS tool works with, a mistaken data on SIGIP is likely to distort the planning (changing the workload or the assigned machine) and to blindly prompt trouble on production later on.
The procurement does need the BOM to start its job. Before buying the required parts, the procurement makes sure that the components or raw materials are stored neither totally nor partially, taking into account the consumption that it will have before manufacturing the order. The production plan built from the MPS tool works and sorts no more by order (even if the work orders match the demand) but by finished good code; this helps the procurement to cluster the demand on material to define some lots. Another tool on SIGIP (PCB) enables to manage in that way but they compel the implementation of the whole production plan and not only the frozen zone to be efficiently used. Commonly the availability of the material is the main problem in planning and the MPS does not phase the planner’s decisions with any supply planning that is why they must work closely one to each other to draft a meaningful planning.
The protagonist of the supply and resource must prepare before the meeting from the sketch designed between the Monday and the Thursday to come up with changes suggestions, idea. The appointment is organized not to discover the planning and to bear it but to finalize and to commit the planning choice and a set of actions/decisions. The supply and resource planning meeting is the cornerstone of the MPS process since all the entities involved in the operations agree, from a technical (physical) point of view the order can be done at the decided date and therefore one gets a robust planning.
Meeting 3: Reconciliation meeting
The state-of-the-art addresses the problem of coordinating sales and manufacturing during the critical planning activity of the Master Production Scheduling and it goes on granting, the agreement around the built planning has a contractual value between the sales/contract and the production, the article written by Hahn, Edward Duplaya, & Kim has described this relevant need of synergy between them. The purpose of the reconciliation meeting is to conclude the MPS process and match what the theory advised. This short appointment is

Page 103
carried out Thursday afternoon or Friday morning with the sales/marketing, the operations, the supply chain and the production managers.
It opens with a follow-up of the performance indices regarding the operations:
- Actual customers’ service rate
- Foreseen customers’ service rate
- Suppliers’ service rate
- Overdue rate in the backlog
- Invoiced amount in cut-off
- Inventory
Afterward the viable planning resulting from the 2 previous meetings is submitted to be validated. An action plan synthesizes the actions and decisions defined throughout the MPS process; it minimizes the occurrences of the key issues put into evidence at the supply and resource planning meeting. The agreements about the planning of the orders on production and the actions will regard the whole rolling horizon of both lines (low and high voltage lines), the persons should not only stare at the frozen horizon since they are supposed to be stabilized upstream.
The reconciliation meeting will finally be formalized through a minute-of-meeting contracting the commitments of each protagonist; they can be updated and checked the next week.
Milestone of the Master Production Scheduling
The goal of the MPS procedure is to structure the planning approach with a clear guideline: the phasing of the resources, the materials, the entities, and the people around a common target. Nonetheless the information would smoothly flow only if it dropped down the system SIGIP and disturbances did not pop up. To do so, the planning must be sequence according to the meeting and the running date of the MRP.

Page 104
From the review of the priorities, the detailed demand meeting enables to shift forward or backward the orders that have not already been entered in the frozen zone. The concerned period of time is quite long and so the number of orders to deal with. The planner can work on until the Thursday, the day when he meets the other entities of the operations; a tight collaboration with the supply chain (procurements) is expected. In parallel, the people control the orders and their data (equivalent coefficients, assigned machine…). The objective is to define the planning over the whole horizon taking into account the new rolling week; the planning will be confirmed or modified on Thursday.
Next, the two meetings on Thursday supply a precise idea of how to manage the production in a short term based on the events occurred on production until this day. Subsequently the planner can modify the planning in the short and medium term as followed:
- Re-scheduling of the late orders
- Daily scheduling of the week n and n+1 (assembling and test rooms)
- Consolidated planning over the frozen zone
The jobs of re-scheduling and consolidation must be done by Friday afternoon in order to be implemented the production plan in SIGIP and to make run the MRP later on. Instead the daily scheduling will be provided Monday morning for the first shift. For reason of convenience the information dropping into SIGIP will only the one inside the frozen zone.
The chart below summarizes the milestones of the MPS procedure:

Page 105
Implementation on SIGIP
All along this section one repeated, one of the key points of a successful planning would be the anticipation and the steadiness of the workflow; it means that once an order is within the time window of 4 weeks including the current one, only few disturbances could appear. The MPS process made of 3 three meetings guarantees, partly, a mitigation of this issue but a correct insertion of the data in SIGIP is compulsory. At the end of the week the planning managers conclude when, where and how many pieces of each type of items are going to be launched on production; somehow they define a production plan. This relevant information must be implemented into SIGIP.
Insertion of the production plan
The use of SIGIP evolves with the new MPS definition because the commitment of the planning managers with respect to the order to produce is translated according to a production plan. Until now the production plan had been guided
Thursday Friday Monday Tuesday Wednesday
Re-scheduling of the late orders
Daily scheduling weeks 1&2
Frozen zone consolidation
Global planning definition
Global planning consolidation
Production plan implementation
Detailed Demand meeting
Supply/Resources planning meeting
Reconciliation meeting
Pre MRP computation
MRP computation W
eek
End
Figure 29: Gantt chart of the MPS planning process

Page 106
by the contractual date, and the UPR decision were not visible on SIGIP as long as the work orders were not released (it means 1-3 weeks before the launch on production). Despite the simplicity of this technique, this was harmful from an MRP standpoint. In purchasing, the real needs had not been synchronized with the planning but with the chronology of the backlog what had imposed a continuous control of the purchase orders to check if they were to UPR expectations. Now UPR takes the “control” of the all the orders entering in the time window of the 10 incoming weeks by imposing its end-of-production date computed from the assembling date that they select (use the schedule and level the workload); it is a step forward as well as for the work orders generation, as for a future possible optimisation of the purchase policy since everything is synchronized with the production plan. Once the production manager, G. Ritondale, approved the methodology, he suggested freezing 10 weeks of production plan for all the codes of finished good either Low or High Voltage. Weeks are frozen because in the opposite case if the end-of-production date is not put in phase with the contractual date (owing to an anticipation or a delay), the pre-MRP erases the former data every time it runs while it remains from one MRP to another if the quantity is within the frozen zone.
Practically, once UPR is sure of its decisions, it symbolically validates its planning clicking on button “Verso Tabella Dati” in the spreadsheet “Backlog” of the MPS tools. It generates a pivot table where for each code of finished good will be detailed the quantity sorted by orders and lot numbers and when this lot will be reached the bottom line (end-of-production date). Then the Friday, the planner triggers the pre-MRP to include the new orders and the next frozen week. At last he can start implementing the changes or the newly planned orders.
At last he can start implementing the changes in the scheduling and the newly planned orders.
One must pay attention that this production plan approach manages only the orders for which the work orders have not already been launched.
The lack of a necessary component is likely to happen, for example a supplier has sent on-time the raw material but during the routine quality control a non-conformity pops up, therefore the part will not available on-time to be processed as expected (due to the procurement lead time) and the order has to be

Page 107
postponed however its work orders were generated. In this case it does not make any sense to modify the production plan but it is recommended to synchronized the work orders dates with the new dates defined on the tool MPS.
e- Conclusion
The planning conditions the smoothness and the efficiency of the workflow on production and its purpose could be roughly defined as the organization of the ongoing pieces and the bushings to process. Nevertheless, this short assumption hides some difficulties; the planning must respect the production reality whereas it must monitor the customers’ demands as well. These two elements are put in phase through a two-staged planning process (tactic planning): Sales and Operations Planning and Master Production Scheduling.
S&OP works in medium/long term, it attempts on levelling the market demands (customers’ orders) and in the second hand to fit the production capacity to sustain competiveness and profitability of the company. Somehow the S&OP targets to build a viable backlog of orders but its aggregation level does not allow an accurate planning (moreover this is not its goal).
Instead MPS has to be rooted in the operational activities of the production and it must depict a precise sight of the actual capacity. For every order, it has to state when the items will start being processed and when they will be available on shipment, subsequently Sales/Contracts and Operations agree around the MPS decisions. The MPS ought to grant the parties, therefore it has a contractual meaning (whatever the customers and suppliers’ conditions) and the underlying conditions would be the definition of a stable planning that is not likely to change over the manufacturing lead time. The production reality proves that delivery dates may change, the modification must be anticipated as much as possible to warn on-time the customers and provide them a new reliable delivery date (those should not change any longer).
To design a reliable planning system on MPS, two elements must be distinguished: the tool and the process. The tool is used to build suggested planning and monitor the changes whereas the process leads to an accepted production plan (validated planning).

Page 108
Practically the tool is a spreadsheet that helps the planner on having a clear overview of the pieces to process on the line with the potential problem related to them. On MPS, the planning of the items to produce is always linked with their orders (and not by codes as it could be on MRP). This link should not be untied owing to the loss of relation between items and customers. The MPS monitors the decisions without by-passing the planner’s demands it must be carried out manually; SIGIP leveller was dismissed because it works on first-in-first-out method. Besides, the role of SIGIP is enhanced since all the data available into come down the MPS tool via automatic updates (with AS400), the purpose of this approach is to share common data and avoid the sporadic development of personal files with different data. In addition, the tool provides a (detailed and global vision by aggregate families) visibility by means of a set of tables (winding, assembly and end-of-production on low and high voltage production line) that could be eventually completed by some charts later. That supplies a common base of work for the involved people, a handiness and understandable representation around which everybody could discuss with a view to favouring the decision making. As for the discussion with the Sales and Contracts, the production manager will favour the table representing the planning made of end-of-production dates (close of the contract dates). Instead, to tackle about operational issues the tables illustrating the planning on the different workcenters is preferable. It is important to precise that at any moment the protagonists can switch from the summarized sight to the detailed one (backlog) to check a specific order.
Furthermore the tool, itself, imposes to drive the planning respecting some rules. This stiffness has been voluntarily chosen because it compels the planners to select within a limited number of solutions that are likely to work. Beyond the rules to plan, on the beginning of assembling and respectively entrance of treatment for the low voltage line and respectively the high voltage one, the monthly launch of the autoclave A7 and the oven F3 at fixed dates obligates the planner to delay or anticipate treating bushings of some orders. It targets to untie the operations activities and the contents of the backlog of the orders so as to favour the smoothness of the workflow. Whether this condition is respected, a base mix of product ought to steadily run over the high voltage line and it should result a more constant throughput at the bottom line. Regarding the low tension line, the production attempts to manage a mix of product between ERBP (around 30% in equivalent quantity) and OIP (around 70% in equivalent

Page 109
quantity) bushings. The main difficulty on this line is the service rate that is really different between each of families, leading an unbalanced throughput according to the mix of the ongoing products. Hence, the purpose remains a more stable throughput over the weeks.
Regarding the process of the Master Production Schedule, it addresses to all the entities related to the operational activities and the sales, it is updated weekly and, the process deploys a set of three meetings that are the detailed demand meeting, the supply and resource planning and the reconciliation meeting. Their respective roles will not be expanded here again, the common aim is to involve everybody around a unique planning to favour the reactivity, the decision making and further on, the commitment of everybody around a common production plan. Through the process all the issues have to be dealt early enough to build a stable planning, according to their role the people must check more or less far within the MPS horizon. For example the engineering office must supply the BOM rapidly to allow the purchasing of the raw materials. The closer from the frozen zone an order is, the more likely it should be manufactured as expected.
The planner starts working on the medium and long terms (outside the frozen zone) during the first days of the week while he has met someone in charge of the contracts and the sales so as to receive a review of the priority. Then the sequencing job must be done in collaboration with the procurements to establish the requirement planning and to prevent the production from having stocks out later on. The short term scheduling can be split into two, the incoming orders in the frozen zone to be validated and the ones to re-schedule due to troubles. The priority is done to the late orders because they must be re-placed in a short term; their list is clearly identified thanks to SIGIP. The ongoing items must be chased and controlled, a particular attention is to be put on the scheduling of the two forthcoming weeks; a change in this time fence creates an excessive extra costs and could have significant consequence on the whole scheduling beyond the disappointment of the client. Once the complete overview of the planned orders is achieved, the MPS can be finally presented in the reconciliation meeting to the operations managers, the supply chain manager, the sales/contracts manager to be validated and perhaps it undergoes few last-minute changes. At the level of MPS, the decisions related to the orders must be assumed like internal contracts linking the entities (Particularly the production and the contracts) and through which everybody is submitted.
Page 110
Therefore, a detailed production plan is constituted and it is implemented on SIGIP the Friday afternoon to impact on the MRP computations.
To enhance the procedure, a tight follow-up of the decisions and of the planning must be carried out, especially the planning dates has to be weekly tracked for two reasons:
- Check the reliability of the data, to assess the capacities, implemented into SIGIP and into the MPS tool.
- Ensure the viability of the process in the long term
The throughput at the bottom line ought to be monitored both in terms of quantity and in terms of invoicing (with the view to improving the balance of the cash flow), the focus on throughput is to get a steady flow in output testifying of a smoother overall activities and a better control of the related jobs (procurements, quality, etc.). Then, the service rate allows to estimate the production ability to correctly respond to the customers to deliver on-time, but to notice the improvements; a clean up of the overdue orders in the backlog is needed. From the standpoint of the storage value it would be interesting to apply a follow-up of the assembling and entrance-in-treatment dates, actually the porcelain and flange that are expensive, are expected at this moment or a week before. A good control of these dates enables to mitigate or optimize the storage of these parts.
Nonetheless, several drawbacks deserve to be underlined and give a roadmap of future possible improvements on the MPS tool. The main disadvantage concerns the aggregate families choices because within it some items are “classical” and some others “specific”, subsequently the bills-of-materials differ, the procurements change, the lead times may vary, etc. Once the standardized bushings will be ready, the MPS aggregate families should be in accordance with them so as to define production plans for each of them and to have an easier procurement management and most of all reduce the overall lead times (owing to the better forecast of the demand) and increase the competitiveness. Another big deal is the lack of reliable data such as the equivalent coefficient of winding in SIGIP but the use of the tool will impose a clean up (although a large update of the data has been done), that could bias the quality of the estimated workloads. Similarly, using the tool it will be necessary to modify some lead times on some items to fit better with the reality. The introduction puts in

Page 111
evidence the lack of depth of the backlog of orders due to the clients’ behaviour changes, if it does not impact so much the planning of the low voltage line that covers 13 weeks, it does on the high voltage one. Therefore, the foreseen orders should be added with a view to providing additional information about the market demand.

Page 112
6. Business Performance
This section purports to depict the backdrop of the business strategy of the company so as to better-understand what should be the adequate key performance indicators to monitor the firm's performances and get a proper follow-up. A brief presentation introduces the strategy outlined by the group AREVA whom decisions impact the orientation in the lower level of RPV and then, the one specific to the company RPV – PASSONI E VILLA. The financial issues are not regarded in the topic of the thesis; hence, its related issues of the performance are barely browsed. Instead, one focuses on the key performance indicators of the production competence and those suggested to evaluating the ability of the MPS planning presented above.
The second part of the internship topic was to define a dashboard to depict the daily status of the operations’ activities through the follow-up of a group of relevant key performance indicators. Unfortunately the time was too short to implement this tool but this section describes the existing KPIs already set and monitored, the ones that according to the profile and the strategy planned out by the company ought to be considered. The end of the chapter links the production competence and more generally the strategy with the introduced planning system.
6.1 Business Strategy
a. AREVA strategy
Even though the nuclear energy market guides principally the Areva business strategy, it pursues a goal that concerns its various areas defined by the group’s sustainability throughout a profitable growth over the years. The awareness of the sustainability is visible in their definition of objectives for mid and long term, around their commitments, they aims at enrolling the whole supply chain in their sustainable ongoing improvement as well as from an ecologic standpoint as a social one. For instance they target to:

Page 113
- Deploy a sustainable development declaration for all their new suppliers
- Audit suppliers to ensure the compliance with the “Sustainable Development Declaration”
- Integrate the opinion and feedback from external stakeholders to a keep involving them in sustainable development.
In the meanwhile AREVA does not put aside its economic development and it leverages it by a strong commitment on profitability by expecting:
- A double-digit operating margin
- A positive level of operational cash flow
A capital investment program is supporting the strategic objectives described above in order to uphold a long-term profitable growth. That includes wise acquisitions but also a major capital investment to develop, replace or upgrade part of the AREVA production capacity, besides, to acquire strategic technologies and production methods; these investments favour the improvement the production competence. This investment program wants to guarantee the performance of production assets against a backdrop of growth in all businesses.
The definition of AREVA business strategy reveals a high integration of the sustainability issue and it summarizes this will through the following schematic representation:

Page 114
Figure 30: Details of threefold aim of profitable growth, social responsibility and respect
for the environment (adopted from www.areva.com) Within the different milestones represented on the roadmap of AREVA business strategy (here above), some are integrated by RPV and drive its decisions in terms of investments, production methods, way of managing the folks, etc. According to the manufacturing activities of RPV, its profiles, some points receive the attention:
- Economic performance
- Innovation

Page 115
- Customer satisfaction
- Continuous Improvement
- Prevention and technological risk management
- Social Involvement
b. RPV – PASSONI E VILLA strategy
The business strategy planned out by the group encompasses the one of RPV, thus it has to "translate" it in accordance with its own activity and its singular business profile. The six points put in evidence are stated in a more accurate set of objectives and adapted decisions. The innovation keeps up an important role; a large budget is allocated to:
- The design of the new bushing technology, Resin impregnated Paper,
- The projects activities of projects (in particular bushings running under DC current).
- The continuous improvement of the existing product
The customer satisfaction becomes an important matter of concern, many decisions and actions testify this commitment such as:
- The general and strict control of the quality
- The tight follow-up of critical suppliers delivering non-conformities
- The tight monitoring of the suppliers’ service rate
- The tight monitoring of the service rate
- The reduction of the late orders
- The possibility of customizing its products
The continuous improvement permits to be more competitive by bettering the reactivity and the flexibility of the production, by reducing the operational

Page 116
expenses and by clarifying the production flow. RPV undertakes many initiatives toward this objective of ongoing improvement for example:
- The implementation of the Lean manufactory organization
- The standardization of the references of transformer bushings
- The upgrade of the machines and monitoring of the process
- The follow-up and optimization of the operating working capital
In spite of the focus on economic development with the increase of productivity and profitability, RPV does not put aside the social development in its strategy and it strives for the prevention and technological risk management as well as the social involvement too.
- The mitigation of the injuries
- The risk analysis before implementing any new equipment or process
According to the objectives defined by the strategy, a clear profile of the company is identified.
Company profile
As discussed previously, RPV strives for differentiation and to enhance its profile of product innovator. This identity is pointed out by the threefold evidence. Many bushings has to be re-engineered before being processed as could be a custom-made production, this kind of manufacturing organization is close of an engineer-to-order (however many bushings do not need this phase of engineering). Then, specific bushings dedicated to particular customers are designed and built in a project organization. At last an important effort is put on R&D to propose a new product family (RIP) in a near future. The literature review has extended the issues around the key performance indicators and especially it developed the idea that some KPIs fit better with the product innovator profile where the firm leans on clients’ satisfaction to succeed.
Being a product innovator means that the breadth of the line, the variability of the goods running onto, does not allow an optimization of process, therefore the overall efficiency would be rather poor. In the opposite, the cornerstone of this

Page 117
business success is the satisfaction provided to the customer through a customized product, responding to his highest quality standard and delivered on time. To secure its manufacturing system, RPV tries to have a very flexible system to keep responding to the particular demand without putting into jeopardy its production.
Nonetheless RPV tries to challenge its competitors outside the niche markets where the products are more standard and there is a cost competition, with optimized processes, better efficiency, etc. So, it attempts to improve its process as well making it more stable and monitored; some KPIs help on following these characteristics. Therefore the manufacturing system settled in RPV could be illustrated as here bellow.
6.2 Key performance indicators
An internal procedure of AREVA suggests a follow-up of the performances and issues with a three-stage method so-called QR1, QR2 and QR3. The monitoring of the key performance indicators is carried out every morning in QR3 and it gathers the management team around the director to browse and analyze the considered KPI.
High
Process Innovative
Integrative
Product Innovative
Non Innovative
Process complexity
Product complexity High
Low
Low
RPV
Figure 31 : RPV manufacturing definition on the Porter matrix
Page 118
The central part of the appointment is to assess the economic performance of the company by checking its declination in three points: profitability, growth and production.
RPV grades the profitability of its activity in function of the amount of intake orders but also, it evaluates it by its reverse side, acquiring parameters generating extra-costs such as:
- the number of flights unplanned
- the productivity (ratio between the booked hours and the available one)
- The number of BOM delivered on-time
During this performance review, no indicator directly refers to the growth but the difference between intake orders and the invoicing provides a rough idea of the increase or the decrease of the backlog and therefore of the growth.
A particular attention is put on the production competence in order to chase each disturbance, to understand it and treat it. The purpose would be to grant the clients’ satisfaction in lining up the on-time delivery, the quality, therefore they take into account the following KPIs:
The on-time delivery is estimated throughout four parameters.
The total number of late pieces on production then split per S&OP family (Small Carta Olio, Small Carta Resina, Big Carta Olio and PABS). Even though they are not customer-oriented (no link with the orders), the interest of this first couple of indicators lies in the clue that the production can respect the contracts deadline and in the identification of the problematic items (to solve it more efficiently). In addition these indicators can easily be updated daily.
On the other hand, the service rate ensures the link to the clients because it monitors the on-time delivery of the orders (no matter the quantity of pieces, and product mix), RPV has decided to follow it up throughout the month to represent its trend and to publish a monthly one, the graph, beneath, starts by giving a foreseen value of the service rate that is gradually consolidated to reach its actual the last worked day of the month.
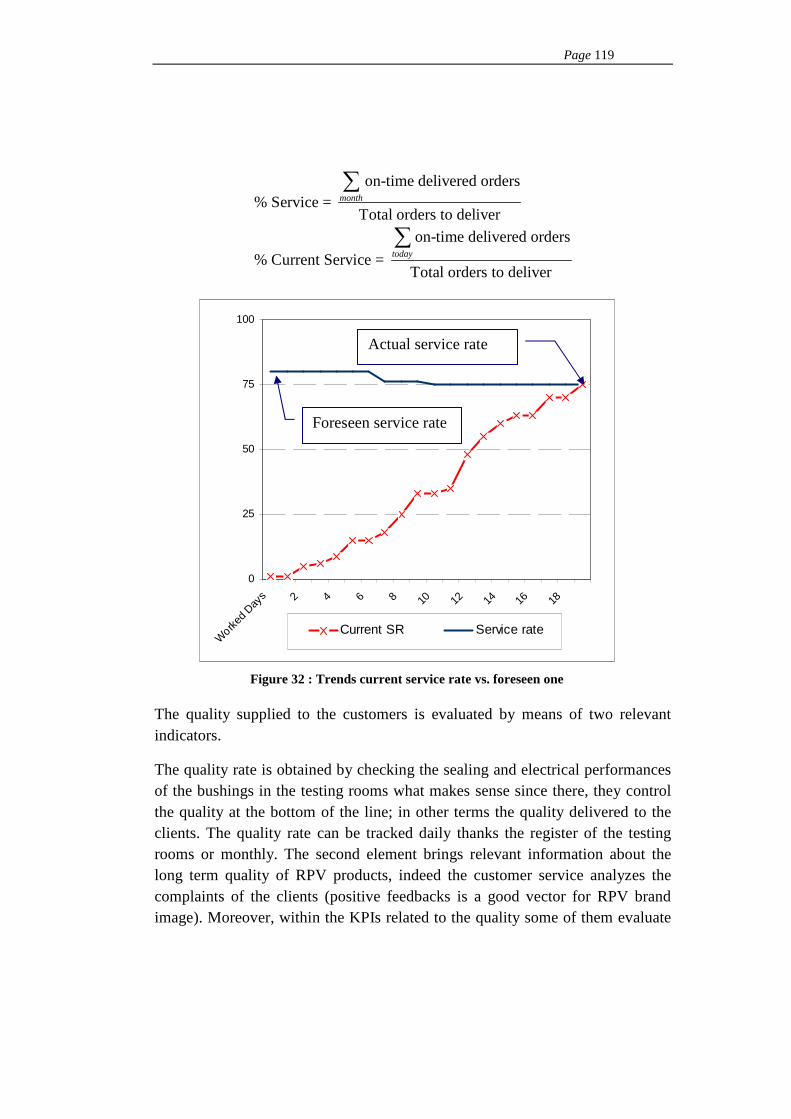
Page 119
on-time delivered orders% Service =
Total orders to deliver
on-time delivered orders
% Current Service = Total orders to deliver
month
today
∑
∑
The quality supplied to the customers is evaluated by means of two relevant indicators.
The quality rate is obtained by checking the sealing and electrical performances of the bushings in the testing rooms what makes sense since there, they control the quality at the bottom of the line; in other terms the quality delivered to the clients. The quality rate can be tracked daily thanks the register of the testing rooms or monthly. The second element brings relevant information about the long term quality of RPV products, indeed the customer service analyzes the complaints of the clients (positive feedbacks is a good vector for RPV brand image). Moreover, within the KPIs related to the quality some of them evaluate
0
25
50
75
100
Work
ed D
ays 2 4 6 8 10 12 14 16 18
Current SR Service rate
Foreseen service rate
Actual service rate
Figure 32 : Trends current service rate vs. foreseen one
Page 120
the reliability of the input throughout a follow-up of the suppliers, computing their service rate and summarizing their delivered non-conformities.
The flexibility of a line is a difficult feature to directly assess and till now no parameters estimates this feature. The number of ongoing Bill-of-materials even if this indicator is not clearly oriented toward the customers (it is actually because of the make-to-order or engineer-to-order system applied in RPV). The number of processed BOM informs about the variability on the product mix on production however once it is associated to the service rate it becomes to a measurement of the flexibility customer oriented.
The KPI related to the sustainability are not put aside even if they are not numerous. The security, especially of the workers, is an important commitment of the direction and this will is followed by means of the number of injuries and the so-called green cross that corresponds to the number of worked days without any accidents.
Follow-up of the production performance related to the planning
The MPS planning decides and freezes the decisions of when an order is to be produced; downstream it links the production with the contracts’ persons and through them the clients. On the other hand, if the shop floor respects the decision committed during the planning phase; actual and expected results should be similar or at least close. Therefore the analysis of the performance observed through MPS provides a foreseen of the production competence in the business performances.
The operations and production managers must pursue the ability to effectively produce; “effectively produce” means that one manufactures pieces to sell them right back and not to store them, unless it is a requirement to anticipate (imposed by the S&OP). Practically it means that the bushings should be produced just-in-time, and in the case of a multi-items order, the planner should attempt to synchronize their end-of-production dates to prevent one of the lots from waiting for the others. This case often happens and it leads to finished goods stuck in shipment area. In this prospect, it makes sense to follow the throughput of the bottom line with invoicing and eventually to check their alignment by comparing the invoiced orders with those palletized; a discrepancy in between suggests that the assembling line does not produce efficiently. The throughput

Page 121
must not be evaluated in number of pieces but in number of orders; for example assuming a 10-pieces order if 9 bushings are ready the order is not sold. Knowing the MPS time bucket, the indicator should be updated weekly to provide a representative picture of the planning/production performance. At the moment, a non-balanced workload prevents from applying this method but in the future it could be a way to refine the planning management (a solution is already implemented to flag the multi-items order).
Production to Clients = palletized orders invoiced orders ∆ −∑ ∑
One expects from the production line releasing the pieces at a constant pace, for the same reason explained above this flow has to be estimated not by summing up the value of the pieces exiting from the bottom line but by summing up weekly the value of invoiced orders. The goal is to have a balance from one week to another.
invoiced order value% Foreseen invoiced =
Total foreseen invoiced ordersinvoiced order value
% Invoiced = Total actual invoiced orders
∑
∑

Page 122
0%
25%
50%
75%
100%
Actual Foreseen Ideal
Week 1 Week 2 Week 3 Week 4 Discrepancy
Figure 33: weekly invoicing share, actual/foreseen matching
This chart with gauges is really meaningful since it illustrates the efficient production flow and by associating the two columns (eventually three) it allows to check the alignment between the foreseen monthly budget and the actual one obtained at the end of the month. The discrepancy shows the helplessness of the planning on providing relevant invoicing objectives on short/mid term. Many problems can explain the gap between the actual and foreseen amount of cash, but in general it shows the lack of reliability of the production to hold the targets (because of quality problems, missing parts, etc). The share of the histogram between the weeks represents the balance (or not) of the invoiced amount from one week to another.
The two key performance indicators introduced above partially help on understanding the non-linearity of the cash generation from a production point of view. Consequently, if the planning of the orders is built so as to optimize the

Page 123
generation of cash and he could help on reducing the required operating working capital at least by treating the finished goods stuck in shipment area.

Page 124
7. Conclusion The management of the planning has to integrate more and more constraints. Beyond the simple definition of assigning a production date in a time bucket, in accordance with the production system capacity, it must respect a service rate, flexibility and responsiveness owing to the orientation of the company toward the customers’ expectations, while optimizing the operating working capital to ensure the firm's profitability. In addition the singular mix of products, processed on the assembly lines, puts together “standard” and “custom-made” items, this leads to a high non-linearity on production, blurred forecasts (no detailed sales plan). Hence, the control comes from a multi-stage planning system. The Sales and Operations planning enables to skim the orders and to level roughly the backlog so as to meet the demand of the marketplace with the production system capacity whereas the Master Production Schedule aims at defining when and where an order is going to be processed analyzing more precisely, order per order and in a narrower time bucket.
The MPS planning system does not purport to fully fulfil these requirements but it intends to orientate the management of the planning at RPV-PASSONI toward this insight. The main purpose is to plan in a clear way to provide a proper visibility to the planner of the actual capacity and workload. The underlying goal was to translate this decision into an input for the production plan of the SIGIP. Until now the weakness was the misalignment of the UPR decisions and the content inserted in the SIGIP, actually this latter was synchronized only at the generation of the work orders (so too late). Therefore the job done puts special emphasis on the role of the MRP. On the other hand, the tool helps on looking ahead to plan early enough to anticipate the possible problem and mitigate the occurrence of disturbances in the short term.
The benefits of the planning can be observed by means of some key performance indicators even if other features of the production system influence their results. Among them, one will put in evidence the service rate and weekly rate of invoicing. The first one controls the ability of the production to satisfy the customers and this, whatever the quantity, the mix and the typology of the delivered bushings; even though the result is not only attributable to the

Page 125
planning performance, the service rate in September shows a positive trend. The second indicator is directly related to the planning and it highlights the balance of the throughput at the bottom line from one week to another, unfortunately after promising values during the three first weeks, a too important amount was invoiced the last week that has distorted the expected overall result. Nevertheless the real benefits of a proper planning ought to be observed with this indicator that shows the efficiency of the production system throughput.
From a personal standpoint, this 8-month experience was extremely interesting and I keep in minds several benefits of this internship. The practical context reveals many aspects of the production far from the linear and smooth descriptions presented during my education that make it dynamic and exciting. The topic of the planning required to understand clearly the process and its constraints (not only limited to the bottleneck) but also the planners’ habits with a view to suggesting an adapted solution later on. I was mesmerized by the existing interactions between the planning and most of the entities of the company (finance, engineering, supply chain, quality, human resources, etc), this made me figure out that the tool should connect them as well. This experience was very professionalizing because I had the chance to better understand how the MRP computations work and to learn the use of database resources to extract data and make statistics for instance. Moreover this experience taught me a lot about the interpersonal skills and I do appreciate the involvement of some people around this project as well as the positive exchange of points of view and ideas to propose a common synthesis.
Finally I have realised that the planning will never be something totally deterministic and at best we can leverage the anticipation in order to "damp" the disturbances and avoid big troubles but the planning is exciting only because of its dynamism and its unpredictability.

Page 126
8. Acknowledgments These 8 months spent in RPV-PASSONI E VILLA taught me a lot; this was a fruitful experience during which I could develop practical skills as well as deepen my planning systems knowledge, from a theoretical standpoint. Such a positive experience cannot be only the result of a personal involvement or luck and indeed, many people sustained my project therefore I want to devote to them this brief section.
I first would like to express my gratitude toward the teachers of Politecnico di Milano and Supmeca who made this experience feasible. I thank especially Prof. Garetti who accepted to supervise my thesis, I feel grateful to Natalia Duque Ciceri; she has constantly followed my work and provided me a helpful support with her precious advices all along the writing of the thesis.
My acknowledgements go also to Prof. Cheutet who came to visit me and suggested me useful resources to complete my literature review. I do want to convey my thankfulness to the Supmeca members of the SRI, M. Arditti, Mme Allal and Mme Cheval for their help and their advices all along these two years.
Beyond the academic project I lived an exceptional professional experience within RPV-PASSONI E VILLA where several persons significantly contributed to that. First, I would like to thank Stefano Moretti who proposed me this internship and integrated me among his team.
I have had the chance to collaborate with Giovanni Ritondale, for six months and I wish for thank him warmly for his enthusiasm in going ahead with the project, his commitment to support me and his devoted time; thanks to him, I felt motivated and involved in my job everyday. I am also grateful to Enea Valtellino for his advices and his help.
Last but not least, I want to give special thanks to Charles Lanthier, he contributed to make this internship professionalizing as much possible and interesting for me. His advices and recommendations have influenced a lot on my approach.

Page 127
Then, I would like to greet all the workers and other members of RPV-PASSONI E VILLA who gave me a warm welcome when I arrived and always accepted to dedicate a while to help me.
Finally, I end this section thanking my family and my friends that gave me moral support all along these two years and made this unbelievable moment. In particular, I want to thank Can, Diya, Emre, Felipe, Gokhan, Jérome, Maxime, Ovgu, Simone and Sophie for the great times shared together.

Page 128
9. Bibliography [1] Production planning models and systems (2006). [2] Advanced planning and scheduling systems (2005). [3] 10 commitments for responsible and environmentally friendly growth –
AREVA, Available at http://areva.com/, Accessed on September 2010. [4] Market and product orientation | business studies theory | business &
marketing resources, 2010, Available at www.thetimes100.co.uk/theory/, Accessed on October 2010.
[5] Quality control -- Britannica online encyclopaedia, Available at http://www.britannica.com/, Accessed on October 2010.
[6] Henry ford quotes, 2010, Available at http://www.brainyquote.com/quotes/, Access on May 2010.
[7] Marrying product and process design, Available at www.americanmachinist.com/, Accessed on August 2010.
[8] Adams, C. A., & Frost, G. R. (2008) ‘Integrating sustainability reporting into management practices’, Accounting Forum, 32(4), 288-302.
[9] Ahmad, M. M., & Dhafr, N. (2002) ‘Establishing and improving manufacturing performance measures’, Robotics and Computer-Integrated Manufacturing, 18(3-4), 171-176.
[10] Al-Tahat, M. D., & Mukattash, A. M. (2006) ‘Design and analysis of production control scheme for kanban-based JIT environment’, Journal of the Franklin Institute, 343(4-5), 521-531.
[11] Azzone, G., & Bertelè, U. (2007), L' impresa: sistemi di governo, valutazione e controllo (4ª ed.), Milano: Etas.
[12] Benton, W. C., & Shin, H. (1998) ‘Manufacturing planning and control: The evolution of MRP and JIT integration’, European Journal of Operational Research, 110(3), 411-440.
[13] Choe, K., Booth, D., & Hu, M. (1997) ‘Production competence and its impact on business performance’, Journal of Manufacturing Systems, 16(6), 409-421.
[14] Cleveland, R. G., Schroeder, J. C. Anderson. (1989), A Theory of Production Competence.

Page 129
[15] Colledani, M., & Tolio, T. (2009) ‘Performance evaluation of production systems monitored by statistical process control and off-line inspections’, International Journal of Production Economics, 120(2), 348-367.
[16] Koehler, D. A. (2001) Developments in health and safety accounting at Baxter international.
[17] Dyllick, T., & Hockerts, K. (2002; 2002) ‘Beyond the business case for corporate sustainability’, Business Strategy and the Environment, 11(2), 130.
[18] Goldratt, E. M. (1994), The goal: A process of ongoing improvement, Great Barrington, MA, North River Press.
[19] Genin, P., Lamouri, S., & Thomas, A. (2005), Sales and operations planning optimisation
[20] Genin, P., Thomas, A., & Lamouri, S. (2007) ‘How to manage robust tactical planning with an APS (advanced planning systems)’, Journal of Intelligent Manufacturing, 18(2), 209-221.
[21] Hutchins, M. J., & Sutherland, J. W. (2008) ‘An exploration of measures of social sustainability and their application to supply chain decisions’, Journal of Cleaner Production, 16(15), 1688-1698.
[22] Cochran, J. K., & Kim, S. (1998), Optimum junction point location and inventory levels in serial hybrid push/pull production systems, Taylor & Francis Group.
[23] Orlicky, J. (1969), The successful computer system: Its planning, development, and management in a business enterprise, New York: McGraw-Hill.
[24] Li, X., Shao, X., Gao, L., & Qian, W. (2010) ‘An effective hybrid algorithm for integrated process planning and scheduling’, International Journal of Production Economics, In Press, Corrected Proof.
[25] Lyu, J., & Su, H. (2009), Lead time reduction by extended MPS system in the supply chain.
[26] Kumar, M., & Rajotia, S. (2003) ‘Integration of scheduling with computer aided process planning’, Journal of Materials Processing Technology.
[27] Málovics, G., Csigéné, N., & Kraus, S. (2008) ‘The role of corporate social responsibility in strong sustainability’, Journal of Socio-Economics, 37(3), 907-918.
[28] Maravelias, C. T., & Sung, C. (2009) ‘Integration of production planning and scheduling: Overview, challenges and opportunities’, Computers & Chemical Engineering, 33(12), 1919-1930.

Page 130
[29] McKay, K. N., & Black, G. W. (2007) ‘The evolution of a production planning system: A 10-year case study’, Computers in Industry, 58(8-9), 756-771.
[30] Hawken, P. (2007), Blessed Unrest: How the Largest Movement in the World Came into Being and Why No One Saw It Coming, Viking.
[31] Wenschlag, R.E. (2006), The role of goal setting and performance feedback in achieving peak performance.
[32] Chase, R. B., Jacobs, F. R., & Aquilano, N. J. (2004), Operations management for competitive advantage, New-York: McGraw-Hill.
[33] Rodriguez, R. R., Saiz, J. J. A., & Bas, A. O. (2009) ‘Quantitative relationships between key performance indicators for supporting decision-making processes’, Computers in Industry, 60(2), 104-113.
[34] Kumar, S. C., & Panneerselvam, R. (2007) ‘Literature review of JIT-KANBAN system’, The International Journal of Advanced Manufacturing Technology, 32(3-4), 393-408.
[35] Slack, N., Chambers, S., & Johnston, R. (2004), Operations management (4th ed.). New-York: Financial Times/ Prentice Hall.
[36] Ohno, T. (1995), Toyota production system: Beyond large-scale production.
[37] Ugwu, O., & Haupt, T. C. (2007), ‘Key performance indicators and assessment methods for infrastructure sustainability - a South African construction industry perspective’, Building and Environment, 42(2), 665-680.
[38] Sridharan, V., Berry, W. L., Udayabhanu, V. (1987) ‘Freezing the master production schedule under rolling planning horizons’.
[39] Wikipedia contributors, Toyota production system, Available at http://www.wikipedia.com/, Accessed on May 2010
[40] Zeng, S. X., Meng, X. H., Yin, H. T., Tam, C. M., & Sun, L. (2010) ‘Impact of cleaner production on business performance’, Journal of Cleaner Production, 18(10-11), 975-983.
[41] ‘Green Backing: How Can Private Capital Be Unlocked for Green Project In Poor Countries’, The economist, September 2009, New York.

Page 131
10. Annex Annex 1: Product Mix Representation of main products.
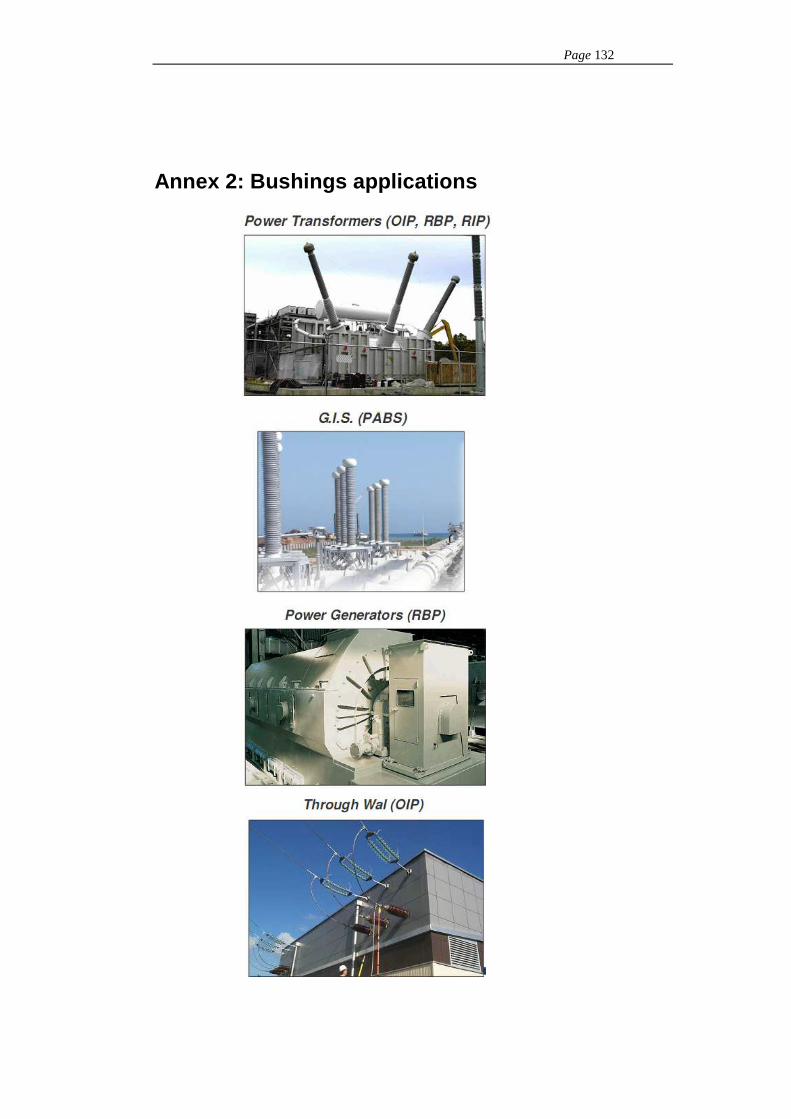
Page 132
Annex 2: Bushings applications

Page 133
Annex 3. MPS Low Voltage details
General aspects on the detailed demand (backlog):
Value of the currently planned orders
Workload of the currently planned orders
Import/Export/Computation options
Latest theoretical assembling date to deliver on-time Actual assembling date decided by the planner
Flag highlighting the overdue or the on-time departure
Actual end-of-production date based on the imposed assembling one
- The backlog and the comments (daily updated) associated to the orders are uploaded before planning.
- The planner works on this spreadsheet to plan order-by-order from the assembling dates.
- The synthesized tables (see next slides) illustrate the feasibility of the planning. - The information turns back toward “Tabella dati” and SIGIP at the end.

Page 134
Week number (time bucket) Rolling horizon: 13 weeks Equivalent capacity in the specified week
Equivalent workload in the specified week
Aggregate MPS families
Net workload in the specified week and for a given aggregate family
Equivalent workload planned to be overdue
Line features: •worked hours •Absenteeism rate •Efficiency
Total of the equivalent workload non-re-scheduled
Worked days in the specified week
Breakdown (or maintenance) on the machine
Total worked hours on the machine
Total non-worked hours on the machine Gross capacity on the machine
Delta Capacity/workload
Planning on assembling:

Page 135
- Represent the situation on the winding work center (RCCP) - Split into 3 machines according to:
o the length of the wounded tube o the bushing typology (ERBP, OIP)
- Aim at monitoring the workload on winding pulled by the planning on assembling
- Winding production driven by a Kanban system
Pulled planning on winding: