industrial energy efficiency audit report urziceni soybean oil
TRANSCRIPT

INDUSTRIAL ENERGY EFFICIENCY AUDIT REPORT
URZICENI SOYBEAN OIL PROCESSING FACILITY Urziceni, Romania
JANUARY 1992
PREPARED BY: RESOURCE MANAGEMENT ASSOCIATES OF MADISON, INC.
Madison, WI
and
INSTAPART Bucharest, Romania
U.S. EMERGENCY ENERGY PROGRAM FOR EASTERN AND CENTRAL EUROPE
U.S. AGENCY FOR INTERNATIONAL DEVELOPMENT BUREAU FOR EUROPE WASHINGTON, D.C. 20523

INDUSTRIAL ENERGY EFFICIENC( AUDIT REPORT
URZICENI SOYBEAN OIL PROCESSING FACILITY Urziceni, Rormania
JANUARY 1992
PREPARED BY: RESOURCE MANAGEMENT ASSOCIATES OF MADISON, INC. 520 University Avenue
Suite 300 Madison, WI 53703
(608) 283-2880
and
INSTAPART Sos. Catelu nr. 9
Bloc PM 62, Sc 1, Ap. 12, Et 2 Bucharest III
Romania 40-48-388388
U.S. EMERGENCY ENERGY PROGRAM FOR EASTERN AND CENTRAL EUROPE
U.S. AGENCY FOR INTERNATIONAL DEVELOPMENT BUREAU FOR EUROPE OFFICE OF DEVELOPMENT RESOURCES ENERGY & INFRASTRUCTURE DIVISION WASHINGTON, D.C. 20523
USAID Contract EUR-0015-C-1006-00

Table of Contents
i Industrial Energy Efficiency Program ............................... I
ii. Executive Sum mary ............................................ 3
1.0 Plant Description .............................................. 4 1.1 General ................................................ 4 1.2 Organization ............................................ 4 1.3 Operations ............................................. 4 1.4 Electrical Description ..................................... 7 1.5 Thermal Description ...................................... 7 1.6 History of Energy Efficiency Measures ........................ 13
2.0 Plant Energy Profile .......................................... 14 2.1 Electrical ............................................. 14 2.2 Thermal .............................................. 14
3.0 Audit Description ............................................ 17
4.0 Summary of Results and Recommendations ......................... 18 4.1 Recommended Short-term Measures ......................... 19 4.2 Recommended Long-Term Measures ......................... 20 4.3 Replication ............................................ 20 4.4 Justification for Recommended Equipment .................... 21 4.5 Prelimii.4.. Equipment Specification .......................... 21
5.0 Plant Management Organization/Recommendations ................... 24
6.0 Implementation Phase ......................................... 26 6.1 Summary .............................................. 26 6.2 In-Country Draft Audit Report Review ....................... 27 6.3 Energy Efficiency Measures Adopted by the Facility ............. 27 6.4 M anagement Results ...................................... 28 6.5 lmple.nentation Plan ...................................... 28 6.6 Expected Energy Savings .................................. 29
Rcsoue.e Managelncnt Associates of Madison. Inc. Page i

List of Tables
Table 1: Typical Annual Energy Consumption ............................ 10
List of Figures
Figure 1: Plant Organizational Chart .................................... 5 Figure 2: Facility Plot Plan ........................................... 6 Figure 3: Electrical Load Profile ....................................... 9 Figure 4: Electrical Single-line Diagram ................................ 11 Figure 5: Steam Process Flow Diagram ................................. 12 Figure 6: Monthly Electrical Consumption vs. Production ................... 15 Figure 7: Monthly Natural Gas Consumption vs. Production ................. 16 Figure 8: Recommended Organizational Chart ........................... 25
List of Appendices
Appendix A Energy Loss Calculations
Appendix B Photographs
Appendix C List of Abbreviations
Resource Management Associates of Madison, Inc. Page ii

i Industrial Energy Efficiency Program
The countries of Eastern Europe face unprecedented changes both in their political and economic systems. To aid in the transition to market economies, the U.S. Agency for International Development (USAID) designed the Eastern Europe Emergency EnergyProgram. Resource Management Associates of Madison, Inc. (RMA) is the technical assistance contractor for the Industrial Energy Efficiency Component (IEEC) of the program in Romania.
The Industrial Energy Efficiency Component was designed to address the problems of industrial energy efficiency with a short-term program aimed at the immediate needs of industry. The program involves three main activities:
1. To identify and implement cost-effective low-cost/no cost energy improvements, with an emphasis on oil savings.
2. To conduct energy audits and transfer energy auditing and management techniques, including financial and economic analysis.
3. To provide e.,nergy auditing and/or energy efficiency equipment to implement the program objectives, improve energy management, and identify additional energy efficiency opportunities.
The IEEC program deliverables consist of plant audit reports, a policy and institutional analysis report, an industry profile report, and the in-country audits, training, and equipmentdelivery and installations. The tasks are being carried out by a team of energy specialists and policy analysis experts in four different phases:
Phase One: Screening - During this phase the plants to be audited will be identified, and a specific plan to implement the following phases developed and put in place.
Phase Two: Industrial Plant Energy Audit/Training - A team of energy specialists will arrive in-country and perform a detailed energy audit at the eight selected industrial sites. They will identify short-term e~lergy efficiency measures, develop recommendations to implement these measures, demonstrate and train plant personnel on auditing techniques, and demonstrate financial and economic methodologies for justifying energyimprovement projects. Additional equipment will be ordered for Phase Three.
Resourcc Manageenint Associates of Madison. Inc. Page I
Phase Three: Implementation - The recommendations identified in Phase Two will be implemented, evaluated, and modified as necessary. Additional training will be provided and the final energy efficiency equipment turned over to the host country.
Phase Four: Analysis of Factors - This phase will analyze the factors that make-up energy efficiency management and investment decision making. Recommendations for policy reform and options for enhanced energy management will be identified and a program for implementation suggested.
Energy monitoring and tsting equipment will be turned over to the Romania industrial sector and the Government of Romania (GOR). The GOR will be provided with analysis and recommendations for further energy efficiency measures.
Resource Managcncni Associates of Madison. Inc. Page 2

ii. Executive Summary
The energy audit was conducted at the Urziceni Soybean Oil Processing Facility (EX PUR,S.A.) during the week of March 11-15, 1991. The U.S. audit team was very well received by the plant staff, and were provided with much useful background and supporting information cn the plant and its operations.
Many short and long-term energy conservation opportunities were identified by the energyauditors during the audit of the plant. Discussions were held with plant staff regarding the importance of implementing an energy conservation/management program at the facility.Plant personnel were trained in the use of U.S. energy auditing equipment.
The audit team concentrated on the following process areas:
• Steam boilers * Steam distribution system * Cooling water system * Process equipment electrical motors.
There was considerable application for low-cost/no-cost energy efficiency measures. In the boiler area, combustion efficiency was measured and found to be 61%, which is low for this application. In the steam systems and distribution area, numerous deficiencies were found which need to be corrected. The cooling water system was determined to be undersized and operating inefficiently. The power factor was generally acceptable, but could be improved.
The report contains short and long-term recommendations in each of these areas, as well as recommendations for the procurement of energy efficiency equipment. In addition, recommendations are developed for changes in the management structure to more aggressively promote energy efficiency at the plant.
Implementation Phase
The implementation phase of the audit involved a return trip to the facility from August 5-9,1991, to expedite the installation and use of the equipment. Training on portable equipment was somewhat hampered by a malfunction in the hand held combustion analyzer. Field energy equipment had not yet arrived at the time of the implementation visit, but extensive discussion took place on the proposed locations, installation procedures and operation of the fixed rates. The Draft Audit Report was reviewed with the plant staff and an utilization plan was developed for the equipment.
Resourcc Managemcni Associates of Mauison. Inc. Page 3

1.0 Plant Description
1.1 General
The Urziceni Soybean Oil Processing Facility is locaced approximately 50 kilometers outside the city of Bucharest. The plant is designed to process raw soybean feed into soybean feedstocks for other Romanian food processing plants. The facility has a capacity of 540 metric tons/day, and produces the following products:
• Crude Soybean Oil • Soybean Meal * Crude Lecithin.
The plant ibtypical of seventeen other soybean and combined soybean/sunflower seed oil processing facilities located throughout Romania. It was built in 1974 and uses Belgian technology and processing equipment. The plant itself was designed and constructed by Romanian staff.
1.2 Organization
The key plant staff with whom the U.S. audit team met are the following individuals:
Mr. Dumitru Dragan, Plant Director Mr. Nicolae Leca, Chief Engineer.
The plant crganizational chart is provided in Figure1. Virtually all of the plant departments and key personnel report directly to the Plant Director. Most decisions are passed on to the Director, with little delegation of authority or responsibility.
1.3 Operations
The facility isoperated 24 hours per day, 7 days per week. The actual plant load factor was about 50% during the time of the audit due to a lack of raw soybean feedstock and fuel. The plant employs about 300 people, of which 32 are engineering/technical staff. All operations and maintenance are done with regular full-time staff. The plant is currently making plans to reduce the number of staff in order to reduce operating costs. The facility plot plan is illustrated in Figure2.
Resourcc Managemcnt Associatcs of Madison. Inc. Pag 4
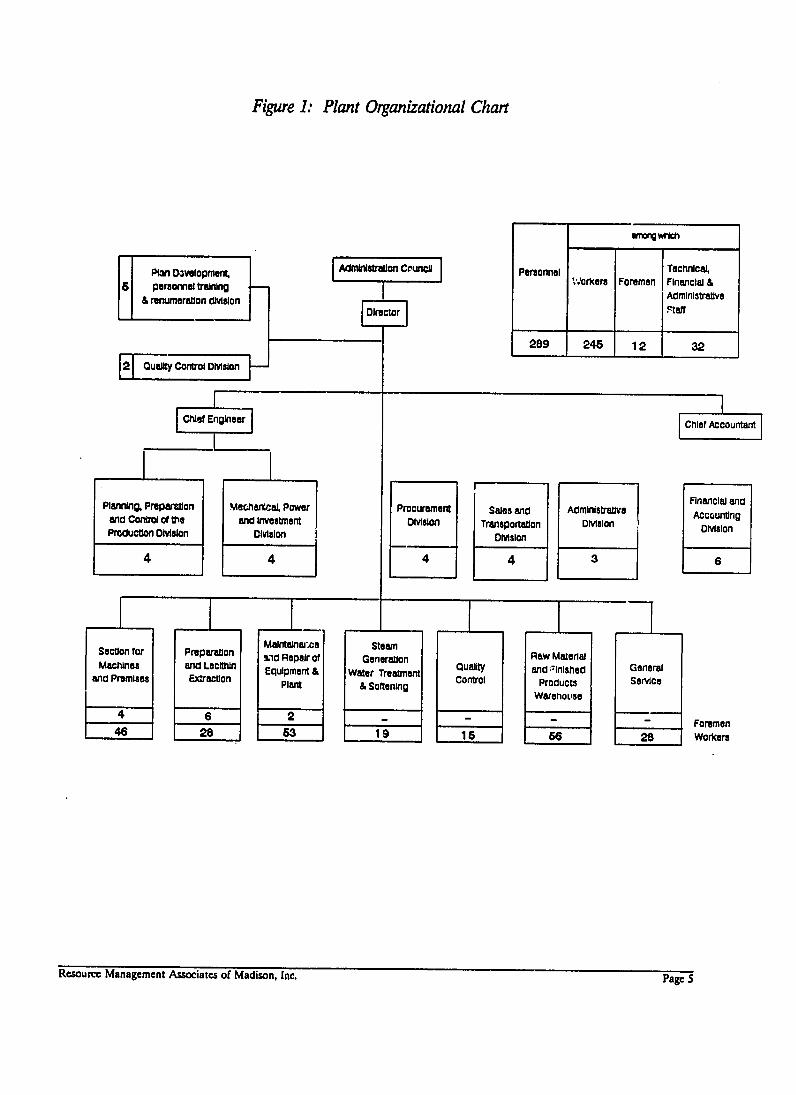
Figure 1: Plant OrganizationalChart
Pperoneloeng
&re nlumeraton divsion 5 prsoal
121 Qualiy Control OMoon
Chief Engneer
Planning, Preparatlon Machneecal, Power and Condtrol of too and Investment Production DMulo Division
4
Setonfr rpaaio MaW, ainarce -0to Repair of
Machines and Lecihi Equipment & ard Promises Extraction Plant
41
6. wrich
Ad~nsonCPersonnel V',orers
ITechnical. Foremen Financial &
raiingAdmiiftalie Al ilha~
Director taff
28929 24525 121. 323
Chief Accountant
Financial and Procurement Sales and Administrative Accounting
DMslon Transportation Division DiMsion DMslon
4 4 3 6
Steam Generation Raw Material
Water Treatment Quality and 'inished General &Softening Control Products Service
Warehot'se
4-Foremen
56 28 Workers
Resource Management Associates of Madison, Inc. Page S
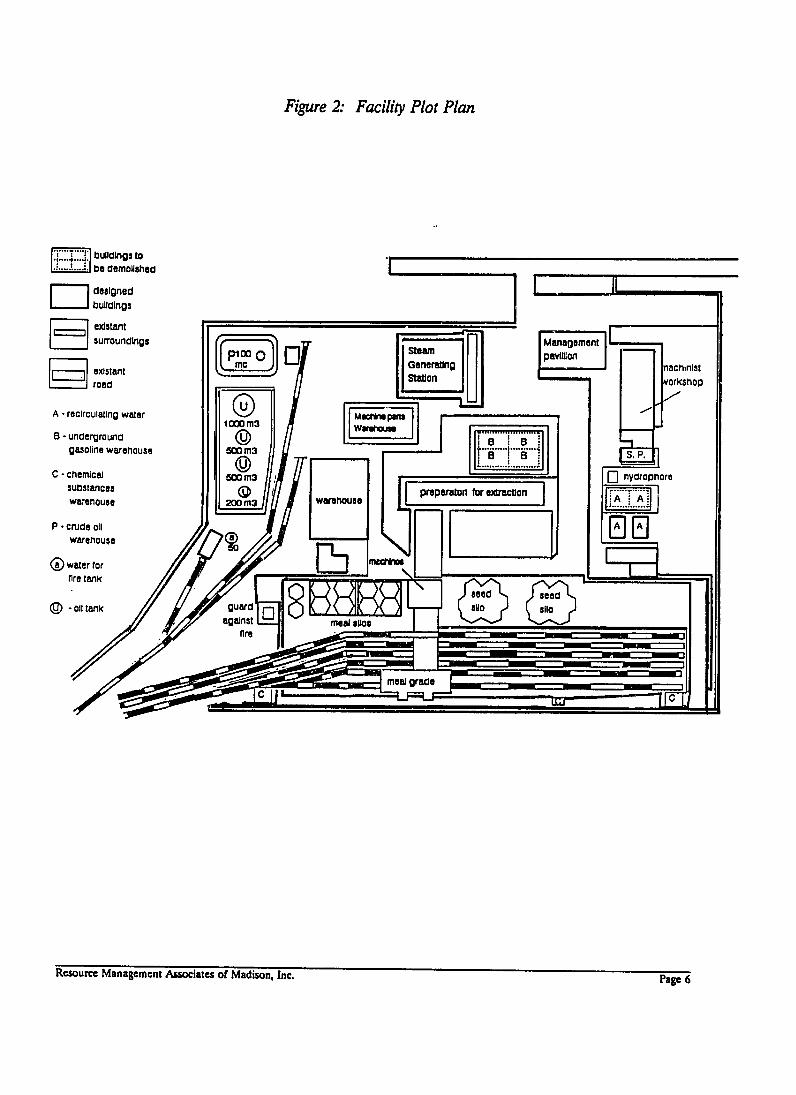
Figure 2: FacilityPlot Plan
L . buildings to be demolished
designed I buildings
e~dstant LJ surroundings r i Management
Sxistntexiten Genratng[Station nachninlstNorkshOl
road --
A-recirculating water 1000m3
MW w ....................... sflop
undergroundB gasone warehouse 500 m........
Cchemical
substances warehouse
"n"-.......500M3
(OD200 m warehouse
....
2 preraton for Wwacon ] r
P -crude oil warehouse %
1111E1 (a)water for
fre tank fc*
L
©-oil tankcQur against suosil
C M
Resource Management Associates of Madison, Inc. Pape 6

1.4 Electrical Description
The facility is directly connected to the national power grid via three transformers. These transformers feed the 380V/220V plant electrical distribution system. Key electrical parameters are the following:
Connected Load: 3,800 kW Peak Loading: 1,200 kW Normal Load: 700 - 900 kW Power Factor: 0.91 to 0.94 Electricity Cost: 2 lei/kWh ($0.057/kWh).
Electricity has been supplied in the past on an allotment basis. The previous Ministry for Electrical Distribution determined the allotment scheme based on the plant production load factor. There are no incentives in place for reducing electrical intensity (i.e. electricityconsumed per unit of output), but penalties are levied if the plant exceeds its allotment perproduction load factor. Electricity is priced based on size of the transformers (totalconnected load), and on consumption, with some minor variances for peak periods. Figure3 and Table 1 illustrate the load profile and typical annual energy consumption. The electrical single-line diagram is illustrated in Figure 4.
1.5 Thermal Description
Process steam is produced by the plant itself primarily for the soybean processing operations. Excess steam is exported to an industrial customer located close to the plant.Details of the steam production and consumption are as follows:
Boilers -Three Romanian-made boilers, installed in 1974, supply steam to a common plantwide distribution header:
Capacity: 10 metric tons/hour Pressure: 15 bar saturated steam Temperature: 200 °C Fuel: Pipeline fuel gas Operations: Two on-line, one standby Type: Water tube with combustion air preheater Controls: Strictly manual, no stack gas monitoring Instrumentation: Pressure/Temperature/Water Level only.
Resource Management Associates of Madison. Inc. Page 7
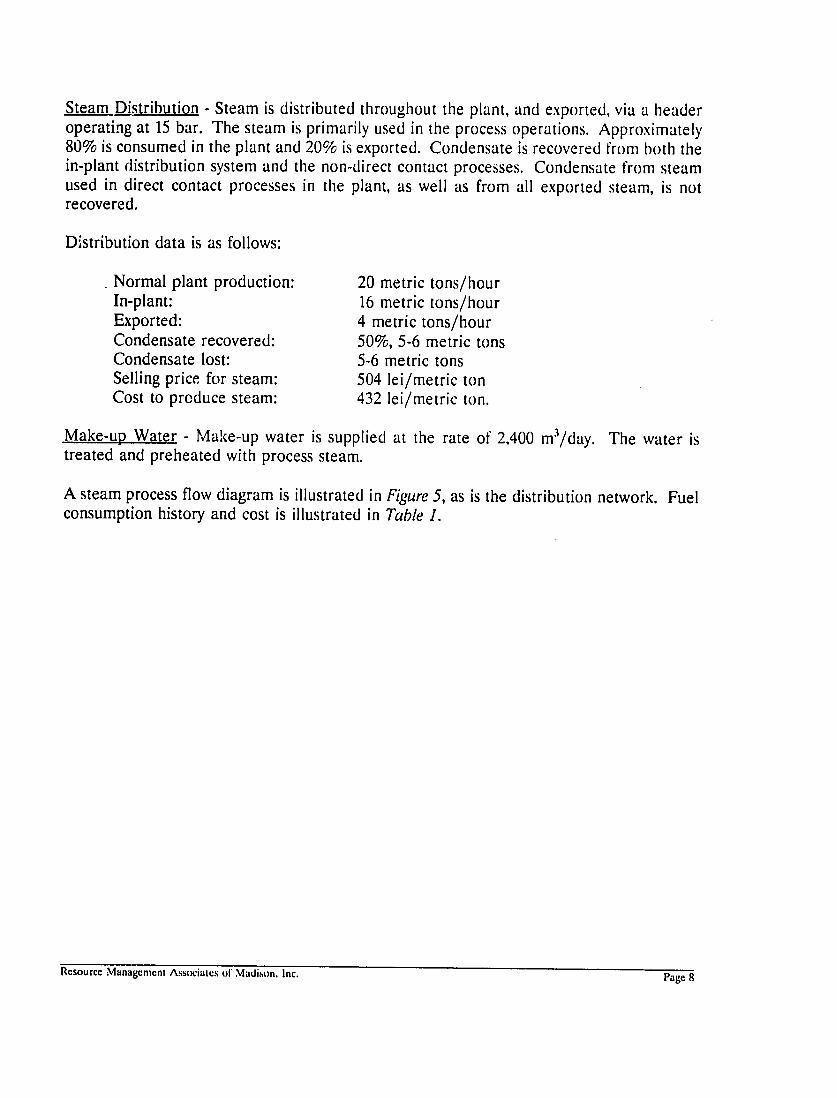
Steam Distribution - Steam is distributed throughout the plant, and exported, via a header operating at 15 bar. The steam is primarily used in the process operations. Approximately 80% is consumed in the plant and 20% isexported. Condensate is recovered from both the in-plant distribution system and the non-direct contact processes. Condensate from steam used in direct contact processes in the plant, as well as from all exported steam, is not recovered.
Distribution data is as follows:
Normal plant production: 20 metric tons/hour In-plant: 16 metric tons/hour Exported: 4 metric tons/hour Condensate recovered: 50%, 5-6 metric tons Condensate lost: 5-6 metric tons Selling price for steam: 504 lei/metric ton Cost to produce steam: 432 lei/metric ton.
Make-up Water - Make-up water is supplied at the rate of 2,400 m3/day. The water is treated and preheated with process steam.
A steam process flow diagram is illustrated in Figure5, as is the distribution network. Fuel consumption history and cost is illustrated in Table 1.
Resource Management Associates of Madison. Inc. Page 8

Figure 3: ElectricalLoad Profile
800-Figure 3. Electrical Load Profile
700
400 * E EE E
300
100"
0 0
1
-U-
I I I I I I I
2 3 4 6 6 7 8 9 10
Total Consumption -,-- Preparation
I
11 II1I I I i I
12 13 14 16 16 17 Hour
- Seed Crushing
I
18
-8-
I I I
19 20 21
Extractllon
1
22
I
23
I
24
Resource Management Associates of Madison, Inc. )age 9

R
Table I. Typical Annual Energy Consumption-1987
Tons 0f KWH Natural Gas Energy Intensity Energy Intensity Qst of Electric Cost of Gas
January Product 1366958 552000
m3 697250
KWH/jon 40.38
m3fton 51.00
2 Lci/KWH 1104000
2.8 Lei/m3 1952300
SFebruary 14251.97 464800 778965 32061.00 54066.00 929600 2181102
March 15676-57 464000 778952 29.60 49.70 928000 2181065
April 15827.21 360000 629854 26.50 39.80 840000 1763591
May 17482.00 350000 887695 20.60 50.77 720000 2485546
June 12787.85 4150O0 853510 25.39 61.90 700000 2389828
July 15877.68 450000 784260 26.13 49.39 830000 2195928 C)
August 16208.70 17800.00 798550 27.76 49.27 900000 2235940
September 6501.95 442700 249850 Plant Shut Down *
October 12487.97 442700 848560 35.45 68.00 881400 2775968
November 158!9.62 450000 798955 28.44 50.50 900000 2237074
December
TOTAL
16663.41
173254.51
485140
4894140.00
848740
8955141.00 29.11
N/A 50.93
N/A 970280
N/A 2376472
N/A 04

AXa0IZc
VUOO
OSM AMOZ V37
sr.,Pk A)i,*O/O?AM0001
-
.9b
V3II"V 30 AXOZ 337

Figure5: Steam ProcessFlow Diagram
Steam Distribution Diagram
5.0 t/h - 10 bar Drying Steam
Boiler ,to -15 bar
0.2 t/h - 6 bar Lecithin Steam
Boiler 10t/h 7.6 t/h - 10 bar Extraction Steam
15 bar
2.0 t/h - 10 bar Preparation Steam
Boiler lOt/h
15 bar 4.0 t/h - 15 bar Steam for Export
SNote: t/h - ,netrco our Inthis diagram
Resource Management Associates of Madison, Inc. Page 12
1.6 History of Energy Efficiency Measures
During the plant audit and discussions with plant management personnel, it became evident that only minimal energy efficiency measures have been promoted in the past. These projects have included:
* The optimization of steam distribution lines * A process heat recovery system (condensate from toaster).
In ft -t, many existing energy efficiency installations (e.g. boiler blowdown heat recovery)have actually been decommissioned due to the lack of spare parts, poor quality of locallymanufactured spares, and lack of other needed materials. It appears that there were no incentives in place to implement energy efficiency in the past. The specific past energy improvement projects are described as follows:
The optimization of the steam distribution lines consisted of shortening the circuits. In this way the pipe losses were reduced. The distribution header length was reduced by approximately 150 meters.
The heat recovery system for the toaster consisted of recovering the hot condensate and returning it to the boiler.
The boiler blowdown system consisted initially of a heat exchanger and a flash tank. The hot water (condensate) preheated the make-up water for the boiler. The system was disconnected due to the lack of spare parts and corrosion. The condensate is presently dumped into the sewer.
The auditors were told that all energy conservation projects were based on economic
analysis, and that the desired payback on projects was three years.
1.7 Process Description
The soybeans come into the plant via a rail system. After unloading, a precleaning process with water takes place. Drying and storage follows. Before entering the preparation, the soybeans are cleaned again.
The next step of the process is energy intensive and consists of grinding, toasting, and extraction. The toasting operation requires a large amount of steam. After extraction the process continues with distillation, and condensation. This is also a very energy intensive operation.
The crude soybean oil is stored for shipment. Lecithin is extracted from a portion of the crude oil.
Resource Management Associaies of Madison. Inc. Page 13

2.0 Plant Energy Profile
Energy consimption and export may be categorized as follows:
Electrical - used to power process equipment. Steam -used in the process operations with excess exported to nearby industrial user. Fossil Fuel - used to fire steam boilers (pipeline gas).
Both electrical and thermal load profiles are relatively flat due to the constant plant operations. Variations occur primarily through batch-process operatfns and thermal export loading.
2.1 Electrical
The electric load profile for the plant is relatively flat, with minor differences depending on batch process operations when equipment is loaded or unloaded. Figure 6 illustrates the electrical consumption versus production. It can be noted that for a production variation nf about 40%, electrical consumptiorf is almost constant. This is due to poor turndown ratios of process equipment. The electrical consumers are primarily motors and lighting. In summary:
Average Load (over 24 hrs): 600-700 kW
Average Annual Consumption: 4,497,500 kWh
Average Annual Cost: 9,000,000 lei ($257,143)
Power Factor: 0.91 to 0.94.
The load profile is primarily dependent on the level of production. During periods of reduced production, some operations are batched, causing minor (up to 15%) fluctuations in the profile. Electrical consumption is relatively constant for all shifts. The electrical load profile for a typical 24 hour period is shown in Figure 3, and the monthly electrical consumption is illustrated in Table 1 (page 0).
2.2 Thermal
The thermal load profile is also relatively flat, depending on process operations and the amount of steam exported. Steam consumption is not available due to the lack of meteringdevices. The fuel consumption of the boilers is shown in Table 1. The relationship between fuel consumption and production is illustrated in Figure 7. It can be seen that fuel consumption is almost constant for High and low production levels. This indicates poor control over the amount of steam utilized.
Resource Management Associates of Madison, Inc. Page 14

600
050
600
LU
400-
U,%
350
13o 2, 7 180 1687 1SM 1 9 16 78
Producion M

Ca C
900
cac
700-
E -a 600-C4V c ci
z
2e00
20 0 -----
M
6501 12408 13670 13788 14252 15677 15820
Production MT
15827 15878 1 6209 16663 17482

3.0 Audit Description
During the plant tour, the auditors were impressed with the quality of general housekeeping. The facility was found to be clean and well maintained. Most of the processes lack metering devices, basic controls, and automation. This results in the use of excess steam, natural gas and water, and causes energy waste and pollution, and requires excess labor.
The energy audit included the boiler room and the toasting, distillation, and condensation areas. These are the major energy using areas of the plant. Mr. Leca, the Chief Engineer,requested that the auditors provide help in the areas which he deemed the most critical. He did not have a precise way to find the steam system flows, temperatures, and pressures due to the lack of necessary instruments. Since the plant did not have any instruments, the system could not be balanced.
Condensate and steam temperatures were measured at different locations with a digital thermometer using insertion and surface probes. Condensate was measured at the pump (where leaks were found) and at the condensate tank. Steam temperature was measured at the manifold and at the toaster.
Combustion was tested with a combustion analyzer. The test was conducted on only two boilers, because the third boiler was undergoing major overhaul. The temperature of the exhaust gases was 135 'C, which is low. Excess air was found to be 250% - high enough to waste considerable energy.
The process cooling water was found to enter the cooling towers at 44 C and to exit at 42 'C. Modifications done to the cooling towers had decreased their design capacity. The exit temperature is not low enough for process cooling, so as a result, 80-100 m3/hr of water at 44 C is dumped into the sewer and replaced with 100 m3/hr at 15 'C. The resulting 33 'C water is supplied to the condenser.
The dumping of 80-100 m3/hr of treated water to the sewer is a serious waste because of the high energy content of the water. If the size of the cooling towers were increased, the water temperature difference could be increased by 3 'C, so that the cooling tower exit temperature would be 39 *C. The amount of water dumped could be reduced by approximately 50%, resulting in a savings of water and energy. A more detailed analysis of the condenser and other components of the system would of course be required before proceeding with this project.
The power factor was measured at the largest motors. The toaster motor, 75 kW had a power factor of 92%. Power factors for other motors associated with the condensing process were found to be at 90%.
Resource Management Associatcs of Madison. Inc. Page 17

4.0 Summary of Results and Recommendations
The plant energy audit identified many areas of opportunity for the adoption of energy efficiency measures. Some of these were so basic that they were taken care of during the audit; others will require additional time and capital to implement. This section presents a summary of those items and recommended actions..
Boiler Room
Four specific energy efficiency measures were identified in the boiler room:
1. Combustion Controls - All boilers operate manually with no automated controls, limited metering, and no sampling of combustion parameters. The audit team evaluated the performance of the operating boilers and found the efficiency to be very low for this type of installation at approximately 61%.
2. Boiler Blowdown - Blowdown is done intermittently with no heat recovery. The audit measurements indicate that a waste heat recovery system could save27,840 m3 of fuel gas annually.
3. Combustion Air Blower - A broken seal on the combustion air blower caused cold outside air to be drawn into the combustion chamber. Annual fuel gas savings were estimated at 30,395 m3 if the seal was repaired. It was repaired during the audit team visit.
4. Miscellaneous insulation faults, steam leaks, and hot water pump seal leakage were found.
Cooling Tower
The existing cooling tower is undersized and operated inefficiently. Process cooling requirements are met by releasing hot water to the sewer, and using make-up water. Approximately 26.6 billion kcal/year are lost (see calculations in Appendix A).
Hot Water Pump Seal Leaks
Ten pumps were found to be leaking hot water condensate through the seal and packing. Energy loss was estimated at 66.8 million kcal/year (see calculations in Appendix A).
Steam Leaks
There were many steam leaks requiring only a new gasket. Savings were estimated to be 78.5 million kcal/year.
Rcsource Managcmcnt AssociaLcs of Madison. Inc. Page 18

Metering
The lack of a metering system for steam, natural gas and water prevents operators from tuning the boiler to a high level of efficiency. Creation of an energy management program to monitor, test and correct the deficiencies will increase the boiler efficiency from 72% to 84%, saving 1.1 million m3/year of natural gas.
4.1 Recommended Short-term Measures
Several short-term measures were identified for the plant staff to act upon. They are as follows:
1. Combustion air blower -The seal was repaired while the audit team was at the plant.The estimated savings from this repair are as follows (see calculations in Appendix A).
Energy savings: 270.5 Gcal/yr Fuel gas savings: 30,395 m3/yr Cost savings: 85,100 lei ($2,430) Cost of repair: 500 lei ($14.29) Payback period: 1 day
Energy calculations were demonstrated to the plant staff. The importance of these quick repairs in terms of energy savings was emphasized to the staff.
2. Steam Leaks
Energy savings: Cost Savings: Cost of improvement: Payback period:
78.5 Gcal/yr 24,695 lei ($706) 10,000 lei ($286) 0.4 yr
3. Hot Water Pump Seal Leaks
Energy savings: Cost savings: Cost of improvement: Payback period:
66.8 Gcal/yr 21,020 lei ($601) 5,000 lei ($143) 0.24 yr
Resource Management Associates of Madison, Inc. Page 19

4. Metering System and Combustion Analyzers - (to increase combustion efficiency)
Energy savings: 1.1 million m3/yr Cost savings: 3.0 million lei/yr ($85,714) Cost of improvement: 336,000 lei ($9,600) Payback period: 4 months
4.2 Recommended Long-T rm Measures
1. Boiler Blowdown
Energy savings: 247.8 Gcal/yr Natural gas savings: 27,840 m3/yr Savings in lei: 78,000 lei ($2,229) Cost of improvement: 210,000 lei ($6,000) Payback period: 2.7 years
2. Automated Boiler and Combustion Controls (This is the second stage of the metering and combustion analysis project)
Energy savings: Savings in lei: Cost of improvement: Payback period:
1.1 million m3 of natural gas 3.08 million lei ($88,000) 4.9 million lei ($140,000) 1.6 years
3. Cooling Tower Heat Recovery
Energy savings: 2.66 x 10⁶ Savings in lei: 400,000 lei ($11,350) Cost of improvement: 1,200,000 lei ($34,286) Payback period: 3 years
4.3 Replication
There are seventeen soybean processing plants or similar plants in Romania. In the auditors' discussions with Romanian engineers, it was observed that very few boilers have combustion controls or use automation. Expanded automation would greatly increase efficiency, safety, and productivity in general.
The cooling tower problem can be generalized. Maintenance problems can occur at any time and in any place, but they should be fixed immediately. Lack of spare parts and the poor quality of those that can be found will continue to be a problem.
Resource Management Associates of Mudison. Inc. Page 20
4.4 Justification for Recommended Equipment
The Urziceni Soybean Oil Processing Plant utilizes water, steam, natural gas, and electricitywith practically no monitoring equipment for energy and material balance. The management is very willing to take energy conservation steps to minimize energy and water consumption. However, this can only be accomplished with locally installed monitoring equipment.
The issues of utilities monitoring and the advantages of the specified metering equipment were discussed with the facility directors, chief engineer, and the local energy cons::'vation agent. It was determined that thie plant's short-term and immediate need is for equipment to measure energy and water flows, including the following items:
1. Plant steam flow meter
2. Plant natural gas flow meter
3. Plant city water flow meter
4. A hand-held battery-operated combustion analyzer
5. A hand-held battery-operated digital thermometer.
The estimated total cost is $14,020.
Lack of monitoring equipment contributes to the facility's two 10 metric ton/hr boilers operating at about. 72% boiler efficiency, rather than 84%. The cooling tower make-up water, discharged to the city sewer, could be reduced by about 5% if the facility had access to daily water consumption rates and water temperature.
Calculations show that the increase in boiler efficiency will save over 1.1 million m3/yr of natural gas, or over 3.0 million lei/yr. A 5% reduction in the cooling tower make-up water is equivalent to about 43,800 m3/yr. and about 133 million kcal/yr.
The 5% cost and energy reduction criterion results in savings of about 397,250 lei/yr and over 600 million kcal/yr. respectively. With the lei to dollar exchange (397,250 lei/35 = $11,350), a simple payback of about 1.2 years is estimated.
4.5 Preliminary Equipment Specification.
A site visit and discussion with the plant operation personnel indicated that the following equipment is needed for the plant to perform more efficiently and produce a better quality product.
Resource Managemcnt Associates of Madison. Inc. Page 21
1. A vortex shedding flow meter for medium pressure saturated steam.
It was decided to use a vortex meter on one of five steam lines. The temperatureof the steam ranges from 180 to 210 C. The pressure of the steam ranges from 6 to 17 bar. The flow rate of the steam ranges from 2 to 7 metric tons/hr. The pipelines' inside diameter varies from 65 to 125 mm. Although a turbine flow meter would have offered more versatility, a vortex shedding meter ,Was chosen for durability reasons. The meter chosen is suitable for installation on a 100 mm line for use at a specific line location selected during the implementation phase.
The meter should provide output indicating temperature in C, pressure in bar, and flow rate in metric ton/hr with a flow totalizer.
A microprocessor based flow indicator shall be included with the meter for operation
in an industrial environment.
The local power supply is 220/380 volt and 50 hertz.
The total cost is approximately $3,700.
2. A vortex shedding flow meter for monitoring natural gas.
The temperature of the natural gas fuel ranges from 10 to 20 C. The pressure of the natural gas is about 450 mm Hg. The maximum flow of the natural gas is given about 1,400 m3/hr. The outside diameter of the pipe is 150 mm. The flanges at the ends of the meter may require locally retrofitting. It would be preferable to have the meter be an insertion type, for versatility, but durability issues make this impossible.
The meter has been installed permanently in the gas line with a microprocessor flow totalizer.
The approximate cost is $5,200.
3. A vortex shedding flow meter for monitoring plant water consumption.
The water temperature varies between 12 and 15 C. The water pressure rangesfrom 0.5 to 4 bar. The pipe diameter is given to be 400 mm. The flow is specified to be 0 to 150 m3/hr.
The meter for this application was a vortex shedding meter, one again largely for durability reasons.
The approximate cost is $3,700.
Rcsourcc Management Associates of Madison. Inc. Page 22
4. A portable combustion analyzer.
A battery-operated hand-held combustion analyzer is needed. The analyzer shall be equipped with the following digital reading:
* Temperature of the stack
• % stack losses
* % combustion products: CO, 02, and excess air
* Dual fuel capability: natural gas and fuel oil #6
* Rechargeable battery
• Battery charger for 220 Volt and 50 hertz power.
The approximate cost is $800.
5. A hand-held battery-operated digital thermometer.
A portable thermometer capable of reading temperature from 0 to 1100 aC is needed. The following accessories are also needed:
* One type K thermocouple lead for fluid measurement
* One type K thermocouple lead for surface measurement
* One type K thermocouple lead with a ceramic bead at the hot junction for high temperatures (combustion products at 2,000 'F)
* Rechargeable battery
* Battery charger for 220 Volt and 50 Hertz electricity.
Note: the battery charger in part 4 may be combined with the charger in part 5.
The approximate cost is $620.
Resource Management Associales of Madison. Inc. Pagc 23

5.0 Plant Management Organization/Recommendations
The current plant management organization chart is illustrated in Figure 1. The chart illustrates the fourteen sections which report directly to the plant Director. It appears that too many departments report directly to the top manager and not enough authority is delegated. It is difficult for the Director to devote enough attention to every detail, particularly with respect to energy efficiency measures.
Our discussions with plant management indicate that energy conservation measures do not have high priority. This appears to be due to a lack of finances and a lack of materials. There also appears to be a problem with prioritizing projects and available resources. Major improvement projects are attractive, while low-cost/no-cost projects with good potential for cost savings go unattended. The current organization does not lend itself to promoting energy efficiency projects.
It is recommended that the organizational structure be altered to reflect a more distributed mode of authority and responsibility. Figure 8 denotes the recommended organization, in summary:
1. The Chief Engineer should direct the Maintenance Section and Boiler Room Departments. In this manner, she/he can control the design, implementation, and monitoring of energy efficiency projects.
2. The energy management and conservation program would be managed by a specialized engineer in the Mechanical/Energy Investment section. It is recommended that this individual establish yearly goals fo, energy reduction.
The recommended organization will provide a more equal distribution of resources between Engineering/Maintenance and manufacturing. They will both have equal access to the Director.
Resource Management Associates olMadison. Inc. Page 24

Figure8: Recommended OrganizationalChart
Baud of
Pwaro & lmwv&E
mat**M**M= WrwW BoWn
Howe Mm o i
Resource Management Associates of Madison. Inc. Page 2

6.0 Implementation Phase
6.1 Summary
The implementation phase for the Urziceni Soybean Oil Processing plant started on MondayAugust 5th and was completed on Friday August 9th, 1991. Since the three flow meters (natural gas, steam, & water meters) were not at the plant, much of the activity was focused on planning, training, and preparing for the installation of the fixed equipment. During the calibration and the initial work of the Bacharach combustion analyzer, it was found to have a defective oxygen sensor. This unit was returned for repair and has since been returned to the plant in working order. The equipment brochures and several other technical publications were copied for the facility's management and details were explained. A twohour technical exchange session with six facility engineers was held, and various topicsincluding the application and benefits of the supplied metering equipment were discussed. Generally, the facility's management is very positive about the USAID energy efficiency program and are hoping to maintain a continuing future technical & non-technical exchange with western manufacturers, experts, and consultants. Their high priority list includes the following:
A feasibility and trade-off study of the cooling tower. The existing cooling tower, in addition to being insufficient in size, may be limited in process temperature, requiring mechanical refrigeration for process cooling. The options need to be investigated and a viable course of action recommended.
The toaster-dryer for soybean products may require a slightly different operating strategy. The present control strategy of using the steam trap to maintain the high pressure steam within the toaster needs to be revised. A control valve should modulate the steam flow to raise the toaster temperature. The steam traps should either be eliminated or operated at low pressure for removal of condensate.
The boilers' steam drum levels need to be controlled with conductivity probes. This type of automatic drum level control for operating boilers is safe and effective. The air fuel ratio needs to be linked to excess oxygen in the stack. The entire boiler control needs to be integrated, not only for energy efficiency but also for safety considerations.
Resourcc Management Asmociates of Madison. Inc. Page 26

The management in the Urziceni Oil Processing plant showed a great deal of .. ,st in using one of the boilers as a prototype for demonstrating the automated conductivity probe in conjunction with an oxygen trim analyzer for automatic boiler operation. Automatic boiler operation using advanced electronic control needs to be seriously considered for demonstration.
Photographs of the plant and equipment are found in Appendix B.
6.2 In-Country Draft Audit Report Review
The facility's management is very pleased with the content of the report. They are also appreciative of the fact that due to this energy efficiency program there has been a valuable exchange of ideas. In particular, they have learned about Western technology previouslyunknown in Romania. The management feels the program made a significant impact not only on attitudes towirds energy conservation, but also in the areas of process equipment, electronic control, and automation.
The boiler efficiency is reported to be about 61%. The management was convinced that the boiler efficiency is significantly higher than 61%, as indicated in the report. This value could not be verified due to the defective oxygen sensor of the portable combustion analyzer (Bacharach Fyrite II).
6.3 Energy Efficiency Measures Adopted by the Facility
Several low-cost energy conservation measures are either complete or will be completed. These include:
Installing a make-up water distribution pipe for the boiler deaerator to eliminate cracking noises. During the energy audit, plant management indicated noise and vibration from the deaerator. A further review indicated that make-up water is introduced as a stream in one location. It was recommended that make-up water be distributed across the deaerator length and beneath the steam level. This modification is complete and the cracking noise has been eliminated.
The preliminary audit report recommended a boiler blowdowr heat recovery system. This work was nearly completed at the time of the implementation visit but its operation was delayed because of the need for a special pipe for the heat exchanger.
Resource Management Associates of Madison. Inc. Page 27

The piping insulation repairs in many areas were complete at the time of the implementation visit. Maintenance staff also began to repair or replace the packing in pumps and valves to reduce the steam and condensate leaks.
The cooling tower's two pumps have been converted to one larger pump. This is expected to increase the tower efficiency and reduce water consumption.
At the time of the implementation phase, an analysis was underway to determine the thermal advantages of moving several process coolers from indoor to outdoor, and adding fins (extended surfaces) on the exterior surface of the cooling water pipes. If analysis shows thermal and economic advantages, this modification will begin immediately in order to reduce the thermal load of the cooling tower.
6.4 Management Results
Based on the reorganization recommended in the preliminary energy audit report, a new organizational structure has been developed. Under this management, thermal and electrical staff report directly to the Engineering Chief, and the Engineering Chief reports to the Director of the company. In addition, an incentive program is being established to encourage the lower level staff to participate in finding solutions for technical problems. Each staff member is responsible for suggesting at least one or two solutions to the problems they encounter at their place of work.
6.5 Implementation Plan
Equipment
The natural gas and steam flow meters will be installed on one of the boilers. Since there are three boilers, provisions will be made either to alternate the meters to all three boilers intermittently or purchase separate flow meters for the other two boilers. The portable Bacharch combustion analyzer and the digital thermometer will be used for all three boilers to adjust the excess air for optimum combustion efficiency. Plant staff plan to prepare a data logging sheet showing daily steam generation, gas consumption, combustion efficiency, and other pertinent information such as temperature and pressure.
Rctource Managcmcnt Associues of Madison. Inc. Pag 28
The water flow meter will be installed on tht. incoming city water line with a by-passprovision. This meter may also be removed to measure water flow rate of other water consumers. At present time, the major concern is the water waste from the cooling tower during periods of high outdoor temperatures or high production levels. This meter is expected to quantify indirectly the magnitude of the cooling water waste. Plant staff also plan to contract with a West German firm to investigate the refinery's total waste water discharge.
Management
The facility's management feel it would take time for the operation-level staff to become completely involved in daily technical or non-technical decision making. However, they do plan to implement the new organizational structure and solicit participation of the lower management in the company decision making process.
6.6 Expected Energy Savings
The expected energy savings for the natural gas and steam flow meters, the portable combustion analyzer, and the digital thermometer is estimated by the plant personnel to be about 1% to 2%. From the previous combustion test results and the audit team's observations, a 1% to 2% combustion efficiency improvement is very conservative. The facility has three boilers, each with a maximum capacity of 15 metric tons/hr or 1500 m3/hrof natural gas consumption. One boiler is spare and the other two operate to supply the process steam. It is reported that the yearly average is based on 1,500 m3/hr of natural gas consumption. Assuming a 2% efficiency improvement by utilizing the new equipment, the savings correspond to about 201,600 m 3 of natural gas annually. This corresponds to about 1,800 Gcal/yr of energy savings.
The energy savings associated with the water flow meter may be unreasonable to quantify at this time. The meter's use is intended to reduce the water waste and provide a tool to find ways of maximizing the cooling tower operation. This includes the effect of moving process coolers outdoors; adding fins to the cooling water pipes to reduce the cooling water thermal load; and adding packing to the cooling tower for uniform water distribution, resulting in optimum heat transfer between the cooling water and the outdoor air.
Rcsourcc Management Associates of Madison. Ite. Page 29

APPENDIX A Energy Loss Calculations
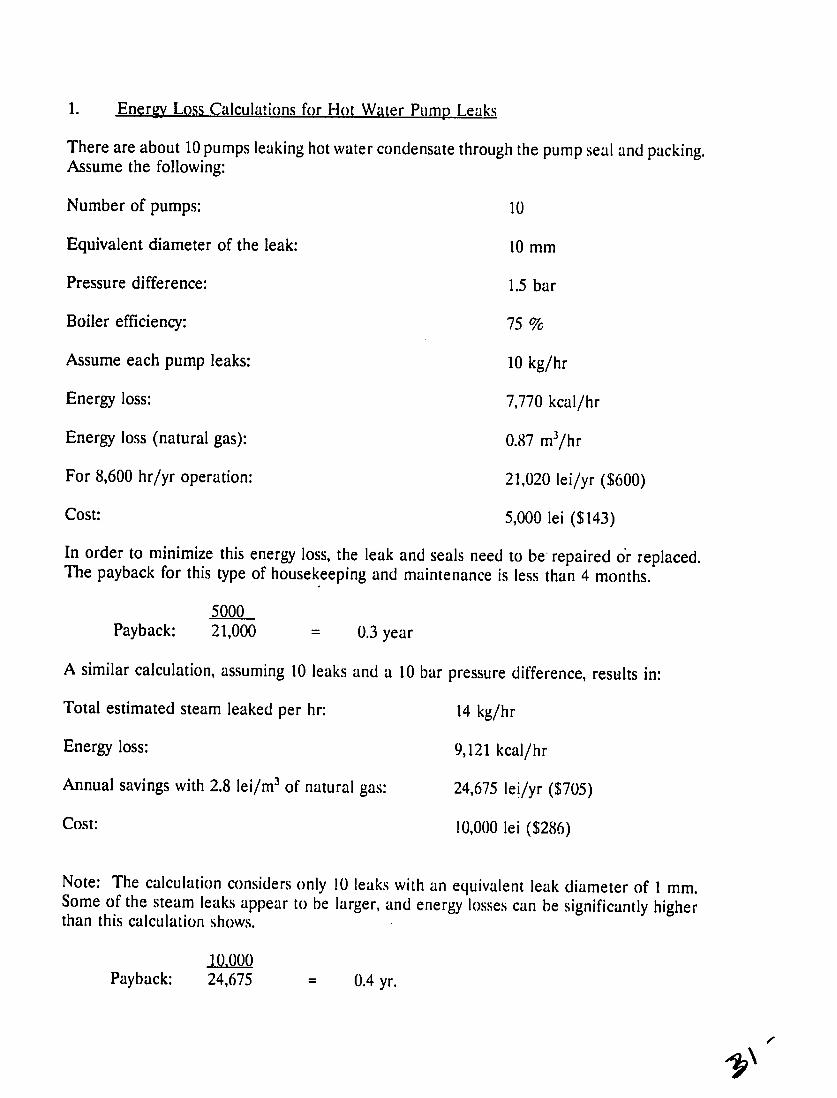
1. Energy Loss Calculations for Hot Water Pump Leaks
There are about 10 pumps leaking hot water condensate through the pump seal and packing. Assume the following:
Number of pumps: 10
Equivalent diameter of the leak: 10 mm
Pressure difference: 1.5 bar
Boiler efficiency: 75 %
Assume each pump leaks: 10 kg/hr
Energy loss: 7,770 kcal/hr
Energy loss (natural gas): 0.87 m3/hr
For 8,600 hr/yr operation: 21,020 lei/yr ($600)
Cost: 5,000 lei ($143)
In order to minimize this energy loss, the leak and seals need to be repaired or replaced. The payback for this type of housekeeping and maintenance is less than 4 months.
5000 Payback: 21,000 = 0.3 year
A similar calculation, assuming 10 leaks and a 10 bar pressure difference, results in:
Total estimated steam leaked per hr: 14 kg/hr
Energy loss: 9,121 kcal/hr
Annual savings with 2.8 lei/m 3 of natural gas: 24,675 lei/yr ($705)
Cost: 10,000 lei ($286)
Note: The calculation considers only 10 leaks with an equivalent leak diameter of 1 mm. Some of the steam leaks appear to be larger, and energy losses can be significantly higher than this calculation shows.
10 000 Payback: 24,675 = 0.4 yr.

2. Savings Calculations Using Boiler Room Air for Combustion
The combustion blower is designed to receive combustion air from the boiler room. At the present time, the flexible coupling bet', een the air duct and the blower suction is broken, and consequently, outside air is being drawn in for combustion. We are recommending fixing the connection due to the following fuel savings. Assume:
Combustion air flow rate: 22,000 m3/hr
For aboLi six months, At: (A&t=temp difference between room and outside air) 10 °C
Air density: 1.22 kg/M 3
Heat capacity of the air: 0.24 kcal/kg. C
Annual hours of operation: 4,200 hr/yr'
Heat Loss calculation: Q=m X Cp X AT=22000 X 1.22 X 0.24 X 10 X 4200= 270.5 X 10⁶ kcal/yr
Natural gas heating value: 8,901 kcal/m 3
Assumed boiler efficiency: 75%
Annual natural gas savings: (270.5 X 10⁶)/(8901 x .75) 40,520 m3/yr
Natural gas cost: 2.8 lei/m 3
Annual fuel cost saving: 113,500 lei/yr ($2,432)
Cost of repairing coupling: 255,319 lei ($7,295)
255.319 lei Payback: 113,500 lei/yr = 2.3 years
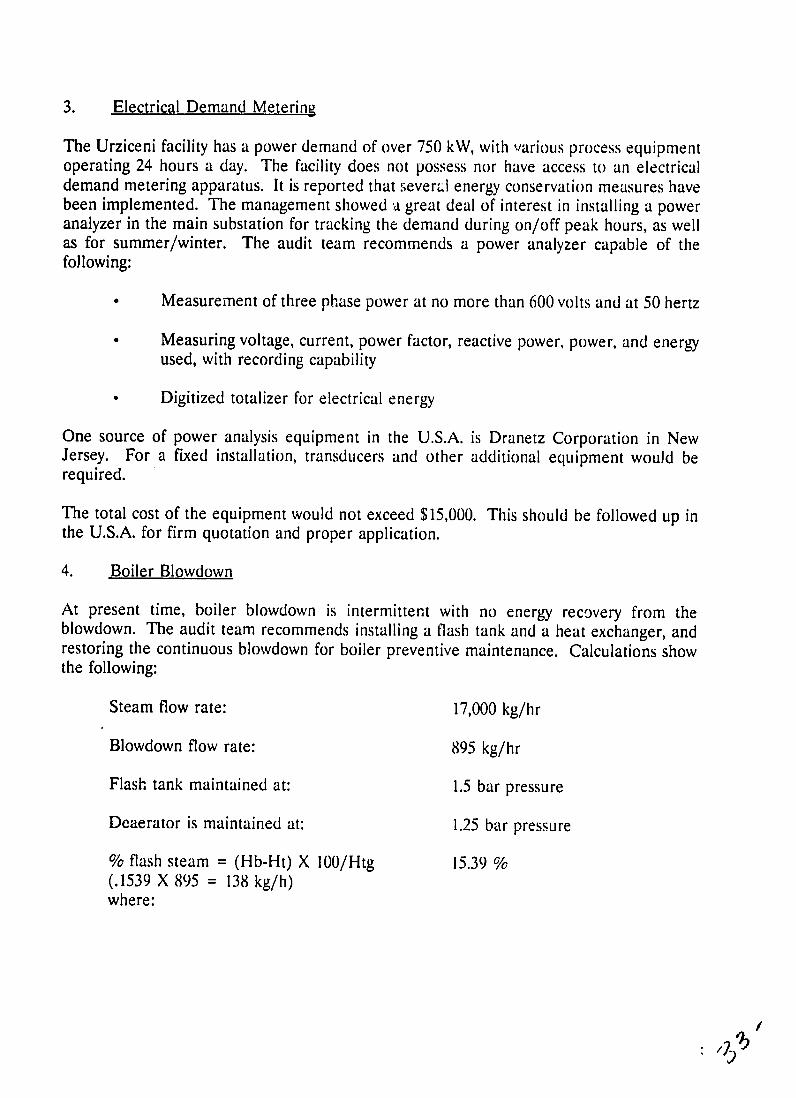
3. Electrical Demand Metering
The Urziceni facility has a power demand of over 750 kW, with various process equipment operating 24 hours a day. The facility does not possess nor have access to an electrical demand metering apparatus. It is reported that severJl energy conservation measures have been implemented. The management showed a great deal of interest in installing a power analyzer in the main substation for tracking the demand during on/off peak hours, as well as for summer/winter. The audit team recommends a power analyzer capable of the following:
Measurement of three phase power at no more than 600 volts and at 50 hertz
Measuring voltage, current, power factor, reactive power, power, and energy used, with recording capability
Digitized totalizer for electrical energy
One source of power analysis equipment in the U.S.A. is Dranetz Corporation in New Jersey. For a fixed installation, transducers and other additional equipment would be required.
The total cost of the equipment would not exceed $15,000. This should be followed up in the U.S.A. for firm quotation and proper application.
4. Boiler Blowdown
At present time, boiler blowdown is intermittent with no energy recovery from the blowdown. The audit team recommends installing a flash tank and a heat exchanger, and restoring the continuous blowdown for boiler preventive maintenance. Calculations show the following:
Steam flow rate: 17,000 kg/hr
Blowdown flow rate: 895 kg/hr
Flash tank maintained at: 1.5 bar pressure
Deaerator is maintained at: 1.25 bar pressure
% flash steam = (Hb-Ht) X 100/Htg 15.39 % (.1539 X 895 = 138 kg/h) where:
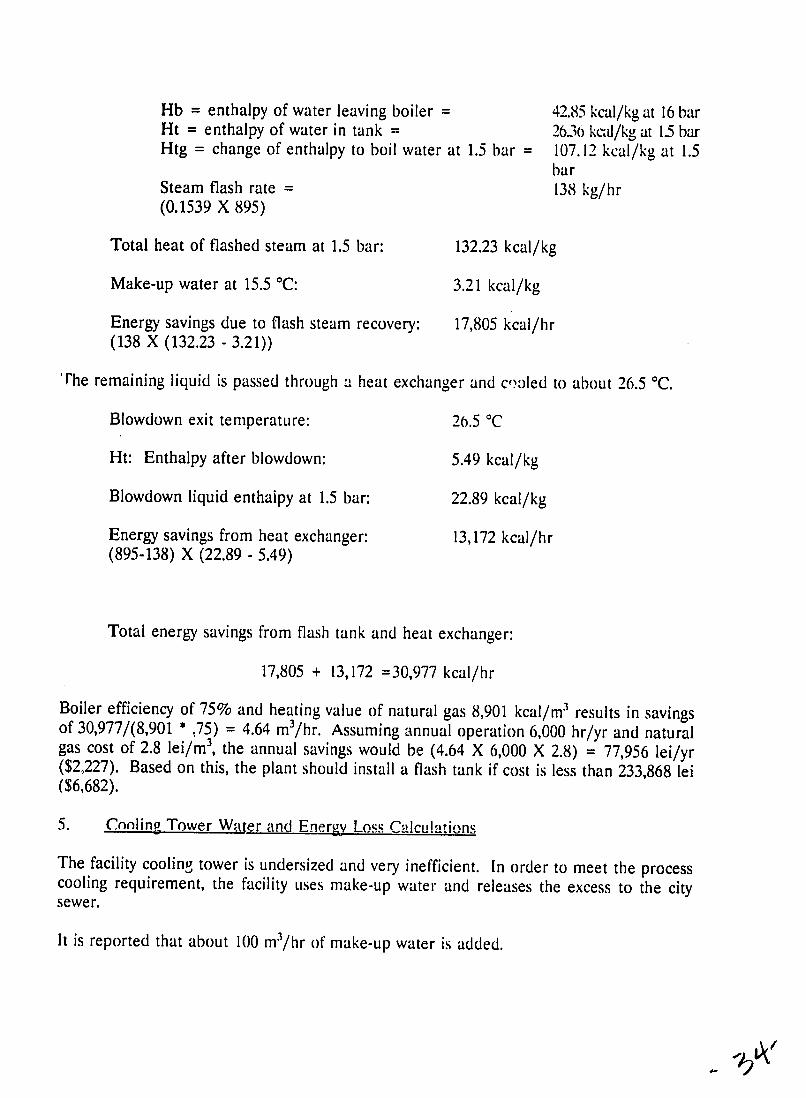
Hb - enthalpy of water leaving boiler = 42.85 kcal/kg at 16 bar Ht = enthalpy of water in tank = 2636 kcad/kg at 1-5 bar Htg = change of enthalpy to boil water at 1.5 bar = 107.12 kcal/kg at 1.5
bar Steam flash rate = 138 kg/hr (0.1539 X 895)
Total heat of flashed steam at 1.5 bar: 132.23 kcal/kg
Make-up water at 15.5 'C: 3.21 kcal/kg
Energy savings due to flash steam recovery: 17,805 kcal/hr (138 X (132.23 - 3.21))
The remaining liquid is passed through a heat exchanger and coled to about 26.5 °C.
Blowdown exit temperature: 26.5 °C
Ht: Enthalpy after blowdown: 5.49 kcal/kg
Blowdown liquid enthaipy at 1.5 bar: 22.89 kcal/kg
Energy savings from heat exchanger: 13,172 kcal/hr (895-138) X (22.89 - 5.49)
Total energy savings from flash tank and heat exchanger:
17,805 + 13,172 =30,977 kcal/hr
Boiler efficiency of 75% and heating value of natural gas 8,901 kcal/m 3 results in savings of 30,977/(8,901 * .75) = 4.64 m3/hr. Assuming annual operation 6,000 hr/yr and natural
3gas cost of 2.8 lei/m , the annual savings would be (4.64 X 6,000 X 2.8) = 77,956 lei/yr($2,227). Based on this, the plant should install a flash tank if cost is less than 233,868 lei ($6,682).
5. Cooling Tower Water and Energy Loss Calculations
The facility cooling tower is undersized and very inefficient. In order to meet the process cooling requirement, the facility uses make-up water and releases the excess to the city sewer.
It is reported that about 100 m3/hr of make-up water is added.

Make-up water rate: 100 m3/hr
Water and sewer charge about: 5.75 lei/m 3
Annual water and sewer charge increase: 4,945,000 lei/yr
Measurement showed make-up water temp: 13 °C
Discharge water temperature: 44 °C
Enthalpy difference: 31.05 kcal/kg
The 100 m3/hr of water equals: 99530 kg/hr
The energy content and mostly recoverable: 3,090,407 kcal/hr
Annual energy loss: 26.6 billion kcal/yr
Recoverable energy (65%): 17.3 billion kcal/yr
Energy cost savings: 5.4 million lei
Total cost saving: 400,000 lei
Installation of a new, properly rated cooling tower will prevent dumping of water and decrease water costs. A Romanian made cooling tower will cost 1,200,000 lei ($34,286). The savings would be 400,000 lei/yr ($11,350).
1,200.000 Payback: 400,000 = 3 years
6. Boiler and Combustion Control
The plant has two natural gas steam boilers. Each boiler is rated at 10 metric tons and operates at about 15 bar. The boilers supply saturated steam to the plant and about 30% of the steam is sold to neighboring facilities with no condensate returned.
Both boilers operate manually with no combustion gas analysis. The water treatment facility is well maintained, but some metering pumps are required for chemical feed proportioning.
The continuous blowdown has been eliminated due to frequent maintenance problems. Calculations show over 30,000 kcal/yr energy savings by installing a boiler blowdown flash tank and a heat recovery unit.
'3
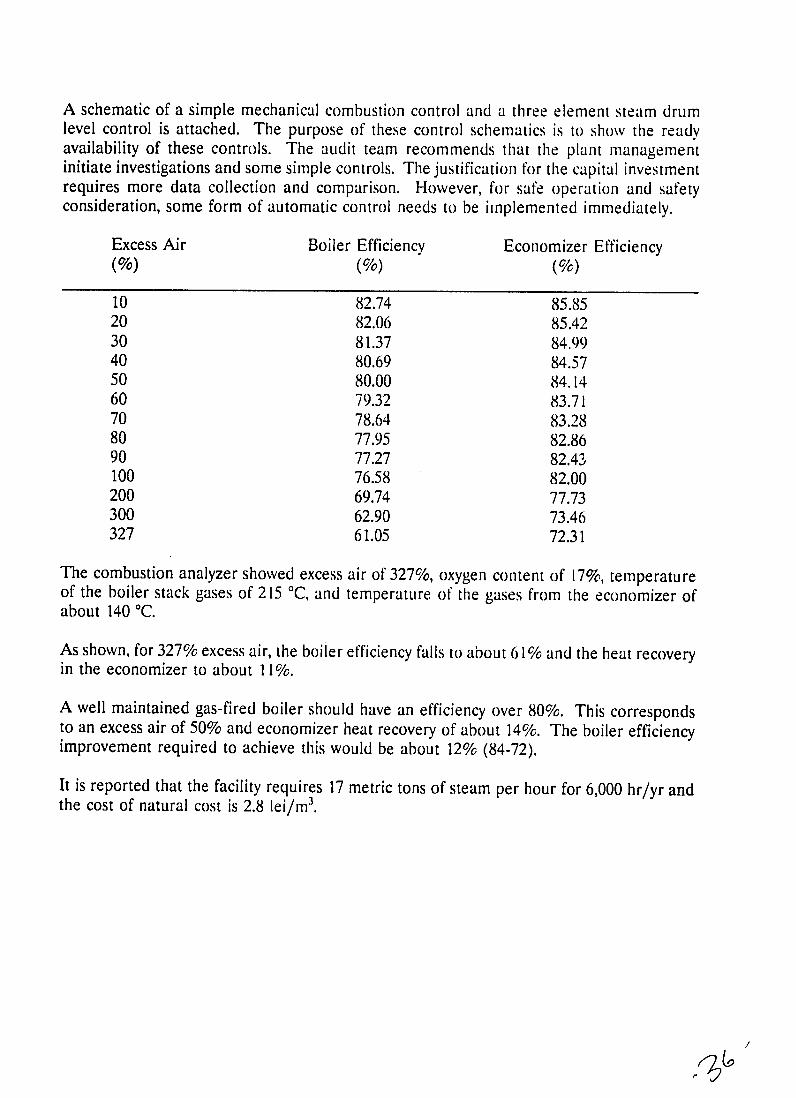
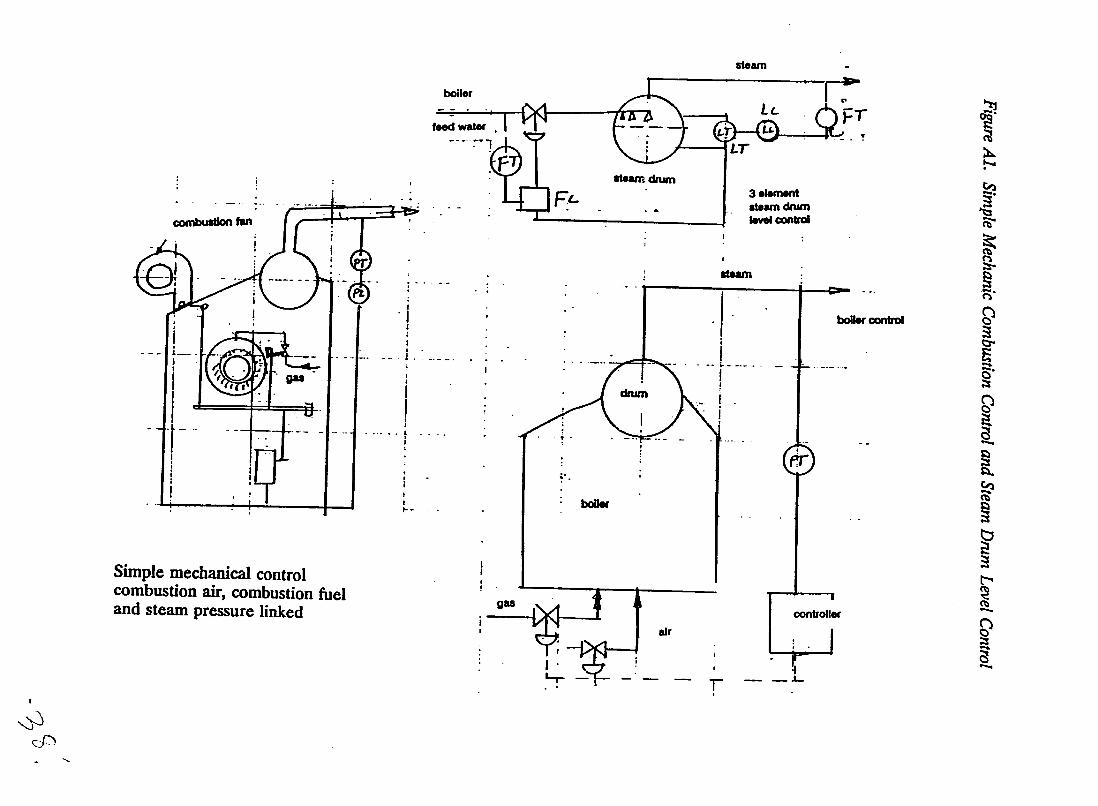
A schematic of a simple mechanical combustion control and a three element steam drum level control is attached. The purpose of these control schematics is to show the ready availability of these controls. The audit team recommends that the plant managementinitiate investigations and some simple controls. The justification for the capital investment requires more data collection and comparison. However, for safe operation and safety consideration, some form of automatic control needs to be implemented immediately.
Excess Air Boiler Efficiency Economizer Efficiency (%) (%) (%)
10 82.74 85.85 20 82.06 85.42 30 81.37 84.99 40 80.69 84.57 50 80.00 84.14 60 79.32 83.71 70 78.64 83.28 80 77.95 82.86 90 77.27 82.43 100 76.58 82.00 200 69.74 77.73 300 62.90 73.46 327 61.05 72.31
The combustion analyzer showed excess air of 327%, oxygen content of 17%, temperature of the boiler stack gases of 215 'C, and temperature of the gases from the economizer of about 140 C.
As shown, for 327% excess air, the boiler efficiency falls to about 61% and the heat recovery in the economizer to about 11%.
A well maintained gas-fired boiler should have an efficiency over 80%. This corresponds to an excess air of 50% and economizer heat recovery of about 14%. The boiler efficiency improvement required to achieve this would be about 12% (84-72).
It is reported that the facility requires 17 metric tons of steam per hour for 6,000 hr/yr and the cost of natural cost is 2.8 lei/m 3.
,, /l

Saturated steam temp
Enthalpy of steam
Enthalpy of make-up water
Enthalpy of condensate
Total heat in steam
Gas at 84% efficiency
Gas at 72% efficiency
Savings
For 6,000 hrs savings
180.0 °C
663.3 kcal/kg
12.8 kcal/kg
123.7 kcal/kg
10.3 million kcal/hr
1378.3 m3/hr
1564.6 m3/hr
186.3 m3/hr
3.13 million lei/yr ($89,429)
steam
FtI- ufood water
ew~bh co3nlemetol
and~~~bo~ steamo prsur ike otrl
dnim
Simple mechanical control Z3
c s ac un -

APPENDIX B Photographs

1. Mr. Fernia discusses facility operation with plant staff.
I -- mo
4I!
2. Manual operation steam control stations.
4/

APPENDIX C List of Abbreviations

AC = alternating current amps = amperes atm = atmosphere = 14.696 pounds per square inch bar = 100,000 pascals = 14.504 pounds per square inch BTU = British thermal unit cfm = cubic feet per minute cm = centimeter = 0.3937 inches cm 2 = square centimeter = 0.155 square inches CO = carbon monoxide CO2 = carbon dioxide DC = direct current °C = degree Celsius T[°C] = 5/9*(T[°F] - 32) OF = degree Fahrenheit OR = degrees Rankine T[°R] = T[°F] + 460 eff = efficiency ex air = excess air Gcal = gigacalorie = 1 billion calories = 3.968 million BTU GJ = gigajoules = I billion joules gph = U.S. gallons per hour gpm = U.S. gallons per minute GWh = gigawatt hours = 1 billion watt hours H2 = hydrogen H20 = water H 2 S0 4 = sulfuric acid hectare = 10,000 square meters = 2.471 acres hectoliter = 100 liters = 26.42 U.S. gallons Hg = mercury hr = hour Hz = hertz = cycles per second J = joules K = Kalvin kcal = kilocalories = I thousand calories = 3.968 BTU Kcs = 29.77/$1 US kg = kilogram - 2.2046 pounds Kgcc = 7,000 kcal = kJ = kilojoules = km = kilometer= kN = kilonewton =
=
27,776 BTU I thousand joules = 0.947813 BTU 0.621 miles
1 thousand newtons kPa kilo pascals = I thousand pascals = 0.14504 pounds per square inch kV = kilovolts = 1 thousand volts kVA = kilovolt-amperes kVAr = kilovars = 1 thousand volt-amperes (reactive) kW = kilowatt = I thousand watts kWh = kilowatt hour = I thousand watt hours lbs = pounds liter = 0.2642 U.S. gallons = 0.03531 cubic feet
A

m = meter = 39.37 inches m2 = square meter = 10.76 square feet m3 = cubic meter = 35.31 cubic feet mA = milliampere = 0.001 amperes MCal = megacalorie = 1 million calories metric ton = 1 thousand kilograms = 1.1023 U.S. tons mg = milligrams min = minute MJ = megajoules mm = millimeter = 0.03937 inches MPa = 1 million pascals = 145.04 pounds per square inch MVA = megavolt-amperes MW = megawatt = 1 million watts MWh = megawatt hours = 1 million watt hours NG = natural gas nm = nanometer Nm 3 = cubic meters at standard conditions of temperature and pressure (20'C and
1 atmosphere) NO x = nitrogen oxide 02 = oxygen P = pressure PC = personal computer PF = power factor ppm = parts per million psi = pounds per square inch psig = pounds per square inch (gauge) R = thermal resistance s = second SO2 = sulfur dioxide sq ft = square feet Tcal = teracalorie = I trillion calories = 3.968 billion BTU T = temperature V = volts VArs = volt-amps (reactive) VSD = variable speed drive W = watts yr = year