industrial economic status report august 2015 summary of industrial economic · pdf...
TRANSCRIPT

Industrial Economic Status Report
August 2015
Office of Industrial Economics Ministry of Industry
Summary of Industrial Economic Status
The manufacturing production index (MPI) in August 2015 decreased 8.3% when compared with same period of the previous year (YOY). The decreased main industries included hard disk drives (HDDs), televisions, electronics components and aquaculture products. Nevertheless, production of automobiles expanded well by 2 digits.
Production of automobiles in August 2015 expanded when compared with the same period of 2014, mainly due to the increasing of export market.
Production of HDDs and electronics components dropped due a demand of computers and notebooks in the global market declined as well as the global economic slowdown. It affected to decreasing demand of electronics products in the global market.
Establishment and close business in August 2015, 388 plants began operations, dropped 5.4% from the previous month. The investment capital decreased 14.9%, but the employment rates increased 26.7%. The most outstanding activity was the manufacturing and sale of solar power generation systems, with 13 plants for a total of 10.31 billion baht and 309 employees hired. When compared with August 2014, the number of plants that commenced operations increased 17.9%. On the other hand, 253 plants closed in August 2015, up 10.96% from the previous month and a rise of 155.56% YOY.

Industrial Economic Status Report
August 2015
Office of Industrial Economics Ministry of Industry
Imports of Thailand industry sector in August 2015, an import of industrial machinery and machine tools had a value of $1.02 billion USD, which decreased 1.5% when compared with the previous year. The import value of machine tools continued to shrink 18.9%, but the import of industrial machinery expanded 3.5%.
The imports of raw materials and semi-finished goods (excluding gold) had a value of $6.14 billion USD, which slumped 0.3% YOY, due to the decreasing in imports of chemicals, plastic, iron, steel and its products.
Energy consumption of manufacturers in August 2015, total energy was consumed by the manufacturing sector stood at 10,075.1 million kWh (kilowatt-hour), dropped 2.27% from July 2015 (10,309.5 million kWh), but it increased 0.3% when compared with August 2014 (10,048.4 million kWh). Energy consumption tracking data by business size showed that small enterprises consumed less energy when compared to the previous month, but increased when compared with August 2014. Meanwhile, medium and large-sized businesses consumed less energy when compared both to the previous month as well as to a year earlier.
Industrial Economic Status Report
August 2015
Office of Industrial Economics Ministry of Industry
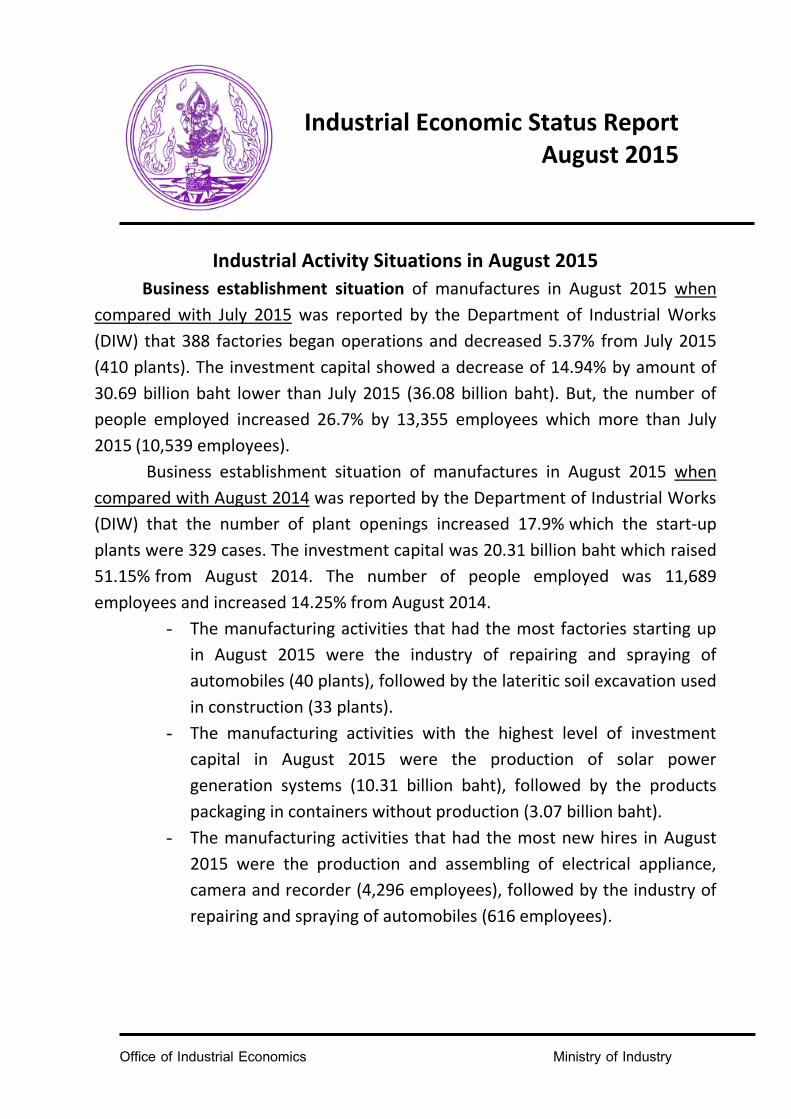
Thailand’s Industrial Economic Conditions in August 2015 Compared to Major Countries in Asia
When compared with the same period last year, Thailand’s
manufacturing production index (MPI) contracted 8.3%, stemming from decreases in HDDs, televisions, electronics components, canned and frozen seafood, and steel products. Nevertheless, production of automobiles still increased as well.
- The industrial production rate for Taiwan fell 5.5%.
- The industrial production rate for South Korea expanded 0.2%.
- The industrial production figures of Malaysia and Indonesia in August 2015 have not been released, but the trend continued growth when compared with the previous month. Industrial production in Malaysia and Indonesia expanded 4.2% and 5.7%, respectively.
Industrial production Growth Rate
Jan Feb Mar Apr May Jun Jul Aug Sep Oct Nov Dec Jan Feb Mar Apr May Jun Jul Aug
Industrial Economic Status Report
August 2015
Office of Industrial Economics Ministry of Industry
Industrial Activity Situations in August 2015
Business establishment situation of manufactures in August 2015 when
compared with July 2015 was reported by the Department of Industrial Works
(DIW) that 388 factories began operations and decreased 5.37% from July 2015
(410 plants). The investment capital showed a decrease of 14.94% by amount of
30.69 billion baht lower than July 2015 (36.08 billion baht). But, the number of
people employed increased 26.7% by 13,355 employees which more than July
2015 (10,539 employees). Business establishment situation of manufactures in August 2015 when
compared with August 2014 was reported by the Department of Industrial Works
(DIW) that the number of plant openings increased 17.9% which the start-up
plants were 329 cases. The investment capital was 20.31 billion baht which raised
51.15% from August 2014. The number of people employed was 11,689
employees and increased 14.25% from August 2014. - The manufacturing activities that had the most factories starting up
in August 2015 were the industry of repairing and spraying of
automobiles (40 plants), followed by the lateritic soil excavation used
in construction (33 plants).
- The manufacturing activities with the highest level of investment
capital in August 2015 were the production of solar power
generation systems (10.31 billion baht), followed by the products
packaging in containers without production (3.07 billion baht).
- The manufacturing activities that had the most new hires in August
2015 were the production and assembling of electrical appliance,
camera and recorder (4,296 employees), followed by the industry of
repairing and spraying of automobiles (616 employees).

Industrial Economic Status Report
August 2015
Office of Industrial Economics Ministry of Industry
Business closing situation of manufactures in August 2015 when compared with July 2015 was reported by the Department of Industrial Works (DIW) that 253 plants closed and up 10.96% from July 2015 which 228 plants closed. The total amount of investment capital of the closures was 11.37 billion baht in August 2015, over than July 2015 which was the 3.80 billion baht. The number of layoffs in August 2015 was 5,653 employees and decreased from July 2015 which was 6,615 employees.
Business closing situation of manufactures in August 2015 when compared with August 2014 was reported by the Department of Industrial Works (DIW) that the number of plant closures was 99 plants and increased 155.56%. The investment capital loss due to plant shutdowns was 1.32 billion baht in August 2015 which was higher than August 2014. Moreover, the number of layoffs was 1,940 employees in August 2015, and also up from August 2014.
- The manufacturing activities with the most factory shutdowns in August 2015 were the lateritic soil excavation used in construction (23 plants), followed by the repairing and spraying of automobiles (19 plants).
- The manufacturing activities that lost the most investment capital due to factory shutdowns in August 2015 were the industry of electrical power generation, transmission and sale (5.69 billion baht), followed by the production and repair of radio, TV, radar and capacitor (1.72 billion baht).
- The manufacturing activities from which the most employees were laid off in August 2015 were the industry of textile or yarn preparing for weaving (682 employees), followed by the production and repair of radio, TV, radar and capacitor (526 employees).
Industrial Economic Status Report
August 2015
Office of Industrial Economics Ministry of Industry
I. Food Industry
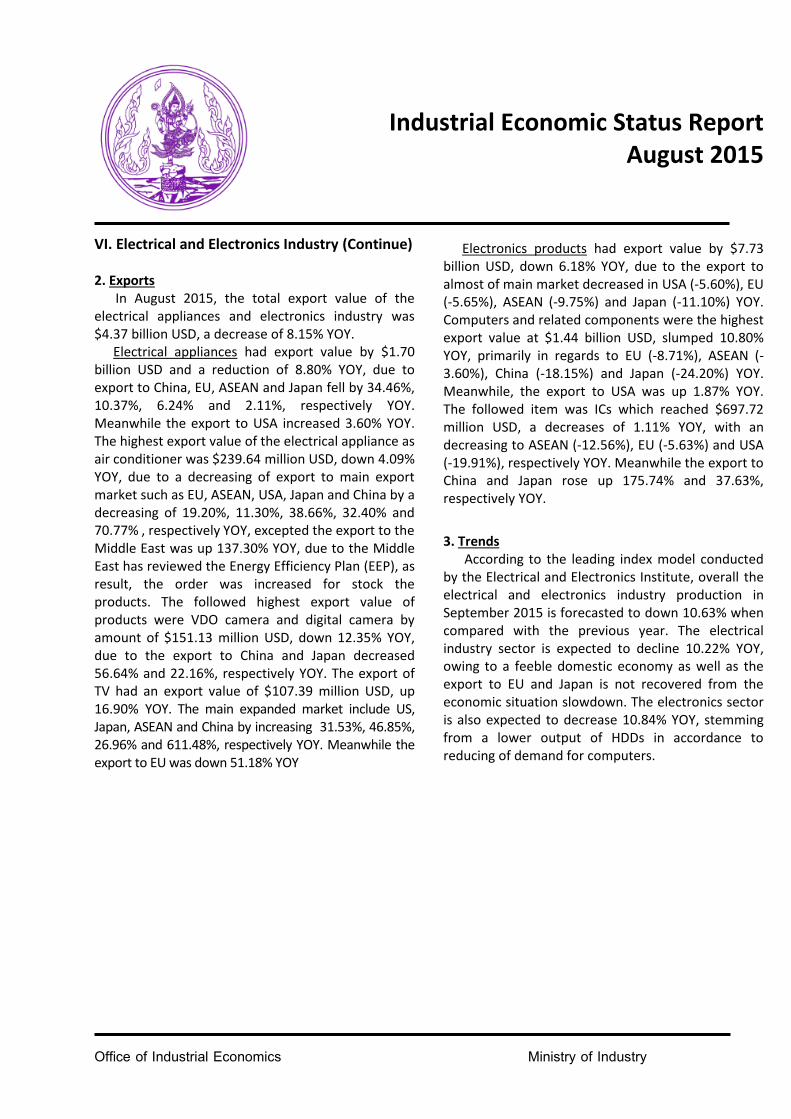
Production situation of the food industry dropped in August 2015 when compared with the same month of previous year, which resulted from a reduction of raw materials volume. The exports decreased YOY because affected from that a tax was adjusted after EU’s GSP benefits were terminated and fishery breaking the IUU rules of EU. However, the domestic sales expanded up.
1. Production In August 2015, major products of the food
industry (excluding sugar) shrank 0.1% from the same period of previous year.
Major products mainly based on export market: shrimp and cassava starch experienced a decrease of 29.5% and 21.4% respectively when compared with August 2014, due to a reduction of raw materials.
Products mainly based on domestic market: production of palm oil stayed at 0.7% YOY. The products used imported raw materials such as soybean oil dropped 7.9% due to the cost up according to the exchange rate of Thai baht weakened. The production of chicken feed stayed at 0.4% YOY. 2. Sales
1) Domestic Market: In August 2015, the domestic sales volume of food and agricultural products represented an increase of 3.6% YOY, resulting from the consumption of canned pineapple, canned tuna and chicken increased.
2) International Markets: The export value of the food industry export (excluding sugar) in August decreased 20.3% YOY, due to lower exports of products such as cassava starch, canned sweet corn, frozen fresh shrimp, canned tuna and frozen chicken caused from the economics of import countries slow down and the products prices in the global market dropped based on the oil price down as well as EU’s GSP benefits were terminated and fishery breaking the IUU rules of EU. The export of sugar was up 9.5% YOY due to the orders of ASEAN countries mainly. 3. Trends
Production and exports are forecasted to contract from the previous year, due to a decreasing in the order from oversea caused from the economics of import countries are not recovered and the announce of trading level adjustment of the illegal labor using and the breaking the IUU rules of EU, including a decreasing of the growth ration of China economies. Meanwhile, domestic sales also contract as an unrecovered economic in the future has reduced consumer confidence in spending.
Production Volume of Major Products in Food Industry
Exports of Major Products in Food Industry
Ton
Million USD $
Chicken Feed
Cassava Flour
Soybean Oil
Palm Oil
Canned Pineapple
Canned Tuna
Frozen Chicken
Frozen Shrimp
Sugar
Cassava Products
Instant Noodles
Rice Products
Canned Pineapple
Canned Sweet Corn
Canned Tuna
Frozen Raw Shrimp
Processed Chicken
Frozen Raw Chicken
8/15
7/15
8/14
8/15
7/15
8/14

Industrial Economic Status Report
August 2015
Office of Industrial Economics Ministry of Industry
II. Textile and Garment Industry Textile sector included textile fibers
products increased in domestic market, and meanwhile garment sector increased in knitted clothes as sportswear.
5,0005,8006,6007,4008,2009,0009,800
10,60011,40012,20013,00013,800
� � � �
�
Source: Industrial Economics Information Center, Office of Industrial Economics
6000
7000
8000
9000
10000
11000
12000
13000
14000
15000
� � � �
�
Source: Industrial Economics Information Center, Office of Industrial Economics
020406080
100120140160180200220240
� �
Source: Information and Communications Technologies Centers, Department of Trade Negotiations, Ministry of Commerce
1. Production Textile sector: In August 2015, the manufacture of
textile fibers, fabrics and elastic decreased 1.9%, 9.6% and 15.5% YOY, respectively, owing to the slowing orders from the ASEAN markets as well as the closing of domestic textile factories and also the importing fabric from abroad to meet the various needs.
Garment sector: When compared with the previous, the production of knitted clothes increased 2.8% in the outerwear of both men and women, but woven clothes decreased 4.7%. The decrease resulted from reducing orders from Japan and the US, and large enterprises moved manufacture to other countries to take advantage of GSP benefits and lower labour costs.
2. Sales
Domestic sale, when compared with the previous year, volume of textile products increased in textile fibers. Meanwhile, the sales volume of garments increased in knitted clothes, in particular sportswear.
Export value of the industry dropped 12.1% from the previous year. The textile sector decreased 12.0% which fabrics products, synthetic fiber yarn, household textile and synthetic fiber slumped 9.7%, 23.1, 16.6 and 3.8%, respectively. The garment product dropped 12.4% which garment and brassieres, corsets and components decreased 11.51% and 21.4%, respectively. The decrease resulted from the reduction of exports to ASEAN, USA, and European Union market slumped 6.0%, 11.7% and 24.0%, respectively.
3. Trends
Manufacture of textiles for downstream industries in domestic is expected to recovery due to the domestic economic stimulus measures. The textiles products is forecasted as shrink in fabric products due to the development of upstream and midstream group in Vietnam which result to decreasing of demand of fabric products from Thailand. Garment sector includes garment and sportswear will expand due to consumers and both domestic and international entrepreneurs have confidence in the situation of the country, sale promotion of public and private sectors as well as preparation for production on end of a year, so these may result the increasing of order.
Production Volume of Textile Fibers Ton
Export Value of Textiles and Garments
1,000pcs
Million USD $
Aug. 2014
Production Volume of Garments (woven fabrics)
2014
Jan Feb Mar Apr May Jun Jul Aug Sep Oct Nov Dec
Jan Feb Mar Apr May Jun Jul Aug Sep Oct Nov Dec
Garments Fabrics Cotton Fiber Household Synthetic Other Other yarns yarns fabric fiber textiles fabric
2015
2014
Aug. 2015
2015

Industrial Economic Status Report
August 2015
Office of Industrial Economics Ministry of Industry
III. Iron and Steel Industry
Informed source from the World Bank said that the iron ore price in global market will face Sources from the World Bank says Iron ore prices in the world market will be faced with a price decline by 3 years approximately, and also faced with a situation of large quantity of inventory in China. The good signs of recovery will come from investments in industrial sector and speculation of investors.
1. Production The manufacturing of iron industry in August 2015
decreased from previous year which the MPI of the industry stood at 106.35 points, a decrease of 24.52% YOY.
The MPI of flat-steel products slumped 28.90% which the hot-rolled steel decreased l 37.69, the followed decreasing item was the galvanized sheet (-33.79%), due to the construction sector slowdown, and next was the tin plate (32.77%) caused from the import of iron from China to competition in domestic market. According to the Iron and Steel Institute of Thailand, imports of flat steel products increased 17.1% (763,625 tons), such as thick hot-rolled alloy steel sheets increased 1,016.3% (import volume of 18,363
tons), and cold-rolled stainless steel raised up 35.6% (import volume of 12,748 tons). Exports decreased 35.6%, with a volume of 26,510 tons. Thick hot-rolled stainless steel was largest declined 97.4% (export volume of 4 tons). The MPI of long-steel dropped 14.84% and the high-tensile steel wire decreased 19.53% due to the construction sector slowdown as well as the price competition from China that affected to down the competition ability of domestic manufacture. According to the Iron and Steel Institute of Thailand, the imports dropped 10.7% (import volume of 253,403 tons. Imported products with the largest decline in volume were seamless tube (-44.2%) with a total volume of 22,788 tons and allow wire steel (-25.9%) with a total volume of 104,344 tons. Exports increased 270.2%, with a total of 308,599 tons. The items with the most significant expansion were steel bar (+1,845.1%) with a total of 258,074 tons, and the followed item was structural stainless steel (+262.5%) with a total of 116 tons. 2. Metal Prices According to the international steel price index of the Iron and Steel Institute of Thailand, the Free-On-Board (FOB) prices at Black Sea ports in August 2015 when compared with the previous year, the prices of almost iron products decreased such as the price of slab steel went down 43.98%, from $112.09 USD to $62.79 USD per ton, the price of hot-rolled steel sheet decreased 38.74%, from $113.84 USD to $69.74 USD per ton, the price of billet bar declined 38.52%, from $120.94 USD to $74.35 USD per ton, the price of cold-rolled steel sheets slumped 34.92%, from $117.75 USD to $76.63 USD per ton and the price of rebar fell 29.53%, from $111.7 USD to $78.72 USD per ton, due to the global economics situation and demand of iron slowdown which caused the metal prices in the global marketplace to fall. 3. Trends
The production level of the industry in Thailand is expected to decrease in September 2015 in both the long-steel and slab steel, due to a sluggish economy, both domestic and global. Nonetheless, production of downstream industries, including construction, electrical appliances, and automobiles remains stable.
Oversea Metal Price Index*
* CIS Black Sea

Industrial Economic Status Report
August 2015
Office of Industrial Economics Ministry of Industry
IV. Automotive Industry Vehicles
The automotive industry in August 2015 expanded, when compared to the previous year, resulting from increasing of export market.
1. Production Manufacturing volume of automobile in August
2015 was 159,470 units which increased 13.26% from August 2014 which produced 140,797 units, due to an expansion in passenger cars, 1-ton pickups, and commercial cars.
2. Sales
Sale volume of automobile in August 2015 was 68,835 units which decreased 9.94% from August 2014 which sold 68,835 units, due to a decreasing in passenger cars, 1-ton pickups, and commercial cars. Sales decreased along with the country’s economy including the prices of agricultural products dropped due to the drought, causing farmers’ income to decline as well as household debt still remained high, as a result, banks were more stringent in lending.
3. Exports
Export volume increased 13.88%, from 89,550 units in August 2014 to 101,982 units in August 2015, with 38% of passenger cars and 62% of 1-ton pickups and PPVs. The export of passenger cars expanded in the EU, Asia and North America, meanwhile the export of 1-ton pickups and PPVs went up in Oceania, EU Asia, Middle America and South America.
4. Trends
The automotive industry is forecasted to slowdown in September 2015 when compared with September 2014. The production is expected to reach 46% for domestic sales and 54% for exports.
Sales Export Production
Aug Sep Oct Nov Dec Jan Feb Mar Apr May Jun Jul Aug 14 14 14 14 14 15 15 15 15 15 15 15 15
Unit Monthly Volume of Automobiles

Industrial Economic Status Report
August 2015
Office of Industrial Economics Ministry of Industry
Motorcycle Industry
In August 2015, the motorcycle industry contracted when compared with the same month of the previous year, which it decreased in the sale volume of both domestic and export markets.
1. Production
Manufacturing volume of motorcycles in August 2015 was 130,219 units which increased 7.85% from August 2014 which produced 141,308units, owing to a reduction of family-type and sport-type motorcycles.
2. Sales
Sale volume of motorcycles in August 2015 was 125,620 units which decreased 12.30% from August 2014 which sold 143,235 units. This contract resulted from a decrease in sales of family-type, scooter-type and sport-type motorcycles.
3. Exports of finished motorcycles (CBU)
The exports volume was 19,441 units in August 2015 which climbed 16.25 %, from August 2014 which exported 23,290 units. This decreasing resulted from the exports to Japan, USA and Netherlands.
4. Trends
The motorcycle industry in September 2015 is expected to expand when compare with August 2014. The production is forecasted by 81% for domestic sales and 19% for exports.
Monthly Volume of Motorcycles Unit
Sales Export Production
Aug Sep Oct Nov Dec Jan Feb Mar Apr May Jun Jul Aug 14 14 14 14 14 15 15 15 15 15 15 15 15

Industrial Economic Status Report
August 2015
Office of Industrial Economics Ministry of Industry
V. Cement Industry
Overall cement industry was contracted
continuously since last month. The domestic manufacturing and sale quantities decreased which was representing a slowdown of cement market and construction sector in domestic. However, at current Thai government has issued the measures to stimulate the economic to build more confident for Thai and foreign investors. Export value is also slowdown due to Bangladesh; Thailand's main customer reduced the order so much.
Source: Industrial Economic Information Center, Office of Industrial Economics
Source: Industrial Economic Information Center, Office of Industrial Economics
Source: Information and Communications Technologies Centers, Department of Trade Negotiations, Ministry of Commerce
1. Production and Domestic Sales
When compared with August 2014, production and domestic sales in August 2015 decreased 5.44% and 3.20, respectively.
The overall cement industry contracted when compare with last month and last year. The overall manufacturing decreasing was representing of the slowdown of cement market and construction section in domestic due to other types of cements declined, which was representing a slowdown of cement market and construction sector in Thailand affected from the sluggish economy. However, Thai government has issued the measures to stimulate the economic such as accelerating of projects budget disbursement and including accelerating construction of infrastructure projects in both rail system and water management system in order to the private sector has more confidence to investment in business in next phase.
2. Exports
The export value of cement in August 2015 decreased 16.63% YOY.
In overall situation, the exports decreased when compared with the previous year, due to Bangladesh; Thailand's main customer reduced the order from normally $ 4 million USD monthly to be only $ 173 USD in this month. However, Myanmar, and Cambodia ordered the cement from Thailand in large volume normally, as resulting the export value in this month was not down so much.
3. Trends Production and domestic sales in cement have trend in
slowdown continuously since last month, although this period is expanding period of construction sector before entering to the period of labour returning to domicile for harvest. It resulted from a hard raining throughout the month, so the construction projects in almost area are slide as well as the demand of cement decrease.
The trend of export is expected to increase YOY, due to the demand of Bangladesh will return to normal situation and Myanmar, and Cambodia; Thailand's main customers still order in large quantity normally. If the export will contract with an decreasing consumption in domestic, the stock of cement in Thailand will increase so much, because it is unable to adjust to reduce production quantity as well according to Break Event Point.
Production Volume of Cement Million metric Tons
2011
Jan Feb Mar Apr May Jun Jul Aug Sep Oct Nov Dec
2012 2013 2014
2015
Million metric Tons
Jan Feb Mar Apr May Jun Jul Aug Sep Oct Nov Dec
2011 2012 2013 2014
2015
Domestic Sales Volume of Cement
Export Value of Cement Million USD $
2011 2012 2013 2014
2015
Jan Feb Mar Apr May Jun Jul Aug Sep Oct Nov Dec

Industrial Economic Status Report
August 2015
Office of Industrial Economics Ministry of Industry
VI. Electrical and Electronics Industry
Overall electrical and electronics industry in August 2015 dropped 25.06% when compare with the previous year. The electrical industry sector was down 14.91% YOY, due to reduced purchasing power in domestic as well as overseas. Meanwhile, the electronics industry sector decreased 26.81% YOY, stemming from an output reduction of hard disk drives (HDDs).
MPI of Electrical Appliances and Electronics Industry
Source: Office of Industrial Economics Table 1: Top Value of Electrical Appliances and Electronic Products Exported in August 2015
Electrical / Electronic Products
Value (Million USD)
%YOY
Computer components 1,442.78 -10.80
Integrated circuits 697.72 -1.11
Air conditioners 239.64 -4.09
VDO cameras & Digital cameras
151.13 -12.35
Total of electrical / electronic product
4,373.99 -8.15
Source: Electrical and Electronics Institute
1. Production
Overall production of the electrical and electronics industry in August 2015, the MPI stood at 227.70 points and a decline of 25.06% YOY. The MPI of electrical industry sector stood at 105.45 points in August 2015, down 14.91% YOY. Almost of the appliances dropped such as split-type air conditioner’s condensing unit, refrigerator, compressor and TV decreased 5.57%, 7.68%, 4.53% and 74.45%, respectively YOY, due to slowdown of purchasing power in domestic as well as a sluggish of real estate business, also it resulted the decreasing of demand in the electrical appliances, including the main export market was not recover (EU and Japan). For some television manufacturers relocated their manufacturing base to other ASEAN countries. The split-type air conditioner’s evaporator unit only expanded 3.16% YOY. The MPI of the electronics industry sector in August 2015 stood at 297.04 points and a decline of 26.81% YOY. The decreased products included HDDs, Monolithic IC, and Semiconductor by 32.18%, 18.92% and 3.80%, respectively YOY, due to stemming from reduced global demand for PCs and laptop computers, as well as the global economic slowdown, so it affected a decreasing of demand of electronic products in the global market.
2015
2014
2013
2012
2011
Jan Feb Mar Apr May Jun Jul Aug Sep Oct Nov Dec
Industrial Economic Status Report
August 2015
Office of Industrial Economics Ministry of Industry
VI. Electrical and Electronics Industry (Continue) 2. Exports
In August 2015, the total export value of the electrical appliances and electronics industry was $4.37 billion USD, a decrease of 8.15% YOY. Electrical appliances had export value by $1.70 billion USD and a reduction of 8.80% YOY, due to export to China, EU, ASEAN and Japan fell by 34.46%, 10.37%, 6.24% and 2.11%, respectively YOY. Meanwhile the export to USA increased 3.60% YOY. The highest export value of the electrical appliance as air conditioner was $239.64 million USD, down 4.09% YOY, due to a decreasing of export to main export market such as EU, ASEAN, USA, Japan and China by a decreasing of 19.20%, 11.30%, 38.66%, 32.40% and 70.77% , respectively YOY, excepted the export to the Middle East was up 137.30% YOY, due to the Middle East has reviewed the Energy Efficiency Plan (EEP), as result, the order was increased for stock the products. The followed highest export value of products were VDO camera and digital camera by amount of $151.13 million USD, down 12.35% YOY, due to the export to China and Japan decreased 56.64% and 22.16%, respectively YOY. The export of TV had an export value of $107.39 million USD, up 16.90% YOY. The main expanded market include US, Japan, ASEAN and China by increasing 31.53%, 46.85%, 26.96% and 611.48%, respectively YOY. Meanwhile the export to EU was down 51.18% YOY
Electronics products had export value by $7.73 billion USD, down 6.18% YOY, due to the export to almost of main market decreased in USA (-5.60%), EU (-5.65%), ASEAN (-9.75%) and Japan (-11.10%) YOY. Computers and related components were the highest export value at $1.44 billion USD, slumped 10.80% YOY, primarily in regards to EU (-8.71%), ASEAN (-3.60%), China (-18.15%) and Japan (-24.20%) YOY. Meanwhile, the export to USA was up 1.87% YOY. The followed item was ICs which reached $697.72 million USD, a decreases of 1.11% YOY, with an decreasing to ASEAN (-12.56%), EU (-5.63%) and USA (-19.91%), respectively YOY. Meanwhile the export to China and Japan rose up 175.74% and 37.63%, respectively YOY. 3. Trends
According to the leading index model conducted by the Electrical and Electronics Institute, overall the electrical and electronics industry production in September 2015 is forecasted to down 10.63% when compared with the previous year. The electrical industry sector is expected to decline 10.22% YOY, owing to a feeble domestic economy as well as the export to EU and Japan is not recovered from the economic situation slowdown. The electronics sector is also expected to decrease 10.84% YOY, stemming from a lower output of HDDs in accordance to reducing of demand for computers.