industrial barter in russia
TRANSCRIPT
This article was downloaded by: [Florida State University]On: 13 November 2014, At: 00:46Publisher: RoutledgeInforma Ltd Registered in England and Wales Registered Number: 1072954Registered office: Mortimer House, 37-41 Mortimer Street, London W1T 3JH, UK
Communist Economies and EconomicTransformationPublication details, including instructions for authors andsubscription information:http://www.tandfonline.com/loi/cpce19
Industrial barter in RussiaSergei Aukutsionek aa IMEMO , Russian Economic Barometer, Profsoyuznaya 23,Moscow, 177859, Russian FederationPublished online: 13 Dec 2007.
To cite this article: Sergei Aukutsionek (1998) Industrial barter in Russia, CommunistEconomies and Economic Transformation, 10:2, 179-188, DOI: 10.1080/14631379808427914
To link to this article: http://dx.doi.org/10.1080/14631379808427914
PLEASE SCROLL DOWN FOR ARTICLE
Taylor & Francis makes every effort to ensure the accuracy of all the information (the“Content”) contained in the publications on our platform. However, Taylor & Francis,our agents, and our licensors make no representations or warranties whatsoeveras to the accuracy, completeness, or suitability for any purpose of the Content. Anyopinions and views expressed in this publication are the opinions and views of theauthors, and are not the views of or endorsed by Taylor & Francis. The accuracyof the Content should not be relied upon and should be independently verifiedwith primary sources of information. Taylor and Francis shall not be liable for anylosses, actions, claims, proceedings, demands, costs, expenses, damages, and otherliabilities whatsoever or howsoever caused arising directly or indirectly in connectionwith, in relation to or arising out of the use of the Content.
This article may be used for research, teaching, and private study purposes. Anysubstantial or systematic reproduction, redistribution, reselling, loan, sub-licensing,systematic supply, or distribution in any form to anyone is expressly forbidden.Terms & Conditions of access and use can be found at http://www.tandfonline.com/page/terms-and-conditions

Communist Economies & Economic Transformation, Vol 10, No. 2, 1998 179
Industrial Barter in Russia
SERGEI AUKUTSIONEK
Scale and Rate of Growth
The rapid growth of barter is one of the most remarkable phenomena in thedevelopment of the Russian economy over the past two years. Something which notlong ago seemed almost impossible (on a basis of modern technology and after theexecution of radical market transformation) is now normal practice in Russianindustry. The Russian Economic Barometer (REB) data presented in Table 1 not onlydemonstrate the unprecedented growth of the share of barter transactions, from 6%in 1992 to 41% in the first half of 1997, but also indicate that this process is not yetshowing any sign of slowing down.
Barter is extraordinarily widespread in Russian industry. In the spring of 1997 onaverage only one enterprise in 11 did not resort to barter at all to dispose of itsoutput. In approximately one-quarter of enterprises the share of barter was below30%, in one-third it was between 30% and 70%, and in one-third it was over 70%.
As a rule, the larger the enterprise the more widely it makes use of barter. Thefigures for the average share of barter presented in Table 1 are calculated (like allother REB indicators) without employing any weighting procedure. If the size of theenterprises surveyed were taken into account the share of barter in total turnoverwould appear even larger: for 1997, for example, it would be 52%.
Branch Structure
The differences between branches in the area of barter transactions are very large anduntil recently were continuing to increase. Whilst in 1993 the gap between the then'leader' (the chemical industry) and the most 'backward' branch (electric power) interms of the share of barter deals was 17 percentage points, in 1997 it was 34percentage points (between the building materials industry and the food industry).Over the same period the gap between the three basic sectors of manufacturingindustry—consumer goods, investment goods and intermediate goods—grew from 5to 23 percentage points, and that between industry as a whole and agriculture rosefrom 0 to 10 percentage points (see Table 2).
It should be noted that the growth in disparity between branches was ac-companied by substantial changes in the rank order of the branches in terms of thisindicator. Nonetheless, certain fairly persistent trends which have been visiblethroughout the period studied can be identified.
Dr Sergei P. Aukutsionek, Editor, Russian Economic Barometer, IMEMO, Moscow 177859,Profsoyuznaya 23, Russian Federation.
1351-4393/98/020179-10 © 1998 Centre for Research into Post-Communist Economies
Dow
nloa
ded
by [
Flor
ida
Stat
e U
nive
rsity
] at
00:
46 1
3 N
ovem
ber
2014
180 Sergei Aukutsionek
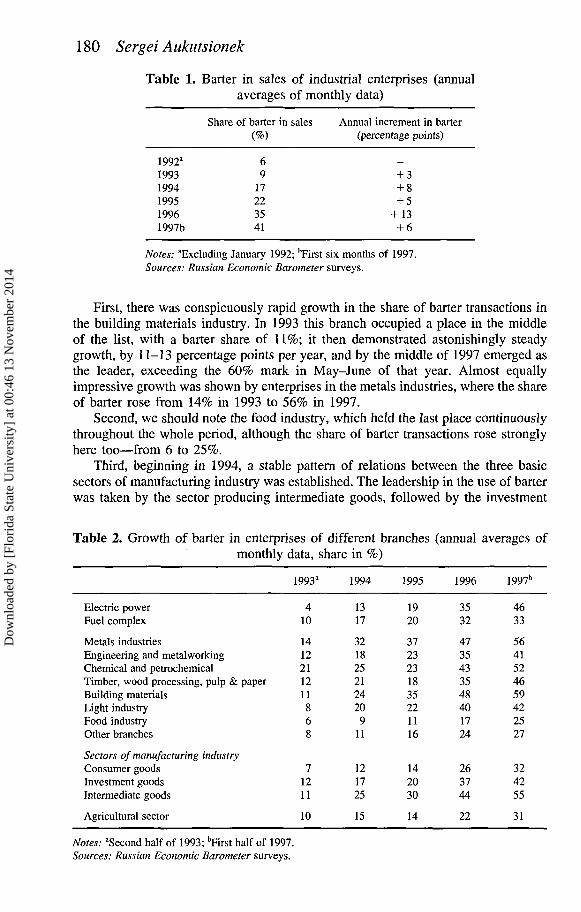
Table 1. Barter in sales of industrial enterprises (annualaverages of monthly data)
1992"19931994199519961997b
Share of barter in sales(%)
69
17223541
Annual increment in barter(percentage points)
+ 3+ 8+ 5
+ 13+ 6
Notes: "Excluding January 1992; bFirst six months of 1997.Sources: Russian Economic Barometer surveys.
First, there was conspicuously rapid growth in the share of barter transactions inthe building materials industry. In 1993 this branch occupied a place in the middleof the list, with a barter share of 11%; it then demonstrated astonishingly steadygrowth, by 11-13 percentage points per year, and by the middle of 1997 emerged asthe leader, exceeding the 60% mark in May-June of that year. Almost equallyimpressive growth was shown by enterprises in the metals industries, where the shareof barter rose from 14% in 1993 to 56% in 1997.
Second, we should note the food industry, which held the last place continuouslythroughout the whole period, although the share of barter transactions rose stronglyhere too—from 6 to 25%.
Third, beginning in 1994, a stable pattern of relations between the three basicsectors of manufacturing industry was established. The leadership in the use of barterwas taken by the sector producing intermediate goods, followed by the investment
Table 2. Growth of barter in enterprises of different branches (annual averages ofmonthly data, share in %)
Electric powerFuel complex
Metals industriesEngineering and metalworkingChemical and petrochemicalTimber, wood processing, pulp & paperBuilding materialsLight industryFood industryOther branches
Sectors of manufacturing industryConsumer goodsInvestment goodsIntermediate goods
Agricultural sector
1993"
410
1412211211868
71211
10
1994
1317
3218252124209
11
121725
15
1995
1920
3723231835221116
142030
14
1996
3532
4735433548401724
263744
22
1997b
4633
5641524659422527
324255
31
Notes: "Second half of 1993; bFirst half of 1997.Sources: Russian Economic Barometer surveys.
Dow
nloa
ded
by [
Flor
ida
Stat
e U
nive
rsity
] at
00:
46 1
3 N
ovem
ber
2014
Industrial Barter in Russia 181
goods sector, with the consumer goods sector bringing up the rear. For each 1% ofbarter in consumer goods there was 1..7-2.1% of barter in intermediate goods and1.3-1.4% in investment goods in this period.
As for agriculture, in 1993-94 it was slightly ahead of the consumer goods sectorof manufacturing industry in degree of barterisation, in 1995 they were equal, andthereafter agriculture began to lag behind a little.
Why and With Whom Are Goods Bartered?
REB respondents ranked the basic reasons for using barter as follows (in percentageof the number of enterprises citing them):
End of 1994 Beginning of 1998• shortage of working capital 47% 61%• desire to speed up sales of output 39% 41%• large tax payments 17% 20%• other reasons 9% 16%
The main conclusion which follows from these figures is that the motive of avoidingtaxes plays a secondary role in the use of barter. This was true both at the end of1994, when the share of barter in sales was still only approaching 20%, and now,when it is over 40%. In a previous article1 I argued that the mechanism of thedevelopment of barter was similar to the mechanism of the growth of non-paymentamong enterprises. The data cited above indirectly support this idea: barter—just likenon-payment—is primarily a means of maintaining production in conditions of animperfect market. There is no need to see it as a device for avoiding paying taxes,which cunning directors thought up in order to sabotage market transformation andspite the government. The tax avoidance motive is present but it is not dominant.
One of the difficulties which barterisation poses for producers is the search fora trading partner. This difficulty is traditionally viewed as one of the main factorsrestraining barterisation. At first sight it may even seem that modern industry issimply incompatible with barter exchange on the scale that we observe in Russiatoday. Yet many Russian producers have largely overcome this obstacle. How canwe explain this phenomenon? At least three things must be taken into account here.
First, the current volume of barter transactions (over 40% of industrial pro-duction) was not reached straight away. To achieve this, Russian producers requireda period of adaptation lasting several years.
Second, over the course of the period during which the barter network wasformed, industrial production fell by half. The present 40% barter, if related to thepre-reform volume of output, would amount to at most 20%. It can even be presumedthat, as industrial output declined, the largest reductions were sustained by thosekinds of production which did not join the barter network.
Third, barter did not develop (and is not developing) in a vacuum. To aconsiderable extent it replaces already existing trade links between enterprises. Inthis case, of course, there is no question of searching for a partner, since the partneris already there.
This last statement is based on data from the April 1997 REB survey. As Table3 shows, the more extensively an enterprise uses barter, the more connections it hasmaintained with old suppliers and the greater the weight of these suppliers in barter.(It should be noted that this rule does not apply to old customers for enterprises'
Dow
nloa
ded
by [
Flor
ida
Stat
e U
nive
rsity
] at
00:
46 1
3 N
ovem
ber
2014
182 Sergei Aukutsionek
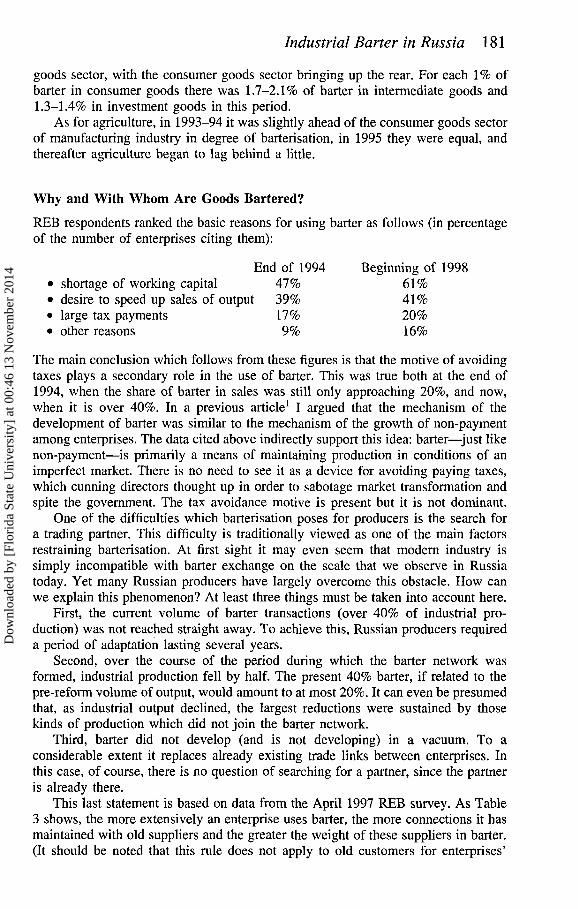
Table 3. Characteristics of barter transactions at enterprises with different levels ofbarter (April 1997)
Groups of enterprises with differentshares of barter in sales (%)
less than 10 10-40 40-70 over 70
1. Share of old trading partners3 in(a) total sales of the enterprise 42(b) total deliveries to the enterprise 28
2. Share of old trading partners in barter" 113. Share of forced barter in barter 324. Average share of forced barter in sales 25. Average share of all barter in sales 6
42393031825
3443454023.57
444563523975
Note: "Partners with which the enterprise maintained trading links before 1992.
output, but only to suppliers. The reasons for this asymmetry are evidently connectedwith how bartered production is used. On this see below.)
Another negative aspect of barterisation is traditionally considered to be a generalreduction in economic efficiency. The difficulty of finding partners for exchange inkind results in a non-optimal distribution of the products produced among enter-prises. For the sake of maintaining the production process, enterprises often have toexchange their products not entirely for what they need, or deal with partners otherthan the best ones. The weakness of barter does not mean, however, that theexchange is always suboptimal for the enterprise. Barter transactions can also beconducted on completely normal terms (entirely satisfactory for the enterprise) whichevolved before the transition to the use of barter.
In a first approximation, therefore, we can divide all barter transactions into twocategories: forced and voluntary.
1. Forced barter I use to mean exchange as a result of which the enterprisereceives a product which it either would not acquire at all or would acquirefrom different suppliers if it had the money to buy it (or a substitute).
2. Voluntary barter, the remaining part, is for a product which the enterprisewould buy anyway from the same suppliers (if it had the necessary amount ofmoney).
What are the proportions of these two categories in bartered production? Can it besaid that the major part of barter is forced and consequently causes disruption of theoptimal pattern of distribution of resources among industrial enterprises? The REBdata show that in April 1997 only around 40% of the total volume of barter trade atthe typical Russian enterprise was forced. Consequently, the major part of flows ofgoods through barter followed a perfectly normal course—to where they would havegone via ordinary trade for money. Yet it must be admitted that even 40% forcedbarter is quite a lot. Moreover, there are grounds for expecting that, with the furthergrowth of barter, the proportion which is forced increases. This can be observed inTable 3 in the comparison between the group of enterprises with little barter and thegroup with a large share.
It is interesting to investigate what role old trading partners play in all this.Would it be correct to claim that the reason for such a large volume of voluntarybarter is old (pre-barter) trade links between enterprises? The data presented in Table
Dow
nloa
ded
by [
Flor
ida
Stat
e U
nive
rsity
] at
00:
46 1
3 N
ovem
ber
2014
Industrial Barter in Russia 183
3 rather support the opposite hypothesis: the greater the proportion of deliveries thatcomes from old trading partners, the higher the share of forced barter. Yet theseindirect data do not provide direct answers to the questions we have posed, and Ihope to return to examining them in the future after collecting relevant information.
Forms of Barter Transaction
Barter is practised in Russian industry in at least two forms. First, it can beconditional barter, that is, exchange of goods with transfer of certain sums of money(as a rule non-cash money). Such transfers may cover the value of the dealcompletely or partially, they may take place over significant intervals of time andformally not be connected with the deal at all. Is it justified to consider this kind ofexchange transactions as barter?
The main justification must be that enterprise directors themselves are inclined toregard such transactions as barter. The essential feature here is that both partners inthe deal are concerned not with selling but with acquiring goods. Neither of them can(or does not want to) be a pure buyer because they do not have the money (or givethe appearance that they do not). Each of them makes up for the lack of money withtheir own goods. Beside this, it does not suit either of them to be a pure seller (forexample, for tax considerations). As a result, there can only be a deal when oneneeds the other's goods and vice versa. So the outcome is that such a deal is barterin essence or, so to say, in its techniques of execution: it is in reality exchange ofgoods for goods, not goods for money.
Second, there can be unconditional or pure barter. This is barter in the classicalsense of the term, not connected with any accompanying monetary compensation orsupplement.
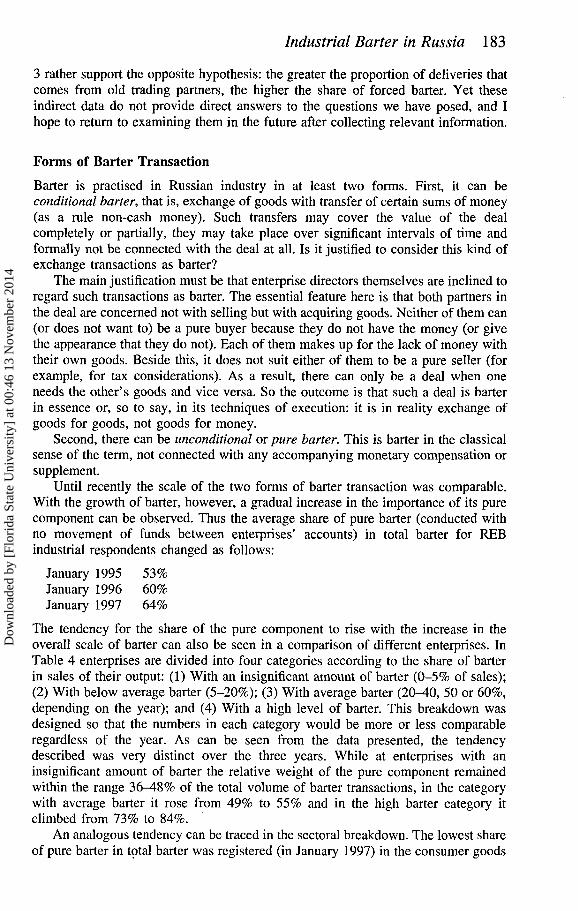
Until recently the scale of the two forms of barter transaction was comparable.With the growth of barter, however, a gradual increase in the importance of its purecomponent can be observed. Thus the average share of pure barter (conducted withno movement of funds between enterprises' accounts) in total barter for REBindustrial respondents changed as follows:
January 1995 53%January 1996 60%January 1997 64%
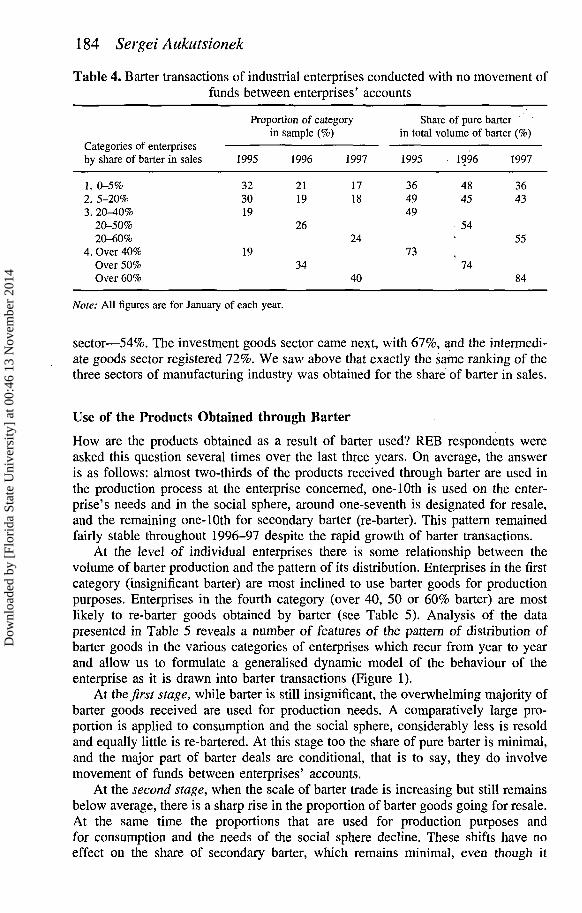
The tendency for the share of the pure component to rise with the increase in theoverall scale of barter can also be seen in a comparison of different enterprises. InTable 4 enterprises are divided into four categories according to the share of barterin sales of their output: (1) With an insignificant amount of barter (0-5% of sales);(2) With below average barter (5-20%); (3) With average barter (20-40, 50 or 60%,depending on the year); and (4) With a high level of barter. This breakdown wasdesigned so that the numbers in each category would be more or less comparableregardless of the year. As can be seen from the data presented, the tendencydescribed was very distinct over the three years. While at enterprises with aninsignificant amount of barter the relative weight of the pure component remainedwithin the range 36-48% of the total volume of barter transactions, in the categorywith average barter it rose from 49% to 55% and in the high barter category itclimbed from 73% to 84%.
An analogous tendency can be traced in the sectoral breakdown. The lowest shareof pure barter in total barter was registered (in January 1997) in the consumer goods
Dow
nloa
ded
by [
Flor
ida
Stat
e U
nive
rsity
] at
00:
46 1
3 N
ovem
ber
2014
184 Sergei A ukutsionek
Table 4. Barter transactions of industrial enterprises conducted with no movement offunds between enterprises' accounts
Categories of enterprisesby share of barter in sales
1. 0-5%2. 5-20%3. 20-40%
20-50%20-60%
4. Over 40%Over 50%Over 60%
Proportion of category
1995
323019
19
in sample (%)
1996
2119
26
34
1997
1718
24
40
Share of pure barterin total
1995
364949
73
volume of barter (%)
1996
4845
54
74
1997
3643
55
84
Note: All figures are for January of each year.
sector—54%. The investment goods sector came next, with 67%, and the intermedi-ate goods sector registered 72%. We saw above that exactly the same ranking of thethree sectors of manufacturing industry was obtained for the share of barter in sales.
Use of the Products Obtained through Barter
How are the products obtained as a result of barter used? REB respondents wereasked this question several times over the last three years. On average, the answeris as follows: almost two-thirds of the products received through barter are used inthe production process at the enterprise concerned, one-lOth is used on the enter-prise's needs and in the social sphere, around one-seventh is designated for resale,and the remaining one-10th for secondary barter (re-barter). This pattern remainedfairly stable throughout 1996-97 despite the rapid growth of barter transactions.
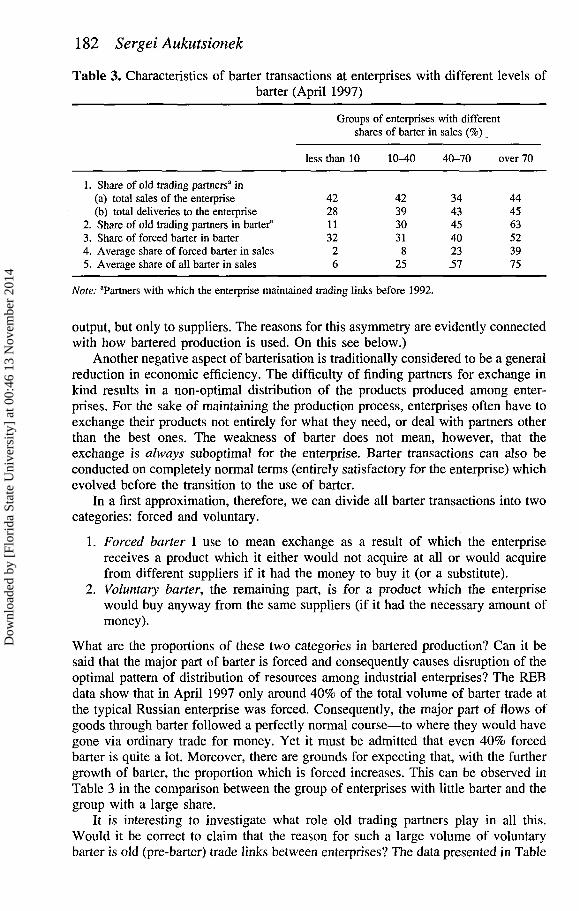
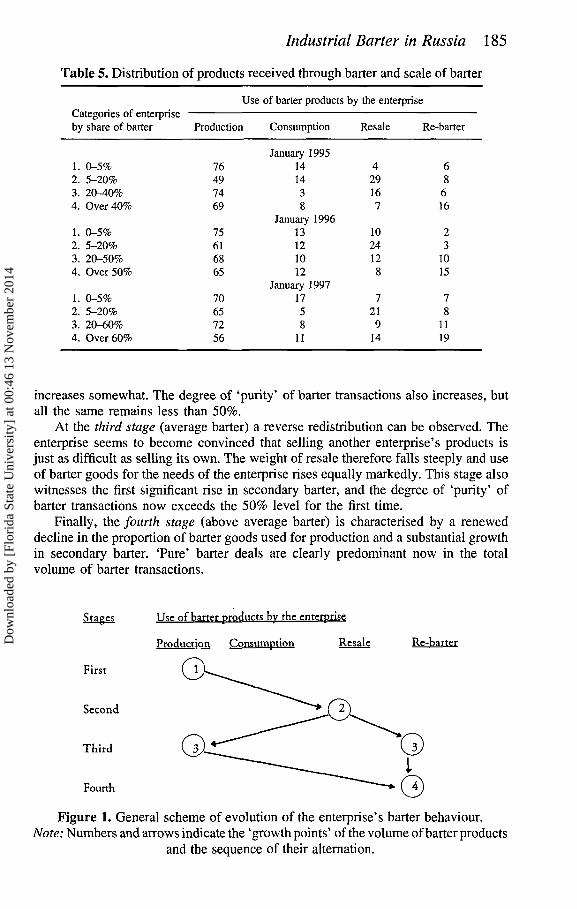
At the level of individual enterprises there is some relationship between thevolume of barter production and the pattern of its distribution. Enterprises in the firstcategory (insignificant barter) are most inclined to use barter goods for productionpurposes. Enterprises in the fourth category (over 40, 50 or 60% barter) are mostlikely to re-barter goods obtained by barter (see Table 5). Analysis of the datapresented in Table 5 reveals a number of features of the pattern of distribution ofbarter goods in the various categories of enterprises which recur from year to yearand allow us to formulate a generalised dynamic model of the behaviour of theenterprise as it is drawn into barter transactions (Figure 1).
At the first stage, while barter is still insignificant, the overwhelming majority ofbarter goods received are used for production needs. A comparatively large pro-portion is applied to consumption and the social sphere, considerably less is resoldand equally little is re-bartered. At this stage too the share of pure barter is minimal,and the major part of barter deals are conditional, that is to say, they do involvemovement of funds between enterprises' accounts.
At the second stage, when the scale of barter trade is increasing but still remainsbelow average, there is a sharp rise in the proportion of barter goods going for resale.At the same time the proportions that are used for production purposes andfor consumption and the needs of the social sphere decline. These shifts have noeffect on the share of secondary barter, which remains minimal, even though it
Dow
nloa
ded
by [
Flor
ida
Stat
e U
nive
rsity
] at
00:
46 1
3 N
ovem
ber
2014
Industrial Barter in Russia 185
Table 5. Distribution of products received through barter and scale of barter
Categories of enterpriseby share of barter
1. 0-5%2. 5-20%3. 20-40%4. Over 40%
1. 0-5%2. 5-20%3. 20-50%4. Over 50%
1. 0-5%2. 5-20%3. 20-60%4. Over 60%
Use
Production
76497469
75616865
70657256
of barter products
Consumption
January 1995141438
January 199613121012
January 19971758
11
by the enterprise
Resale
429167
1024128
7219
14
Re-barter
68
616
23
1015
78
1119
increases somewhat. The degree of 'purity' of barter transactions also increases, butall the same remains less than 50%.
At the third stage (average barter) a reverse redistribution can be observed. Theenterprise seems to become convinced that selling another enterprise's products isjust as difficult as selling its own. The weight of resale therefore falls steeply and useof barter goods for the needs of the enterprise rises equally markedly. This stage alsowitnesses the first significant rise in secondary barter, and the degree of 'purity' ofbarter transactions now exceeds the 50% level for the first time.
Finally, the fourth stage (above average barter) is characterised by a reneweddecline in the proportion of barter goods used for production and a substantial growthin secondary barter. 'Pure' barter deals are clearly predominant now in the totalvolume of barter transactions.
Use of barter products by the enterprise
Production Consumption Resale—s1
Stages
First
Second
Third
Fourth
Figure 1. General scheme of evolution of the enterprise's barter behaviour.Note: Numbers and arrows indicate the 'growth points' of the volume of barter products
and the sequence of their alternation.
Dow
nloa
ded
by [
Flor
ida
Stat
e U
nive
rsity
] at
00:
46 1
3 N
ovem
ber
2014
186 Sergei Aukutsionek
The scheme we have examined is incomplete in the sense that it contains nodescription of the reverse process—the curtailment of barter transactions and enter-prises' movement from category to category in the opposite direction. Our knowl-edge of the barter economy today is too poor for this, and we can only constructhypotheses about how (for example, symmetrically or not) this process will occur. Itis not even clear whether it will begin at all in the next few years.
The Barter Multiplier
It has long been known that enterprises use secondary barter. But hitherto it has beenhard to estimate the real magnitude of this phenomenon. Judging by REB data, it hasnot yet reached a very significant scale. As we saw above, re-barter constitutes atmost one-10th of total barter production. But this figure is the average for the pastthree years, and the trend that is observed here is unfavourable.
Thus in January 1995 re-barter made up 9% of the volume of production, inJanuary 1996 the figure was 10%, and in January 1997 it had jumped to 14%. If wecalculate this as a proportion of total output (bartered and sold), we obtain thefollowing results. In January 1995 1.7% of the industrial output produced byenterprises became the object of secondary barter, in January 1996 the figure was3.0% and in January 1997 5.3%. Secondary barter is growing one-and-a-half timesfaster than primary barter. And so far there are no grounds to assume that thisprocess will go into reverse in the near future. If the present trend were to continue,we could expect that by the beginning of 1998 around 10% of the output of Russianindustry would have become involved in secondary baiter transactions.
This estimate can be interpreted from various points of view. First of all, it isevidence of the rapid and impressive (if that is the appropriate word here) progressof the barter economy. Almost as much output is now involved in secondary bartertransactions as was involved in all barter transactions in 1992. One can only guesswhat efforts Russian industrialists had to make in order to create an enormous andfar-flung network of barter exchange spontaneously, without any central administra-tion. An indirect indication of these efforts is the fact that, in comparison with 1991,almost half the trading partners of the typical Russian enterprise have been replaced.Yet the renewal of trading partners was probably not a necessary condition of theaccelerated barterisation. The main difficulties were probably connected with chang-ing the mix of products produced and the general change in the collective economicmentality of directors.
If we view the figures cited above as evidence of a problem and a signal to lookfor ways to correct it, it should be noted that the proportion of secondary barter isnot yet so great as to present serious grounds for concern. If 14% of barterproduction goes back into barter trade again, this means that the multiplier is equalto approximately
In other words, an increase of 100 rubles in the volume of primary barter dealsultimately leads to a rise of approximately 116 rubles in total barter turnover.
100 + 0.14 X 100 + 0.142 X 100 + 0.143 X 100 + ... = 116.
Clearly, with a multiplier of this size, there is no danger of avalanche-like growth ofbarter yet.
Dow
nloa
ded
by [
Flor
ida
Stat
e U
nive
rsity
] at
00:
46 1
3 N
ovem
ber
2014
Industrial Barter in Russia 187
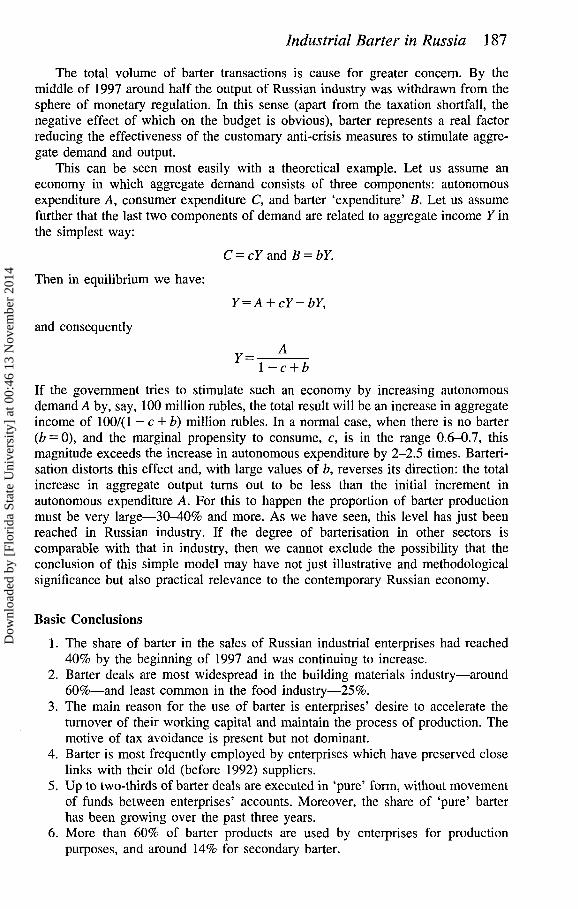
The total volume of barter transactions is cause for greater concern. By themiddle of 1997 around half the output of Russian industry was withdrawn from thesphere of monetary regulation. In this sense (apart from the taxation shortfall, thenegative effect of which on the budget is obvious), barter represents a real factorreducing the effectiveness of the customary anti-crisis measures to stimulate aggre-gate demand and output.
This can be seen most easily with a theoretical example. Let us assume aneconomy in which aggregate demand consists of three components: autonomousexpenditure A, consumer expenditure C, and barter 'expenditure' B. Let us assumefurther that the last two components of demand are related to aggregate income Y inthe simplest way:
C = cY and B = bY.
Then in equilibrium we have:
Y = A + cY-bY,
and consequently
1-c + b
If the government tries to stimulate such an economy by increasing autonomousdemand A by, say, 100 million rubles, the total result will be an increase in aggregateincome of 100/(1 — c + b) million rubles. In a normal case, when there is no barter(6 = 0), and the marginal propensity to consume, c, is in the range 0.6-0.7, thismagnitude exceeds the increase in autonomous expenditure by 2-2.5 times. Barteri-sation distorts this effect and, with large values of b, reverses its direction: the totalincrease in aggregate output turns out to be less than the initial increment inautonomous expenditure A. For this to happen the proportion of barter productionmust be very large—30-40% and more. As we have seen, this level has just beenreached in Russian industry. If the degree of barterisation in other sectors iscomparable with that in industry, then we cannot exclude the possibility that theconclusion of this simple model may have not just illustrative and methodologicalsignificance but also practical relevance to the contemporary Russian economy.
Basic Conclusions
1. The share of barter in the sales of Russian industrial enterprises had reached40% by the beginning of 1997 and was continuing to increase.
2. Barter deals are most widespread in the building materials industry—around60%—and least common in the food industry—25%.
3. The main reason for the use of barter is enterprises' desire to accelerate theturnover of their working capital and maintain the process of production. Themotive of tax avoidance is present but not dominant.
4. Barter is most frequently employed by enterprises which have preserved closelinks with their old (before 1992) suppliers.
5. Up to two-thirds of barter deals are executed in 'pure' form, without movementof funds between enterprises' accounts. Moreover, the share of 'pure' barterhas been growing over the past three years.
6. More than 60% of barter products are used by enterprises for productionpurposes, and around 14% for secondary barter.
Dow
nloa
ded
by [
Flor
ida
Stat
e U
nive
rsity
] at
00:
46 1
3 N
ovem
ber
2014
188 Sergei Aukutsionek
1. By the beginning of 1997 barter in Russian industry had reached a scale whichsubstantially reduces the effectiveness of traditional measures for stimulatingeffective demand.
Note
1. Sergei Aukutsionek, 'Barter in Russian Industry', Russian Economic Barometer, 3, 3,1994.
Dow
nloa
ded
by [
Flor
ida
Stat
e U
nive
rsity
] at
00:
46 1
3 N
ovem
ber
2014