induction baddi plant · set wet / parachute advansed hair gels & creams (india) ~ 52%* 1 livon...
TRANSCRIPT
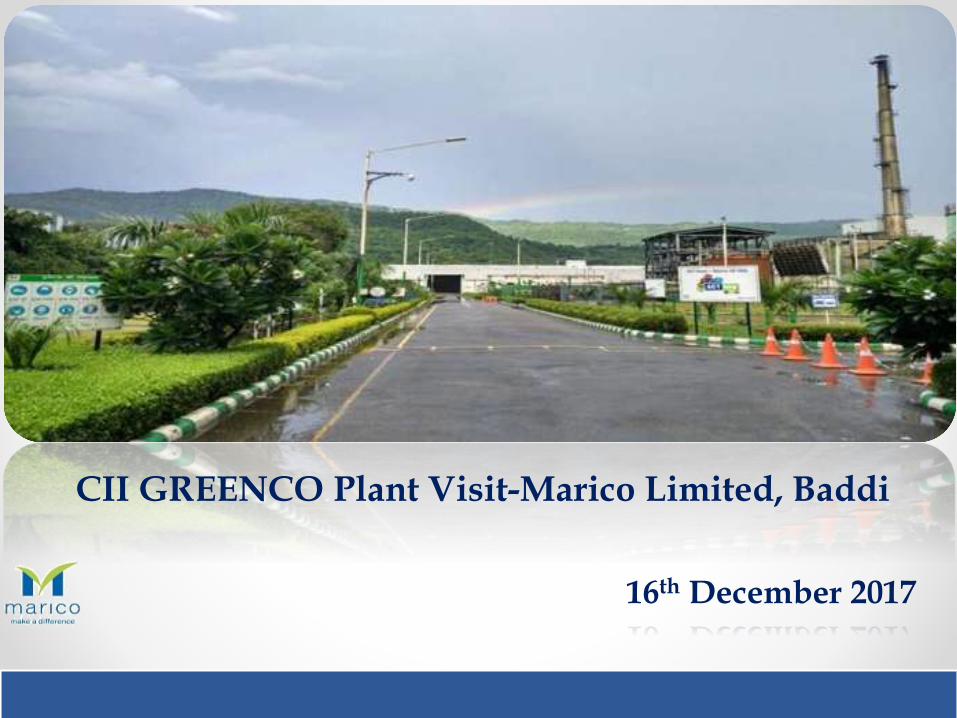
16th December 2017
CII GREENCO Plant Visit-Marico Limited, Baddi
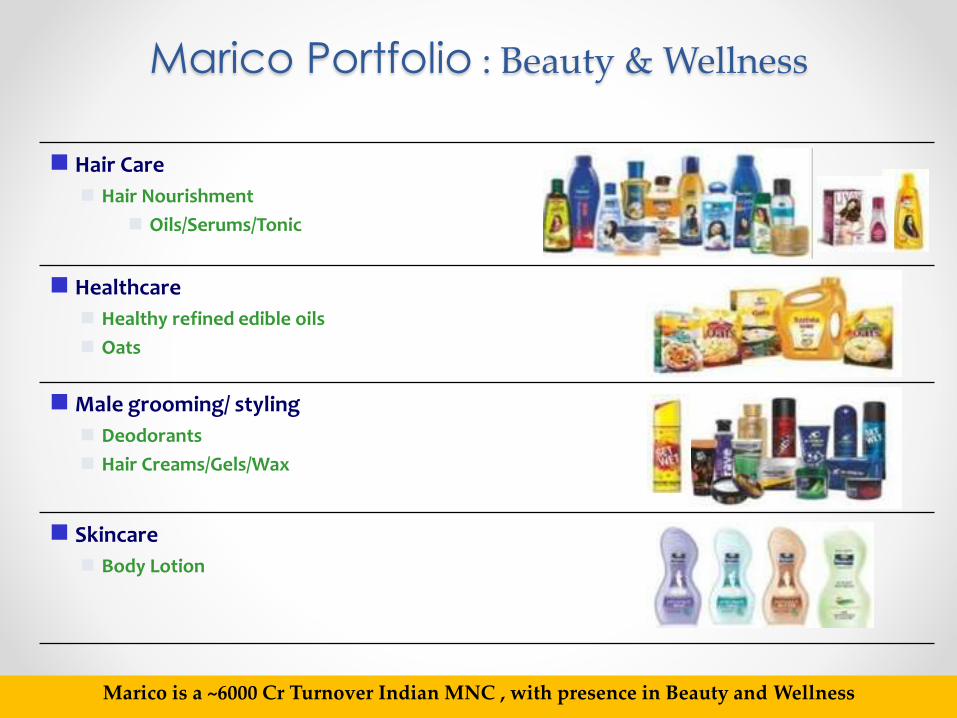
Marico Portfolio : Beauty & Wellness
Hair Care
Hair Nourishment
Oils/Serums/Tonic
Healthcare
Healthy refined edible oils
Oats
Male grooming/ styling
Deodorants
Hair Creams/Gels/Wax
Skincare
Body Lotion
Marico is a ~6000 Cr Turnover Indian MNC , with presence in Beauty and Wellness
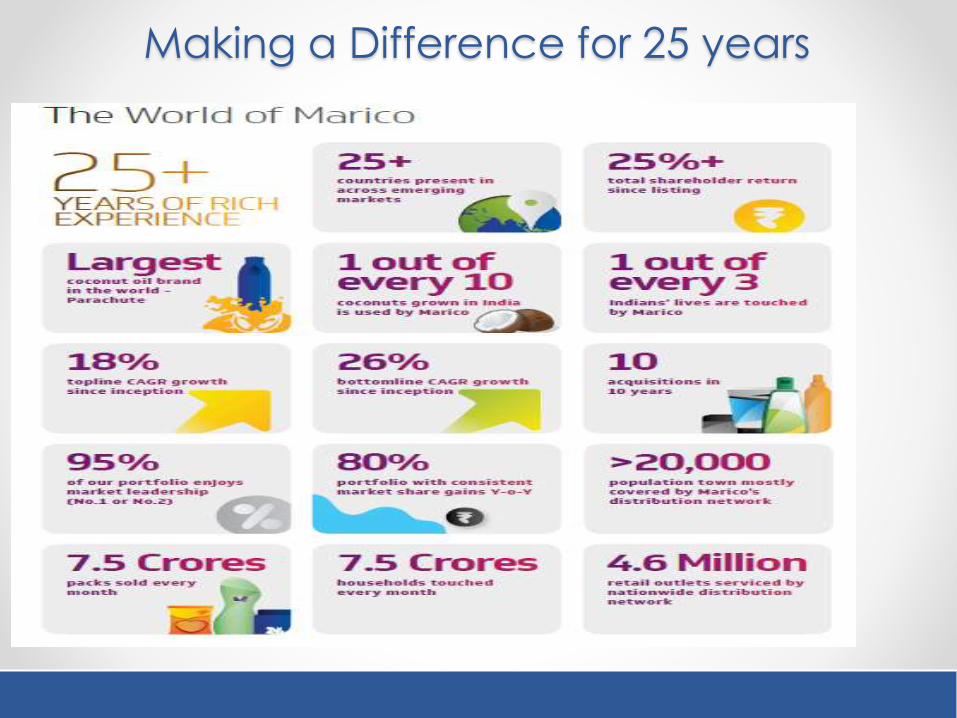
Making a Difference for 25 years

Market Leadership: Key to Category Choice
Brand Category Indicative Market Share (%) # Rank
Parachute/Nihar Coconut Oil (India) ~ 57% 1
Parachute Coconut Oil (Bangladesh) ~ 82% 1
SaffolaSuper Premium Refined Edible Oils
(India)~ 60% 1
Saffola Oats (India) ~ 25%* 2
Parachute Advanced, Nihar Naturals, Hair & Care
Hair Oils (India) ~ 30% 1
X-Men Male Shampoo (Vietnam) ~ 38%* 1
Fiancée / Hair Code Hair Styling (Egypt) ~ 58%* 1
Set Wet / Parachute Advansed Hair Gels & Creams (India) ~ 52%* 1
Livon / Silk & Shine Post Wash Hair Serum (India) ~79% 1
Parachute Advansed Body Lotion Body Lotion (India) 6% 5
Marico brands have a no 1 position in their respective segments over around 90% of its turnover

Master Brands : Saffola & Parachute
SAFFOLA PARACHUTE

Purpose of Life is to have a life of Purpose
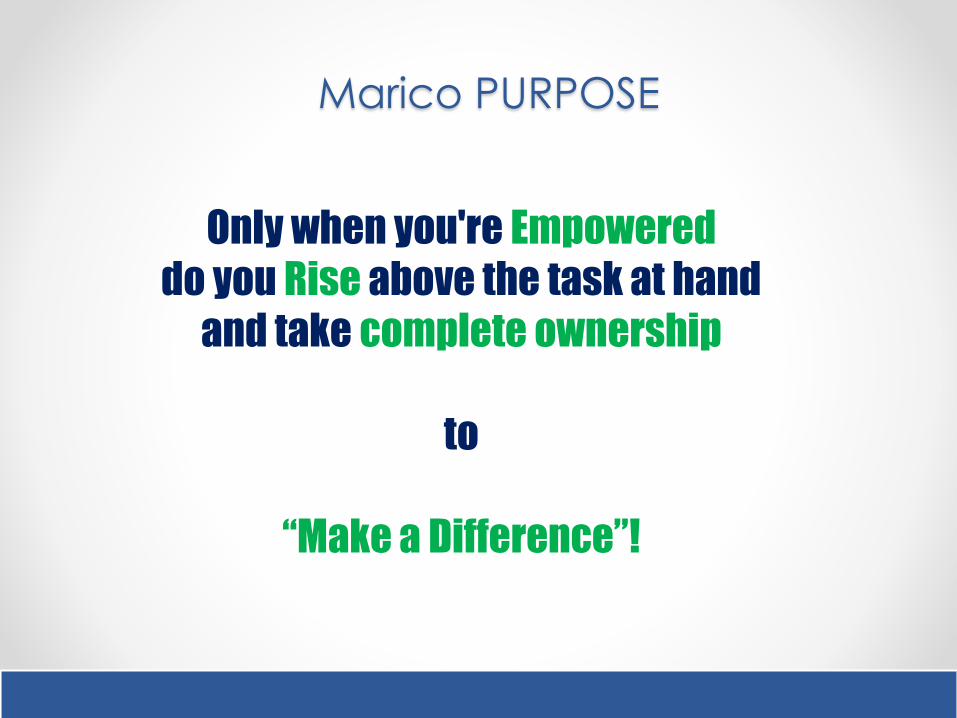
Only when you're Empowered
do you Rise above the task at hand
and take complete ownership
to
“Make a Difference”!
Marico PURPOSE

Responsible Corporate Citizen
- Marico- Make a Difference Philosophy
- Not only Shareholder Value but also
benefit all Stakeholders
- Marico Innovation Foundation
- Brands with Purpose
- Saffola and Shanti
Marico Innovation Foundation
Marico committed to Sustainability: “Shareholder Value” and “Sustainability” go hand in hand
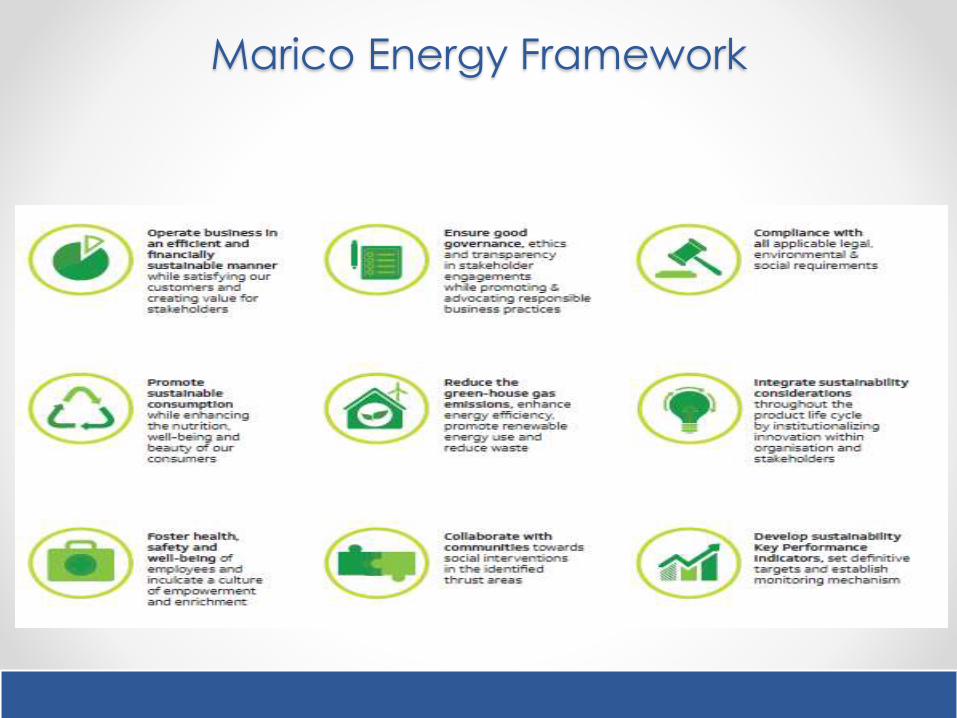
Marico Energy Framework
3 Pivots of Sustainability
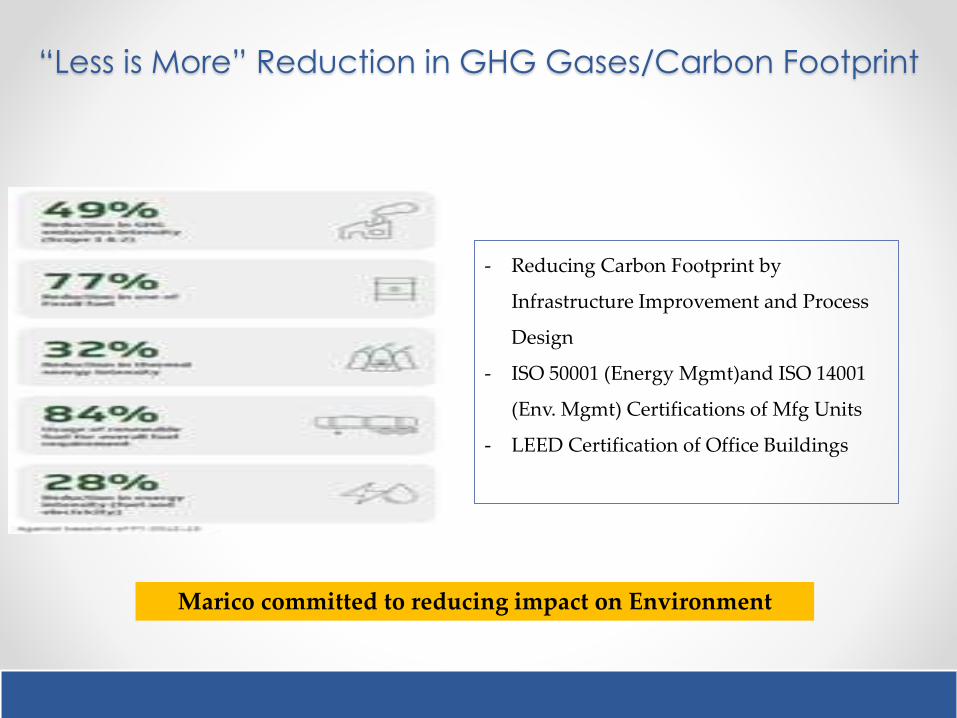
“Less is More” Reduction in GHG Gases/Carbon Footprint
- Reducing Carbon Footprint by
Infrastructure Improvement and Process
Design
- ISO 50001 (Energy Mgmt)and ISO 14001
(Env. Mgmt) Certifications of Mfg Units
- LEED Certification of Office Buildings
Marico committed to reducing impact on Environment
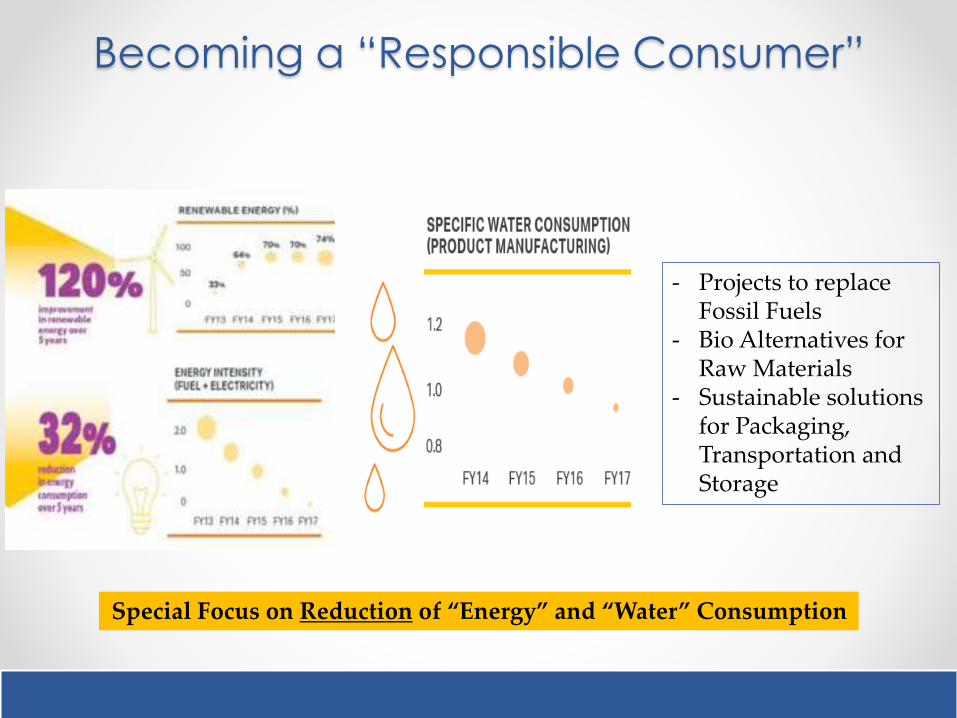
Becoming a “Responsible Consumer”
Special Focus on Reduction of “Energy” and “Water” Consumption
- Projects to replace Fossil Fuels
- Bio Alternatives for Raw Materials
- Sustainable solutions for Packaging, Transportation and Storage
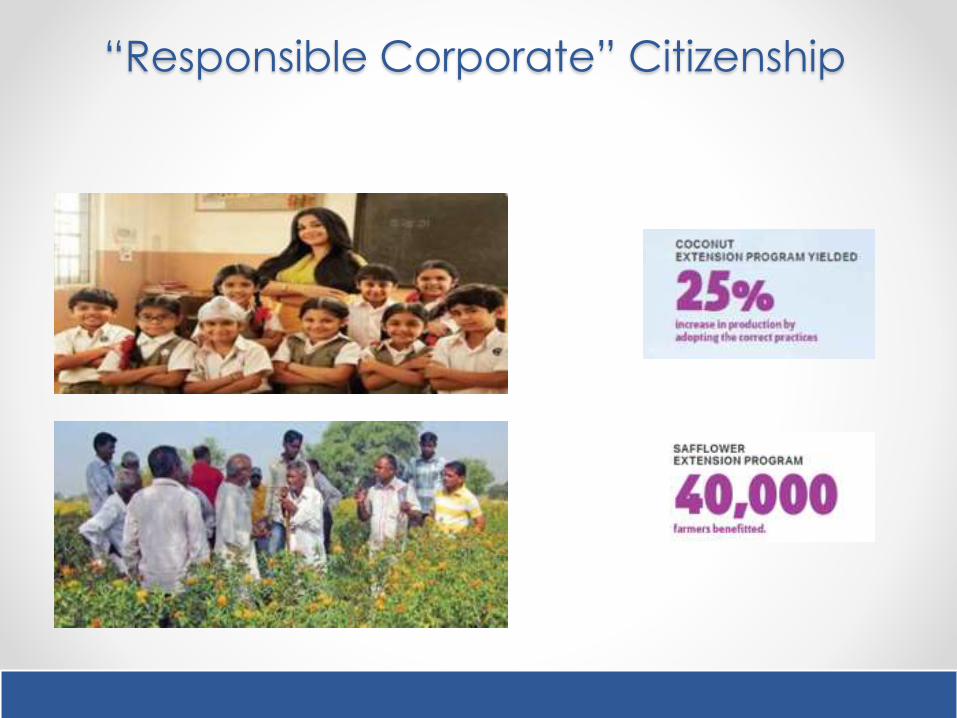
“Responsible Corporate” Citizenship
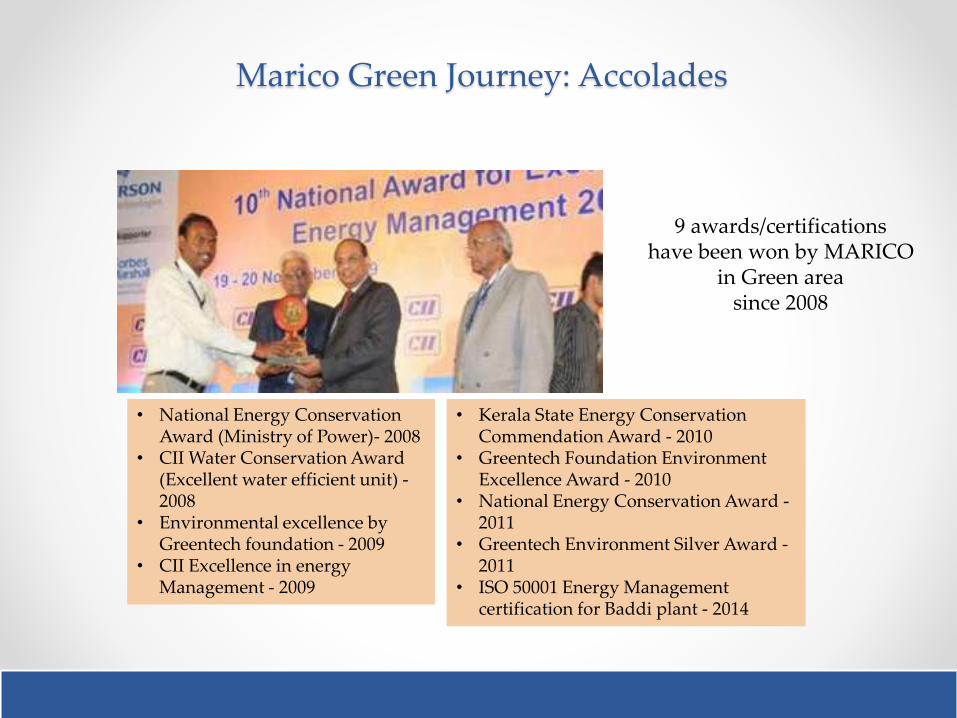
9 awards/certificationshave been won by MARICO
in Green areasince 2008
• National Energy Conservation Award (Ministry of Power)- 2008
• CII Water Conservation Award (Excellent water efficient unit) -2008
• Environmental excellence by Greentech foundation - 2009
• CII Excellence in energy Management - 2009
• Kerala State Energy Conservation Commendation Award - 2010
• Greentech Foundation Environment Excellence Award - 2010
• National Energy Conservation Award -2011
• Greentech Environment Silver Award -2011
• ISO 50001 Energy Management certification for Baddi plant - 2014
Marico Green Journey: Accolades
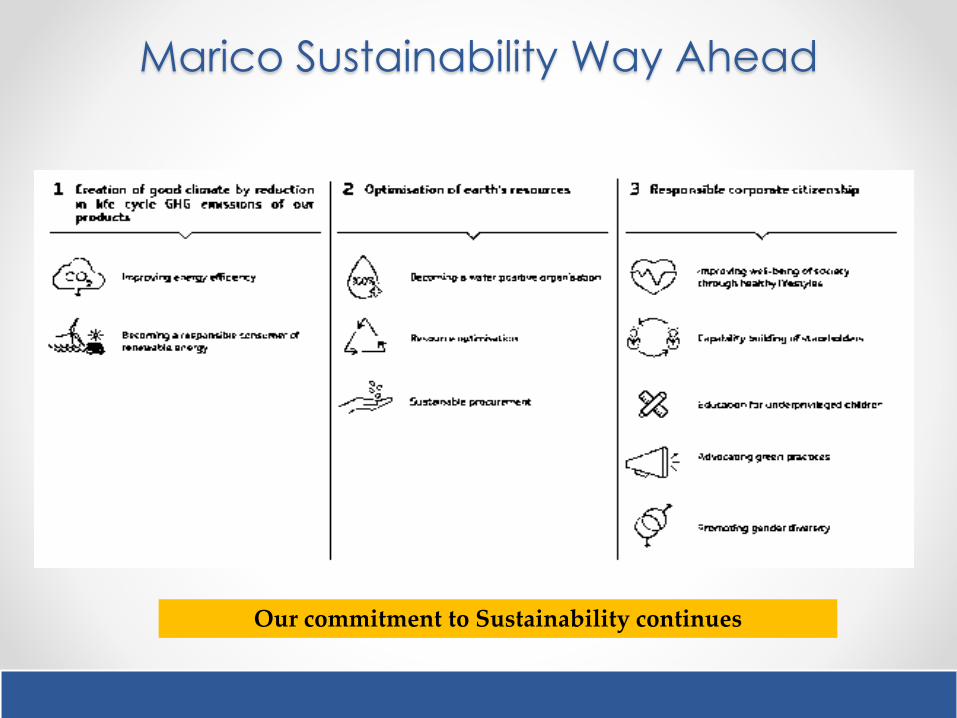
Marico Sustainability Way Ahead
Our commitment to Sustainability continues
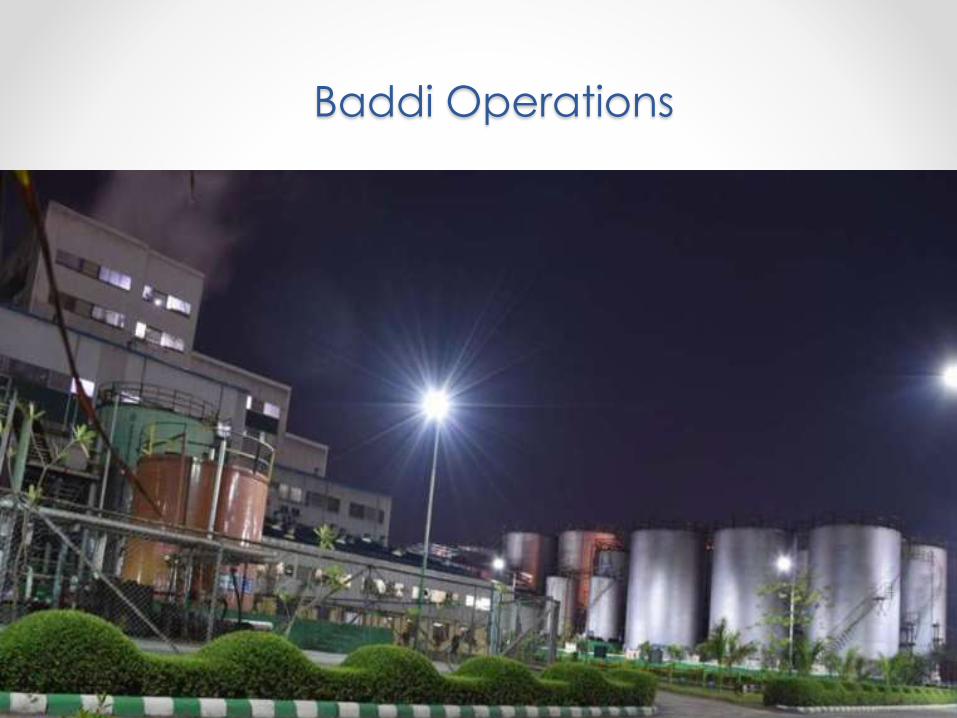
Baddi Operations
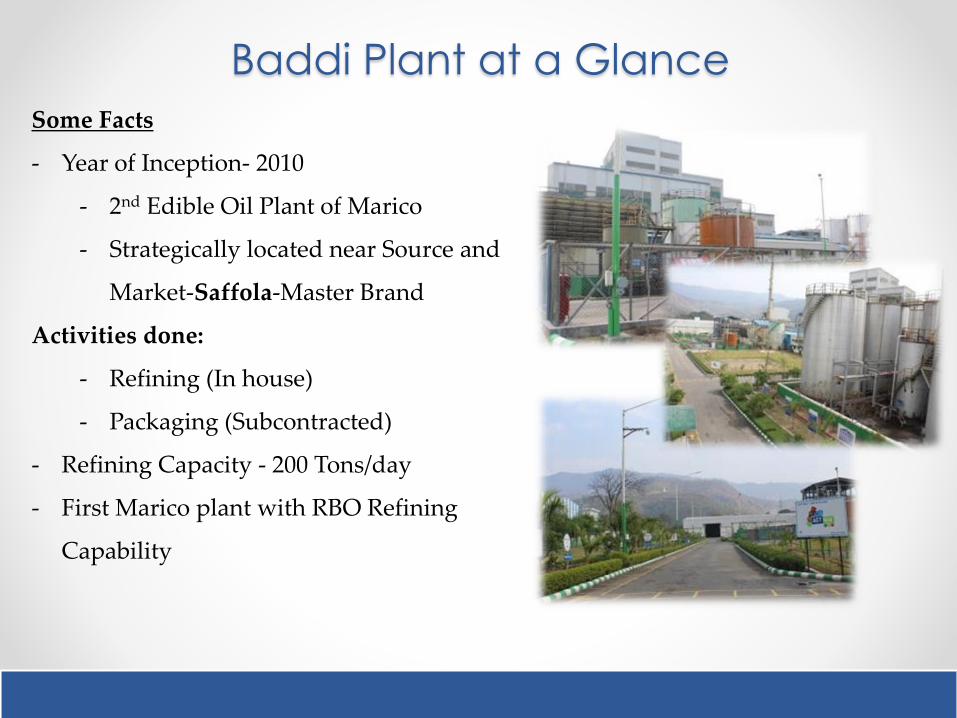
Baddi Plant at a Glance
Some Facts
- Year of Inception- 2010
- 2nd Edible Oil Plant of Marico
- Strategically located near Source and
Market-Saffola-Master Brand
Activities done:
- Refining (In house)
- Packaging (Subcontracted)
- Refining Capacity - 200 Tons/day
- First Marico plant with RBO Refining
Capability
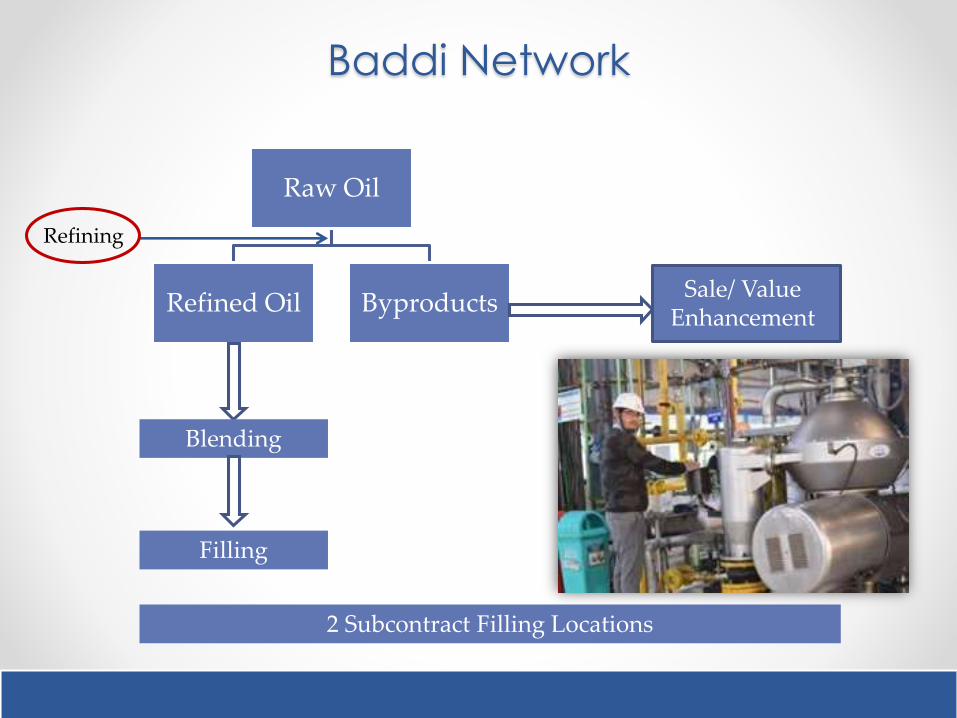
Baddi Network
Raw Oil
Refined Oil ByproductsSale/ Value
Enhancement
Blending
Refining
2 Subcontract Filling Locations
Filling

Rice Bran Oil Oleic Kardi Oil
Coconut OilOther Oils-Corn/Soya
Linoleic Kardi Oil
Oils Processing Capability
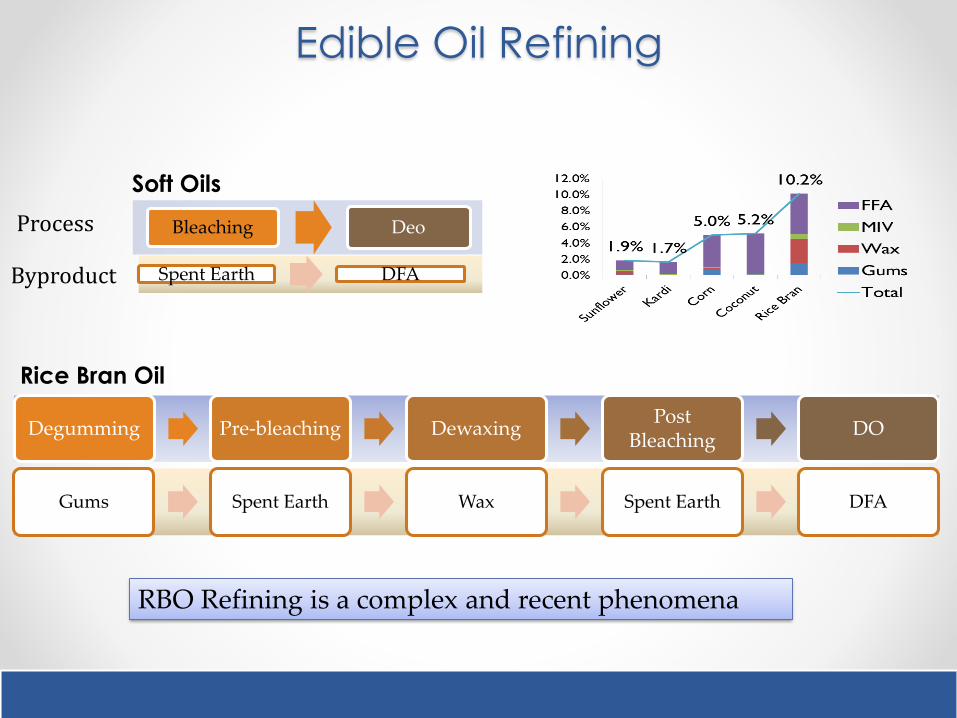
Edible Oil Refining
Degumming Pre-bleaching DewaxingPost
BleachingDO
RBO Refining is a complex and recent phenomena
Bleaching Deo
Soft Oils
Process
Spent Earth DFAByproduct
Gums Spent Earth Wax Spent Earth DFA
Rice Bran Oil
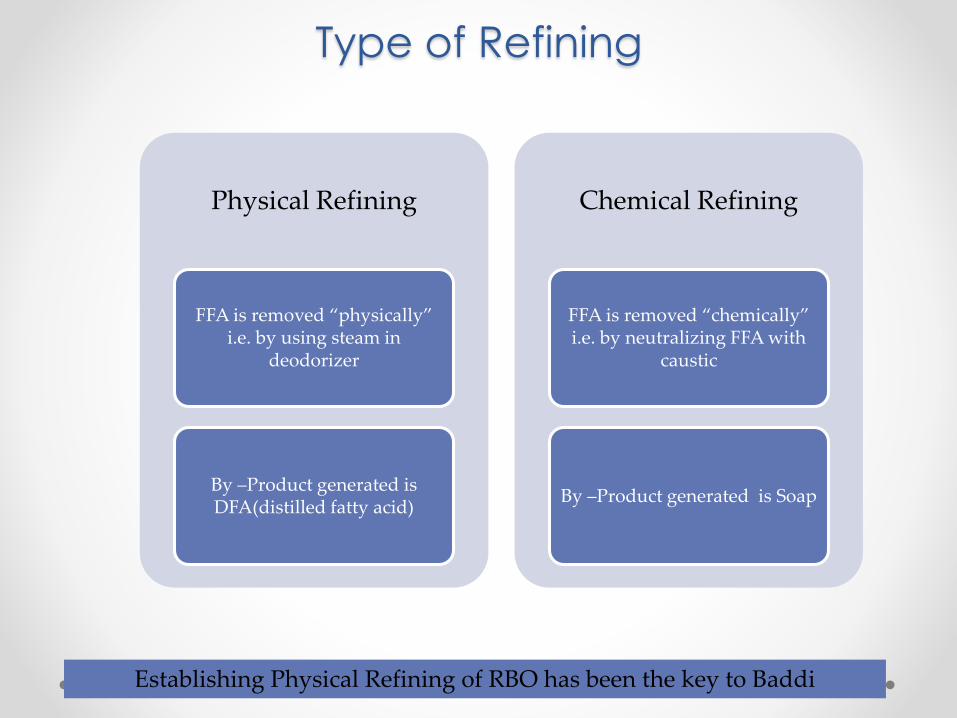
Type of Refining
Physical Refining
FFA is removed “physically” i.e. by using steam in
deodorizer
By –Product generated is DFA(distilled fatty acid)
Chemical Refining
FFA is removed “chemically” i.e. by neutralizing FFA with
caustic
By –Product generated is Soap
Establishing Physical Refining of RBO has been the key to Baddi
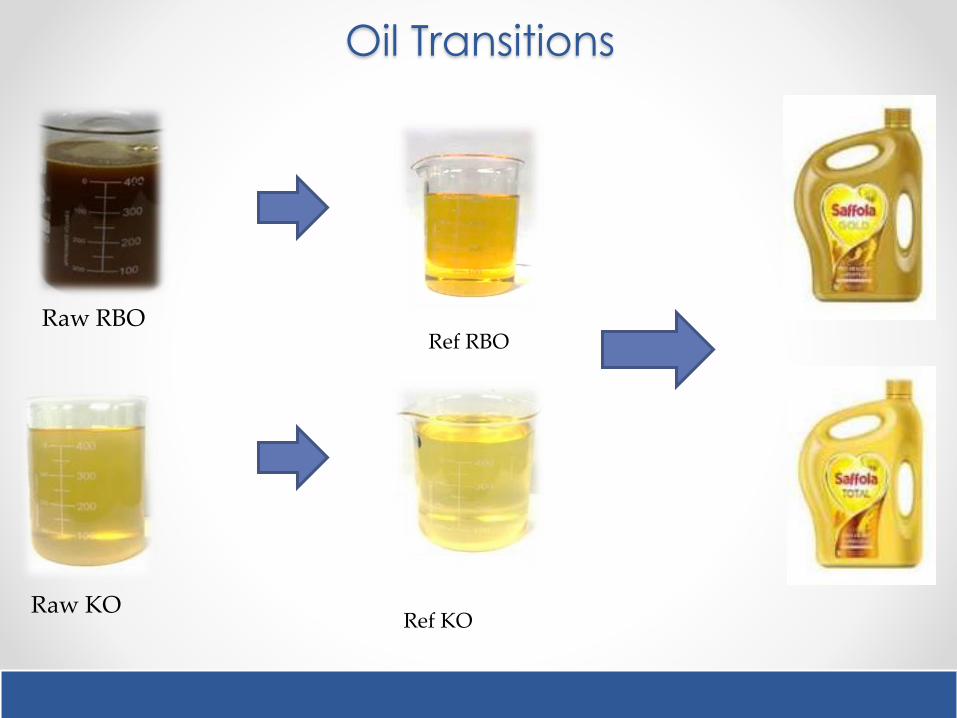
Oil Transitions
Raw RBO
Raw KO
Ref RBO
Ref KO
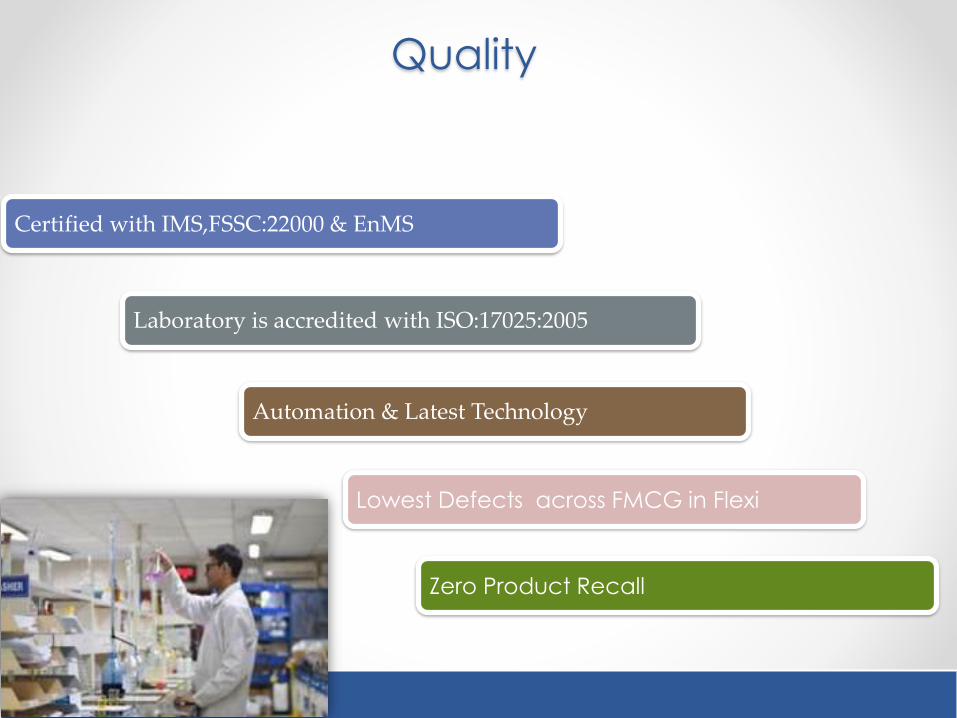
Quality
Laboratory is accredited with ISO:17025:2005
Automation & Latest Technology
Certified with IMS,FSSC:22000 & EnMS
Zero Product Recall
Lowest Defects across FMCG in Flexi
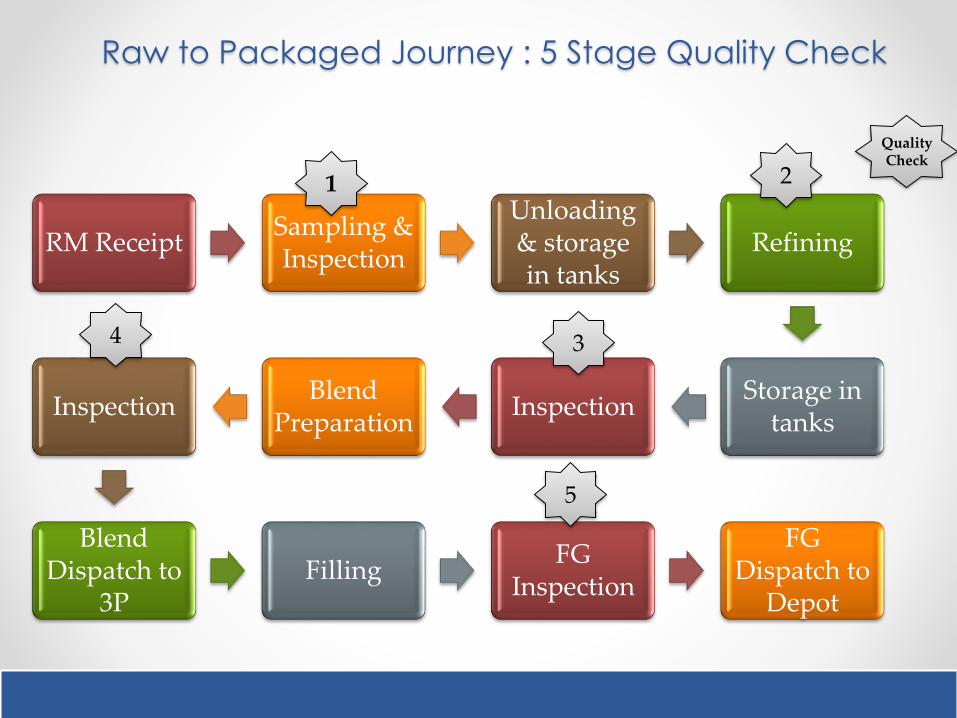
RM ReceiptSampling & Inspection
Unloading & storage in tanks
Refining
Storage in tanks
InspectionBlend
PreparationInspection
Blend Dispatch to
3PFilling
FG Inspection
FG Dispatch to
Depot
Raw to Packaged Journey : 5 Stage Quality Check
1
34
5
2
Quality Check
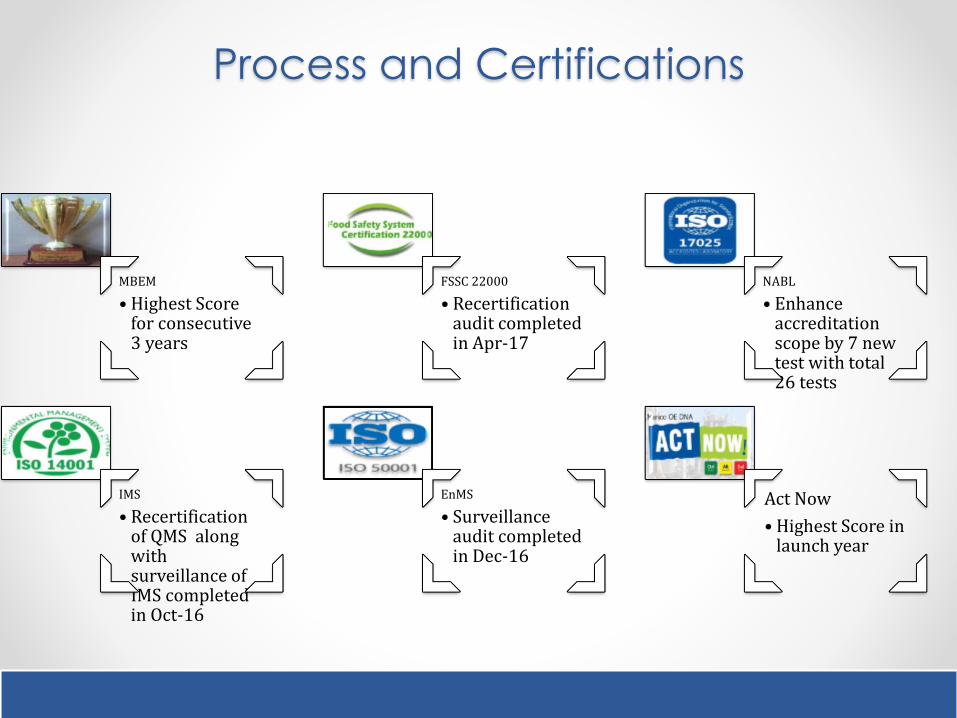
Process and Certifications
MBEM
• Highest Score for consecutive 3 years
FSSC 22000
• Recertification audit completed in Apr-17
NABL
• Enhance accreditation scope by 7 new test with total 26 tests
IMS
• Recertification of QMS along with surveillance of IMS completed in Oct-16
EnMS
• Surveillance audit completed in Dec-16
Act Now
• Highest Score in launch year

IT Mission: Leveraging IT & Analytics for problem solving
Utilizing SAP MII for Plant Production , Energy mgmt & Quality Mgmt
Extending Tableau for MVC, By Products Realization & Supply Chain
Utilizing SAP PM for equipment level cost & MTTR
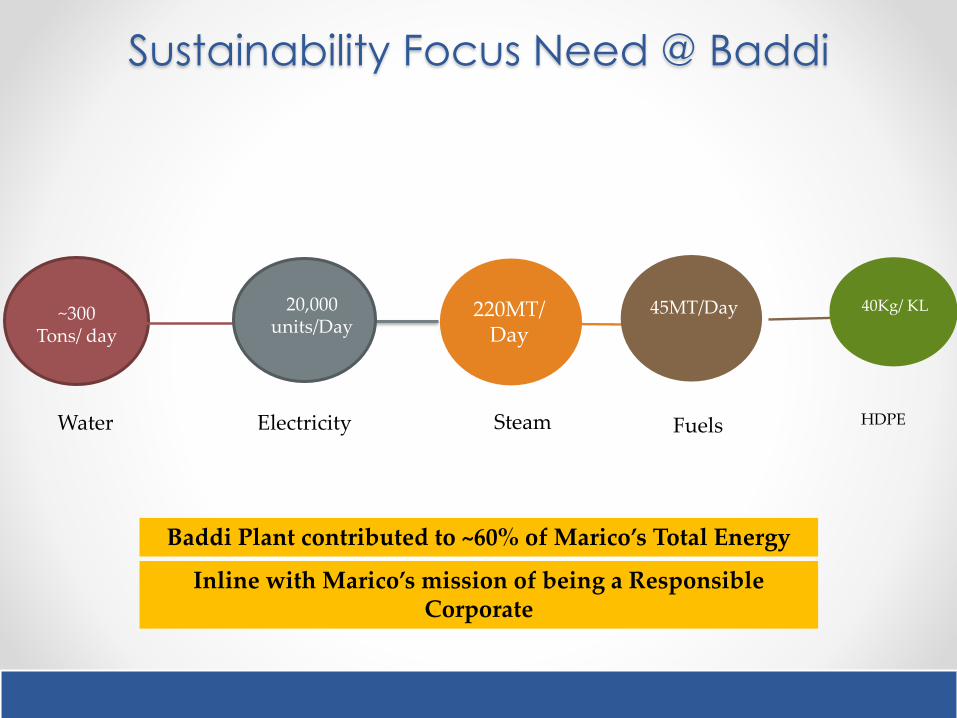
Baddi Plant contributed to ~60% of Marico’s Total Energy
Inline with Marico’s mission of being a Responsible Corporate
40Kg/ KL
HDPE
~300 Tons/ day
20,000 units/Day
220MT/Day
45MT/Day
Water Electricity Steam Fuels
Sustainability Focus Need @ Baddi
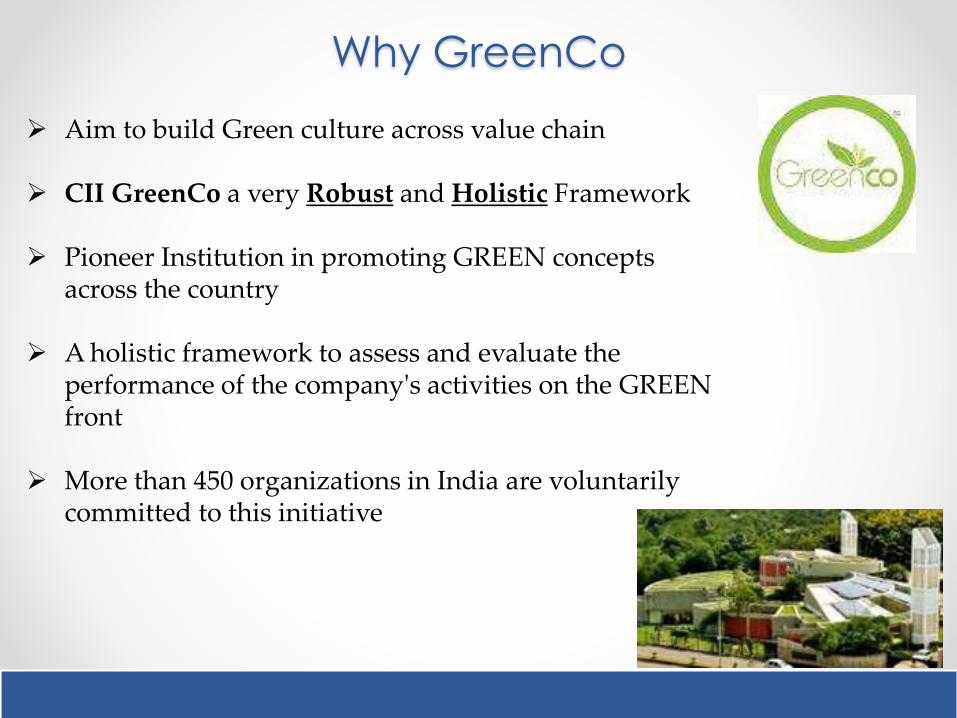
Why GreenCo
Aim to build Green culture across value chain
CII GreenCo a very Robust and Holistic Framework
Pioneer Institution in promoting GREEN concepts across the country
A holistic framework to assess and evaluate the performance of the company's activities on the GREEN front
More than 450 organizations in India are voluntarily committed to this initiative

GreenCo Structure-Holistic
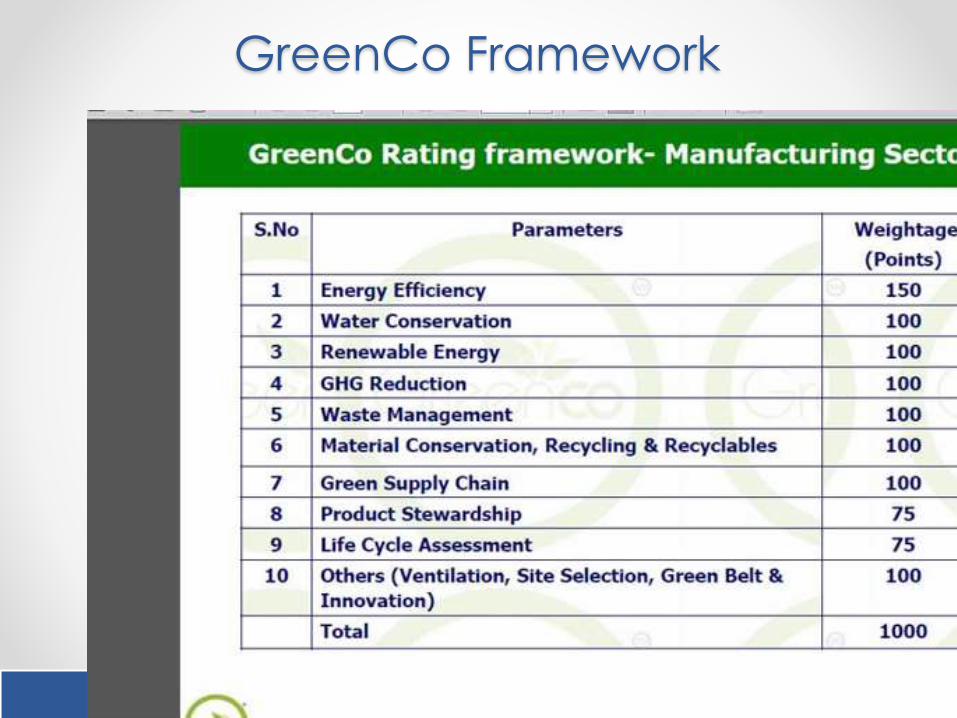
GreenCo Framework

Ob
ject
ive •Resource Conservation
•Sustainability
•Meeting Future Regulations
•Benchmarking
Key
Ch
alle
ng
es
•Awareness & Capability Building
•Stakeholder Alignment
•Integration with existing Systems
•Implementation of identified improvement projects
•Benchmarking
Greenco Rating preparation Launched in Apr’16
10 Teams were constituted-1 for each Pillar
GreenCo:Kick-Off @Marico Baddi

Capability Building
AWARENESS
CAMPAIGNING
CAPABILITY BUILDING
Training Programs Conducted :15 Total Training Manhours : 500
Greenco Awareness Session Conducted by Top Management
“Green Impact” Campaign started with different initiatives for Environment Protection
Training Progarms for Business Associates


Awareness Creation – Consumers
1. Product Quality
2. Health Benefits
3. Technical Details
Media Ads
1. Dawn to Dusk
2. Selected consumers (Marico product users)
3. Personalised visits to capture insights i.e. entire day to day mannerisms, preferences, usage patterns, food habits etc.
Consumer Connect
1. World Heart Day
2. Chhote Kadam…
3. Women Heath
4. Healthy life style score
Saffola Life
1.5 L Cholesterol Tests @700 cities
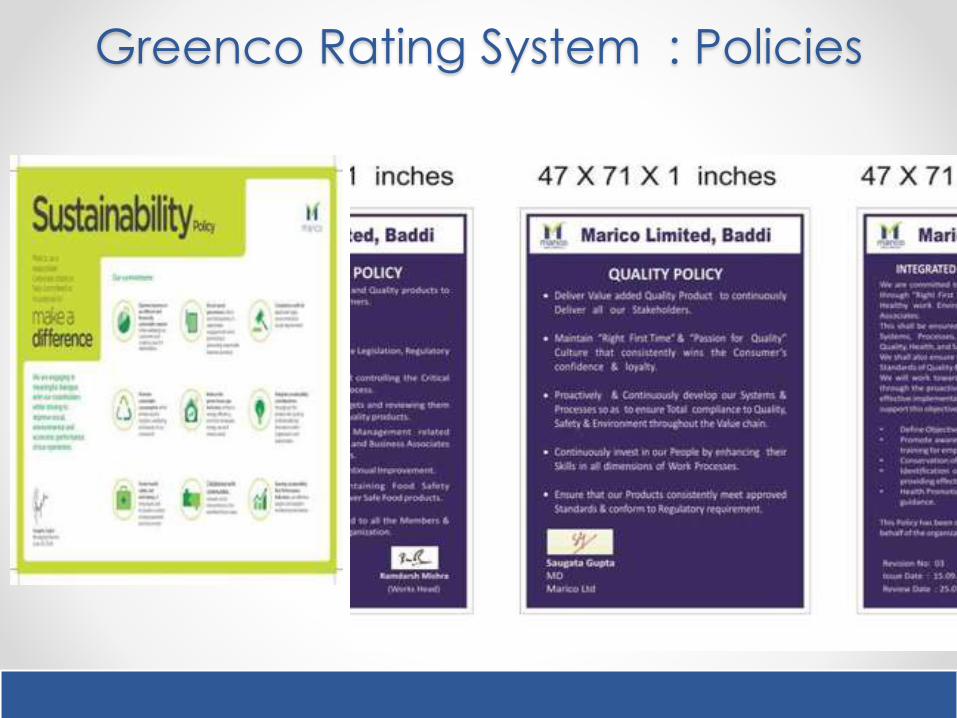
Greenco Rating System : Policies
GreenCo Pillars
1. Energy Efficiency
3.04
2.95
2.86
2.78
2.70
2.61
2.54
2.3
2.4
2.5
2.6
2.7
2.8
2.9
3
3.1
FY 13-14 FY 14-15 FY 15-16 FY 16-17 FY 17-18 FY 18-19 FY 19-20
(GJ/
MT
)
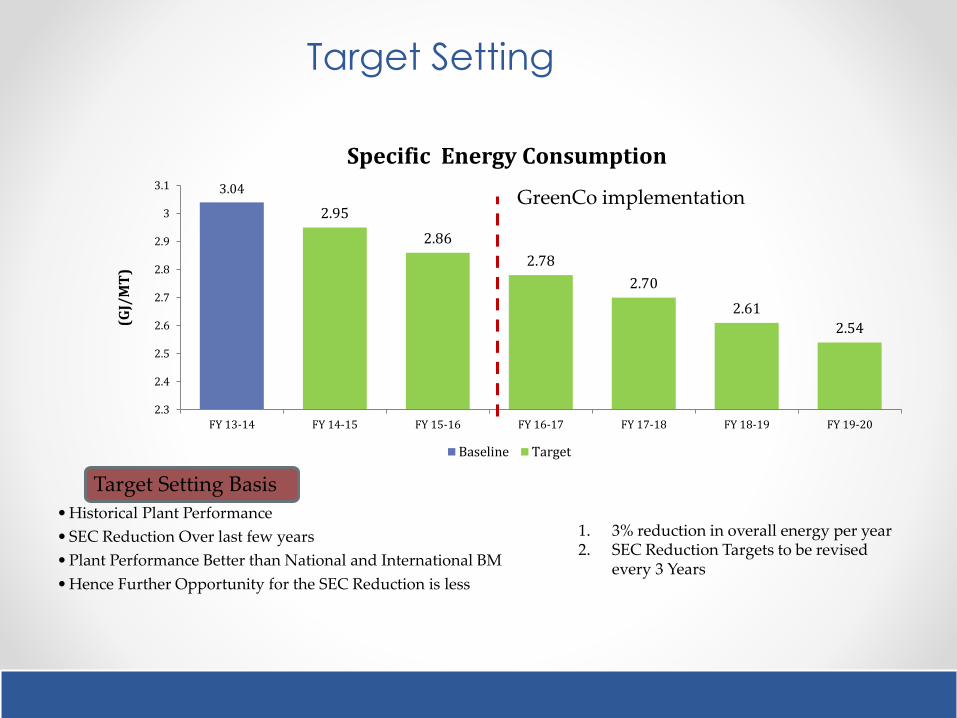
Specific Energy Consumption
Baseline Target
GreenCo implementation
Target Setting Basis
• Historical Plant Performance
• SEC Reduction Over last few years
• Plant Performance Better than National and International BM
• Hence Further Opportunity for the SEC Reduction is less
Target Setting
1. 3% reduction in overall energy per year2. SEC Reduction Targets to be revised
every 3 Years

Energy Profile
29.45% of Purchased electricity is from Hydel plants & Renewal Sourceshttp://cea.nic.in/reports/others/thermal/tpece/cdm_co2/user_guide_ver10.pdf
Electrical energy : 1. Purchased electricity (Hydel plants)#2. Diesel generator
Thermal energy : 1. Boiler2. Thermic fluid heater
Renewable energy : 1. Husk (Boiler)
Non renewable energy : 1. Purchased electricity
2. Thermic fluid heater
3. Diesel generator
76.10
%
23.90
%
Renewal Non Renewal
13.11%
86.89%
Electrical Thermal
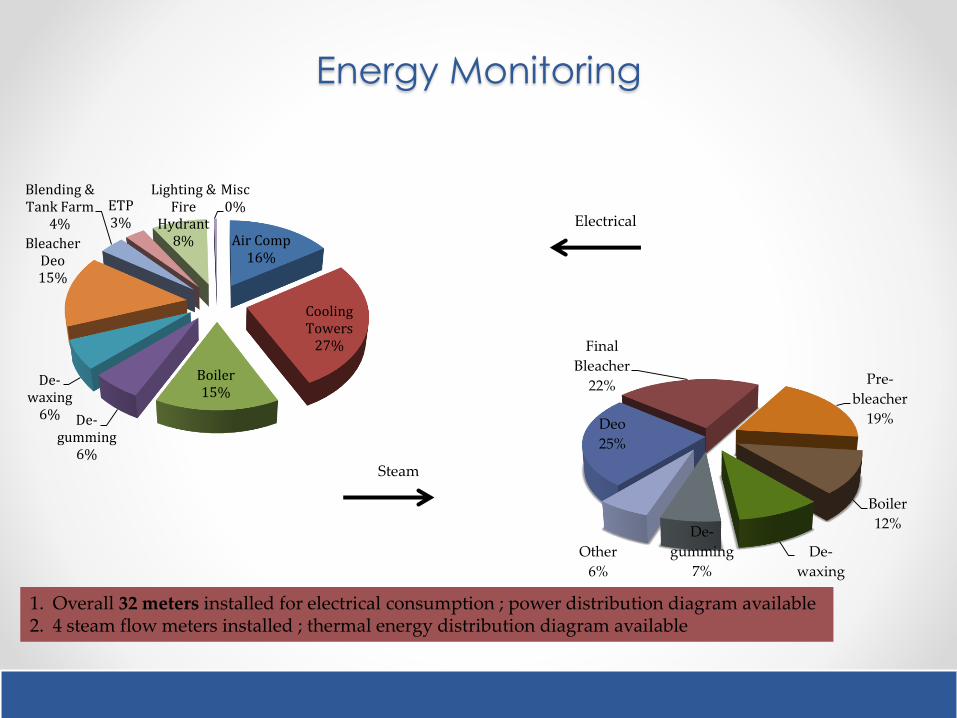
Energy Monitoring
Electrical
Steam
Deo
25%
Final
Bleacher
22% Pre-
bleacher
19%
Boiler
12%
De-
waxing
9%
De-
gumming
7%
Other
6%
Air Comp16%
Cooling Towers
27%
Boiler15%
De-gumming
6%
De-waxing
6%
Bleacher Deo 15%
Blending & Tank Farm
4%
ETP 3%
Lighting & Fire
Hydrant 8%
Misc0%
1. Overall 32 meters installed for electrical consumption ; power distribution diagram available2. 4 steam flow meters installed ; thermal energy distribution diagram available
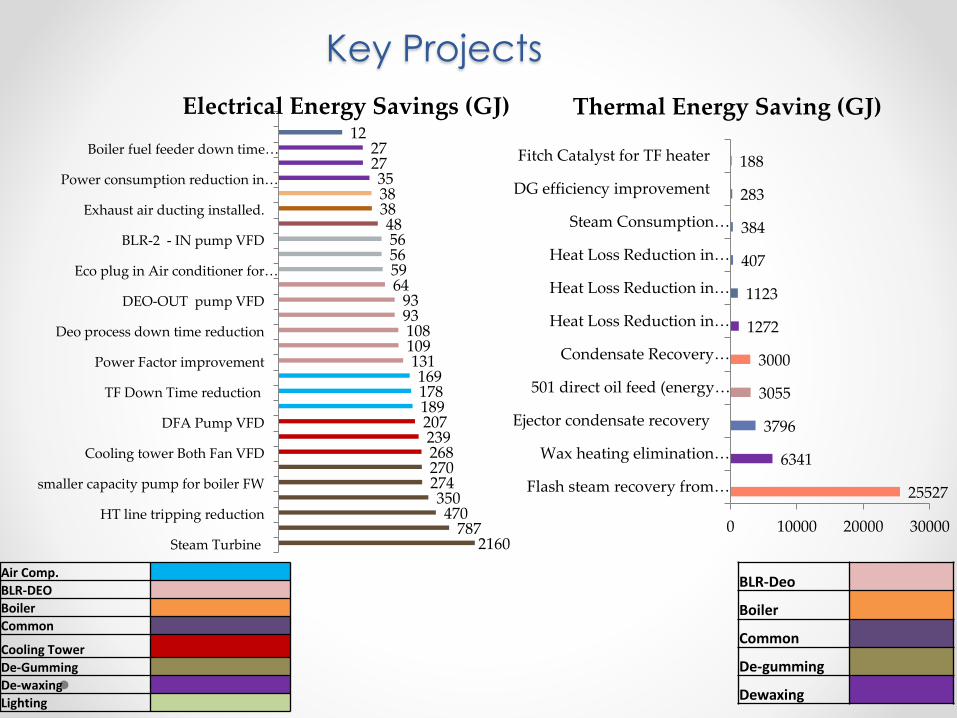
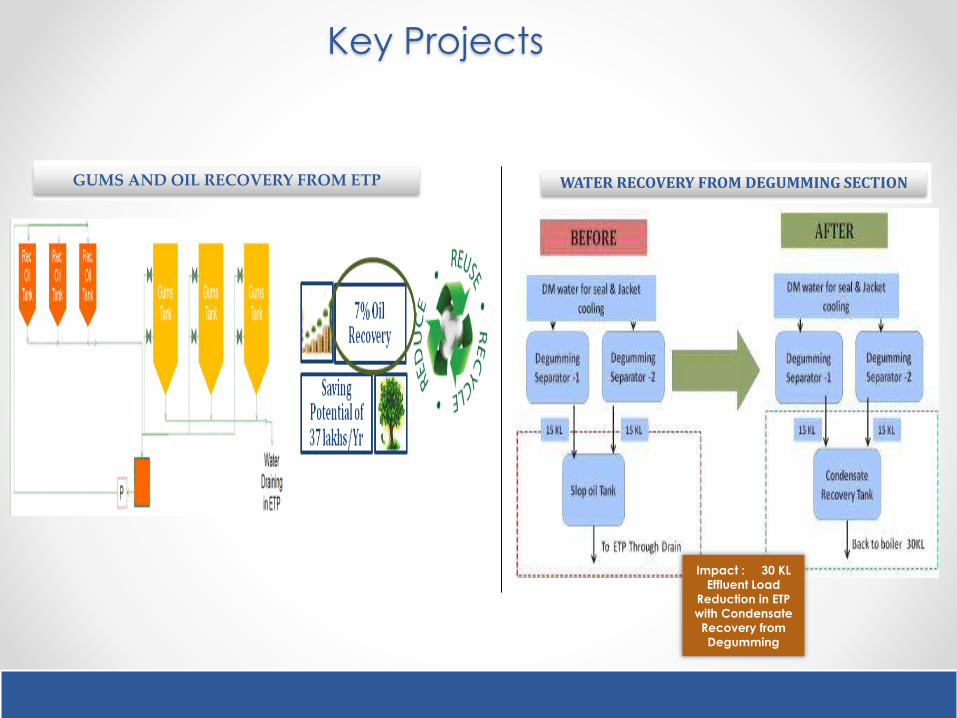
Key Projects
41
2160787
470350
274270268239207189178169
1311091089393
6459565648
383835
2727
12
Steam Turbine
HT line tripping reduction
smaller capacity pump for boiler FW
Cooling tower Both Fan VFD
DFA Pump VFD
TF Down Time reduction
Power Factor improvement
Deo process down time reduction
DEO-OUT pump VFD
Eco plug in Air conditioner for…
BLR-2 - IN pump VFD
Exhaust air ducting installed.
Power consumption reduction in…
Boiler fuel feeder down time…
Electrical Energy Savings (GJ)
25527
6341
3796
3055
3000
1272
1123
407
384
283
188
0 10000 20000 30000
Flash steam recovery from…
Wax heating elimination…
Ejector condensate recovery
501 direct oil feed (energy…
Condensate Recovery…
Heat Loss Reduction in…
Heat Loss Reduction in…
Heat Loss Reduction in…
Steam Consumption…
DG efficiency improvement
Fitch Catalyst for TF heater
Thermal Energy Saving (GJ)
Air Comp.
BLR-DEO
Boiler
Common
Cooling Tower
De-Gumming
De-waxing
Lighting
BLR-Deo
Boiler
Common
De-gumming
Dewaxing
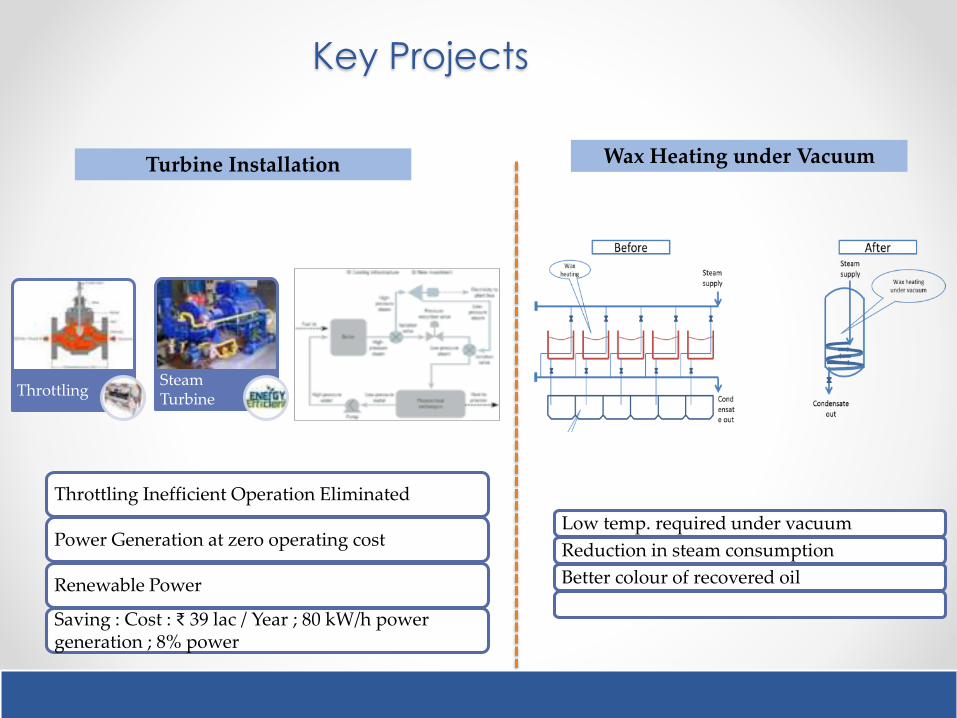
Key Projects
ThrottlingSteam Turbine
Throttling Inefficient Operation Eliminated
Power Generation at zero operating cost
Renewable Power
Saving : Cost : ₹ 39 lac / Year ; 80 kW/h power generation ; 8% power
Turbine Installation
Low temp. required under vacuum
Reduction in steam consumption
Better colour of recovered oil
Wax Heating under Vacuum
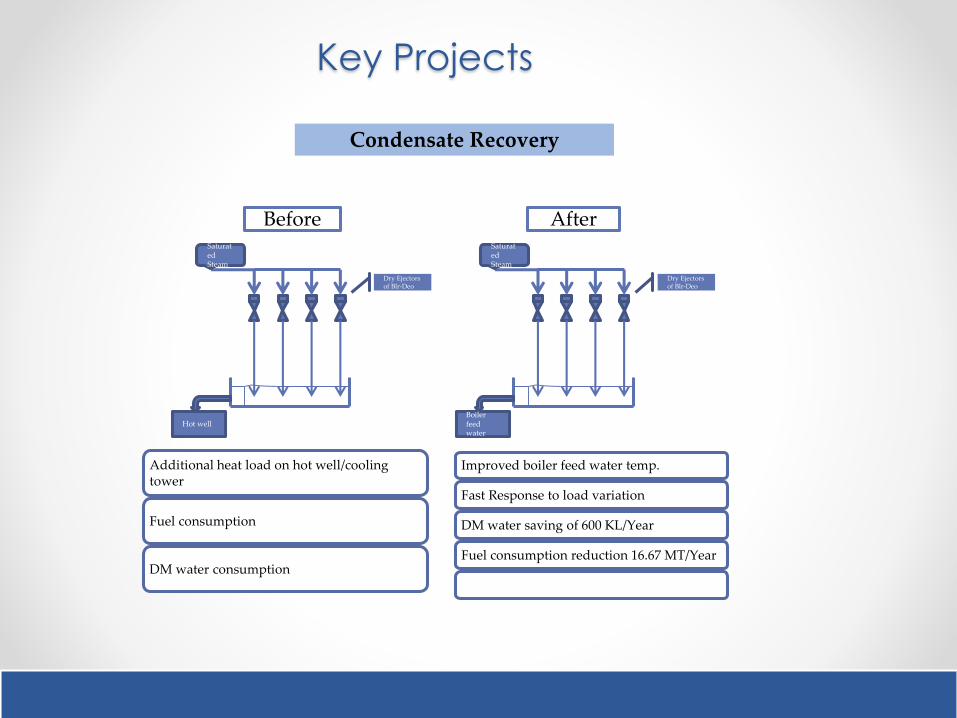
Key Projects
Saturated Steam
Hot well
Dry Ejectors of Blr-Deo
Saturated Steam
Boiler feed water
Dry Ejectors of Blr-Deo
Before After
Improved boiler feed water temp.
Fast Response to load variation
DM water saving of 600 KL/Year
Fuel consumption reduction 16.67 MT/Year
Additional heat load on hot well/cooling tower
Fuel consumption
DM water consumption
Condensate Recovery

Impact
3.04
2.85 2.82
2.382.27
0.17
0.17
0.17
3.04
2.95
2.862.78
2.7
2
2.1
2.2
2.3
2.4
2.5
2.6
2.7
2.8
2.9
3
3.1
FY 13-14 FY 14-15 FY 15-16 FY 16-17 FY 17-18
GJ
/ M
T
SEC considering intervention Intervention Target
New process added –Recovered oil reuse
19.7% Reduction
Recovered oil usage started with an innovation solution to identified problemsBenefit : 3.22 Cr.s FY 15-16; Impact 6% higher SEC due to additional processing till date
2. Water Conservation
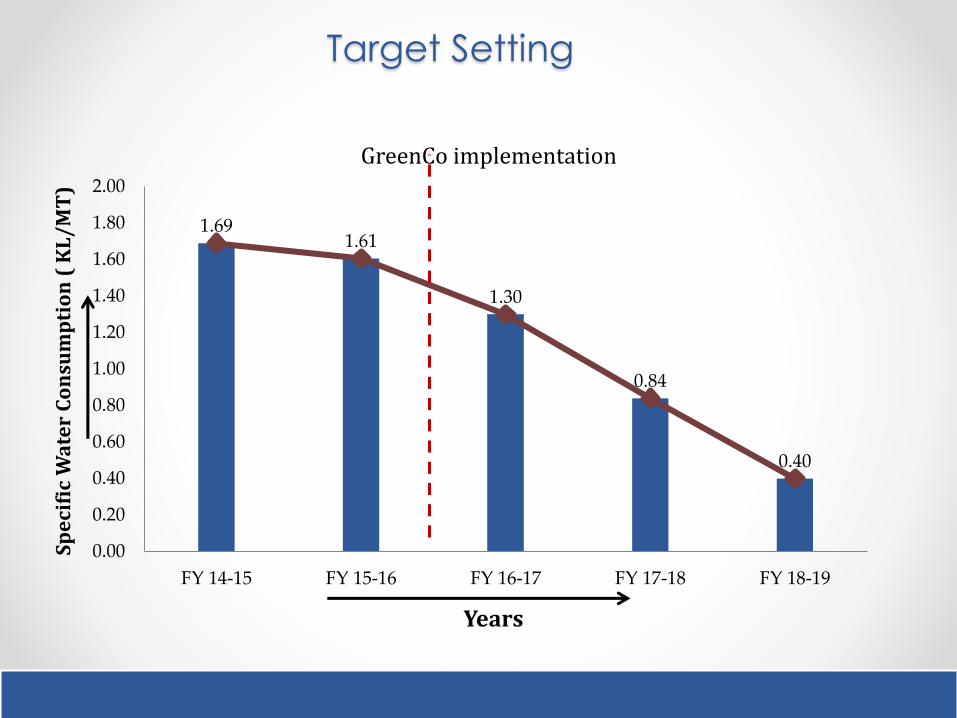
Target Setting
1.691.61
1.30
0.84
0.40
0.00
0.20
0.40
0.60
0.80
1.00
1.20
1.40
1.60
1.80
2.00
FY 14-15 FY 15-16 FY 16-17 FY 17-18 FY 18-19
Years
Sp
eci
fic
Wa
ter
Co
nsu
mp
tio
n (
KL
/M
T)
GreenCo implementation
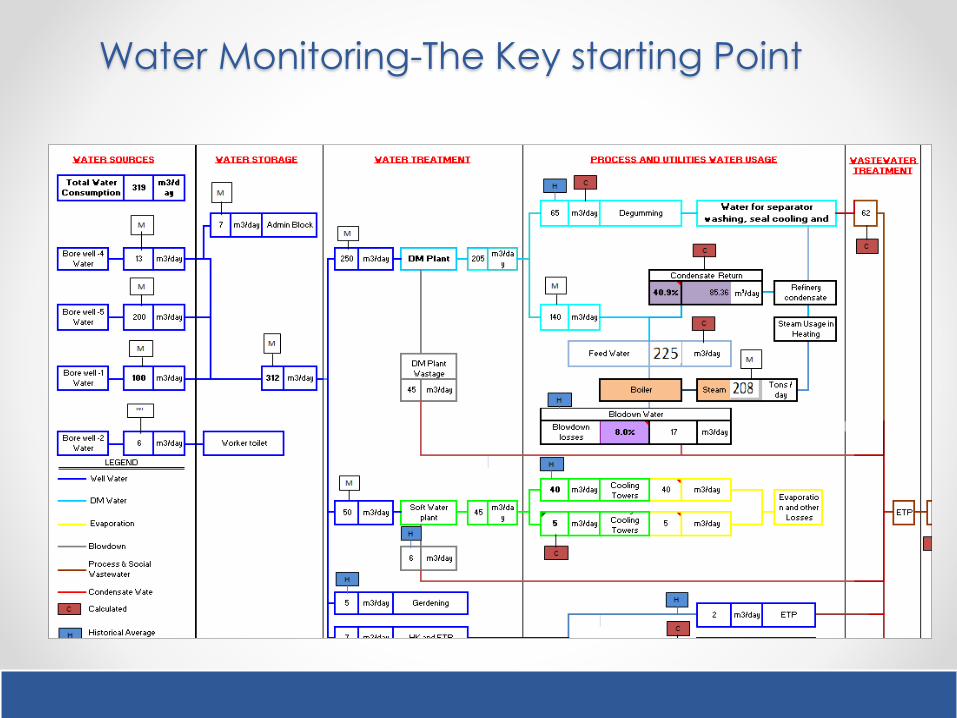
Water Monitoring-The Key starting Point
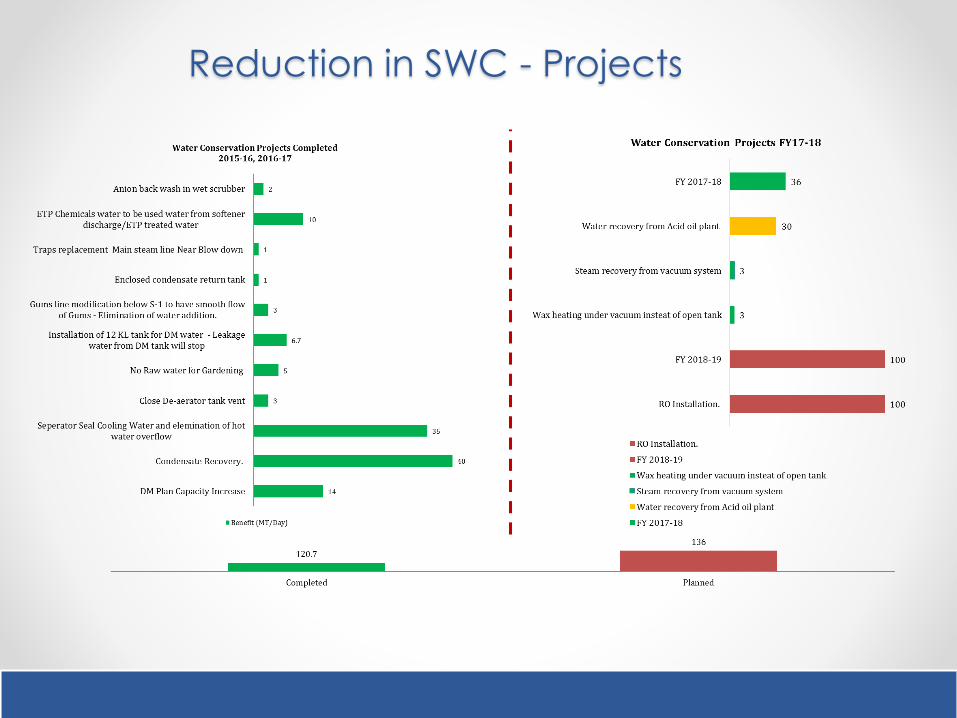
Reduction in SWC - Projects
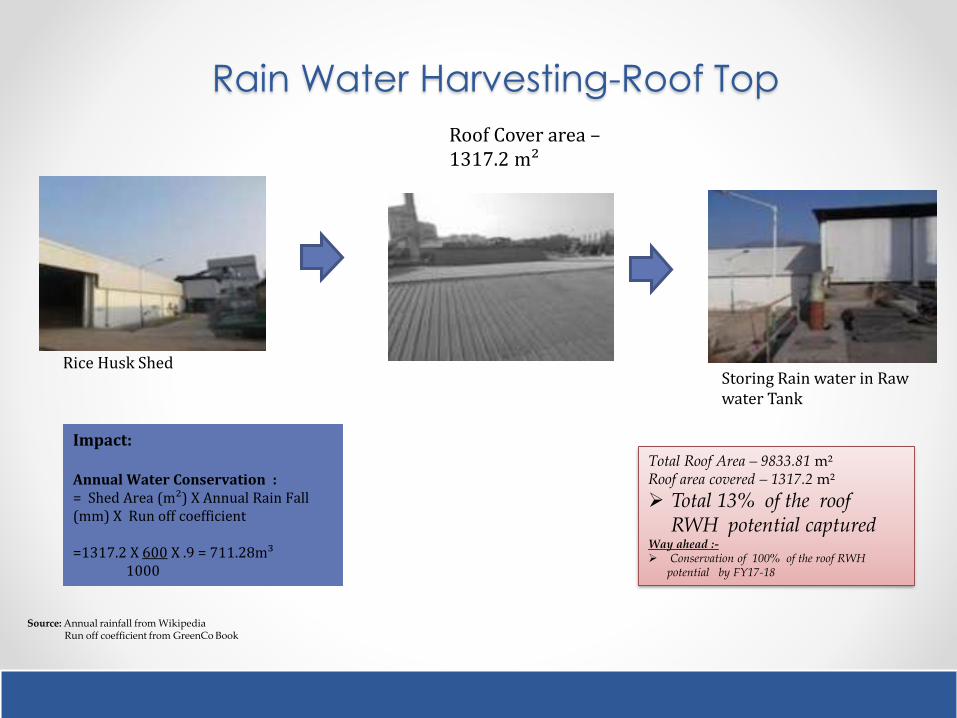
Rain Water Harvesting-Roof Top
Rice Husk Shed
Roof Cover area –1317.2 m²
Impact:
Annual Water Conservation := Shed Area (m²) X Annual Rain Fall (mm) X Run off coefficient
=1317.2 X 600 X .9 = 711.28m³1000
Storing Rain water in Raw water Tank
Source: Annual rainfall from WikipediaRun off coefficient from GreenCo Book
Total Roof Area – 9833.81 m²Roof area covered – 1317.2 m²
Total 13% of the roof RWH potential captured
Way ahead :- Conservation of 100% of the roof RWH
potential by FY17-18
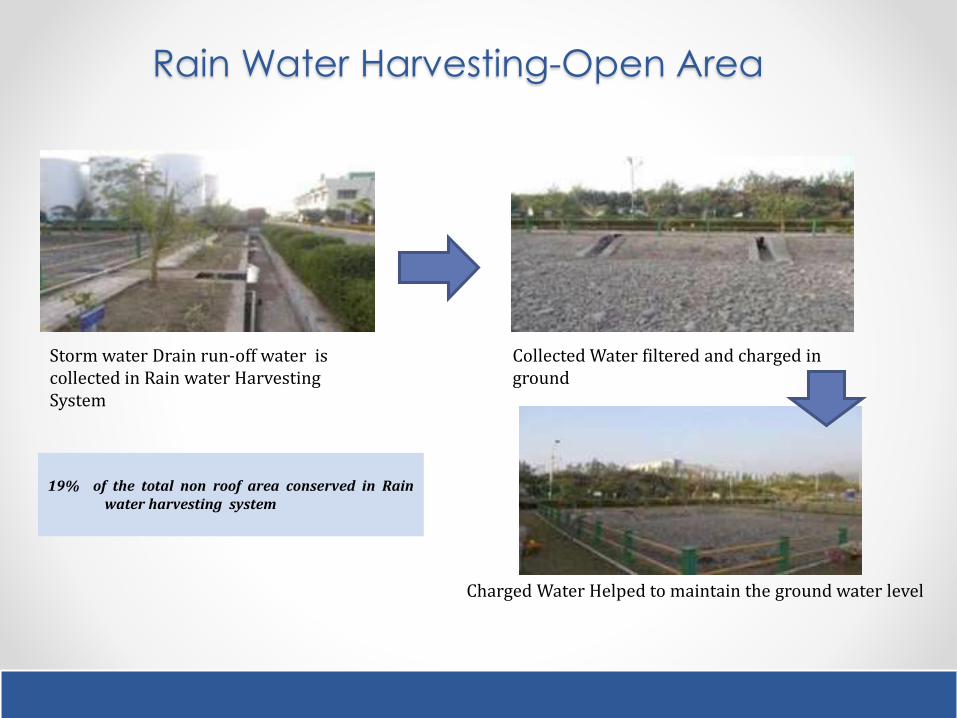
Rain Water Harvesting-Open Area
Collected Water filtered and charged in ground
Charged Water Helped to maintain the ground water level
Storm water Drain run-off water is collected in Rain water Harvesting System
19% of the total non roof area conserved in Rainwater harvesting system
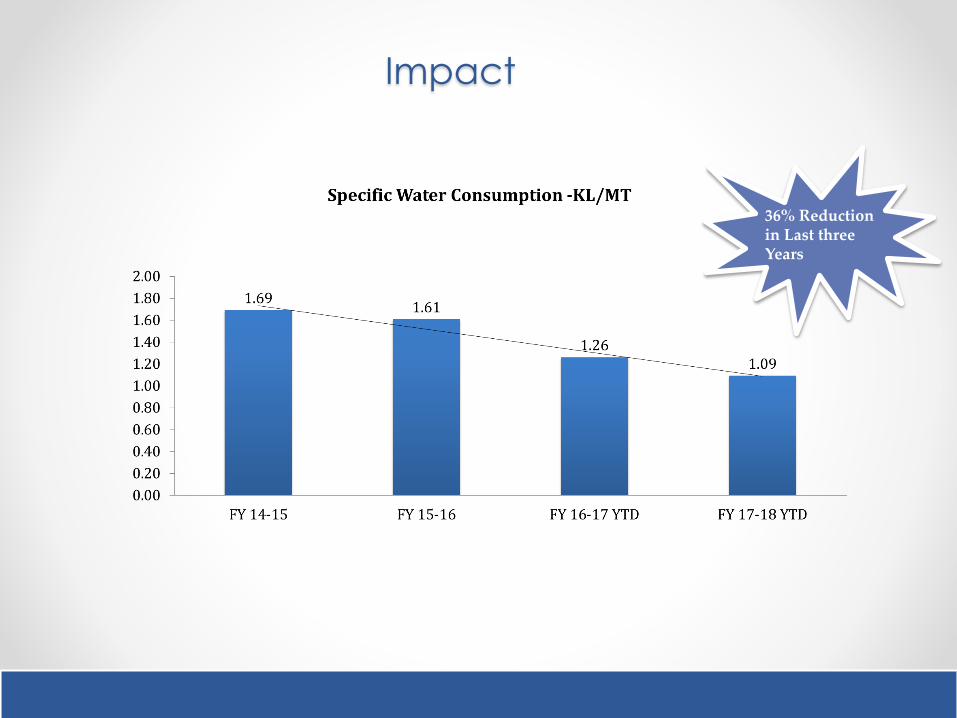
Impact
36% Reduction in Last three Years
3. Renewable Energy
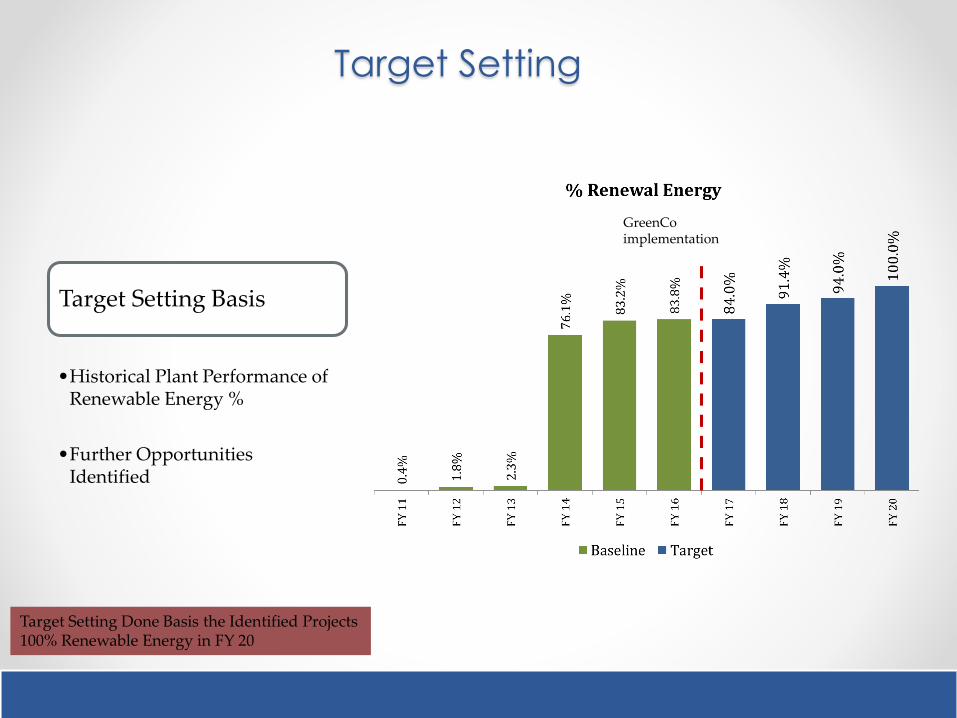
Target Setting
GreenCo implementation
Target Setting Basis
•Historical Plant Performance of Renewable Energy %
•Further Opportunities Identified
Target Setting Done Basis the Identified Projects100% Renewable Energy in FY 20
Key Projects
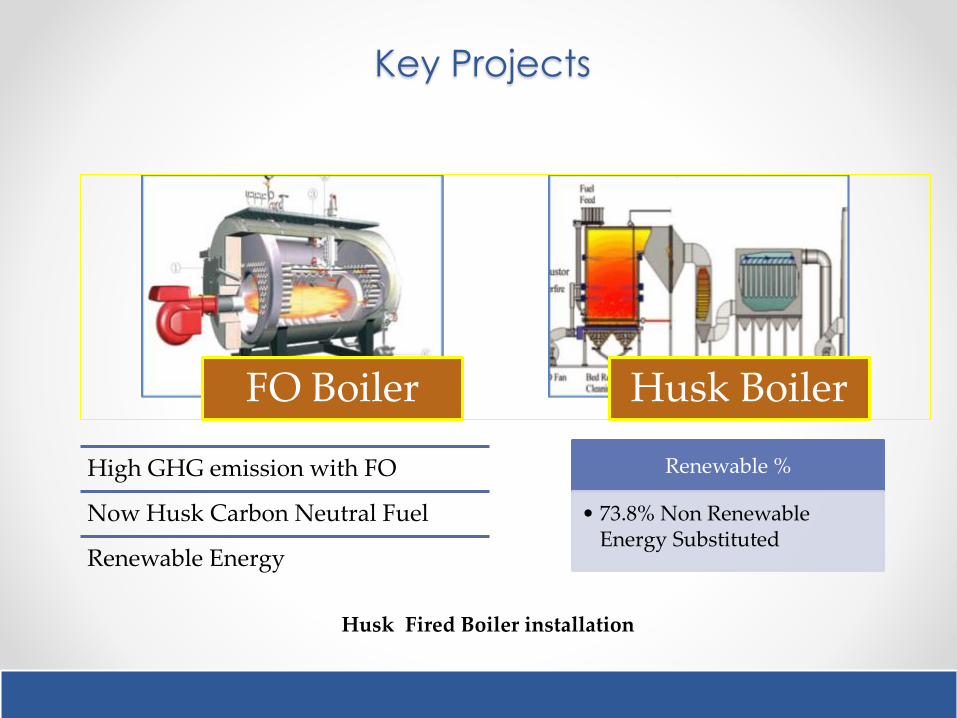
High GHG emission with FO
Now Husk Carbon Neutral Fuel
Renewable Energy
FO Boiler Husk Boiler
Renewable %
• 73.8% Non Renewable Energy Substituted
Husk Fired Boiler installation

Key Projects
Paddy Straw
Groundnut Briquette
Paddy Straw & Briquette
25% can be used
Alternate Fuel
Impact
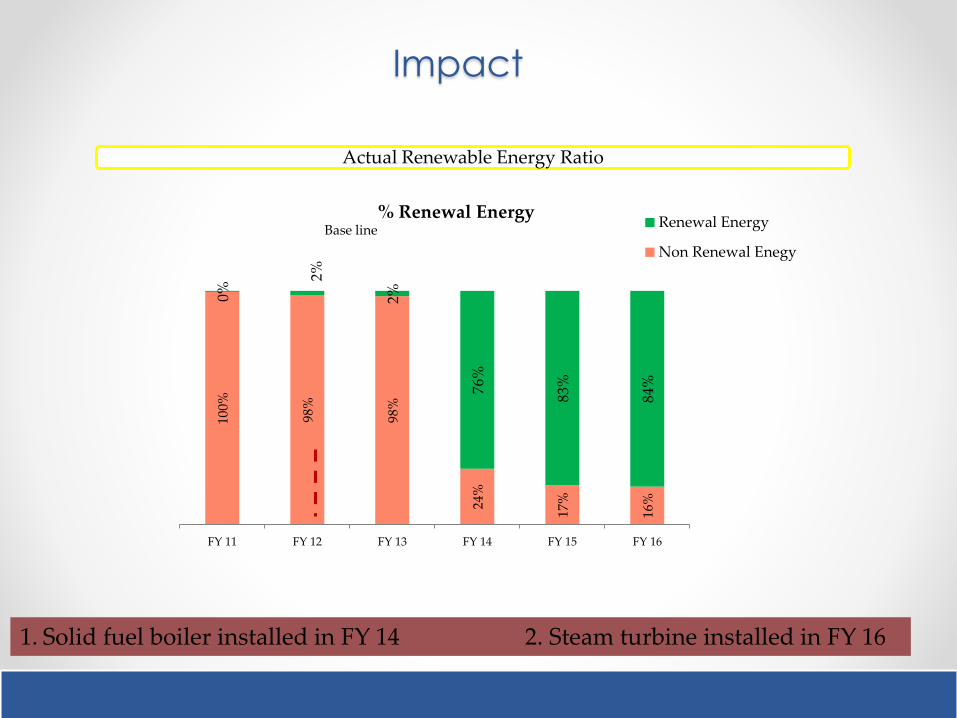
100%
98%
98%
24%
17%
16%
0%
2%
2%
76%
83%
84%
FY 11 FY 12 FY 13 FY 14 FY 15 FY 16
% Renewal EnergyRenewal Energy
Non Renewal Enegy
Base line
Actual Renewable Energy Ratio
1. Solid fuel boiler installed in FY 14 2. Steam turbine installed in FY 16

4. GHG Emissions
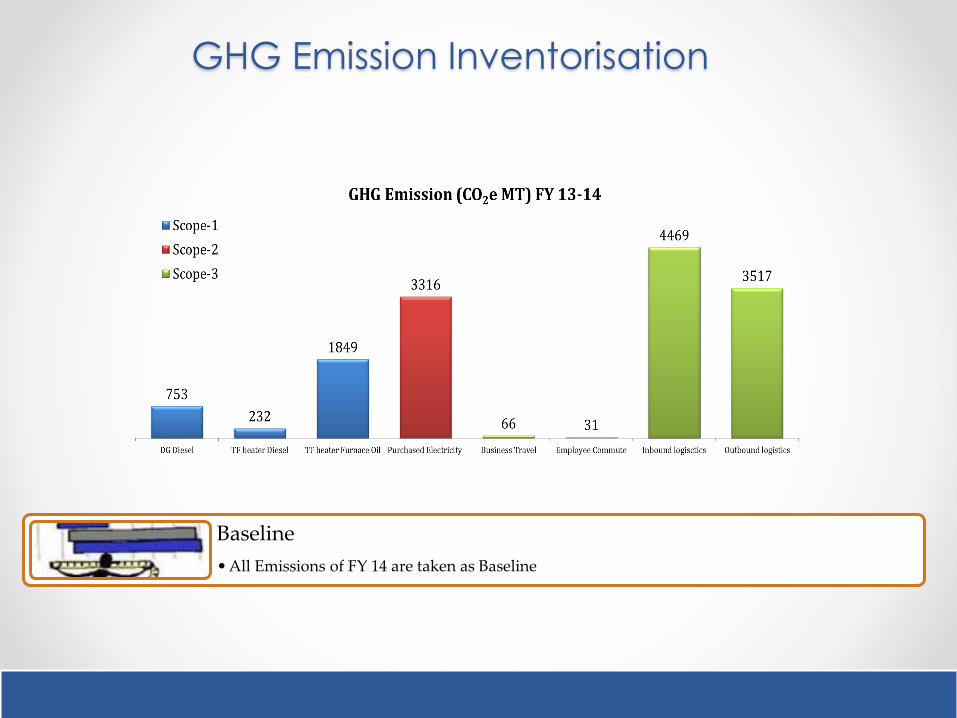
GHG Emission Inventorisation
Baseline
• All Emissions of FY 14 are taken as Baseline
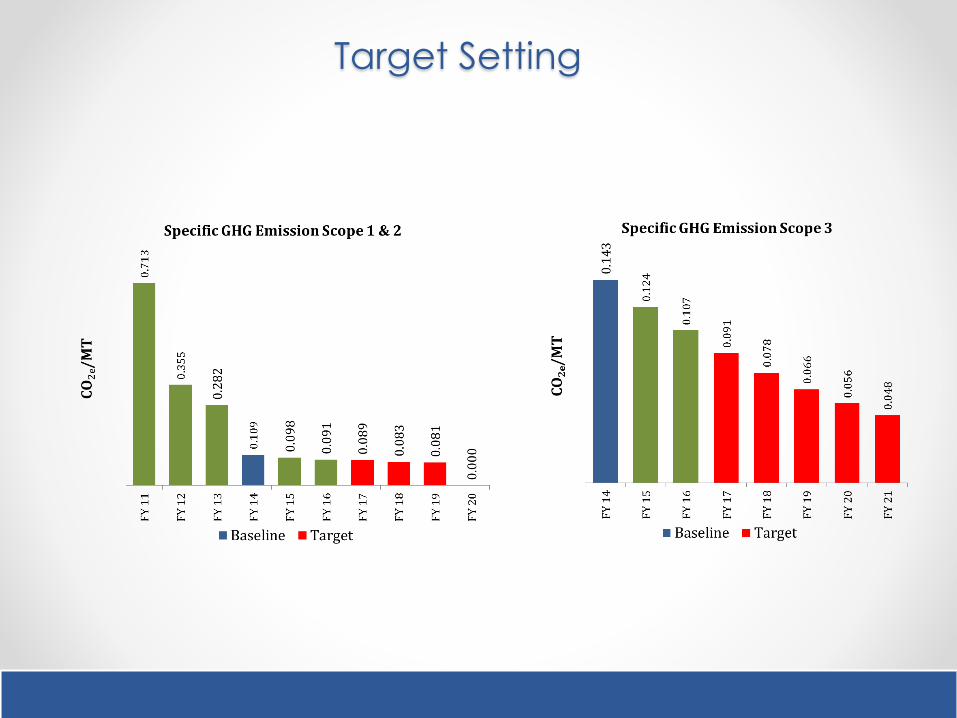
Target Setting
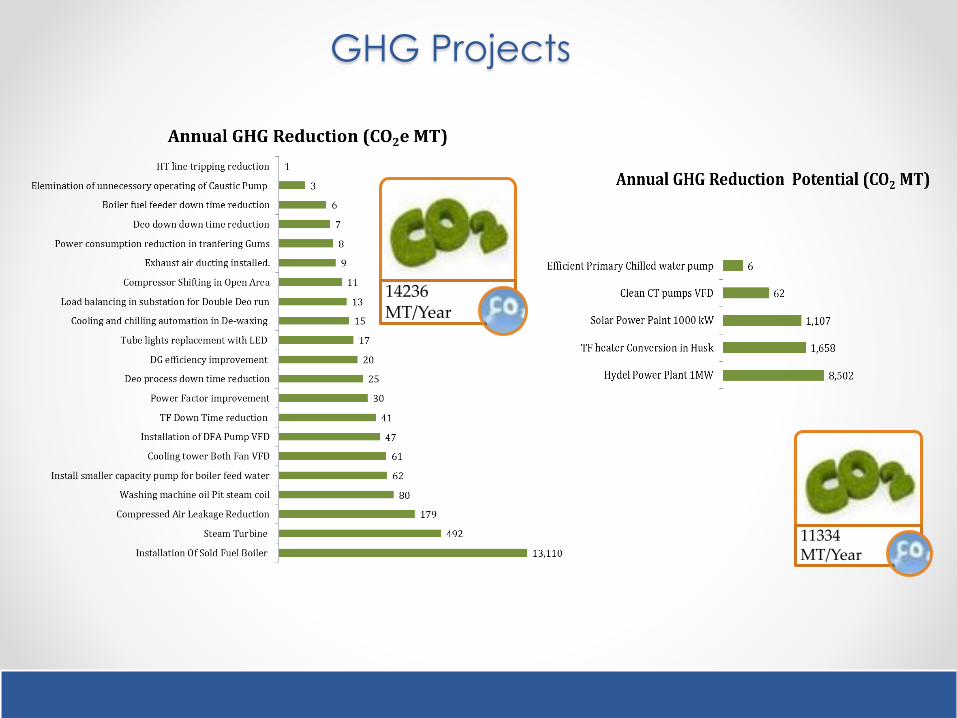
GHG Projects
11334 MT/Year
14236 MT/Year
5. Waste Management
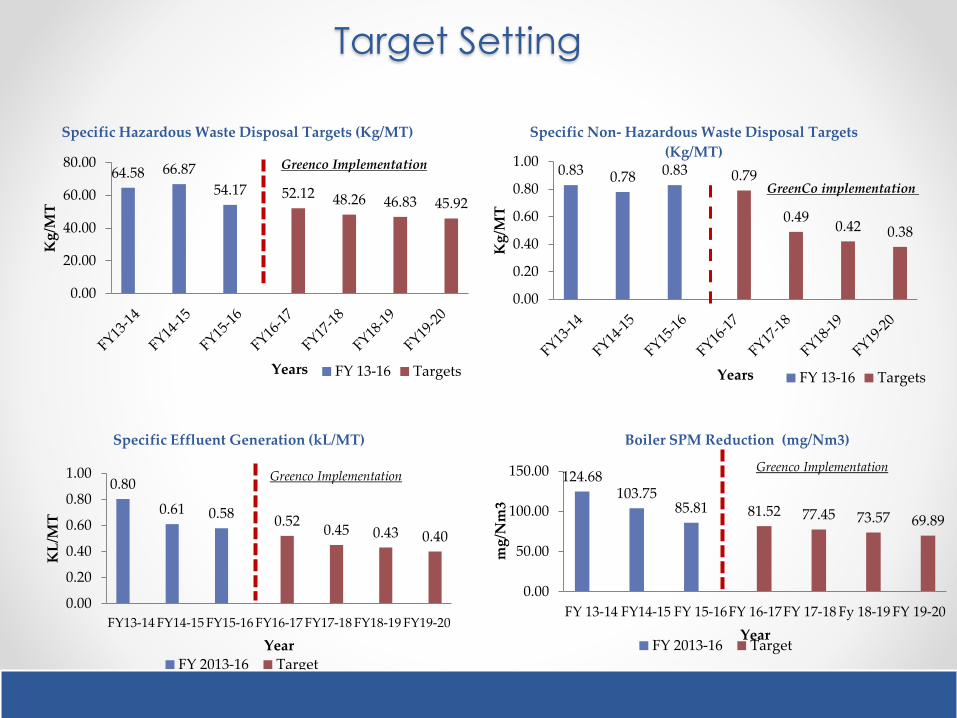
0.83 0.78 0.83 0.79
0.490.42 0.38
0.00
0.20
0.40
0.60
0.80
1.00
Kg
/MT
Years
Specific Non- Hazardous Waste Disposal Targets
(Kg/MT)
FY 13-16 Targets
GreenCo implementation 64.58 66.87
54.17 52.12 48.26 46.83 45.92
0.00
20.00
40.00
60.00
80.00
Kg
/MT
Years
Specific Hazardous Waste Disposal Targets (Kg/MT)
FY 13-16 Targets
Greenco Implementation
0.80
0.61 0.580.52
0.45 0.43 0.40
0.00
0.20
0.40
0.60
0.80
1.00
FY13-14 FY14-15 FY15-16 FY16-17 FY17-18 FY18-19 FY19-20
KL
/MT
Year
Specific Effluent Generation (kL/MT)
FY 2013-16 Target
124.68103.75
85.81 81.52 77.45 73.57 69.89
0.00
50.00
100.00
150.00
FY 13-14 FY14-15 FY 15-16FY 16-17FY 17-18 Fy 18-19 FY 19-20
mg
/Nm
3
Year
Boiler SPM Reduction (mg/Nm3)
FY 2013-16 Target
Greenco ImplementationGreenco Implementation
Target Setting
63
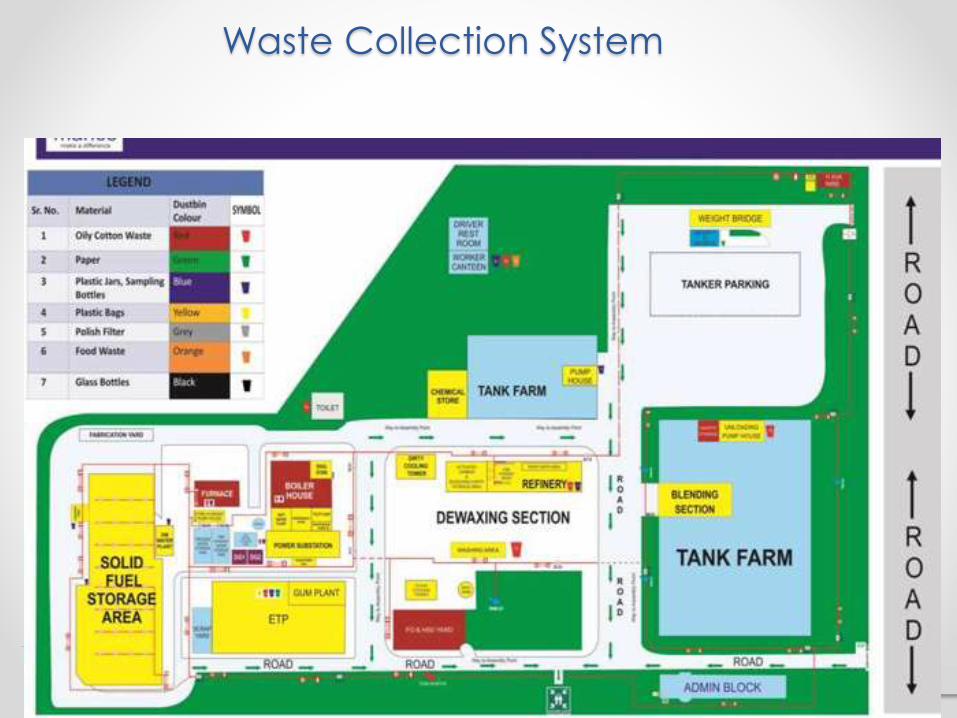
Waste Collection System
Key Projects
WATER RECOVERY FROM DEGUMMING SECTION
Impact : 30 KL
Effluent Load
Reduction in ETP
with Condensate
Recovery from
Degumming
GUMS AND OIL RECOVERY FROM ETP
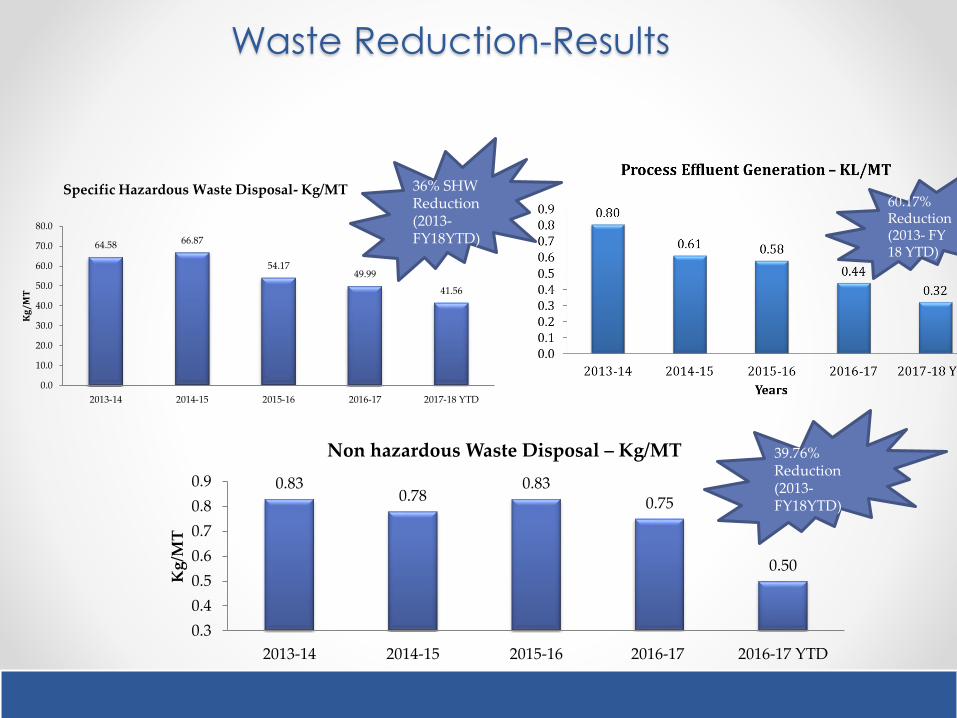
Waste Reduction-Results
64.58 66.87
54.1749.99
41.56
0.0
10.0
20.0
30.0
40.0
50.0
60.0
70.0
80.0
2013-14 2014-15 2015-16 2016-17 2017-18 YTD
Kg
/M
T
Specific Hazardous Waste Disposal- Kg/MT 36% SHW Reduction (2013-FY18YTD)
60.17% Reduction (2013- FY 18 YTD)
0.830.78
0.830.75
0.50
0.3
0.4
0.5
0.6
0.7
0.8
0.9
2013-14 2014-15 2015-16 2016-17 2016-17 YTD
Kg
/MT
Year
Non hazardous Waste Disposal – Kg/MT 39.76% Reduction (2013-FY18YTD)
6. Material Conservation
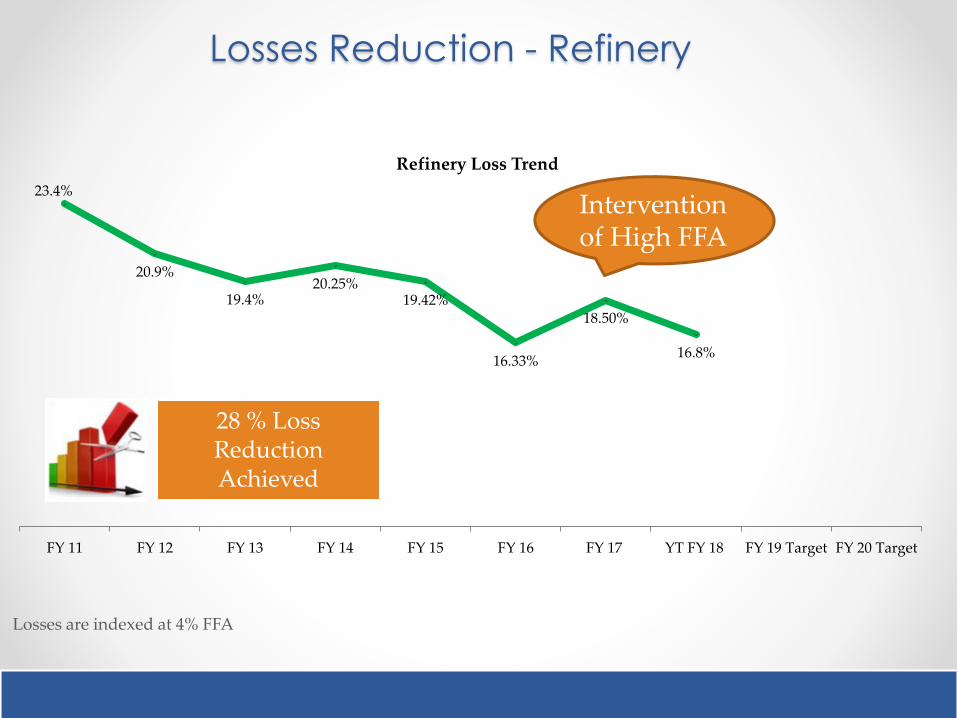
Losses Reduction - Refinery
23.4%
20.9%
19.4%20.25%
19.42%
16.33%
18.50%
16.8%
FY 11 FY 12 FY 13 FY 14 FY 15 FY 16 FY 17 YT FY 18 FY 19 Target FY 20 Target
Refinery Loss Trend
Losses are indexed at 4% FFA
28 % Loss Reduction Achieved
Intervention of High FFA

Project 1: RBO DFA Purity Enhancement
DDRDDR-Two Trays ShowingMammoth Pumps
Valve added in the Sparge Steam Line of individual Tray for steam controlling
Baseline FFA of DFA
85%
Actual FFA of DFA
86.9%
Yield Improvement
0.13%
Oil Saved 39.3 MT
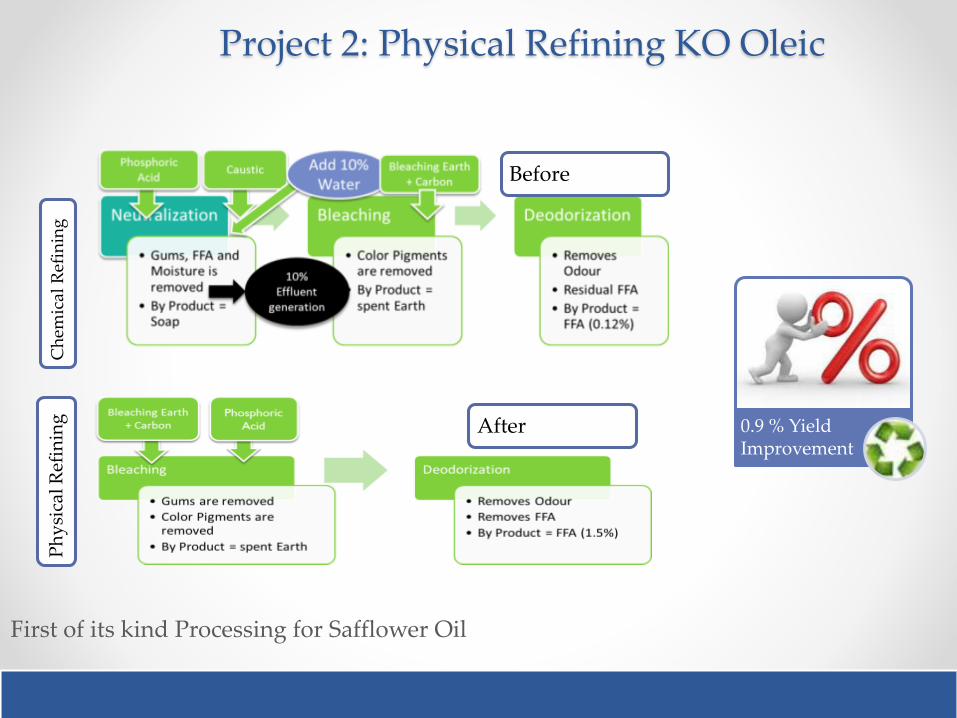
Project 2: Physical Refining KO Oleic
First of its kind Processing for Safflower Oil
Before
After
Ch
emic
al R
efin
ing
Ph
ysi
cal
Ref
inin
g 0.9 % Yield Improvement
7. Green Supply Chain

Green Supply Chain Planning
Dynamic Planning
•Dynamic Planning between Baddi & Jalgaon Locations
• Targeting minimum total delivery cost depot wise between Baddi & Jalgaon Plants
Depot Wise
• Depot demand allocation to filling plants with minimum Procurement, Filling & Distribution cost
•Allocation of depot is dynamic & changes month on month
SKU Wise
•SKU demand are allocated plant wise basis TDC
•Allocation of depot is dynamic & changes month on month
•Minimum distribution cost lead to lower truck travelled for FG dispatches
Total Delivery Cost Model
-18%
CO2 Emission`-18% Diesel
Consumption
-10% KM/KL
East 2014-15 2015-16
CO2 Emmission(Ton) 1,464 807
KMs Travelled 18,29,411 10,08,380
West 2014-15 2015-16
CO2 Emmission(Ton) 586 461
KMs Travelled 7,32,707 5,75,774
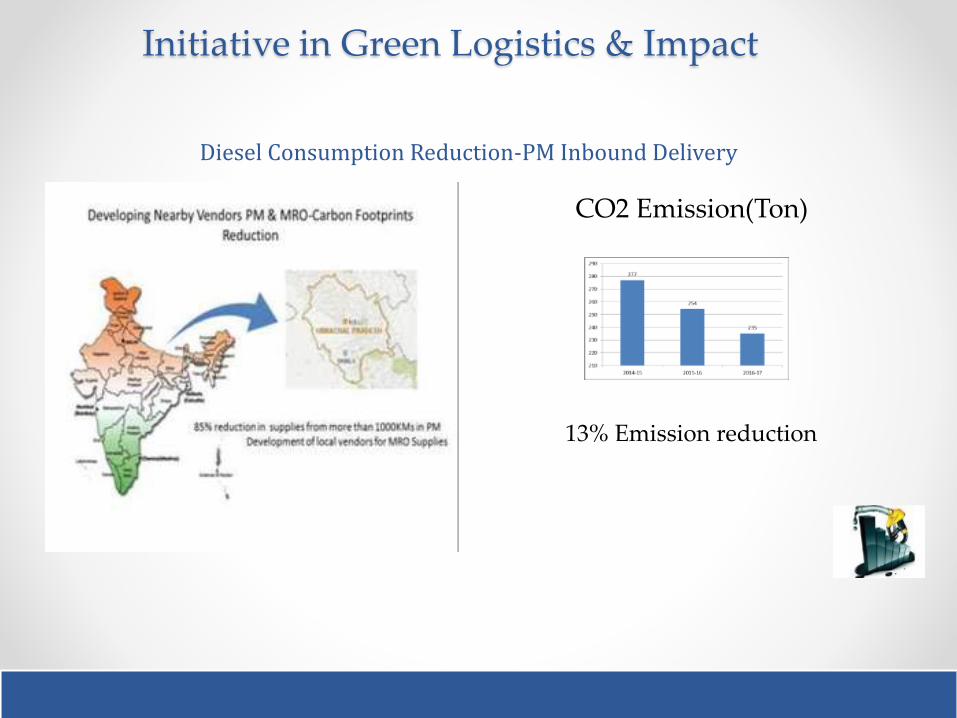
Initiative in Green Logistics & Impact
Diesel Consumption Reduction-PM Inbound Delivery
CO2 Emission(Ton)
13% Emission reduction
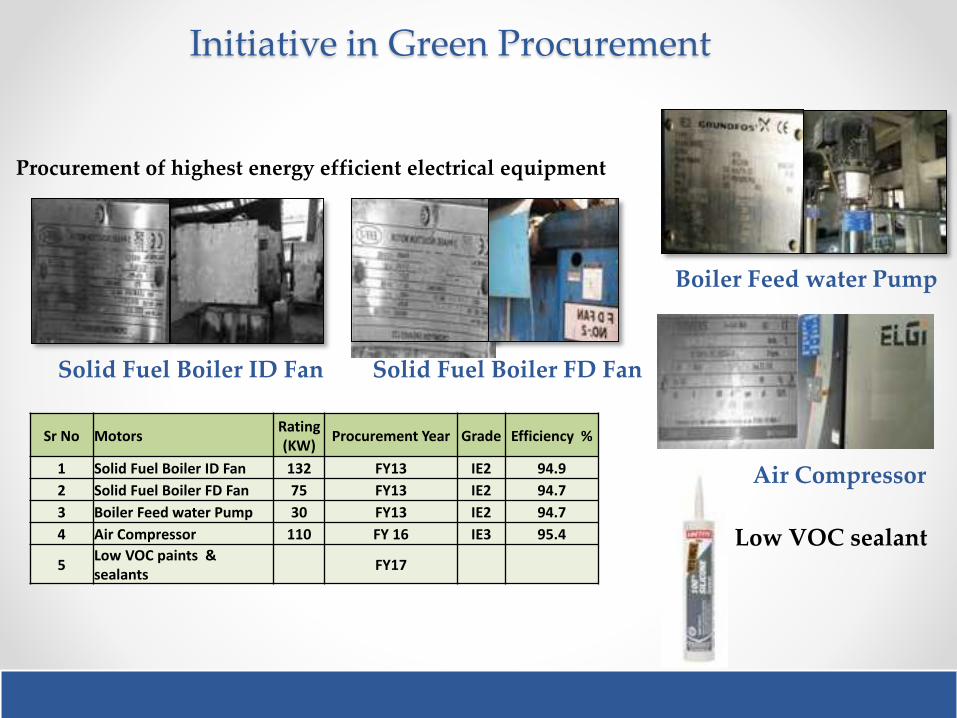
Initiative in Green Procurement
Procurement of highest energy efficient electrical equipment
Solid Fuel Boiler ID Fan Solid Fuel Boiler FD Fan
Boiler Feed water Pump
Air Compressor
Sr No MotorsRating (KW)
Procurement Year Grade Efficiency %
1 Solid Fuel Boiler ID Fan 132 FY13 IE2 94.9
2 Solid Fuel Boiler FD Fan 75 FY13 IE2 94.7
3 Boiler Feed water Pump 30 FY13 IE2 94.7
4 Air Compressor 110 FY 16 IE3 95.4
5Low VOC paints & sealants
FY17
Low VOC sealant
8. Product Stewardship
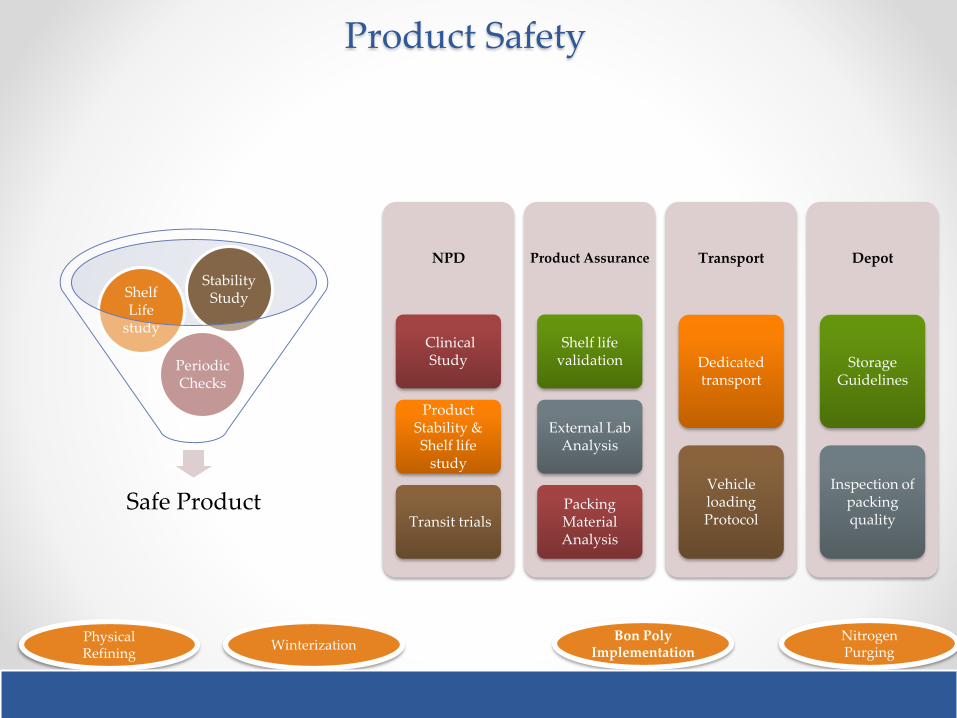
Product Safety
NPD
Clinical Study
Product Stability & Shelf life
study
Transit trials
Product Assurance
Shelf life validation
External Lab Analysis
Packing Material Analysis
Transport
Dedicated transport
Vehicle loading Protocol
Depot
Storage Guidelines
Inspection of packing quality
Safe Product
Periodic Checks
Shelf Life
study
Stability Study
Bon Poly Implementation
Nitrogen Purging
Physical Refining
Winterization
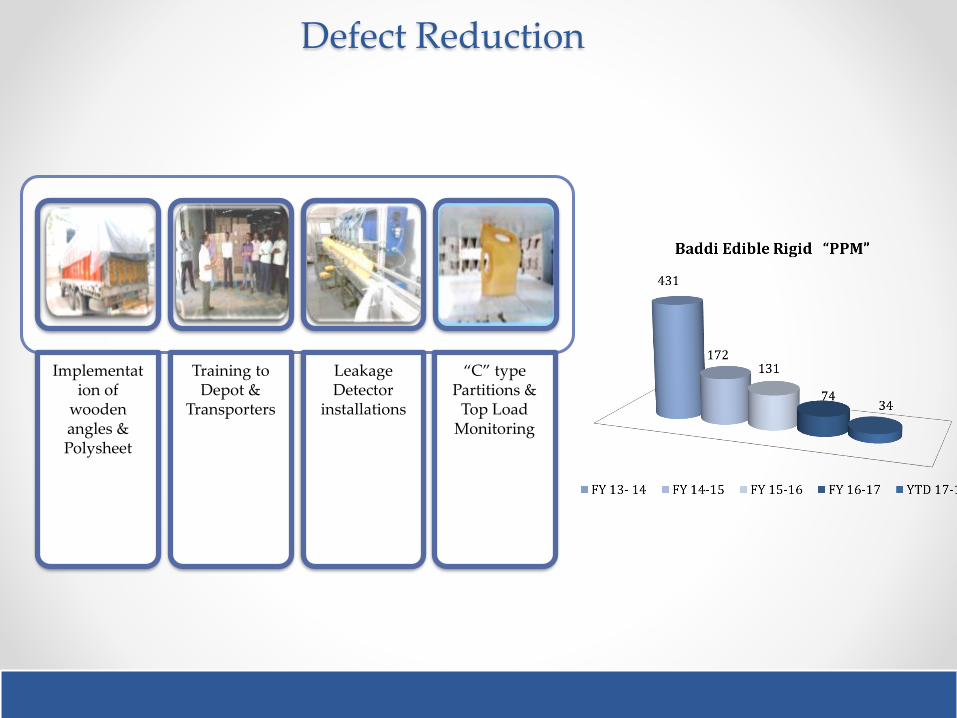
Defect Reduction
Implementation of
wooden angles & Polysheet
Training to Depot &
Transporters
Leakage Detector
installations
“C” type Partitions &
Top Load Monitoring
9. Life Cycle Assessment
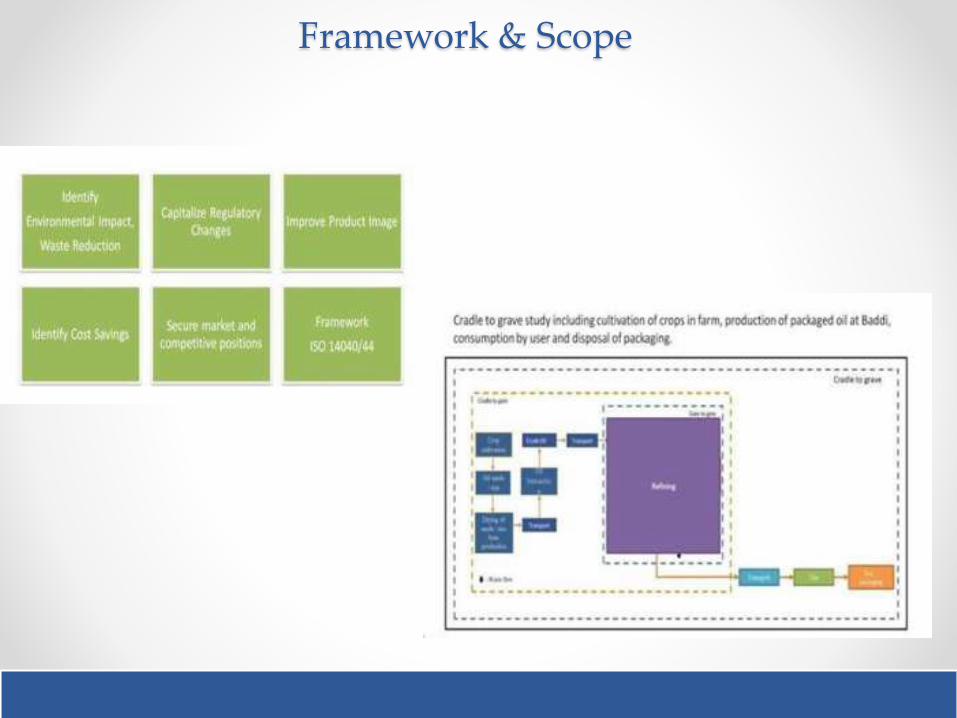
Framework & Scope
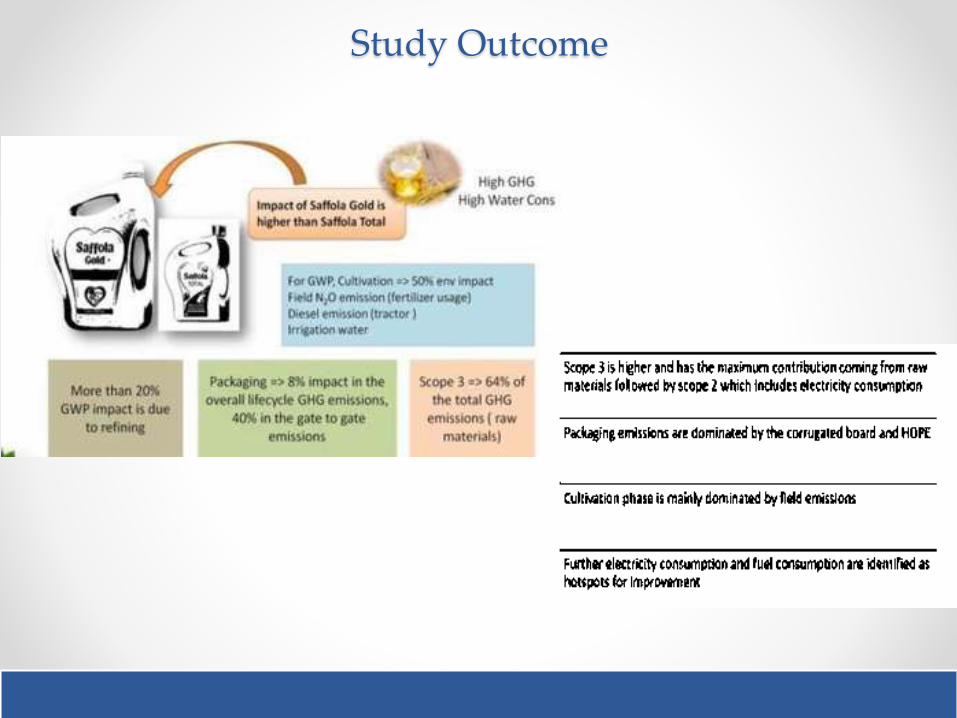
Study Outcome
10. Others
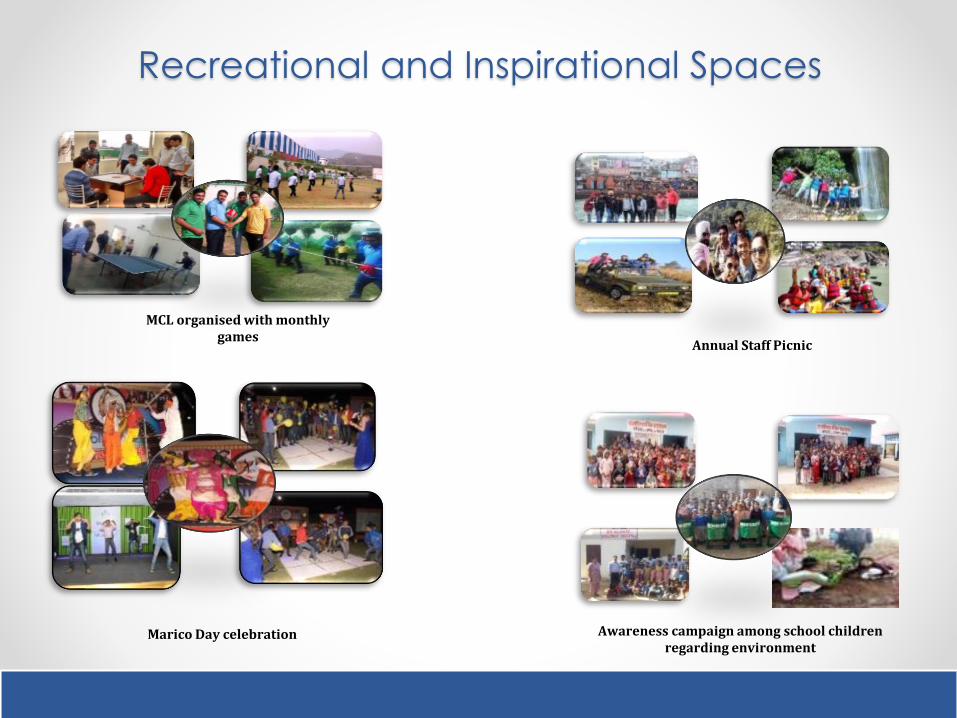
Recreational and Inspirational Spaces
MCL organised with monthly games
Annual Staff Picnic
Marico Day celebration Awareness campaign among school children regarding environment
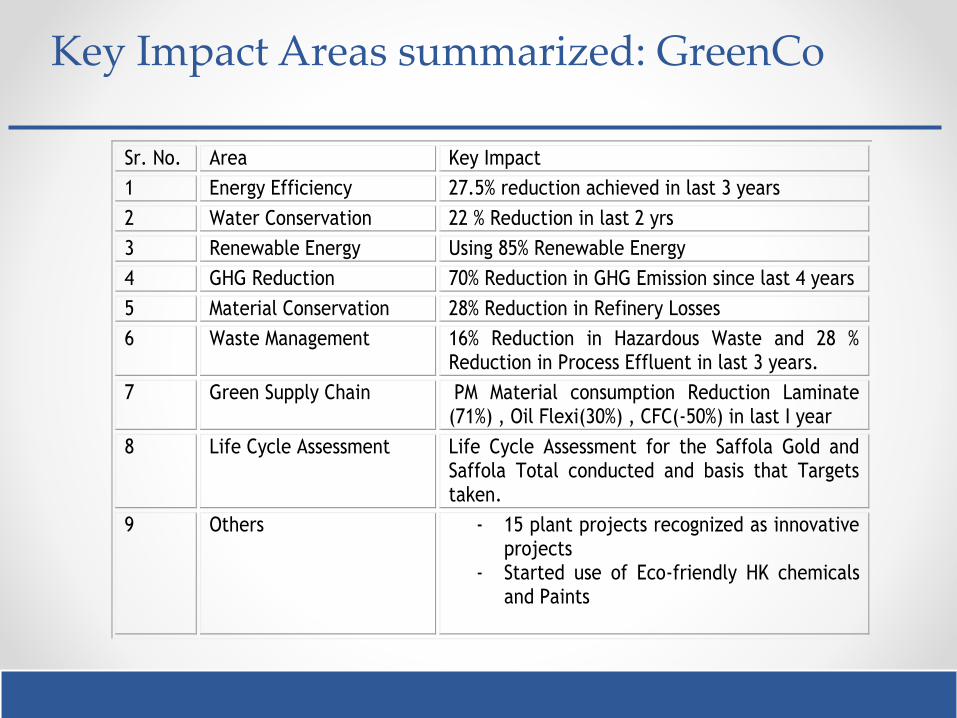
Sr. No. Area Key Impact
1 Energy Efficiency 27.5% reduction achieved in last 3 years
2 Water Conservation 22 % Reduction in last 2 yrs
3 Renewable Energy Using 85% Renewable Energy
4 GHG Reduction 70% Reduction in GHG Emission since last 4 years
5 Material Conservation 28% Reduction in Refinery Losses
6 Waste Management 16% Reduction in Hazardous Waste and 28 % Reduction in Process Effluent in last 3 years.
7 Green Supply Chain PM Material consumption Reduction Laminate (71%) , Oil Flexi(30%) , CFC(-50%) in last I year
8 Life Cycle Assessment Life Cycle Assessment for the Saffola Gold and Saffola Total conducted and basis that Targets taken.
9 Others - 15 plant projects recognized as innovative projects
- Started use of Eco-friendly HK chemicals and Paints
Key Impact Areas summarized: GreenCo
Key Recognitions in FY 17-18
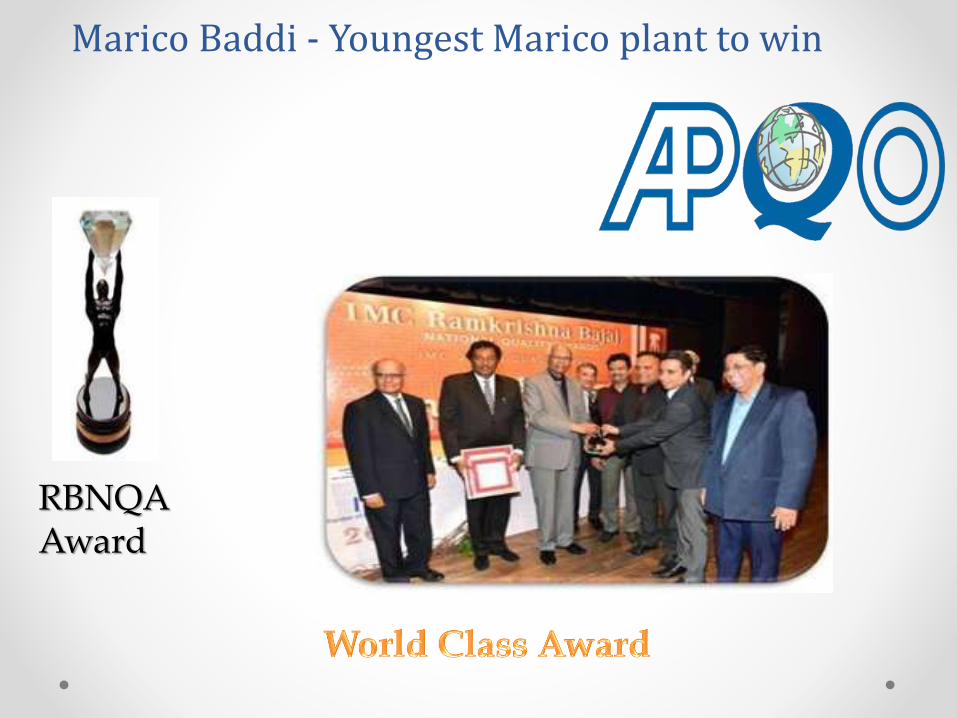
Marico Baddi - Youngest Marico plant to win
RBNQA Award

Marico: Make a Difference-Journey Continues