induced abortions in michigan - mdch.state.mi.us 2016.pdf · m ichigan d epartment of h ealth &...
TRANSCRIPT
MICHIGAN DEPARTMENT OF HEALTH & HUMAN SERVICESDivision for Vital Records and Health Statistics
INDUCED ABORTIONS IN MICHIGAN January 1 through December 31, 2016
LANSING, MICHIGANAPRIL 2017

Rick Snyder, GovernorNick Lyon, Director
Acknowledgments
DIVISION FOR VITAL RECORDS AND HEALTH STATISTICS
Glenn Copeland, M.B.A. State Registrar
VITAL RECORDS & HEALTH DATA DEVELOPMENT SECTION
Tami Weaver, B.A., Manager
AUTHORS
Mei You, M.S., StatisticianLindsey Myers, B.A., Data AnalystGlenn Radford, M.A., Statistician
The Division for Vital Records and Health Statistics gratefully acknowledges the contributions of: Stacey Hoffman, B.S..

Introduction 1
Table A Number, Ratio & Rate of Reported Induced Abortions Occurring in Michigan, 1982-2016 4
Table B-1 Abortions by Woman's Age, Gestational Age, Procedure, Facility Type & Complications, 1985-2016 5
Table B-2 Abortions by Woman's Age, Marital Status, Previous Pregnancy Outcome, 1985-2016 6
Table C Number, Ratio & Rate of Reported Induced Abortions, United States, 1980-2014 7
Table D Number of Reported Induced Abortions by Age of Woman, Michigan Residents, 1983-2016 8
Table E Rates of Reported Abortions by Age, Michigan Residents, 1983-2016 9
Table F Number of Reported Abortions by Selected Characteristics, Michigan Residents, 1980-2016 10
Table G Number, Ratio & Rate of Reported Induced Abortions, Michigan Residents, 1982-2016 11
Table H-1 Abortion Numbers by County of Residence Counties & Detroit City, 2006-2016 12
Table H-2 Abortion Rates by County of Residence & Detroit City 2006-2016 15
Table 1 Abortions by County of Residence 18
Table 2 Abortions by County of Residence & Age of Woman 19
Table 3-A Abortions by City of Residence & Age of Woman for Cities with Over 40,000 Population 22
Table 3-B Abortions by Area of Residence & Age of Woman for Selected Large Metropolitan Areas 24
Table 4 Abortions by County of Residence & Number of Previous Induced Abortions 25
Table 5 Abortions by Age of Woman & Race or Hispanic Ancestry 28
Table 6 Abortions by Age of Woman & Marital Status 29
Table 7 Abortions by Source of Referral & Age of Woman 30
Table 8 Abortions by the Number of Previous Pregnancies Carried to Term & Marital Status 31
Table 9 Abortions by Age of Woman & Number of Previous Spontaneous Abortions 32
Table 11 Abortions by Race or Hispanic Ancestry of Woman 33
Table 12 Abortions by Race or Hispanic Ancestry of Woman & Marital Status 34
Table 13 Abortions by Race or Hispanic Ancestry of Woman & Number of Previous Spontaneous Abortions 35
Table 14 Abortions by the Source of Payment & Race or Hispanic Ancestry of Woman 36
Table 15 Abortions by Race & Age of Woman 37
Table 16 Abortions by the Source of Payment & Age of Woman 38
Table 17 Abortions by Weeks of Gestation & Principal Procedure 39
Table 18 Abortions by Weeks of Gestation & Type of Facility 40
Table 19 Abortions by Principal Procedure & Type of Facility 41
Table Of Contents
Trends
Induced Abortions Statistics for Michigan Residents, 2016
Induced Abortions Statistics for Michigan Occurrences, 2016
Page i

Table 20 Abortions with Any Mention of Immediate Complication by Type of Immediate Complication 42
Table 21 Abortions with Any Mention of Immediate Complication by Selected Characteristics 43
Table 22 Abortions by Evidence of Life 44
Table 23 Abortions by Weight of Fetus 45
Table 24 Abortions with Any Mention of Subsequent Complication by Type of Subsequent Complication 46
Table 25 Abortions by Weeks of Gestation & Method to Confirm Pregnancy 47
Table 26 Abortions with Any Mention of Subsequent Complication by Selected Characteristics 48
Table Of Contents
Induced Abortions Statistics for Michigan Occurrences, 2016 (continued)
Page ii

1.
Characteristics of Induced Abortions Reported in Michigan
Division for Vital Records & Health StatisticsMichigan Department of Health & Human Services
A total of 26,395 induced abortions were reported in Michigan in 2016, which was a 2.8 percent decrease from the total of 27,151 reported in 2015 and a 46.2 percent decrease since 1987 (the year with the largest number of induced abortions). (See Table A.)
Figure 1: Rates of Abortions for Michigan Occurrences, Per 1,000 Women
Michigan residents received 96 percent of the induced abortions that occurred in Michigan in 2016. This proportion is similar to that which was observed in previous years.
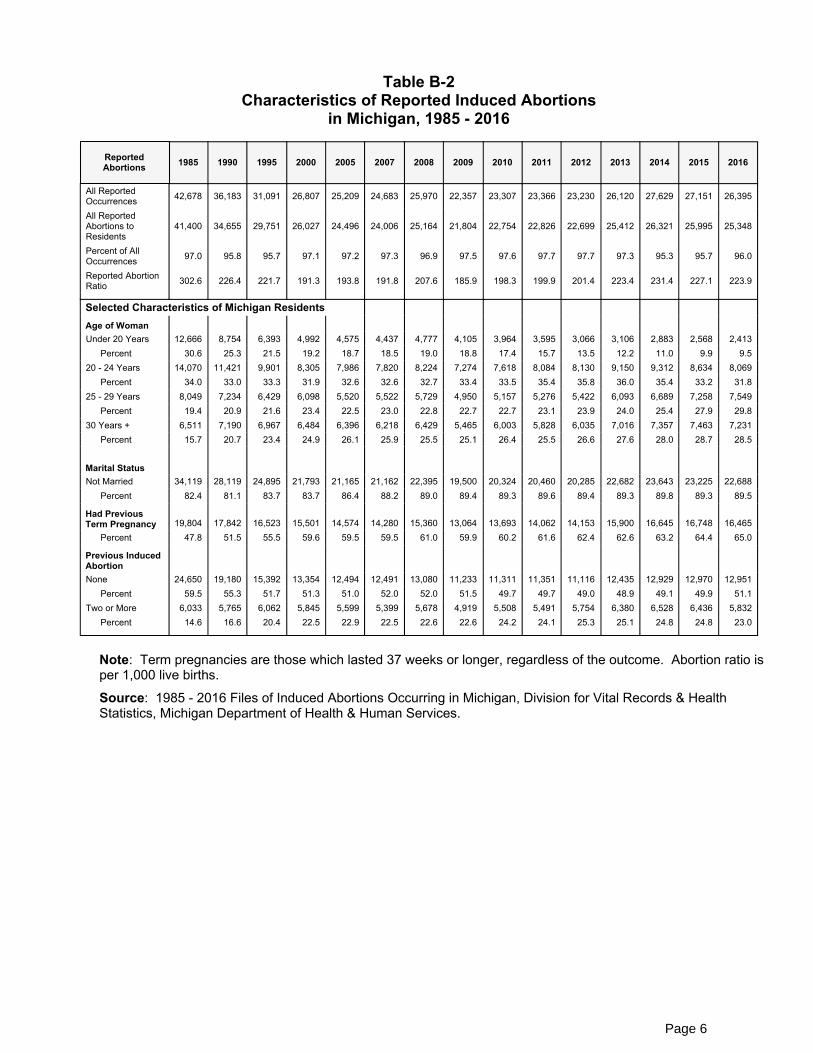
In 2016, about 51% of the resident women receiving abortions had no previous induced abortions. In general, from 1985 through 2016, a gradual increase has been observed with the proportion of women reporting two or more induced abortions, going from 14.6 percent in 1985 to 23 percent in 2016. The proportion of women who had no previous induced abortion has generally declined, falling from 59.5 percent in 1985 to 51.1 percent in 2016.
In 2016, 89.5 percent of the Michigan women who obtained an induced abortion were not married, a 7.1 percent increase from the 82.4 percent reported in 1985. (See Table F.)
About 65 percent of the resident women obtaining induced abortions in 2016 had a previous term pregnancy. Of the women who had a previous term pregnancy, over 58 percent in 2016 had at least two or more term pregnancies. (See Table 8.)
Page 1

The majority of Michigan residents receiving induced abortions (41.3 percent) were under 25 years of age, while 9.5 percent were less than 20 years old. These are much smaller proportions than the 64.6 and 30.6 percent observed, respectively, in 1985. (See Table B-2.)
Figure 2: Age-specific Abortion Rates, Per 1,000 Women
Other than self-referral, which was reported for 85.6 percent of all induced abortions in 2016, the most frequent source of referral for induced abortion services was a family member or a friend (9.5 percent) and a physician (2.2 percent). (See Table 7.)
Among all induced abortions reported in 2016 in Michigan (including both residents and non-residents), most involved pregnancies of 12 weeks or less (85.5 percent) and suction was the most frequent procedure at 63.6 percent. (See Table 17.)
Abortions performed in physicians' private offices represented 5.6 percent of all reported induced abortions in 2016, those performed in freestanding outpatient surgical facilities comprised 93.8 percent, with the remainder occurring in hospitals and other facilities. (See Table 18.)
Most abortion reports indicate no immediate complications. In 2016 immediate complications were reported in 26 cases and in 39 cases between 2013-2015. The average three-year rate of 2013-2015 was 4.8 complications per 10,000 induced abortions performed. (See Table 20.)
In 2016, self-pay was indicated as the source of payment for most induced abortions (92.6 percent). (See Table 16.)
In 2016, ultrasound was the most common method reported for confirming the pregnancy (89.8 percent). (See Table 25.)
Page 2

Information on complications subsequent to an abortion was collected for the first time in 2001. This information is required to be reported on a separate reporting form by any physician who provided care to a woman suffering from a physical complication that was the result of an abortion occurring within seven days of the abortion. 11 reports of subsequent complications were submitted in 2016. (See Table 26.)
Information on the race of the woman obtaining an induced abortion was collected for the first time in 2003. In 2011, Hispanic ancestry was first collected. Of the Michigan residents receiving abortions in 2016, 43.2 percent were white, 50.5 percent were black, 2.1 percent were Asian/Pacific Islander and about 3 percent were American Indian, multracial or of some other race. In 2016, 3.2 of the women obtaining an abortion were of Hispanic ancestry. (See Table 11.)
Figure 3: Number of Abortions by Race or Hispanic Ancestry of Women
Technical Notes
The state of Michigan has established a mandatory reporting system for induced abortions (MCL 333.2835). According to this law, abortion reports are not allowed to contain any common identifiers that would make it possible to identify, in any manner or under any circumstances, an individual who obtained or seeks to obtain an abortion. Abortion reports are prepared and submitted to the Department of Health & Human Services by the physician who performs the abortion. The reports are not legal records; they are used only to produce statistical data for health and medical purposes. The department is specifically mandated to prepare aggregated statistics of individual abortion reports on an annual basis.
The tables in this report are based on induced abortion reports for 2016 that were received by the Department of Health & Human Services on or before January 31, 2017. Definitions of the terms used are given in the footnotes of the individual tables, where necessary.
Important Note: Beginning in 2016, the Michigan Division for Vital Records & Health Statistics changed the standard for gestational age from a calculation based on the last menstrual period, to the obstetric/clinical estimate of gestational age. Abortion statistics based on the obstetric estimate are more comparable to abortion statistics provided by the NCHS and are consistent with the CDC's Induced Termination of Pregnancy guidelines..
Page 3

2.
Table ANumber, Ratio and Rate of Reported Induced Abortions
Occurring in Michigan, 1982 - 2016
Year InducedAbortions Ratio Rate
1982 43,512 315.4 20.0 1983 40,528 304.7 18.8 1984 42,062 309.8 19.4 1985 42,678 309.1 19.5 1986 41,710 303.1 18.8 1987 49,098 349.5 22.0 1988 46,747 334.8 21.0 1989 36,557 246.7 16.5 1990 36,183 236.4 16.3 1991 34,555 231.2 15.5 1992 34,496 239.8 15.5 1993 35,737 256.1 16.1 1994 33,061 239.8 14.9 1995 31,091 231.7 14.0 1996 30,208 226.7 13.6 1997 29,528 221.1 13.3 1998 28,107 210.3 12.7 1999 26,207 196.4 11.9 2000 26,807 197.0 12.42001 28,220 211.8 13.12002 29,231 225.7 13.72003 29,540 225.8 14.42004 26,269 202.5 12.42005 25,209 197.7 12.0 2006 25,636 201.0 12.42007 24,683 197.2 12.12008 25,970 214.2 13.02009 22,357 190.6 11.42010 23,307 203.2 12.12011 23,366 204.7 12.32012 23,230 206.1 12.22013 26,120 229.7 13.82014 27,629 242.9 14.62015 27,151 237.2 14.42016 26,395 233.1 14.0
Note: The ratio is the number of reported induced abortions occurring in Michigan per 1,000 Michigan live births. The rate is the number of reported induced abortions occurring in Michigan per 1,000 Michigan women aged 15-44. Ratio for 2016 is based upon 2015 resident live births.
Source: 1982 - 2016 Files of Induced Abortions Occurring in Michigan and 1982 - 2015 Michigan Resident Live Birth Files. Division for Vital Records & Health Statistics, Michigan Department of Health & Human Services. 2000-2015 Population Estimates (latest update 6/2015), National Center for Health Statistics, U.S. Census Populations With Bridged Race Categories.
Page 4

3.
Table B-1Characteristics of Reported Induced Abortions
Michigan Occurrences, 1985 - 2016
Characteristics of Occurrences 1985 1990 1995 2000 2005 2007 2008 2009 2010 2011 2012 2013 2014 2015 2016
All Reported Occurrences 42,678 36,183 31,091 26,807 25,209 24,683 25,970 22,357 23,307 23,366 23,230 26,120 27,629 27,151 26,395
Age of Woman:
Under 181 n.a. 3,820 2,798 1,860 1,732 1,681 1,806 1,469 1,410 1,179 1,035 971 917 814 791
Percent n.a. 10.6 9.0 6.9 6.9 6.8 7.0 6.6 6.0 5.0 4.5 3.7 3.3 3.0 3.0
Weeks of Gestation:12 Weeks or Less 35,631 31,729 26,177 23,263 22,509 22,230 22,682 19,752 20,487 20,445 20,059 22,577 23,795 23,327 22,569
Percent 83.5 87.7 84.2 86.8 89.3 90.1 87.3 88.3 87.9 87.5 86.3 86.4 86.1 85.9 85.5
Principal Procedure Used:Suction Curettage 40,974 35,912 30,507 22,683 20,090 20,536 22,054 18,514 19,012 18,916 17,060 19,225 18,402 17,451 16,791
Percent 96.0 99.3 98.1 84.6 79.7 83.2 84.9 82.8 81.6 81.0 73.4 73.6 66.6 64.3 63.6
Facility Type:
Freestanding orHospital Satellite Clinic
13,830 15,469 10,494 6,066 6,936 6,002 5,428 4,775 4,617 5,521 6,374 6,569 12,129 21,613 24,752
Percent 32.4 42.8 33.8 22.6 27.5 24.3 20.9 21.4 19.8 23.6 27.4 25.1 43.9 79.6 93.8Physician's Private Office 20,757 20,056 20,337 20,384 18,127 18,597 20,458 17,498 18,648 17,617 16,624 19,386 15,299 5,396 1,487
Percent 48.6 55.4 65.4 76.0 71.9 75.3 78.8 78.3 80.0 75.4 71.6 74.2 55.4 19.9 5.6
Immediate Complications:2
Presence of Immediate Complication(s) 112 34 9 26 5 5 9 6 5 5 7 13 15 11 26
Ratio 2.6 0.9 0.3 1.0 * * 0.3 0.3 * * 0.3 0.5 0.5 0.4 0.9
Subsequent Complications:2
Presence of Subsequent Complication(s) n.a. n.a. n.a. 7 9 16 14 7 10 10 14 59 43 36 11
Ratio n.a. n.a. n.a. 0.3 0.4 0.6 0.5 0.3 0.4 0.4 0.6 2.3 1.6 1.3 0.4
Note: Subsequent complications are those complications that are not evident and reported in conjunction with the abortion but are reported within 7 days of initially providing care for a condition that is known to have been caused by an abortion.
* Ratio does not meet standards of precision or reliability. • "n.a." indicates data not available. • Percent are of all occurrences. • Ratios are per 1,000 occurrences.
1This item is reported in compliance with statute MCL 333.2835(6)(b).2This item is reported in compliance with statute MCL 333.2835(6)(c).
Page 5
4.
Table B-2Characteristics of Reported Induced Abortions
in Michigan, 1985 - 2016
Reported Abortions 1985 1990 1995 2000 2005 2007 2008 2009 2010 2011 2012 2013 2014 2015 2016
All Reported Occurrences 42,678 36,183 31,091 26,807 25,209 24,683 25,970 22,357 23,307 23,366 23,230 26,120 27,629 27,151 26,395
All Reported Abortions to Residents
41,400 34,655 29,751 26,027 24,496 24,006 25,164 21,804 22,754 22,826 22,699 25,412 26,321 25,995 25,348
Percent of All Occurrences 97.0 95.8 95.7 97.1 97.2 97.3 96.9 97.5 97.6 97.7 97.7 97.3 95.3 95.7 96.0
Reported Abortion Ratio 302.6 226.4 221.7 191.3 193.8 191.8 207.6 185.9 198.3 199.9 201.4 223.4 231.4 227.1 223.9
Selected Characteristics of Michigan ResidentsAge of Woman Under 20 Years 12,666 8,754 6,393 4,992 4,575 4,437 4,777 4,105 3,964 3,595 3,066 3,106 2,883 2,568 2,413
Percent 30.6 25.3 21.5 19.2 18.7 18.5 19.0 18.8 17.4 15.7 13.5 12.2 11.0 9.9 9.520 - 24 Years 14,070 11,421 9,901 8,305 7,986 7,820 8,224 7,274 7,618 8,084 8,130 9,150 9,312 8,634 8,069
Percent 34.0 33.0 33.3 31.9 32.6 32.6 32.7 33.4 33.5 35.4 35.8 36.0 35.4 33.2 31.825 - 29 Years 8,049 7,234 6,429 6,098 5,520 5,522 5,729 4,950 5,157 5,276 5,422 6,093 6,689 7,258 7,549
Percent 19.4 20.9 21.6 23.4 22.5 23.0 22.8 22.7 22.7 23.1 23.9 24.0 25.4 27.9 29.830 Years + 6,511 7,190 6,967 6,484 6,396 6,218 6,429 5,465 6,003 5,828 6,035 7,016 7,357 7,463 7,231
Percent 15.7 20.7 23.4 24.9 26.1 25.9 25.5 25.1 26.4 25.5 26.6 27.6 28.0 28.7 28.5
Marital Status Not Married 34,119 28,119 24,895 21,793 21,165 21,162 22,395 19,500 20,324 20,460 20,285 22,682 23,643 23,225 22,688
Percent 82.4 81.1 83.7 83.7 86.4 88.2 89.0 89.4 89.3 89.6 89.4 89.3 89.8 89.3 89.5
Had Previous Term Pregnancy 19,804 17,842 16,523 15,501 14,574 14,280 15,360 13,064 13,693 14,062 14,153 15,900 16,645 16,748 16,465
Percent 47.8 51.5 55.5 59.6 59.5 59.5 61.0 59.9 60.2 61.6 62.4 62.6 63.2 64.4 65.0
Previous Induced Abortion None 24,650 19,180 15,392 13,354 12,494 12,491 13,080 11,233 11,311 11,351 11,116 12,435 12,929 12,970 12,951
Percent 59.5 55.3 51.7 51.3 51.0 52.0 52.0 51.5 49.7 49.7 49.0 48.9 49.1 49.9 51.1Two or More 6,033 5,765 6,062 5,845 5,599 5,399 5,678 4,919 5,508 5,491 5,754 6,380 6,528 6,436 5,832
Percent 14.6 16.6 20.4 22.5 22.9 22.5 22.6 22.6 24.2 24.1 25.3 25.1 24.8 24.8 23.0
Note: Term pregnancies are those which lasted 37 weeks or longer, regardless of the outcome. Abortion ratio is per 1,000 live births.
Source: 1985 - 2016 Files of Induced Abortions Occurring in Michigan, Division for Vital Records & Health Statistics, Michigan Department of Health & Human Services.
Page 6

5.
Table CNumber, Ratio and Rate of Reported Induced Abortions
United States, 1980 - 2014
YearGuttmacher Abortion Estimates CDC Abortion Surveillance System
InducedAbortions Ratio Rate Induced
Abortions Ratio Rate
1980 1,545,170 428 28 1,297,606 359 251985 1,578,800 420 28 1,328,570 353 241990 --- --- --- 1,429,247 344 241991 1,549,180 377 26 1,388,937 338 241992 1,520,810 374 26 1,359,146 334 231993 --- --- --- 1,330,414 333 231994 1,423,000 360 24 1,267,415 321 211995 1,359,400 349 23 1,210,883 311 201996 1,360,200 350 22 1,225,937 315 211997 1,335,000 344 22 1,186,039 306 201998 1,319,000 335 22 884,273 264 171999 1,314,800 332 21 861,789 256 172000 1,313,000 323 21 857,475 245 162001 1,291,000 321 21 853,485 246 162002 1,269,000 316 21 854,122 250 162003 1,250,000 306 20 848,163 245 162004 1,216,050 296 20 839,226 241 162005 1,198,960 290 19 820,151 236 162006 1,242,000 291 20 852,385 237 162007 1,202,960 279 19 827,609 230 162008 1,212,350 225 19 825,564 232 162009 1,151,600 279 19 789,217 227 152010 1,102,670 276 18 765,651 228 152011 1,058,490 268 17 730,322 219 142012 1,011,000 256 16 699,202 210 132013 958,700 244 15 664,435 169 132014 926,190 232 15 --- --- ---
Note: The ratio is the number of reported induced abortions per 1,000 live births. The rate is the number of reported induced abortions per 1,000 women aged 15-44 years.
Triple dashes (---) indicates data is not available.
Between 2004-2013, CDC Abortion Surveillance System covered approximately the same 47 reporting areas. The CDC number of abortions excludes states that did not report in certain years: Alaska (1999--2002), California (1999--2013), Louisiana (2005), Maryland (2007--2008, 2013), New Hampshire (1999--2013), Oklahoma (1999), and West Virginia (2003--2004).
Source: CDC's Abortion Surveillance System, National Center For Health Statistics.
Guttmacher: 1980-1999: Trends in the Characteristics of Women Obtaining Abortions, 1974 to 2004. 2000, 2004, 2005 and 2007: Guttmacher Institute Abortion Provider Census. No surveys were conducted in 2001, 2002, 2003, 2006, 2009 or 2012. Data for those years were estimated by using interpolation. 2011-2014: Abortion Incidence and Service Availability in the United States, 2014 (Volume 49, No. 1, March 2017.)
Page 7
6.
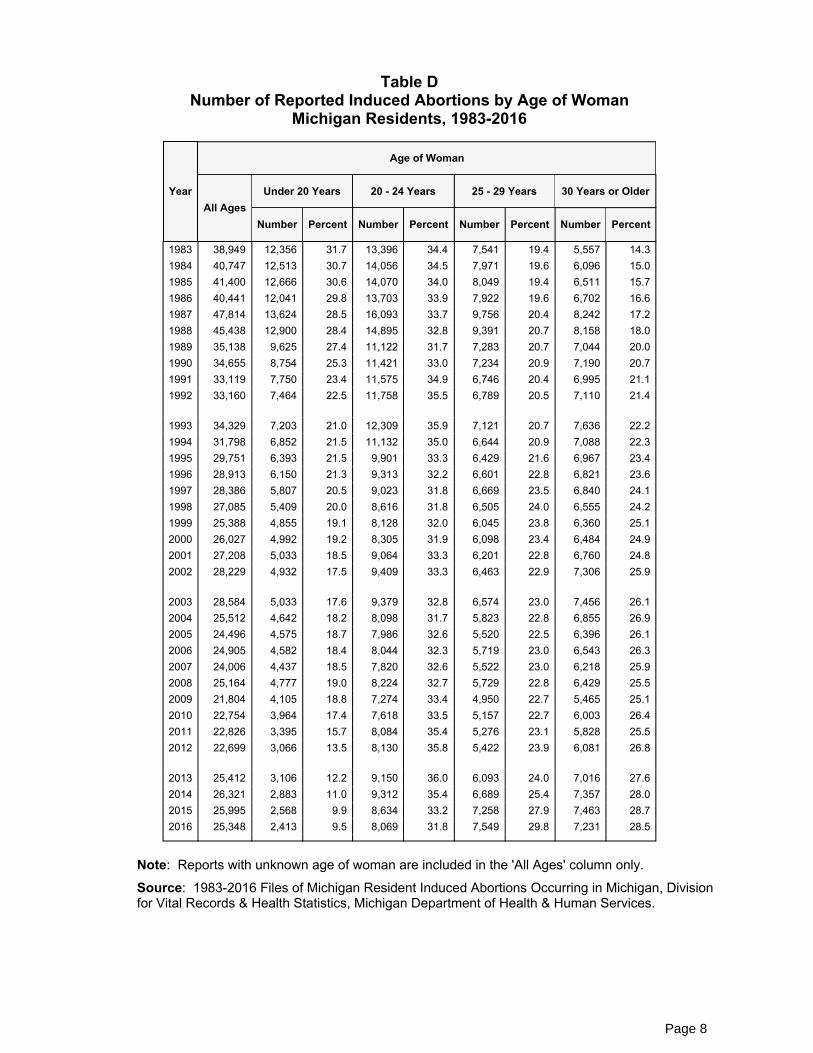
Table DNumber of Reported Induced Abortions by Age of Woman
Michigan Residents, 1983-2016
Year
Age of Woman
All Ages Under 20 Years 20 - 24 Years 25 - 29 Years 30 Years or Older
Number Percent Number Percent Number Percent Number Percent
1983 38,949 12,356 31.7 13,396 34.4 7,541 19.4 5,557 14.31984 40,747 12,513 30.7 14,056 34.5 7,971 19.6 6,096 15.01985 41,400 12,666 30.6 14,070 34.0 8,049 19.4 6,511 15.71986 40,441 12,041 29.8 13,703 33.9 7,922 19.6 6,702 16.61987 47,814 13,624 28.5 16,093 33.7 9,756 20.4 8,242 17.21988 45,438 12,900 28.4 14,895 32.8 9,391 20.7 8,158 18.01989 35,138 9,625 27.4 11,122 31.7 7,283 20.7 7,044 20.01990 34,655 8,754 25.3 11,421 33.0 7,234 20.9 7,190 20.71991 33,119 7,750 23.4 11,575 34.9 6,746 20.4 6,995 21.11992 33,160 7,464 22.5 11,758 35.5 6,789 20.5 7,110 21.4
1993 34,329 7,203 21.0 12,309 35.9 7,121 20.7 7,636 22.21994 31,798 6,852 21.5 11,132 35.0 6,644 20.9 7,088 22.31995 29,751 6,393 21.5 9,901 33.3 6,429 21.6 6,967 23.41996 28,913 6,150 21.3 9,313 32.2 6,601 22.8 6,821 23.61997 28,386 5,807 20.5 9,023 31.8 6,669 23.5 6,840 24.11998 27,085 5,409 20.0 8,616 31.8 6,505 24.0 6,555 24.21999 25,388 4,855 19.1 8,128 32.0 6,045 23.8 6,360 25.12000 26,027 4,992 19.2 8,305 31.9 6,098 23.4 6,484 24.92001 27,208 5,033 18.5 9,064 33.3 6,201 22.8 6,760 24.82002 28,229 4,932 17.5 9,409 33.3 6,463 22.9 7,306 25.9
2003 28,584 5,033 17.6 9,379 32.8 6,574 23.0 7,456 26.12004 25,512 4,642 18.2 8,098 31.7 5,823 22.8 6,855 26.92005 24,496 4,575 18.7 7,986 32.6 5,520 22.5 6,396 26.12006 24,905 4,582 18.4 8,044 32.3 5,719 23.0 6,543 26.32007 24,006 4,437 18.5 7,820 32.6 5,522 23.0 6,218 25.92008 25,164 4,777 19.0 8,224 32.7 5,729 22.8 6,429 25.52009 21,804 4,105 18.8 7,274 33.4 4,950 22.7 5,465 25.12010 22,754 3,964 17.4 7,618 33.5 5,157 22.7 6,003 26.42011 22,826 3,395 15.7 8,084 35.4 5,276 23.1 5,828 25.52012 22,699 3,066 13.5 8,130 35.8 5,422 23.9 6,081 26.8
2013 25,412 3,106 12.2 9,150 36.0 6,093 24.0 7,016 27.62014 26,321 2,883 11.0 9,312 35.4 6,689 25.4 7,357 28.02015 25,995 2,568 9.9 8,634 33.2 7,258 27.9 7,463 28.72016 25,348 2,413 9.5 8,069 31.8 7,549 29.8 7,231 28.5
Note: Reports with unknown age of woman are included in the 'All Ages' column only.
Source: 1983-2016 Files of Michigan Resident Induced Abortions Occurring in Michigan, Division for Vital Records & Health Statistics, Michigan Department of Health & Human Services.
Page 8
7.
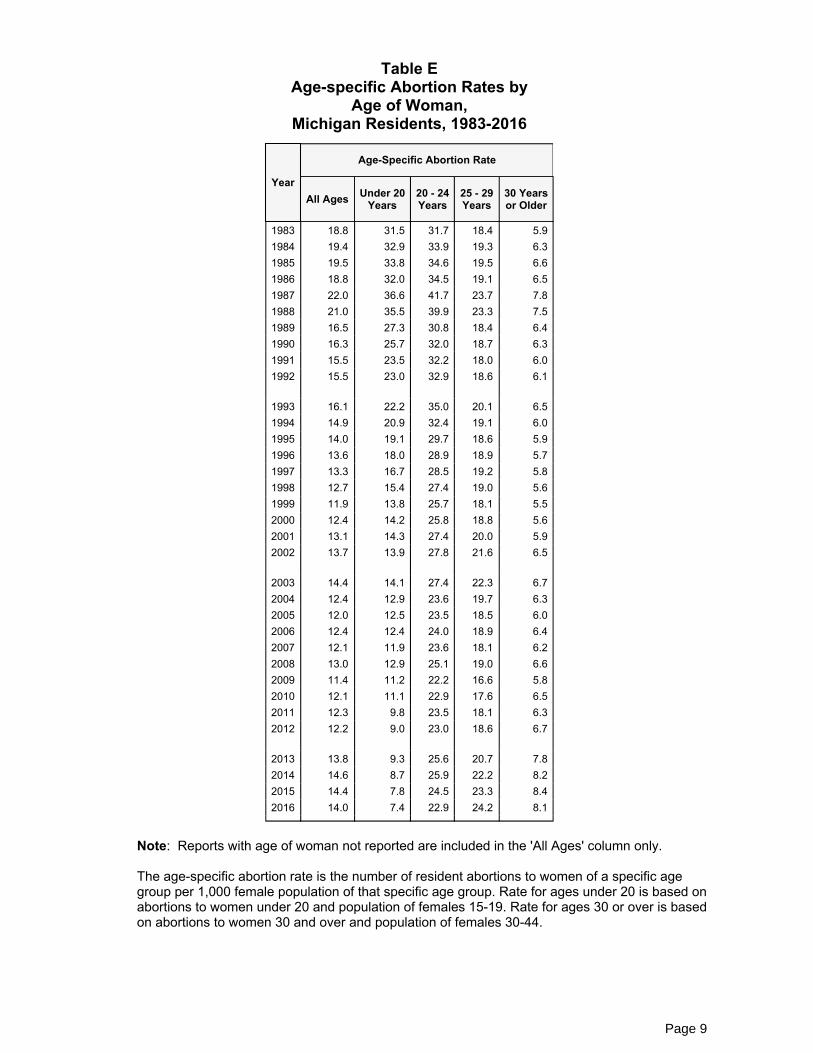
Table EAge-specific Abortion Rates by
Age of Woman,Michigan Residents, 1983-2016
Year
Age-Specific Abortion Rate
All Ages Under 20Years
20 - 24Years
25 - 29Years
30 Yearsor Older
1983 18.8 31.5 31.7 18.4 5.91984 19.4 32.9 33.9 19.3 6.31985 19.5 33.8 34.6 19.5 6.61986 18.8 32.0 34.5 19.1 6.51987 22.0 36.6 41.7 23.7 7.81988 21.0 35.5 39.9 23.3 7.51989 16.5 27.3 30.8 18.4 6.41990 16.3 25.7 32.0 18.7 6.31991 15.5 23.5 32.2 18.0 6.01992 15.5 23.0 32.9 18.6 6.1
1993 16.1 22.2 35.0 20.1 6.51994 14.9 20.9 32.4 19.1 6.01995 14.0 19.1 29.7 18.6 5.91996 13.6 18.0 28.9 18.9 5.71997 13.3 16.7 28.5 19.2 5.81998 12.7 15.4 27.4 19.0 5.61999 11.9 13.8 25.7 18.1 5.52000 12.4 14.2 25.8 18.8 5.62001 13.1 14.3 27.4 20.0 5.92002 13.7 13.9 27.8 21.6 6.5
2003 14.4 14.1 27.4 22.3 6.72004 12.4 12.9 23.6 19.7 6.32005 12.0 12.5 23.5 18.5 6.02006 12.4 12.4 24.0 18.9 6.42007 12.1 11.9 23.6 18.1 6.22008 13.0 12.9 25.1 19.0 6.62009 11.4 11.2 22.2 16.6 5.82010 12.1 11.1 22.9 17.6 6.52011 12.3 9.8 23.5 18.1 6.32012 12.2 9.0 23.0 18.6 6.7
2013 13.8 9.3 25.6 20.7 7.82014 14.6 8.7 25.9 22.2 8.22015 14.4 7.8 24.5 23.3 8.42016 14.0 7.4 22.9 24.2 8.1
Note: Reports with age of woman not reported are included in the 'All Ages' column only.
The age-specific abortion rate is the number of resident abortions to women of a specific age group per 1,000 female population of that specific age group. Rate for ages under 20 is based on abortions to women under 20 and population of females 15-19. Rate for ages 30 or over is based on abortions to women 30 and over and population of females 30-44.
Page 9

8.
Table FNumber of Reported Abortions by Selected Characteristics
Michigan Residents, 1980-2016
Year Total
Marital Status:Not Married
Had a PreviousTerm Pregnancy
Previous Induced Abortion
None Two or More
Number Percent Number Percent Number Percent Number Percent
1980 43,964 34,481 78.4 20,040 45.6 29,104 66.2 4,194 9.51981 44,031 35,095 79.7 20,497 46.6 28,424 64.6 4,814 10.91982 41,866 33,927 81.0 19,655 46.9 27,079 64.7 4,916 11.71983 38,949 32,245 82.8 18,075 46.4 23,650 60.7 5,375 13.81984 40,747 33,563 82.4 19,100 46.9 24,162 59.3 5,765 14.11985 41,400 34,119 82.4 19,804 47.8 24,650 59.5 6,033 14.61986 40,441 33,438 82.7 19,742 48.8 23,985 59.3 5,953 14.71987 47,814 39,421 82.4 23,876 49.9 27,294 57.1 7,518 15.71988 45,438 37,432 82.4 23,677 52.1 25,504 56.1 7,423 16.31989 35,138 28,334 80.6 17,475 49.7 19,553 55.6 5,750 16.4
1990 34,655 28,119 81.1 17,842 51.5 19,180 55.3 5,765 16.61991 33,119 27,103 81.8 17,771 53.7 17,678 53.4 5,873 17.71992 33,160 27,450 82.8 17,478 52.7 18,383 55.4 5,744 17.31993 34,329 28,655 83.5 19,355 56.4 17,659 51.4 6,710 19.51994 31,798 26,890 84.6 17,709 55.7 16,717 52.6 6,470 20.31995 29,751 24,895 83.7 16,523 55.5 15,392 51.7 6,062 20.41996 28,913 23,969 82.9 16,437 56.8 14,960 51.7 6,100 21.11997 28,386 23,546 82.9 16,190 57.0 14,033 49.4 6,395 22.51998 27,085 22,382 82.6 15,977 59.0 14,510 53.6 5,494 20.31999 25,388 21,335 84.0 14,446 56.9 13,755 54.2 5,186 20.4
2000 26,027 21,793 83.7 15,501 59.6 13,354 51.3 5,845 22.52001 27,208 22,918 84.2 16,745 61.5 14,248 52.4 5,746 21.12002 28,229 23,911 84.7 17,857 63.3 14,275 50.6 6,601 23.42003 28,584 24,169 84.6 17,662 61.8 14,703 51.4 6,515 22.82004 25,512 21,789 85.4 15,388 60.3 13,266 52.0 5,695 22.32005 24,496 21,165 86.4 14,574 59.5 12,494 51.0 5,599 22.92006 24,905 21,620 86.8 14,841 59.6 12,777 51.3 5,622 22.62007 24,006 21,162 88.2 14,280 59.5 12,491 52.0 5,399 22.52008 25,164 22,395 89.0 15,360 61.0 13,080 52.0 5,678 22.62009 21,804 19,500 89.4 13,064 59.9 11,233 51.5 4,919 22.6
2010 22,754 20,324 89.3 13,693 60.2 11,311 49.7 5,508 24.22011 22,826 20,460 89.6 14,062 61.6 11,351 49.7 5,491 24.12012 22,699 20,285 89.4 14,153 62.4 11,116 49.0 5,754 25.32013 25,412 22,682 89.3 15,900 62.6 12,435 48.9 6,380 25.12014 26,321 23,643 89.8 16,645 63.2 12,929 49.1 6,528 24.82015 25,995 23,225 89.3 16,748 64.4 12,970 49.9 6,436 24.82016 25,348 22,688 89.5 16,465 65.0 12,951 51.1 5,832 23.0
Note: Term pregnancies are those which lasted 37 weeks or longer, regardless of the outcome.
Source: 1980-2016 Files of Michigan Resident Induced Abortions Occurring in Michigan, Division for Vital Records & Health Statistics, Michigan Department of Health & Human Services.
Page 10

9.
Table GNumber, Ratio and Rate of Reported Induced Abortions
Michigan Residents, 1982 - 2016
Year InducedAbortions Ratio Rate
1982 41,866 303.5 19.3 1983 38,949 292.8 18.0 1984 40,747 300.1 18.8 1985 41,400 299.9 18.9 1986 40,441 293.8 18.3 1987 47,814 340.4 21.4 1988 45,438 325.4 20.4 1989 35,138 237.2 15.9 1990 34,655 226.4 15.6 1991 33,119 221.6 14.81992 33,160 230.6 14.9 1993 34,329 246.0 15.5 1994 31,798 230.7 14.41995 29,751 221.7 13.4 1996 28,913 217.0 13.0 1997 28,386 212.6 12.8 1998 27,085 202.7 12.3 1999 25,388 190.3 11.62000 26,027 191.3 12.12001 27,208 204.2 12.62002 28,229 218.0 13.2 2003 28,584 218.4 13.92004 25,512 199.1 12.42005 24,496 192.1 11.72006 24,905 195.3 12.12007 24,006 191.8 11.82008 25,164 207.6 12.62009 21,804 185.9 11.12010 22,754 198.3 11.92011 22,826 199.9 12.02012 22,699 201.4 12.02013 25,412 223.4 13.42014 26,321 231.4 13.92015 25,995 227.1 13.82016 25,348 223.9 13.5
Note: The ratio is the number of reported induced abortions to Michigan residents per 1,000 Michigan live births. Ratio for 2016 is based upon 2015 resident live births. The rate is the number of reported induced abortions to Michigan residents per 1,000 Michigan women aged 15-44.
Source: 1982 - 2016 Michigan Resident Abortion Files and 1982 - 2015 Michigan Resident Live Birth Files. Division for Vital Records & Health Statistics, Michigan Department of Health & Human Services. 2000-2015 Population Estimates (latest update 6/2015), National Center for Health Statistics, U.S. Census Populations With Bridged Race Categories. .
Page 11

10.
Table H-1Abortion Numbers by County of Residence,
State of Michigan, Michigan Counties and Detroit City, 2006 - 2016
County 2006 2007 2008 2009 2010 2011 2012 2013 2014 2015 2016
Michigan 24,905 24,006 25,164 21,804 22,754 22,826 22,699 25,412 26,321 25,995 25,348
Alcona 6 10 7 10 7 5 6 9 6 14 7Alger 3 7 3 2 3 - 1 2 4 5 4Allegan 123 111 122 99 96 106 93 90 89 89 91Alpena 24 30 19 25 29 20 23 19 27 18 27Antrim 31 23 31 26 21 18 20 18 20 21 10Arenac 25 18 19 11 25 16 15 10 11 13 11Baraga 2 3 2 1 2 2 1 - 1 - 5Barry 67 55 47 57 35 37 37 39 51 47 43Bay 202 190 163 195 153 157 144 144 110 126 135Benzie 25 11 19 14 14 17 7 21 13 12 4
Berrien 300 321 297 283 261 263 209 175 180 169 185Branch 52 57 42 37 36 53 37 38 39 37 33Calhoun 341 340 360 289 283 298 251 246 283 266 246Cass 67 73 55 71 56 52 44 29 38 43 42Charlevoix 23 28 23 25 15 28 26 28 18 27 19Cheboygan 23 24 31 17 19 16 23 20 18 23 19Chippewa 27 30 41 26 38 27 29 40 29 50 26Clare 43 43 40 25 28 36 35 26 24 28 28Clinton 89 72 80 86 63 33 18 21 33 52 36Crawford 15 12 7 8 8 10 13 8 7 11 10
Delta 7 8 6 12 1 6 6 2 8 10 13Dickinson 2 1 - 2 - 2 1 1 8 1 10Eaton 192 242 190 181 181 105 62 77 122 139 205Emmet 35 44 43 32 29 28 42 40 27 40 30Genesee 1,566 1,407 1,355 1,520 1,394 1,320 1,361 1,318 1,339 1,301 1,272Gladwin 32 25 33 27 18 14 21 27 18 15 11Gogebic 1 - - - - - - - 1 1 2Grand Traverse 138 148 148 129 132 132 129 123 135 111 153Gratiot 54 46 53 42 35 32 25 28 34 26 43Hillsdale 44 47 38 45 33 27 37 35 31 36 27
Page 12

Table H-1Abortion Numbers by County of Residence,
State of Michigan, Michigan Counties and Detroit City, 2006 - 2016
County 2006 2007 2008 2009 2010 2011 2012 2013 2014 2015 2016
Houghton 14 9 7 5 3 2 1 4 13 5 12Huron 28 28 25 24 26 29 20 30 25 21 23Ingham 1,093 1,010 926 854 771 558 398 409 518 590 542Ionia 100 67 79 67 60 44 52 35 48 53 50Iosco 29 20 25 23 17 28 20 32 26 21 14Iron 3 1 - - - - - - 3 - 3Isabella 123 161 124 109 110 93 96 98 110 98 87Jackson 333 293 340 305 287 260 278 258 318 275 267Kalamazoo 844 778 826 746 710 714 687 654 666 668 601Kalkaska 13 14 13 11 10 14 12 11 12 7 13
Kent 1,534 1,540 1,491 1,335 1,142 980 1,178 1,154 1,239 1,181 1,211Keweenaw - 2 - 1 1 - 1 - - - 1Lake 8 11 14 9 7 4 8 7 8 3 4Lapeer 118 97 92 102 118 86 92 103 127 101 107Leelanau 25 17 21 27 18 16 13 20 14 11 14Lenawee 114 113 142 84 107 97 102 112 125 129 97Livingston 232 253 237 212 223 209 220 267 230 269 219Luce 4 4 2 3 2 5 4 2 3 - 2Mackinac 15 14 15 20 12 12 14 21 14 12 14Macomb 2,111 2,068 2,017 1,651 1,818 1,991 2,027 2,567 2,720 2,785 2,707
Manistee 31 27 24 27 24 22 16 15 12 16 23Marquette 75 39 37 30 19 24 35 23 46 44 73Mason 29 40 34 25 18 35 25 25 15 26 25Mecosta 56 53 52 49 53 49 32 43 46 64 47Menominee - - 1 2 - - - - 1 1 6Midland 105 86 82 104 103 64 82 60 95 61 75Missaukee 20 15 20 13 20 10 6 9 15 15 9Monroe 181 157 168 124 187 184 194 200 215 188 191Montcalm 85 68 82 86 63 42 54 40 59 46 55Montmorency 9 12 6 6 7 7 4 7 4 8 6
Page 13

Table H-1Abortion Numbers by County of Residence,
State of Michigan, Michigan Counties and Detroit City, 2006 - 2016
County 2006 2007 2008 2009 2010 2011 2012 2013 2014 2015 2016
Muskegon 423 338 255 220 156 166 177 302 269 300 302Newaygo 51 40 32 38 33 24 24 29 30 27 24Oakland 2,227 1,860 2,374 2,218 2,660 2,762 2,658 3,347 3,552 3,520 3,361Oceana 21 29 23 23 8 15 16 15 19 17 25Ogemaw 22 22 11 17 25 23 18 23 21 16 14Ontonagon - - - - - - - - 1 2 1Osceola 20 23 31 20 19 20 16 17 27 20 22Oscoda 6 7 13 12 6 1 8 8 3 6 4Otsego 24 28 29 27 25 22 29 26 22 23 38Ottawa 315 306 290 256 199 208 233 259 264 256 201
Presque Isle 6 6 11 10 10 13 7 6 7 10 8Roscommon 29 28 30 23 36 23 22 25 19 23 22Saginaw 551 599 562 565 475 490 434 487 478 494 511St Clair 298 275 276 224 270 254 223 271 255 270 276St Joseph 84 76 69 76 82 69 56 59 59 62 67Sanilac 48 45 40 31 37 26 24 27 33 54 27Schoolcraft 5 7 4 3 2 2 2 5 4 3 5Shiawassee 107 110 101 99 78 80 74 71 55 60 71Tuscola 76 79 65 56 77 46 60 45 46 46 56Van Buren 138 138 135 129 133 108 104 76 101 97 84
Washtenaw 1,113 1,088 965 990 1,054 1,041 994 990 940 875 834Wayne 8,404 8,420 9,618 7,368 8,383 8,961 9,084 10,453 10,616 10,336 10,101
Detroit 5,399 5,568 6,365 4,648 5,140 5,609 5,693 6,530 6,439 6,228 6,106Wayne Excluding Detroit 3,005 2,852 3,253 2,720 3,243 3,352 3,391 3,923 4,177 4,108 3,995
Wexford 45 57 48 43 31 26 32 24 38 41 37
Note: - A dash indicates quantity zero. Unknown county of residence is included in Michigan's total only.
Source: 2006 - 2016 Michigan Abortion Files, Division for Vital Records & Health Statistics, Michigan Department of Health & Human Services.
Page 14
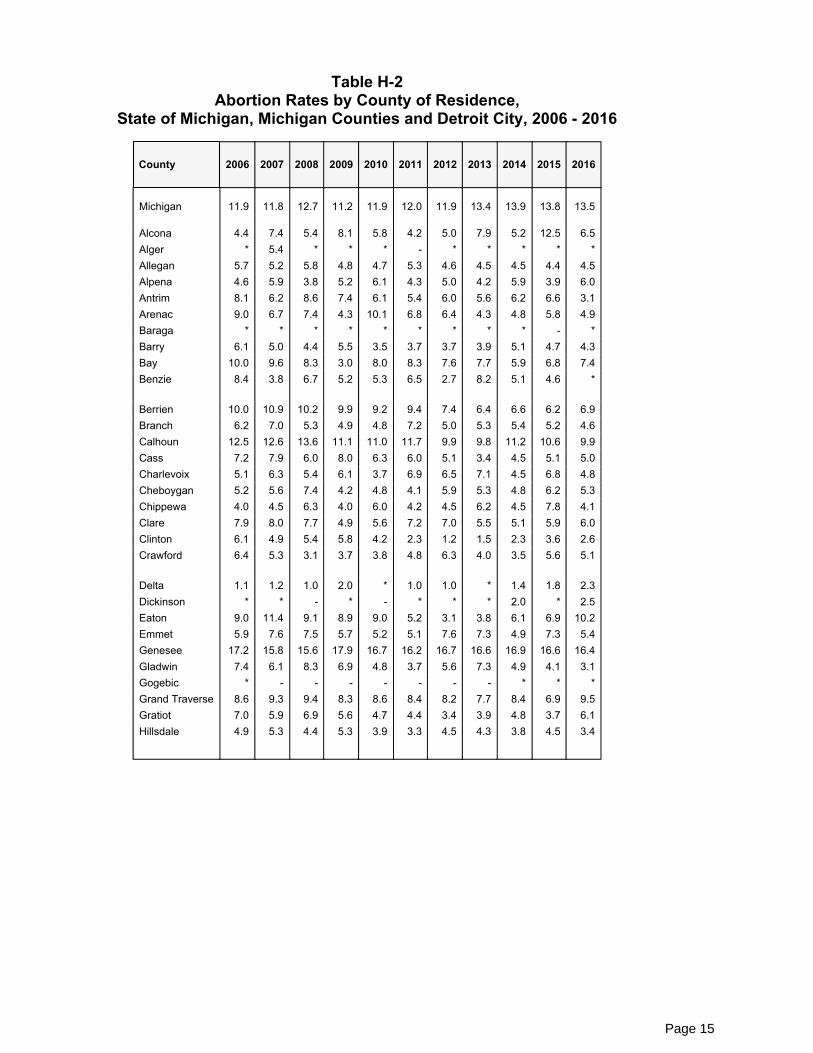
11.
Table H-2Abortion Rates by County of Residence,
State of Michigan, Michigan Counties and Detroit City, 2006 - 2016
County 2006 2007 2008 2009 2010 2011 2012 2013 2014 2015 2016
Michigan 11.9 11.8 12.7 11.2 11.9 12.0 11.9 13.4 13.9 13.8 13.5
Alcona 4.4 7.4 5.4 8.1 5.8 4.2 5.0 7.9 5.2 12.5 6.5Alger * 5.4 * * * - * * * * *Allegan 5.7 5.2 5.8 4.8 4.7 5.3 4.6 4.5 4.5 4.4 4.5Alpena 4.6 5.9 3.8 5.2 6.1 4.3 5.0 4.2 5.9 3.9 6.0Antrim 8.1 6.2 8.6 7.4 6.1 5.4 6.0 5.6 6.2 6.6 3.1Arenac 9.0 6.7 7.4 4.3 10.1 6.8 6.4 4.3 4.8 5.8 4.9Baraga * * * * * * * * * - *Barry 6.1 5.0 4.4 5.5 3.5 3.7 3.7 3.9 5.1 4.7 4.3Bay 10.0 9.6 8.3 3.0 8.0 8.3 7.6 7.7 5.9 6.8 7.4Benzie 8.4 3.8 6.7 5.2 5.3 6.5 2.7 8.2 5.1 4.6 *
Berrien 10.0 10.9 10.2 9.9 9.2 9.4 7.4 6.4 6.6 6.2 6.9Branch 6.2 7.0 5.3 4.9 4.8 7.2 5.0 5.3 5.4 5.2 4.6Calhoun 12.5 12.6 13.6 11.1 11.0 11.7 9.9 9.8 11.2 10.6 9.9Cass 7.2 7.9 6.0 8.0 6.3 6.0 5.1 3.4 4.5 5.1 5.0Charlevoix 5.1 6.3 5.4 6.1 3.7 6.9 6.5 7.1 4.5 6.8 4.8Cheboygan 5.2 5.6 7.4 4.2 4.8 4.1 5.9 5.3 4.8 6.2 5.3Chippewa 4.0 4.5 6.3 4.0 6.0 4.2 4.5 6.2 4.5 7.8 4.1Clare 7.9 8.0 7.7 4.9 5.6 7.2 7.0 5.5 5.1 5.9 6.0Clinton 6.1 4.9 5.4 5.8 4.2 2.3 1.2 1.5 2.3 3.6 2.6Crawford 6.4 5.3 3.1 3.7 3.8 4.8 6.3 4.0 3.5 5.6 5.1
Delta 1.1 1.2 1.0 2.0 * 1.0 1.0 * 1.4 1.8 2.3Dickinson * * - * - * * * 2.0 * 2.5Eaton 9.0 11.4 9.1 8.9 9.0 5.2 3.1 3.8 6.1 6.9 10.2Emmet 5.9 7.6 7.5 5.7 5.2 5.1 7.6 7.3 4.9 7.3 5.4Genesee 17.2 15.8 15.6 17.9 16.7 16.2 16.7 16.6 16.9 16.6 16.4Gladwin 7.4 6.1 8.3 6.9 4.8 3.7 5.6 7.3 4.9 4.1 3.1Gogebic * - - - - - - - * * *Grand Traverse 8.6 9.3 9.4 8.3 8.6 8.4 8.2 7.7 8.4 6.9 9.5Gratiot 7.0 5.9 6.9 5.6 4.7 4.4 3.4 3.9 4.8 3.7 6.1Hillsdale 4.9 5.3 4.4 5.3 3.9 3.3 4.5 4.3 3.8 4.5 3.4
Page 15

Table H-2Abortion Rates by County of Residence,
State of Michigan, Michigan Counties and Detroit City, 2006 - 2016
County 2006 2007 2008 2009 2010 2011 2012 2013 2014 2015 2016
Houghton 2.1 1.4 1.0 * * * * * 2.0 * 1.8Huron 5.1 5.2 4.8 4.7 5.3 6.0 4.1 6.3 5.3 4.5 5.0Ingham 15.0 14.2 13.3 12.4 11.3 8.1 5.7 6.0 7.6 8.5 7.8Ionia 8.4 5.7 6.8 5.9 5.4 4.0 4.7 3.2 4.3 4.8 4.6Iosco 7.6 5.4 6.9 6.5 4.9 8.4 6.0 9.6 7.8 6.3 4.2Iron * * - - - - - - * - *Isabella 6.1 8.0 6.2 5.4 5.5 4.6 4.8 5.0 5.6 5.0 4.5Jackson 10.9 9.7 11.5 10.5 10.0 9.2 9.8 9.2 11.3 9.9 9.6Kalamazoo 14.9 14.0 15.1 13.6 13.0 12.9 12.4 11.5 11.8 11.6 10.5Kalkaska 4.1 4.6 4.3 3.8 3.6 52.0 4.3 4.0 4.4 2.5 4.8
Kent 11.8 11.9 11.7 10.5 9.0 7.7 9.3 8.9 9.6 9.1 9.2Keweenaw - * - * * - - - - - *Lake 4.8 6.7 8.7 5.8 4.6 2.6 5.3 4.7 5.4 * *Lapeer 6.7 5.7 5.6 6.4 7.6 5.6 6.0 6.9 8.6 6.9 7.3Leelanau 7.7 5.4 7.0 9.2 6.3 5.9 4.8 7.2 5.0 3.9 4.9Lenawee 5.9 5.9 7.6 4.6 6.0 5.5 5.8 6.5 7.3 7.5 5.7Livingston 6.5 7.2 7.0 6.4 6.9 6.5 6.9 8.4 7.2 8.4 6.9Luce * * - * * 6.0 4.8 * * - *Mackinac 8.2 7.9 9.1 12.3 7.7 7.7 9.0 13.8 9.2 7.9 9.6Macomb 12.5 12.3 12.1 10.0 11.1 12.3 12.5 15.8 16.7 17.1 16.6
Manistee 8.1 7.3 6.7 7.9 7.2 6.7 4.9 4.6 3.7 4.9 7.0Marquette 5.5 2.9 2.7 2.2 1.4 1.8 2.6 1.7 3.4 3.3 5.4Mason 5.8 8.3 7.1 5.3 3.9 7.6 5.5 5.6 3.3 5.7 5.6Mecosta 6.0 5.8 5.7 5.4 5.9 5.4 3.5 4.8 5.2 7.1 5.3Menominee - - * * - - - - * * 1.7Midland 6.5 5.4 5.2 6.7 6.7 4.2 5.3 4.0 6.3 4.1 5.0Missaukee 7.5 5.8 7.8 5.3 8.3 4.1 2.5 3.7 6.2 6.2 3.8Monroe 5.9 5.2 5.7 4.3 6.6 6.6 7.0 7.4 8.0 7.0 7.2Montcalm 7.0 5.7 7.0 7.5 5.6 3.8 4.9 3.7 5.4 4.3 5.2Montmorency 6.6 9.1 4.7 4.9 5.8 5.9 3.4 6.3 * 7.3 5.5
Page 16

Table H-2Abortion Rates by County of Residence,
State of Michigan, Michigan Counties and Detroit City, 2006 - 2016
County 2006 2007 2008 2009 2010 2011 2012 2013 2014 2015 2016
Muskegon 12.4 10.1 7.7 6.8 4.8 5.2 5.6 9.5 8.5 9.5 9.6Newaygo 5.6 4.4 3.6 4.5 4.0 2.9 2.9 3.6 3.7 3.4 3.1Oakland 9.1 7.7 10.0 9.5 11.5 12.0 11.5 14.3 15.2 15.1 14.5Oceana 4.2 6.0 4.9 5.1 1.8 3.5 3.7 3.6 4.5 4.1 6.0Ogemaw 6.2 6.3 3.3 5.1 7.7 7.0 5.5 7.3 6.6 5.1 4.5Ontonagon - - - - - - - - * * *Osceola 4.7 5.5 7.6 5.0 4.8 5.2 4.1 4.5 7.1 5.3 5.8Oscoda 4.4 5.3 10.2 10.0 5.1 * * 7.0 * 5.4 *Otsego 5.2 6.2 6.7 6.4 6.0 5.4 7.1 6.5 5.5 5.7 9.5Ottawa 5.6 5.4 5.1 4.6 3.6 3.7 4.2 4.5 4.6 4.4 3.4
Presque Isle 3.0 3.2 6.1 5.8 6.0 8.1 4.4 3.6 4.2 6.1 4.9Roscommon 8.2 8.2 9.3 7.3 11.8 7.8 7.4 8.5 6.4 7.9 7.5Saginaw 13.5 15.0 14.3 14.6 12.4 13.0 11.5 13.2 13.0 13.6 14.3St Clair 9.1 8.6 8.8 7.5 9.2 8.9 7.8 9.7 9.1 9.8 10.0St Joseph 7.1 6.5 6.0 6.8 7.5 6.4 5.2 5.5 5.5 5.8 6.3Sanilac 5.9 5.7 5.2 4.2 5.1 3.7 3.4 4.0 4.9 8.1 4.1Schoolcraft * 5.3 * * * * * 4.2 * * *Shiawassee 7.4 7.7 7.4 7.5 6.0 6.3 5.8 5.8 4.5 4.9 5.9Tuscola 7.1 7.6 6.4 5.7 8.0 4.9 6.4 4.9 5.1 5.1 6.3Van Buren 9.7 9.6 9.6 9.3 9.7 8.0 7.7 5.8 7.6 7.4 6.5
Washtenaw 12.6 12.4 11.4 11.9 13.0 12.5 12.0 11.9 11.3 10.5 10.0Wayne 20.3 20.8 24.5 19.4 22.5 24.6 24.9 29.3 29.8 29.2 28.7
Detroit 29.8 31.9 38.1 29.0 33.2 37.3 37.9 32.3 43.1 43.1 43.6Wayne ExcludingDetroit 12.9 12.4 14.4 12.4 14.9 15.6 15.8 18.7 20.2 19.6 18.9
Wexford 7.4 9.5 8.1 7.5 5.5 4.6 5.7 4.4 6.9 7.5 6.7
Note: Rates are per 1,000 females ages 15-44.- A dash indicates quantity zero. *Figure does not meet standards of reliability or precision.
Source: 2006 - 2016 Michigan Abortion Files, Division for Vital Records & Health Statistics, Michigan Department of Health & Human Services. 2000-2015 Population Estimates (latest update 6/2015), National Center for Health Statistics, U.S. Census Populations With Bridged Race Categories. .
Page 17

12.
Table 1Number of Reported Induced Abortions
by County of ResidenceMichigan Residents, 2016
County ofResidence Number
County ofResidence(continued)
Number County ofResidence(continued)
Number
Michigan 25,348
Alcona 7 Gratiot 43 Missaukee 9Alger 4 Hillsdale 27 Monroe 191Allegan 91 Houghton 12 Montcalm 55Alpena 27 Huron 23 Montmorency 6Antrim 10 Ingham 542 Muskegon 302Arenac 11 Ionia 50 Newaygo 24Baraga 5 Iosco 14 Oakland 3,361Barry 43 Iron 3 Oceana 25Bay 135 Isabella 87 Ogemaw 14Benzie 4 Jackson 267 Ontonagon 1Berrien 185 Kalamazoo 601 Osceola 22Branch 33 Kalkaska 13 Oscoda 4Calhoun 246 Kent 1,211 Otsego 38Cass 42 Keweenaw 1 Ottawa 201Charlevoix 19 Lake 4 Presque Isle 8Cheboygan 19 Lapeer 107 Roscommon 22Chippewa 26 Leelanau 14 Saginaw 511Clare 28 Lenawee 97 Saint Clair 276Clinton 36 Livingston 219 Saint Joseph 67Crawford 10 Luce 2 Sanilac 27Delta 13 Mackinac 14 Schoolcraft 5Dickinson 10 Macomb 2,707 Shiawassee 71Eaton 205 Manistee 23 Tuscola 56Emmet 30 Marquette 73 Van Buren 84Genesee 1,272 Mason 25 Washtenaw 834Gladwin 11 Mecosta 47 Wayne 10,101Gogebic 2 Menominee 6 Wexford 37Gd Traverse 153 Midland 75
Note: Reports with unknown county of residence are included in the 'Michigan' total only.
Source: 2016 File of Michigan Resident Induced Abortions Occurring in Michigan, Division for Vital Records & Health Statistics, Michigan Department of Health & Human Services.
Page 18

13.
Table 2Number of Reported Induced Abortions
by County of Residence and Age of WomanMichigan Residents, 2016
County ofResidence Total Age of Woman
< 20 20-24 25-29 30-34 35-39 40+
Michigan 25,348 2,413 8,069 7,549 4,139 2,336 756
Alcona 7 [......(4)......] [................(3).................]Alger 4 [........................(4).........................]Allegan 91 13 31 27 [..........(20)...........]Alpena 27 8 9 5 [...........(5)...........]Antrim 10 [...........(3)...........] 3 [......(4)......]Arenac 11 [......(4)......] [......(3)......] [......(4)......]Baraga 5 [........................(5).........................]Barry 43 4 10 14 8 [......(7)......]Bay 135 18 44 38 16 14 5Benzie 4 [........................(4).........................]
Berrien 185 16 60 58 31 13 7Branch 33 [.....(12)......] 6 9 [......(6)......]Calhoun 246 25 79 53 48 30 9Cass 42 10 12 6 10 [......(4)......]Charlevoix 19 [......(9)......] [......(6)......] [......(4)......]Cheboygan 19 [......(9)......] [......(7)......] [......(3)......]Chippewa 26 [......(7)......] 13 [...........(6)...........]Clare 28 [.....(12)......] 11 [...........(5)...........]Clinton 36 5 11 8 [..........(11)...........]Crawford 10 [...........(6)...........] [...........(4)...........]
Delta 13 [...........(5)...........] 4 [......(4)......]Dickinson 10 [...........(5)...........] [...........(5)...........]Eaton 205 22 67 54 31 27 4Emmet 30 3 9 8 4 [......(6)......]Genesee 1,272 122 437 350 206 124 33Gladwin 11 [......(5)......] [................(6).................]Gogebic 2 [........................(2)........................]Grand Traverse 153 21 46 44 30 8 4Gratiot 43 [.....(19)......] 17 [...........(7)...........]Hillsdale 27 [.....(12)......] 10 [...........(5)...........]
Page 19

Table 2Number of Reported Induced Abortions
by County of Residence and Age of WomanMichigan Residents, 2016
County ofResidence Total Age of Woman
< 20 20-24 25-29 30-34 35-39 40+Houghton 12 4 [....................(8)....................]Huron 23 [......(9)......] 6 [...........(8)...........]Ingham 542 73 197 140 76 41 14Ionia 50 [.....(23)......] 12 10 [......(4)......]Iosco 14 [......(7)......] 3 [...........(4)...........]Iron 3 [........................(3)........................]Isabella 87 12 44 20 7 [......(4)......]Jackson 267 25 92 79 45 22 4Kalamazoo 601 87 221 150 84 37 21Kalkaska 13 [......(5)......] [................(8).................]
Kent 1,211 117 417 353 198 102 23Keweenaw 1 [........................(1)........................]Lake 4 [........................(4)........................]Lapeer 107 18 26 31 19 10 3Leelanau 14 [...........(6)...........] 5 [......(3)......]Lenawee 97 17 28 25 13 10 4Livingston 219 28 70 59 34 20 6Luce 2 [........................(2)........................]Mackinac 14 [...........(5)...........] 5 [......(4)......]Macomb 2,707 251 820 773 490 272 95
Manistee 23 [.....(12)......] 5 [...........(6)...........]Marquette 73 10 30 15 8 [......(9)......]Mason 25 [.....(13)......] 8 [...........(4)...........]Mecosta 47 4 18 11 10 [......(4)......]Menominee 6 [........................(6)........................]Midland 75 9 23 24 12 [......(7)......]Missaukee 9 [........................(9)........................]Monroe 191 24 49 58 30 21 8Montcalm 55 5 17 17 11 [......(5).....]Montmorency 6 [........................(6)........................]
Page 20

Table 2Number of Reported Induced Abortions
by County of Residence and Age of WomanMichigan Residents, 2016
County ofResidence Total Age of Woman
< 20 20-24 25-29 30-34 35-39 40+Muskegon 302 45 81 89 57 22 8Newaygo 24 3 10 5 [...........(6)...........]Oakland 3,361 245 959 993 598 414 146Oceana 25 3 13 3 3 [......(3)......]Ogemaw 14 [......(7)......] 3 [...........(4)...........]Ontonagon 1 [........................(1)........................]Osceola 22 [......(6)......] 7 5 [......(4)......]Oscoda 4 [........................(4)........................]Otsego 38 7 12 9 6 [......(3)......]Ottawa 201 36 72 39 23 23 8
Presque Isle 8 4 [....................(4)....................]Roscommon 22 3 6 4 4 [......(5)......]Saginaw 511 55 199 140 67 39 11Saint Clair 276 33 86 90 36 24 7Saint Joseph 67 7 27 14 12 [......(7)......]Sanilac 27 5 8 8 3 [......(3)......]Schoolcraft 5 [........................(5)........................]Shiawassee 71 6 21 17 20 3 4Tuscola 56 5 19 17 8 [......(6)......]Van Buren 84 9 31 21 15 [......(3)......]
Washtenaw 834 70 262 236 134 99 28Wayne 10,101 889 3,204 3,274 1,593 824 269Wexford 37 3 13 12 5 [......(4)......]
Note: Reports with unknown age of woman are included in the 'Total' column only. Reports with unknown county of residence are included in the 'Michigan' row only. The brackets "[_]" are used to indicate groups that have been combined so that counts less than three are not displayed, and the number "(_)" indicates the total count of reported cases in the combined groups.
Source: 2016 File of Michigan Resident Induced Abortions Occurring in Michigan, Division for Vital Records & Health Statistics, Michigan Department of Health & Human Services.
Page 21
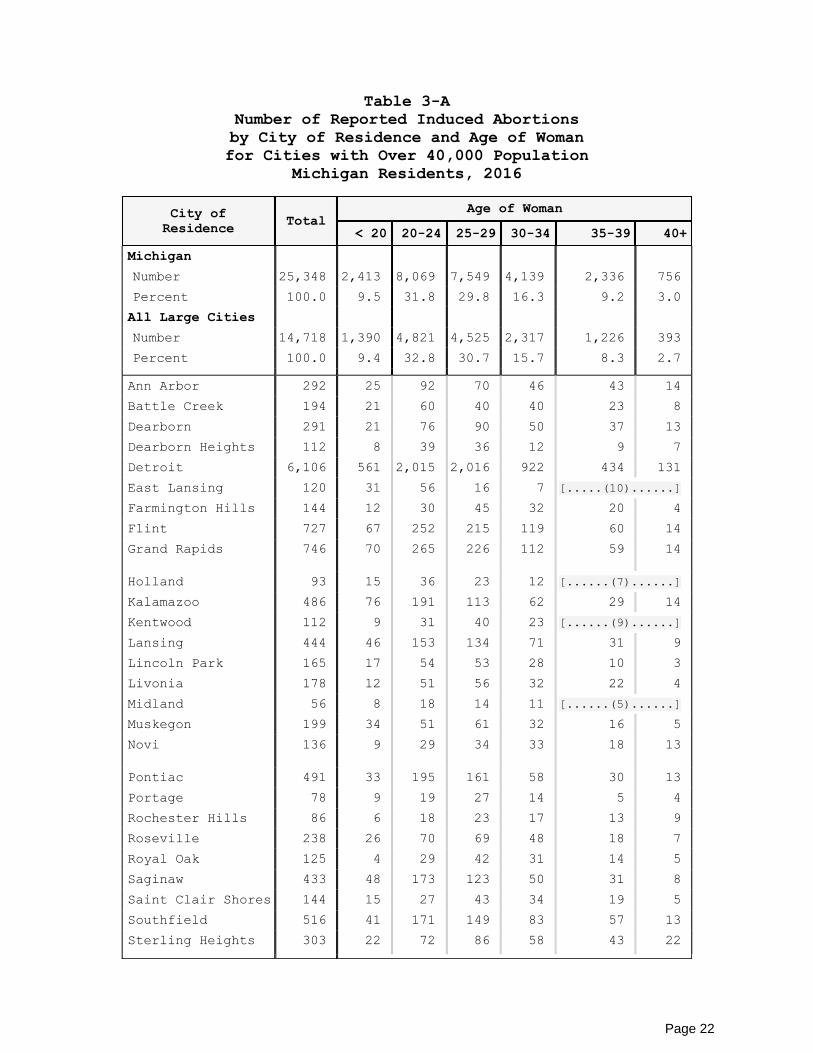
14.
Table 3-ANumber of Reported Induced Abortionsby City of Residence and Age of Womanfor Cities with Over 40,000 Population
Michigan Residents, 2016
City ofResidence Total Age of Woman
< 20 20-24 25-29 30-34 35-39 40+ Michigan Number 25,348 2,413 8,069 7,549 4,139 2,336 756Percent 100.0 9.5 31.8 29.8 16.3 9.2 3.0All Large Cities Number 14,718 1,390 4,821 4,525 2,317 1,226 393Percent 100.0 9.4 32.8 30.7 15.7 8.3 2.7Ann Arbor 292 25 92 70 46 43 14Battle Creek 194 21 60 40 40 23 8Dearborn 291 21 76 90 50 37 13Dearborn Heights 112 8 39 36 12 9 7Detroit 6,106 561 2,015 2,016 922 434 131East Lansing 120 31 56 16 7 [.....(10)......]Farmington Hills 144 12 30 45 32 20 4Flint 727 67 252 215 119 60 14Grand Rapids 746 70 265 226 112 59 14
Holland 93 15 36 23 12 [......(7)......]Kalamazoo 486 76 191 113 62 29 14Kentwood 112 9 31 40 23 [......(9)......]Lansing 444 46 153 134 71 31 9Lincoln Park 165 17 54 53 28 10 3Livonia 178 12 51 56 32 22 4Midland 56 8 18 14 11 [......(5)......]Muskegon 199 34 51 61 32 16 5Novi 136 9 29 34 33 18 13
Pontiac 491 33 195 161 58 30 13Portage 78 9 19 27 14 5 4Rochester Hills 86 6 18 23 17 13 9Roseville 238 26 70 69 48 18 7Royal Oak 125 4 29 42 31 14 5Saginaw 433 48 173 123 50 31 8Saint Clair Shores 144 15 27 43 34 19 5Southfield 516 41 171 149 83 57 13Sterling Heights 303 22 72 86 58 43 22
Page 22

Table 3-ANumber of Reported Induced Abortionsby City of Residence and Age of Womanfor Cities with Over 40,000 Population
Michigan Residents, 2016
City ofResidence Total Age of Woman
< 20 20-24 25-29 30-34 35-39 40+ Taylor 351 24 110 123 59 26 9Troy 141 7 21 34 33 33 12Warren 647 64 225 189 100 52 15Westland 427 38 140 145 64 33 7Wyoming 137 11 52 29 24 15 6
Note: Reports with unknown age of woman are included in the 'Total' column only. Reports with unknown place of residence are included in the 'Michigan' total row only. Population based upon the 2000 Census. The brackets "[_]" are used to indicate age groups that have been combined so that counts less than three are not displayed, and the number "(_)" indicates the total count of reported cases in the combined groups.
Source: 2016 File of Michigan Resident Induced Abortions Occurring in Michigan, Division for Vital Records & Health Statistics, Michigan Department of Health & Human Services.
Page 23

15.
Table 3-BNumber of Reported Induced Abortionsby Area of Residence and Age of Womanfor Selected Large Metropolitan Areas
Michigan Residents, 2016
Area ofResidence Total Age of Woman
< 20 20-24 25-29 30-34 35-39 40+MichiganNumber 25,348 2,413 8,069 7,549 4,139 2,336 756Percent 100.0 9.5 31.8 29.8 16.3 9.2 3.0Metro Total Number 21,140 1,909 6,716 6,409 3,446 1,952 640Percent 100.0 9.0 31.8 30.3 16.3 9.2 3.0Genesee County 1,272 122 437 350 206 124 33Ingham County 542 73 197 140 76 41 14Kalamazoo County 601 87 221 150 84 37 21Kent County 1,211 117 417 353 198 102 23Macomb County 2,707 251 820 773 490 272 95Oakland County 3,361 245 959 993 598 414 146Saginaw County 511 55 199 140 67 39 11Washtenaw County 834 70 262 236 134 99 28Wayne County(Excl. Detroit) 3,995 328 1,189 1,258 671 390 138Detroit City 6,106 561 2,015 2,016 922 434 131
Note: Reports with unknown age of woman are included in the 'Total' column only. Reports with unknown place of residence are included in the 'Michigan' row only. Source: 2016 File of Michigan Resident Induced Abortions Occurring in Michigan, Division for Vital Records & Health Statistics, Michigan Department of Health & Human Services.
Page 24

16.
Table 4Number of Reported Induced Abortions
by County of Residenceand Number of Previous Induced Abortions
Michigan Residents, 2016County ofResidence Total Previous Induced Abortions
None One Two + MichiganNumber 25,348 12,951 6,551 5,832Percent 100.0 51.1 25.8 23.0Alcona 7 3 [.............(4)..............]Alger 4 [....................(4).....................]Allegan 91 62 20 9Alpena 27 22 [.............(5)..............]Antrim 10 [...................(10).....................]Arenac 11 6 [.............(5)..............]Baraga 5 [...................(5).....................]Barry 43 27 12 4Bay 135 100 24 11Benzie 4 [...................(4).....................]
Berrien 185 120 41 24Branch 33 21 9 3Calhoun 246 145 69 32Cass 42 33 [..............(9).............]Charlevoix 19 14 [..............(5).............]Cheboygan 19 11 [.............(8)..............]Chippewa 26 16 [.............(9)..............]Clare 28 23 [.............(5)..............]Clinton 36 25 [............(11)..............]Crawford 10 [....................(10)....................]
Delta 13 [....................(13)....................]Dickinson 10 [...................(10).....................]Eaton 205 114 58 33Emmet 30 22 [..............(8).............]Genesee 1,272 661 338 273Gladwin 11 6 [.............(5)..............]Gogebic 2 [....................(2)....................]Grand Traverse 153 106 34 13Gratiot 43 34 [...............(9).............]Hillsdale 27 24 [...............(3).............]
Page 25

Table 4Number of Reported Induced Abortions
by County of Residenceand Number of Previous Induced Abortions
Michigan Residents, 2016County ofResidence Total Previous Induced Abortions
None One Two + Houghton 12 [...................(12).....................]Huron 23 13 5 5Ingham 542 335 130 77Ionia 50 32 10 8Iosco 14 [...................(14).....................]Iron 3 [....................(3).....................]Isabella 87 68 13 6Jackson 267 165 64 38Kalamazoo 601 344 166 90Kalkaska 13 9 [...............(4).............]
Kent 1,211 760 293 158Keweenaw 1 [....................(1)....................]Lake 4 [....................(4)....................]Lapeer 107 70 21 16Leelanau 14 11 [.............(3)..............]Lenawee 97 60 31 6Livingston 219 137 51 31Luce 2 [....................(2)....................]Mackinac 14 9 [.............(5)..............]Macomb 2,707 1,333 770 604
Manistee 23 14 [.............(9)..............]Marquette 73 59 10 4Mason 25 18 4 3Mecosta 47 35 7 5Menominee 6 [....................(6)....................]Midland 75 46 19 10Missaukee 9 6 [.............(3)..............]Monroe 191 118 52 21Montcalm 55 47 [.............(8)..............]Montmorency 6 [....................(6)....................]
Muskegon 302 189 73 40Newaygo 24 13 [............(11)..............]Oakland 3,361 1,741 830 787Oceana 25 18 [.............(7)..............]
Page 26

Table 4Number of Reported Induced Abortions
by County of Residenceand Number of Previous Induced Abortions
Michigan Residents, 2016County ofResidence Total Previous Induced Abortions
None One Two + Ogemaw 14 9 [.............(5)..............]Ontonagon 1 [....................(1)....................]Osceola 22 15 [.............(7)..............]Oscoda 4 [....................(4)....................]Otsego 38 31 [.............(7)..............]Ottawa 201 149 35 17
Presque Isle 8 [.....................(8)....................]Roscommon 22 17 [.............(5)..............]Saginaw 511 287 128 96Saint Clair 276 168 63 45Saint Joseph 67 48 15 4Sanilac 27 20 [.............(7)..............]Schoolcraft 5 [....................(5)....................]Shiawassee 71 48 15 8Tuscola 56 43 9 4Van Buren 84 55 18 11
Washtenaw 834 494 205 135Wayne 10,101 4,189 2,748 3,160Wexford 37 25 9 3
Note: The brackets "[_]" are used to indicate groups that have been combined so that counts less than three are not displayed, and the number "(_)" indicates the total count of reported cases in the combined groups. Reports with unknown previous induced abortions are included in the "Number" total only. Reports with unknown county of residence are included in the 'Michigan' total row only.Source: 2016 File of Michigan Resident Induced Abortions Occurring in Michigan, Division for Vital Records & Health Statistics, Michigan Department of Health & Human Services.
Page 27

17.
Table 5Abortion Distribution by Race and Ancestry of Woman
Michigan Residents, 2016
Age of Mother in Years
Total
Race Ancestry
White Black American Indian
Asian & Pacific
IslanderMultiracial
All Other Races
Hispanic
Total 25,348 10,963 12,794 136 540 407 252 809
<20 2,413 1,074 1,195 8 33 50 29 10920-24 8,069 3,323 4,272 39 111 147 92 29325-29 7,549 3,018 4,090 39 149 120 61 20330-34 4,139 1,944 1,945 20 108 46 39 11735-39 2,336 1,179 967 25 87 39 19 6740+ 756 398 280 4 51 4 11 15
4
Note: Records with race not stated is recorded only in the "All Races" column. Records with age of mother not stated are included only in the "Total" row.
Source: 2016 File of Michigan Resident Induced Abortions Occurring in Michigan, Division for Vital Records & Health Statistics, Michigan Department of Health & Human Services
Page 28

18.
Table 6Number and Percent of Reported Induced Abortions
by Age of Woman and Marital StatusMichigan Residents, 2016
Age of Woman
Marital Status
Total Not Married Married
Number Percent Number Percent
All Ages 25,348 22,688 89.5 2,575 10.2
Under 20 2,413 2,385 98.8 20 0.8
20 - 24 8,069 7,795 96.6 262 3.2
25 - 29 7,549 6,870 91.0 660 8.7
30 - 34 4,139 3,352 81.0 780 18.8
35 - 39 2,336 1,714 73.4 611 26.2
40 or Older 756 520 68.8 235 31.1
Note: Reports with unknown age of woman are included in the 'All Ages' row only. Reports with unknown marital status are included in the 'Total' column only.
Source: 2016 File of Michigan Resident Induced Abortions Occurring in Michigan, Division for Vital Records & Health Statistics, Michigan Department of Health & Human Services.
Page 29

19.
Table 7Number and Percent of Reported Induced Abortions
by Source of Referral and Age of WomanMichigan Residents, 2016
Age ofWoman
Source of Referral
Total Physician Self Friend or
Family Clergy SocialAgency
HealthDepartment
Family PlanningAgency
No. % No. % No. % No. % No. % No. % No. %
All Ages 25,348 561 2.2 21,695 85.6 2,402 9.5 22 0.1 5 0.0 17 0.1 643 2.5Under 20 2,413 52 2.2 1,956 81.1 305 12.6 3 0.1 1 0.0 3 0.1 93 3.9 20 - 24 8,069 149 1.8 6.770 83.9 909 11.3 7 0.1 2 0.0 5 0.1 226 2.8 25 - 29 7,549 156 2.1 6,535 86.6 683 9.0 5 0.1 2 0.0 4 0.1 164 2.2 30 - 34 4,139 93 2.2 3,636 87.8 303 7.3 4 0.1 - - 3 0.1 98 2.435 - 39 2,336 77 3.3 2,063 88.3 151 6.5 3 0.1 - - 1 0.0 41 1.8
40 or Older 756 28 3.7 662 87.6 44 5.8 - - - - 1 0.1 21 2.8
Note: Reports with source of referral not reported are included in the 'Total' column only. Reports with age of woman not reported are included in the 'All Ages' row only.
-: A dash indicates quantity zero.
0.0: Quantity more than zero but less than 0.05.
Source: 2016 File of Michigan Resident Induced Abortions Occurring in Michigan, Division for Vital Records & Health Statistics, Michigan Department of Health & Human Services.
Page 30

20.
Table 8Number and Percent of Reported Induced Abortions
by the Number of Previous PregnanciesCarried to Term and Marital Status
Michigan Residents, 2016
Marital Status Total
Previous Pregnancies Carried to Term
None One Two Three Four Five or More
No. % No. % No. % No. % No. % No. %
Total 25,348 8,871 35.0 6,889 27.2 5,444 21.5 2,439 9.6 1,018 4.0 675 2.7Not Married 22,688 8,465 37.3 6,277 27.7 4,546 20.0 1,979 8.7 843 3.7 575 2.4 Married 2,575 383 14.9 589 22.9 882 34.3 454 17.6 172 6.7 95 3.7
Note: Term pregnancies are those which lasted 37 weeks or longer, regardless of the outcome. Reports with term pregnancies not reported are included in the "Total" column only. Reports with marital status not reported are included in the "Total" row only.
Source: 2016 File of Michigan Resident Induced Abortions Occurring in Michigan, Division for Vital Records & Health Statistics, Michigan Department of Health & Human Services.
Page 31

21.
Table 9Number and Percent of Reported Induced Abortions by Age of Woman
and Number of Previous Spontaneous AbortionsMichigan Residents, 2016
Age ofWoman
Previous Spontaneous Abortions
Total None One Two Three or More
No. % No. % No. % No. %
All Ages 25,348 20,069 79.2 3,964 15.6 965 3.8 339 1.3 Under 20 2,413 2,322 96.2 77 3.2 11 0.5 2 0.120 - 24 8,069 6,981 86.5 912 11.3 136 1.7 40 0.525 - 29 7,549 5,831 77.2 1,338 17.7 289 3.8 90 1.2 30 - 34 4,139 2,870 69.3 900 21.7 265 6.4 104 2.535 - 39 2,336 1,533 65.6 536 22.9 198 8.5 69 3.0
40 or Older 756 481 63.6 183 24.2 59 7.8 33 4.4
Note: Reports with unknown age of woman are included in the 'All Ages' row only. Reports with previous spontaneous abortions not reported are included in the 'Total' column only.
Source: 2016 File of Michigan Resident Induced Abortions Occurring in Michigan, Division for Vital Records & Health Statistics, Michigan Department of Health & Human Services.
Page 32

22.
Table 11Number and Percent of Reported
Induced Abortionsby Race or Hispanic Ancestry of
Woman, Michigan Residents, 2016
Race of Woman Number Percent
All Races 25,348 100.0
White 10,963 43.2
Black 12,794 50.5
American Indian 136 0.5
Asian & Pacific Islander 540 2.1
Multiracial 407 1.6
Other 252 1.0
Hispanic Ancestry 809 3.2
Note: Abortions with unknown or not reported race of woman are included in "All Races" row only.
Source: 2016 File of Reported Induced Abortions Occurring in Michigan, Division for Vital Records & Health Statistics, Michigan Department of Health & Human Services.
Page 33

23.
Table 12Number and Percent of Reported Induced Abortions
by Race of Woman or Hispanic Ancestryand Marital Status
Michigan Residents, 2016
Race of Woman
Marital Status
Total Not Married Married
Number Percent Number Percent
All Races 25,348 22,688 89.5 2,575 10.2
White 10,963 9,402 85.8 1,523 13.9
Black 12,794 12,151 95.0 611 4.8
American Indian 136 79 58.1 56 41.2
Asian & Pacific Islander 540 288 53.3 250 46.3
Multiracial 407 368 90.4 38 9.3
Other 252 196 77.8 56 22.2
Hispanic Ancestry 809 694 85.8 113 14.0
Note: Reports with unknown race of woman are included in the 'All Races' row only. Reports with unknown marital status are included in the 'Total' column only.
Source: 2016 File of Michigan Resident Induced Abortions Occurring in Michigan, Division for Vital Records & Health Statistics, Michigan Department of Health & Human Services.
Page 34

24.
Table 13Number and Percent of Reported Induced Abortions
by Race of Woman or Hispanic Ancestry andNumber of Previous Spontaneous Abortions
Michigan Residents, 2016
Race ofWoman
Previous Spontaneous Abortions
TotalNone One Two or More
Number Percent Number Percent Number Percent
All Races 25,348 20,069 79.2 3,964 15.6 1,304 5.1
White 10,963 8,903 81.2 1,517 13.8 543 5.0
Black 12,794 9,871 77.2 2,225 17.4 693 5.4
American Indian 136 112 82.4 17 12.5 7 5.1
Asian & Pacific Islander 540 459 85.0 63 11.7 17 3.1
Multiracial 407 323 79.4 68 16.7 16 3.9
Other 252 190 75.4 42 16.7 20 7.9
Hispanic Ancestry 809 656 81.1 121 15.0 32 4.0
Note: Reports with unknown race of woman are included in the 'All Races' row only. Reports with previous spontaneous abortions not reported are included in the 'Total' column only.
Source: 2016 File of Michigan Resident Induced Abortions Occurring in Michigan, Division for Vital Records & Health Statistics, Michigan Department of Health & Human Services.
Page 35

25.
Table 14Number and Percent of Reported Induced Abortions
by the Source of Paymentand Race of Woman or Hispanic Ancestry
Michigan Residents, 2016
Race of Woman
Source of Payment
All Sources Insurance Self Pay
Number Percent Number Percent
All Races 25,348 1,873 7.4 23,469 92.6
White 10,963 1,144 10.4 9,816 89.5
Black 12,794 478 3.7 12,314 96.2
American Indian 136 17 12.5 119 87.5
Asian & Pacific Islander 540 93 17.2 446 82.6
Multiracial 407 117 28.7 290 71.3
Other 252 10 4.0 242 96.0
Hispanic Ancestry 809 90 11.1 719 88.9
Note: Reports with race of woman not reported are included in the 'All Races' row only. Reports with unknown source of payment are included in the 'Total' column only.
Source: 2016 File of Michigan Resident Induced Abortions Occurring in Michigan, Division for Vital Records & Health Statistics, Michigan Department of Health & Human Services.
Page 36

26.
Table 15Number and Percent of Reported Induced Abortions
by Race or Hispanic Ancestry and Age of WomanMichigan Residents, 2016
Race of Woman
Age of Woman
All Ages
Under 20 20 - 24 25 - 29 30 - 34 35 or Older
No. % No. % No. % No. % No. %
All Races 25,348 2,413 9.5 8,069 31.8 7,549 29.8 4,139 16.3 3,092 12.2
White 10,963 1,074 9.8 3,323 30.3 3,018 27.5 1,944 17.7 1,577 14.4
Black 12,794 1,195 9.3 4,272 33.4 4,090 32.0 1,945 15.2 1,247 9.7
American Indian 136 8 5.9 39 28.7 39 28.7 20 14.7 29 21.3
Asian & Pacific Islander 540 33 6.1 111 20.6 149 27.6 108 20.0 138 25.6
Multiracial 407 50 12.3 147 36.1 120 29.5 46 11.3 43 10.6
Other 252 29 11.5 92 36.5 61 24.2 39 15.5 30 11.9
Hispanic Ancestry 809 109 13.5 293 36.2 203 25.1 117 14.5 82 10.1
Note: Reports with age of woman not reported are included in the 'All Ages' column only. Reports with race of woman not reported are included in the 'All Races' row only.
Source: 2016 File of Michigan Resident Induced Abortions Occurring in Michigan, Division for Vital Records & Health Statistics, Michigan Department of Health & Human Services.
Page 37

27.
Table 16Number and Percent of Reported Induced
Abortionsby the Source of Payment
and Age of WomanMichigan Residents, 2016
Age of Woman
Source of Payment
All Sources Insurance Self Pay
Number Percent Number Percent
All Ages 25,348 1,873 7.4 23,469 92.6
Under 20 2,413 185 7.7 2,228 92.3
20 - 24 8,069 527 6.5 7,541 93.5
25 - 29 7,549 537 7.1 7,011 92.9
30 - 34 4,139 325 7.9 3,813 92.1
35 - 39 2,336 224 9.6 2,111 90.4
40 or Older 756 63 8.3 691 91.4
Note: Reports with age of woman not reported are included in the 'All Ages' row only. Reports with source of payment unknown are included in the "All Sources" column only.
Source: 2016 File of Michigan Resident Induced Abortions Occurring in Michigan, Division for Vital Records & Health Statistics, Michigan Department of Health & Human Services.
Page 38

28.
Table 17Number and Percent of Reported Induced Abortions by Weeks of Gestation
and Principal Procedure, Michigan Occurrences, 2016
Weeks ofGestation1
Principal Procedure
Total
SuctionCurettage
Medical(Non-
Surgical)
Dilation&
Evacuation
Salineor
Prostaglandin
SharpCurettage
(D & C)
Hysterectomyor
HysterotomyOther
Procedures
No. % No. % No. % No. % No. % No. % No. %
Total 26,395 16,791 63.6 7,921 30.0 1,670 6.3 4 0.0 2 0.0 - - 6 0.0
< 5 227 78 34.4 147 64.8 2 0.9 - - - - - - - -
5 - 8 15,799 9,108 57.6 6,675 42.2 14 0.1 - - 1 0.0 - - 1 0.09 - 12 6,543 5,498 84.0 1,025 15.7 17 0.3 - - 1 0.0 - - 2 0.0
13 - 16 2,533 1,855 73.2 20 0.8 658 26.0 - - - - - - - -17 - 20 865 193 22.3 17 2.0 653 75.5 1 0.1 - - - - 1 0.121 - 24 381 27 7.1 23 6.0 325 85.3 3 0.8 - - - - 2 0.525 - 28 5 3 60.0 2 40.0 - - - - - - - - - -Over 28 8 5 62.5 3 37.5 - - - - - - - - - -
Note: Gestational age based on the clinician’s estimate. Reports with weeks of gestation not reported are included in the 'Total' row only. Reports with principal procedure not reported are included in the ''All Procedures' column only. The reporting of procedures used conforms to national recommendations issued by the Centers for Disease Control and Prevention (CDC). In abortions where more than one procedure was performed, the principal procedure was determined according to the following hierachy: hysterectomy/hysterotomy, sharp curettage (D&C), saline injection or prostaglandin, dilation and evacuation, medical (non-surgical), suction curettage, and other procedures.
-: A dash indicates quantity zero. 0.0: Quantity more than zero but less than 0.05.
1This item is reported in compliance with statute MCL 333.2835(6)(a).
Source: 2016 File of Reported Induced Abortions Occurring in Michigan, Division for Vital Records & Health Statistics, Michigan Department of Health & Human Services.
Page 39

29.
Table 18 Number and Percent of Reported Induced Abortions by Weeks of Gestation
and Type of Facility, Michigan Occurrences, 2016
WeeksGestation1
Type of Facility
TotalHospital Hospital
Satellite ClinicFreestanding
OutpatientSurgical Facility
Physician's PrivateOffice Other
Number Percent Number Percent Number Percent Number Percent Number Percent
All Weeks Gestation 26,395 150 0.6 - - 24,752 93.8 1,487 5.6 - -
< 5 227 - - - - 214 94.3 13 5.7 - -5 - 8 15,799 3 0.0 - - 14,773 93.5 1,022 6.5 - -
9 - 12 6,543 9 0.1 - - 6,201 94.8 328 5.0 - -13 - 16 2,533 42 1.7 - - 2,369 93.5 122 4.8 - -17 - 20 865 54 6.2 - - 810 93.6 1 0.1 - -21 - 24 381 39 10.2 - - 342 89.8 - - - -25 - 28 5 - - - - 5 100.0 - - - -Over 28 8 - - - - 8 100.0 - - - -
Note: Gestational age based on the clinician’s estimate. Reports with unknown type of facility are included in the 'Total' column only. Reports with weeks of gestation not reported are included in the 'All Weeks Gestation' row only.
-: A dash indicates quantity zero.0.0 Quantity more than zero but less than 0.05.
1This item is reported in compliance with statute MCL 333.2835(6)(a).
Source: 2016 File of Reported Induced Abortions Occurring in Michigan, Division for Vital Records & Health Statistics, Michigan Department of Health & Human Services.
Page 40

30.
Table 19Number and Percent of Reported Induced Abortions by Principal Procedure
and Type of Facility, Michigan Occurrences, 2016
PrincipalProcedure
Type of Facility
TotalHospital
HospitalSatellite
Clinic
FreestandingOutpatientSurgicalFacility
Physician'sPrivateOffice
Other
No. % No. % No. % No. % No. %
All Procedures 26,395 150 0.6 - - 24,752 93.8 1,487 5.6 - -Suction Curettage 16,791 22 0.1 - - 15,962 95.1 801 4.8 - -Medical (Non-Surgical) 7,921 38 0.5 - - 7,200 90.9 683 8.6 - -Dilation and Evacuation 1,670 83 5.0 - - 1,584 94.9 3 0.2 - -Saline Injection or Prostaglandin 4 4 100.0 - - - - - - - -Sharp Curettage (D&C) 2 - - - - 2 100.0 - - - -Hysterectomy/Hysterotomy - - - - - - - - - - -Other Procedures 6 2 33.3 - - 4 66.7 - - - -
Note: Reports with principal procedure not reported are included in the 'All Procedures' row only. Reports with type of facility unknown are included in the 'Total' column only. The reporting of procedures used has been changed to conform to national recommendations issued by the Centers for Disease Control and Prevention (CDC). In abortions where more than one procedure was performed, the principal procedure was determined according to the following hierachy: hysterectomy/hysterotomy, sharp curettage (D&C), saline injection or prostaglandin, dilation and evacuation, medical (non-surgical), suction curettage and other procedures.
-: A dash indicates quantity zero.0.0 Quantity more than zero but less than 0.05.
Source: 2016 File of Reported Induced Abortions Occurring in Michigan, Division for Vital Records & Health Statistics, Michigan Department of Health & Human Services.
Page 41

31.
Table 20Number, Percent and Rate of Reported Induced Abortions
with Any Mention of Immediate Complication1by Type of Immediate Complication
Michigan Occurrences, 2016
Type of Immediate Complications
2016 2013-2015
Number Rate Number Average Rate
Total Immediate Complications 26 9.9 39 13.0 4.8Shock 8 3.0 3 1.0 0.4Uterine Perforation 1 * 4 1.3 0.5Cervical Laceration 8 3.0 13 4.3 1.6Hemorrhage 10 3.8 11 3.7 1.4Allergic Response - - - - -Death - - - - -Infection 1 * - - -Retained Products - - 7 2.3 0.9Febrile - - 2 0.7 0.2Other Complications 5 1.9 6 2.0 0.7
Note: Abortions with at least one immediate complication may not equal the sum of all the complications specified because a woman may have multiple complications reported.
*:Rate does not meet standards of precision or reliability.-:A dash indicates quantity zero. Rate is per 10,000 induced abortions performed.1This item is reported in compliance with statute MCL 333.2835(6)(c).
Source: 2016 File of Reported Induced Abortions Occurring in Michigan, Division for Vital Records & Health Statistics, Michigan Department of Health & Human Services.
Page 42

32.
Table 21Number of Reported Induced Abortions with Any
Mention of Immediate Complication1
by Selected CharacteristicsMichigan Occurrences, 2016
SelectedCharacteristics Number Selected
Characteristics Number
Age of Woman Principal ProcedureAll Ages 26 All Procedures 26< 20 1 Suction Curettage 1020 - 24 9 Medical (non-surgical) 125 - 29 7 Dilation and Evacuation 1530 - 34 5 Saline or Prostaglandin -35 - 39 3 Sharp Curettage (D & C) -40 + 1 Hysterotomy/Hysterectomy -
Other Procedures -
Weeks of Gestation Type of FacilityTotal 26 All Facilities 26< 5 - Hospital 105 - 08 3 Hospital Satellite Clinic -09 - 12 6 Freestanding Outpatient
Surgical Facility 2513 - 16 317 - 20 7 Physician's Private Office -21 + 7 Other Facilities -
Note: Gestational age based on the clinician’s estimate. The reporting of procedures used conforms to national recommendations issued by the Centers for Disease Control and Prevention (CDC). In abortions where more than one procedure was performed, the principal procedure was determined according to the following hierarchy: hysterectomy/hysterotomy, sharp curettage (D&C), saline injection or prostaglandin, dilation and evacuation, medical (non-surgical), suction curettage and other procedures.
-: A dash indicates quantity zero.
1This item is reported in compliance with statute MCL 333.2835(6)(c).
Source: 2016 Files of Reported Induced Abortions Occurring in Michigan, Division for Vital Records & Health Statistics, Michigan Department of Health & Human Services.
Page 43

33.
Table 22Number of Reported Induced
Abortionsby Evidence of Life
Michigan Occurrences, 2016
Evidence of Life Number
Total Abortions 26,395
Present -
Not Present 26,298
Not Reported 97
Note: Responses in reply to the question: "Did fetus show evidence of life when separated, expelled or removed from the woman?"
-: A dash indicates quantity zero.
Source: 2016 File of Reported Induced Abortions Occurring in Michigan, Division for Vital Records & Health Statistics, Michigan Department of Health & Human Services.
Page 44

34.
Table 23Number and Percent of
Reported Induced Abortionsby Weight of Fetus
Michigan Occurrences, 2016
Weight of Fetus Reported Induced Abortions
Number Percent
All Weights 26,395 100.0
1 - 99 Grams 24 0.1
100 - 399 Grams 547 2.1
400 Grams or More 165 0.6
Not Determinable 25,659 97.2
Source: 2016 File of Reported Induced Abortions Occurring in Michigan, Division for Vital Records & Health Statistics, Michigan Department of Health & Human Services.
Page 45

35.
Table 24Number and Rate
of Reported Induced Abortionswith Any Mention of
Subsequent Complication1
by Type of Subsequent ComplicationMichigan Occurrences, 2016
Type of Subsequent Complications Number Rate
Total Subsequent Complications 11 4.2
Shock - -
Uterine Perforation - -
Cervical Laceration 1 *
Hemorrhage 6 2.3
Allergic Response - -
Death 1 *
Infection - -
Retained Products 4 *
Febrile - -
Other Complications 3 *
Note: Abortions with at least one subsequent complication may not equal the sum of all the complications specified because women may have multiple complications reported.
Rate per 10,000 abortions.
*: Rate does not meet standards of precision or reliability.-: A dash indicates quantity zero.
1This item is reported in compliance with statute MCL 333.2835(6)(c).
Source: 2016 File of Reported Induced Abortions Occurring in Michigan, Division for Vital Records & Health Statistics, Michigan Department of Health & Human Services.
Page 46
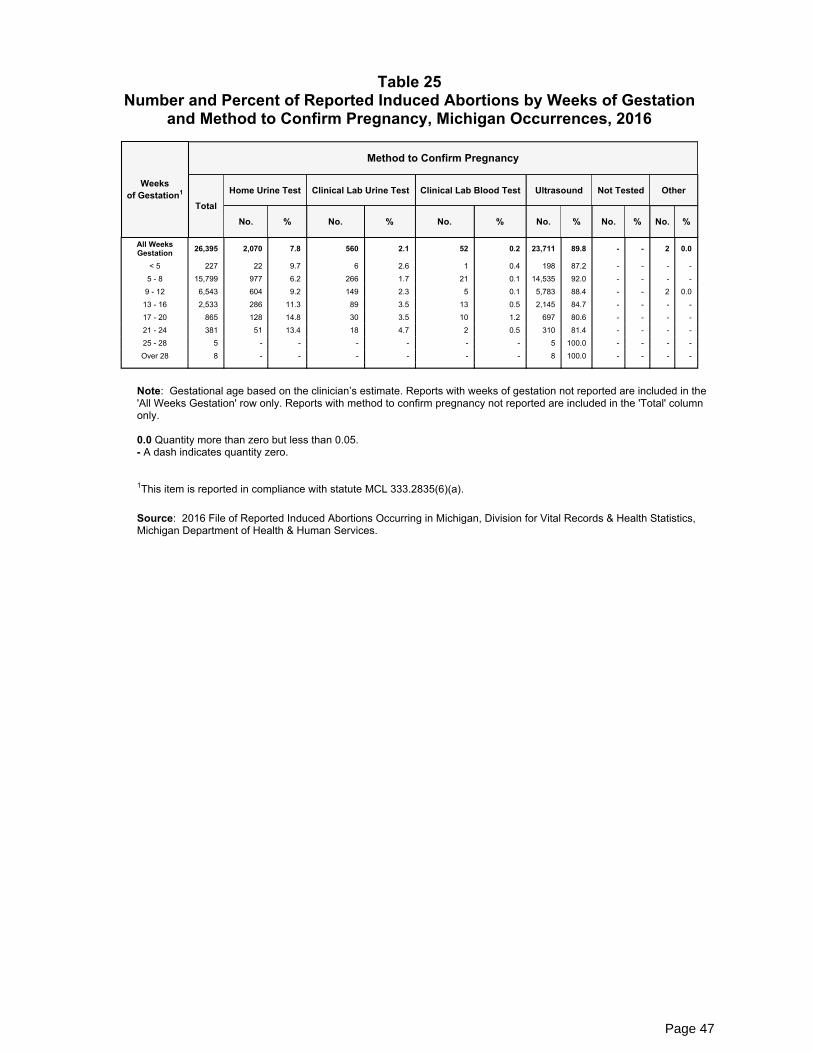
36.
Table 25Number and Percent of Reported Induced Abortions by Weeks of Gestation
and Method to Confirm Pregnancy, Michigan Occurrences, 2016
Weeksof Gestation1
Method to Confirm Pregnancy
Total Home Urine Test Clinical Lab Urine Test Clinical Lab Blood Test Ultrasound Not Tested Other
No. % No. % No. % No. % No. % No. %
All WeeksGestation 26,395 2,070 7.8 560 2.1 52 0.2 23,711 89.8 - - 2 0.0
< 5 227 22 9.7 6 2.6 1 0.4 198 87.2 - - - -5 - 8 15,799 977 6.2 266 1.7 21 0.1 14,535 92.0 - - - -
9 - 12 6,543 604 9.2 149 2.3 5 0.1 5,783 88.4 - - 2 0.013 - 16 2,533 286 11.3 89 3.5 13 0.5 2,145 84.7 - - - -17 - 20 865 128 14.8 30 3.5 10 1.2 697 80.6 - - - -21 - 24 381 51 13.4 18 4.7 2 0.5 310 81.4 - - - -25 - 28 5 - - - - - - 5 100.0 - - - -Over 28 8 - - - - - - 8 100.0 - - - -
Note: Gestational age based on the clinician’s estimate. Reports with weeks of gestation not reported are included in the 'All Weeks Gestation' row only. Reports with method to confirm pregnancy not reported are included in the 'Total' column only.
0.0 Quantity more than zero but less than 0.05.- A dash indicates quantity zero.
1This item is reported in compliance with statute MCL 333.2835(6)(a).
Source: 2016 File of Reported Induced Abortions Occurring in Michigan, Division for Vital Records & Health Statistics, Michigan Department of Health & Human Services.
Page 47

37.
Table 26Number of Reported Induced Abortions with Any Mention of
Subsequent Complication1 by Selected Characteristics, Michigan Occurrences, 2016
SelectedCharacteristics Number Selected
Characteristics Number
Age of Woman Principal ProcedureAll Ages 11 All Procedures 11< 20 2 Suction Curettage 520 - 24 2 Medical (non-surgical) 325 - 29 6 Dilation and Evacuation 230 - 34 1 Saline or Prostaglandin -35 - 39 - Sharp Curettage (D & C) -40 + - Hysterotomy/Hysterectomy -
Other Procedures 1
Weeks of Gestation Type of FacilityTotal 11 All Facilities 11< 5 - Hospital -05 - 08 5 Hospital Satellite Clinic -09 - 12 4 Freestanding Outpatient
Surgical Facility 713 - 16 -17 - 20 1 Physician's Private Office 220 + - Other Facilities -
Note: Gestational age based on the clinician’s estimate. Reports with weeks of gestation not reported are included in the 'Total' row only. Reports with principal procedure not reported are included in the 'All Procedures' row only. The reporting of procedures used conforms to national recommendations issued by the Centers for Disease Control and Prevention (CDC). In abortions where more than one procedure was performed, the principal procedure was determined according to the following hierachy: hysterectomy/hysterotomy, sharp curettage (D&C), saline injection or prostaglandin, dilation and evacuation, medical (non-surgical), suction curettage, and other procedures. Reports with unknown facility type are included in the 'All Facilities' row only.
-: A dash indicates quantity zero.
1This item is reported in compliance with statute MCL 333.2835(6)(c).
Source: 2016 File of Reported Induced Abortions Occurring in Michigan, Division for Vital Records & Health Statistics, Michigan Department of Health & Human Services.
Page 48