indriani sukma university of malayastudentsrepo.um.edu.my/10964/1/indriani.pdf · 2020. 2. 2. ·...
TRANSCRIPT

A STUDY OF THE RELATIONSHIP BETWEEN SOLAR ACTIVITIES AND EARTHQUAKES
INDRIANI SUKMA
FACULTY OF SCIENCE
UNIVERSITY OF MALAYA KUALA LUMPUR
2017
Univers
ity of
Mala
ya

A STUDY OF THE RELATIONSHIP BETWEEN SOLAR ACTIVITIES AND EARTHQUAKES
INDRIANI SUKMA
DISSERTATION SUBMITTED IN FULFILMENT OF
THE REQUIREMENTS FOR THE DEGREE OF MASTER OF SCIENCE
DEPARTMENT OF PHYSICS FACULTY OF SCIENCE
UNIVERSITY OF MALAYA KUALA LUMPUR
2017
Univers
ity of
Mala
ya

ii
UNIVERSITY OF MALAYA
ORIGINAL LITERARY WORK DECLARATION
Name of Candidate: INDRIANI SUKMA
Matric No: SGR130044
Name of Degree: MASTER OF SCIENCE
Title of Project Paper/Research Report/Dissertation/Thesis (“this Work”):
A STUDY OF THE RELATIONSHIP BETWEEN SOLAR ACTIVITIES AND
EARTHQUAKES
Field of Study: SOLAR ASTRONOMY AND GEOPHYSICS
I do solemnly and sincerely declare that:
(1) I am the sole author/writer of this Work; (2) This Work is original; (3) Any use of any work in which copyright exists was done by way of fair
dealing and for permitted purposes and any excerpt or extract from, or reference to or reproduction of any copyright work has been disclosed expressly and sufficiently and the title of the Work and its authorship have been acknowledged in this Work;
(4) I do not have any actual knowledge nor do I ought reasonably to know that the making of this work constitutes an infringement of any copyright work;
(5) I hereby assign all and every rights in the copyright to this Work to the University of Malaya (“UM”), who henceforth shall be owner of the copyright in this Work and that any reproduction or use in any form or by any means whatsoever is prohibited without the written consent of UM having been first had and obtained;
(6) I am fully aware that if in the course of making this Work I have infringed any copyright whether intentionally or otherwise, I may be subject to legal action or any other action as may be determined by UM.
Candidate’s Signature Date:
Subscribed and solemnly declared before,
Witness’s Signature Date:
Name:
Designation:
Univers
ity of
Mala
ya

iii
ABSTRACT
The Sun is a prime source of energy while the Earth is the third planet near to the Sun
and the only planet that has very large seismic activity. The solar wind interacts with the
ionospheric currents and affects the Earth magnetic field causing a geomagnetic storm.
Therefore, the study on the correlation between solar activity and earthquake is very
important. The geomagnetic storm index was used as a mediator for this study. The
observation covers from the year 1901 up to 2015 (i.e. between the 14th and the middle
of the 24th solar cycles) for an area that covers the majority of China and its bordering
countries. Data for solar activities such as sunspot number and solar wind parameters,
including the speed, dynamic pressure and input energy of solar wind, were collected
from Solar Influences Data Analysis Center (SIDC) and Advanced Composition
Explorer (ACE), respectively. Data for geomagnetic storm indices such as disturbance
storm time (DST) index, 3-h planetary index (Kp) and an average of the planetary index
(Ap) were obtained from the National Aeronautics and Space Administration (NASA)
via OmniWeb Data Explorer and the Space Physics Data Facility. Data number of the
earthquake for the small (M<4.9) and large (M>4.9) magnitude in Richter scale were
obtained from U.S geological survey database (USGS). The analysis focused on the
variation in the number of earthquakes by considering solar wind and geomagnetic
storm index based on the ascending and descending phases of each solar cycle. It is
found that the number of earthquake occurrences increases during the descending
phases of the solar cycle. It is predicted that there will be significantly more number of
earthquakes within the next 3 years until 2019.
Univers
ity of
Mala
ya

iv
ABSTRAK
Matahari adalah sumber utama tenaga, manakala Bumi adalah planet ketiga
berhampiran dengan Matahari dan satu-satunya planet yang mempunyai aktiviti seismik
yang sangat besar. Angin suria berinteraksi dengan arus ionosfera dan memberi kesan
kepada medan magnet Bumi yang menyebabkan ribut geomagnetik. Oleh itu, kajian
mengenai hubung kait antara aktiviti solar dan gempa bumi adalah sangat penting.
Indeks ribut geomagnetik telah digunakan sebagai pengantara untuk kajian ini.
Pemerhatian meliputi dari tahun 1901 sehingga 2015 (iaitu di antara kitaran suria yang
ke 14 dan pertengahan ke 24) bagi kawasan yang meliputi sebagian besar China dan
negara-negara yang bersempadan. Data untuk aktiviti suria seperti nombor tompok pada
matahari dan parameter angin suria, termasuk kelajuan, tekanan dinamik dan tenaga
input angin suria, dikumpulkan dari tapak web Solar Influences Data Analysis
Center (SIDC) and Advanced Composition Explorer (ACE), masing-masing. Data
untuk indeks ribut geomagnetik seperti masa indeks gangguan ribut (DST), 3-jam
Indeks planet (Kp) dan purata indeks planet (Ap) telah diperolehi daripada National
Aeronautics and Space Administration (NASA) melalui tapak web OmniWeb Data
Explorer dan Space Physics Data Facility. Data nombor gempa bumi untuk magnitude
kecil (M < 4.9) dan besar (M > 4.9) dalam skala Richter telah diperolehi dari pangkalan
data U.S Geology Survey (USGS). Analisis ini ditumpukan kepada variasi dalam
bilangan gempa bumi dengan mempertimbangkan angin suria dan indeks ribut
geomagnetik berdasarkan fasa menaik dan menurun setiap kitaran suria. Ia didapati
bahawa bilangan kejadian gempa bumi meningkat semasa fasa menurun kitaran suria.
Adalah dijangkakan bahawa akan ada lebih ketara bilangan gempa bumi dalam tempoh
3 tahun akan datang sehingga 2019.
Univers
ity of
Mala
ya

v
ACKNOWLEDGEMENTS
First at all, I would like to acknowledge my supervisor, Associate Professor Dr. Zamri
Zainal Abidin for his advice and beneficial discussion for without him I would not have
completed my master studies. This project is indebted to Dr. Bijan Nikouravan for his
idea, advice, and sharing of knowledge. I would also like to give my appreciation to
Dr. Mohamad Huzaimy Jusoh from Universiti Teknology MARA (Malaysia), for
sharing his knowledge and solar wind parameters archives database website. I would
like to thank all the lab members of the Radio Cosmology Laboratory, especially Prof.
Dr. Zainol Abidin Ibrahim for sharing their literature. Last but not least, an honorable
thank you to my family; my father (Sukardi SPd), my mother (Marianis S.Pd), my
sisters; Fitriani Sukma Amkeb and Nurbaiti Sukma S.Pd, my brother in low (Juarlis),
and the beautiful niece Putri Mutiara for their support and prayers.
Univers
ity of
Mala
ya

vi
TABLE OF CONTENTS
ABSTRACT ................................................................................................................... iii
ABSTRAK ..................................................................................................................... iv
ACKNOWLEDGEMENTS ........................................................................................... v
TABLE OF CONTENTS .............................................................................................. vi
LIST OF FIGURES ...................................................................................................... ix
LIST OF TABLES ...................................................................................................... xiii
LIST OF SYMBOLS AND ABBREVIATIONS ...................................................... xiv
LIST OF APPENDICES ............................................................................................. xv
CHAPTER 1: INTRODUCTION .................................................................................. 1
1.1 Research Background .............................................................................................. 1
1.2 Motivation................................................................................................................ 5
1.3 Research Objectives................................................................................................. 5
1.4 Outline of the Research ........................................................................................... 8
CHAPTER 2: LITERATURE REVIEW ...................................................................... 9
2.1 Sun ..................................................................................................................... 9
2.1.1 Solar Activity ............................................................................................ 10
2.1.1.1 Sunspot ...................................................................................... 11
2.1.1.2 Coronal mass ejection ............................................................... 12
2.1.1.3 Corotating interaction region .................................................... 13
2.1.1.4 Solar wind ................................................................................. 15
2.2 Magnetosphere and Earth Magnetic Field ............................................................. 17
2.2.1 Geomagnetic Storm Index ........................................................................ 18
2.2.1.1 DST index ................................................................................. 18
2.2.1.2 Kp and Ap indices ..................................................................... 18
Univers
ity of
Mala
ya
vii
2.3 Earth Seismicity ..................................................................................................... 20
CHAPTER 3: METHODOLOGY ............................................................................... 21
3.1 Overview................................................................................................................ 21
3.2 Databases Centre and Data Collection .................................................................. 21
3.2.1 SIDC ......................................................................................................... 21
3.2.2 ACE .......................................................................................................... 23
3.2.3 SPDF ......................................................................................................... 24
3.2.4 USGS ........................................................................................................ 26
3.3 Methodology .......................................................................................................... 28
CHAPTER 4: RESULTS AND ANALYSIS ............................................................... 31
4.1 Results ................................................................................................................... 31
4.1.1 Data of Solar Activities ............................................................................ 31
4.1.1.1 Sunspot Number ........................................................................ 31
4.1.1.2 Solar Wind ................................................................................. 33
4.1.2 Data of Geomagnetic Storm Index ........................................................... 35
4.1.3 Data of Earthquakes.................................................................................. 36
4.2 Analysis ................................................................................................................. 38
4.2.1 Variation of Sunspot Number ................................................................... 38
4.2.2 The Variation of Solar Wind Parameters, Geomagnetic Storm Indices and Annual Numbers of Earthquake based on Solar Cycle...................... 39
4.2.2.1 The variation of solar wind parameters ..................................... 39
4.2.2.2 The variation of geomagnetic storm indices ............................. 44
4.2.2.3 The variation of annual number of earthquake ......................... 47
4.2.3 The Variation of the Solar Wind Parameters, Geomagnetic Storm Index and Earthquake during Ascending and Descending Phases of Each Solar Cycle ...................................................................................... 55
4.2.4 The Prediction of the Data of Annual Number of Earthquakes during the Incomplete Descending Phase of The 24th Solar Cycle ...................... 61
Univers
ity of
Mala
ya

viii
4.2.4.1 The prediction by considering the variation of yearly mean sunspot number ......................................................................... 62
4.2.4.2 The prediction by considering the variation of the yearly mean solar wind input energy ................................................... 64
CHAPTER 5: DISCUSSION ....................................................................................... 69
5.1 Lorentz Force ......................................................................................................... 69
5.2 Solar Wind and Earth Magnetic Field Interaction ................................................. 70
5.3 Energetic Mass Particles of the Solar Wind .......................................................... 73
CHAPTER 6: CONCLUSION AND FUTURE WORK ........................................... 76
REFERENCES ............................................................................................................. 79
LIST OF PUBLICATIONS AND PAPERS PRESENTED ..................................... 87
APPENDIX ................................................................................................................... 88
Univers
ity of
Mala
ya

ix
LIST OF FIGURES
Figure 1.1: Figure of showing the interaction of solar wind energetic particles and earth magnetic field (credit: ESA). .............................................................. 2
Figure 1.2: Solar wind interacting the earth’s magnetic field and earth’s core (Credit: DTU Space). ................................................................................... 2
Figure 1.3: The General concept of solar and seismic activities coupling. .................... 3
Figure 1.4: Seismicity of the global map 1900-2003 (Credit: USGS). .......................... 6
Figure 2.1: The structure of the solar interior and the solar exterior regions (Credit: NASA). ........................................................................................... 9
Figure 2.2: The schematic diagram of temperature (solid curve) and gas mass density (dashed curve) in the solar photosphere, chromosphere, corona and transition region. This plot credit to Praderie et al. (1981). ................ 10
Figure 2.3: The image of sunspot activity (Credit: NASA).......................................... 11
Figure 2.4: The variation of sunspot number and its phases during the 23rd solar cycle. .......................................................................................................... 12
Figure 2.5: The massive of CME activity on 27 February 2000 (Credit: SOHO). ...... 13
Figure 2.6: The illustration of (a) CIR activity from solar corona hole and (b) the schematics diagram of CIR (Pizzo, 1978).................................................. 14
Figure 2.7: The structure of the earth’s magnetosphere (Lanza & Meloni, 2006). ...... 17
Figure 3.1: The flow chart method of collecting data of the sunspot number from SIDC database center. ................................................................................ 22
Figure 3.2: The flow chart method of collecting data for Bx, By, Bz, solar wind speed and proton density by using ACE database. .................................... 23
Figure 3.3: The flow chart method of collecting data solar wind parameters and geomagnetic indices by using NASA’ SPDF via OMNIWeb database. .... 25
Figure 3.4: The flow chart method of collecting data of the earthquake by using USGS database center. ............................................................................... 27
Figure 3.5 : The case study area for China and its bordering countries (bold area). ..... 28
Figure 3.6: The flow chart methodology of this research. ............................................ 30
Univers
ity of
Mala
ya

x
Figure 4.1: The variation of sunspot number (SN) for 114 years (1901-2015). ........... 38
Figure 4.2: The variation of yearly mean sunspot number (a), yearly mean solar wind speed (SWS) (km/s) (b), yearly mean solar wind dynamic pressure (SW DynP) (nPa) and (c) yearly mean solar wind input energy (SW ε) (Watt or Erg/s) during 21st solar cycle. .............................. 40
Figure 4.3: The variation of yearly mean sunspot number (a), yearly mean solar wind speed (SWS) (km/s) (b), yearly mean solar wind dynamic pressure (SW DynP) (nPa) and (c) yearly mean solar wind input energy (SW ε) (Watt or Erg/s) during 22nd solar cycle. ............................. 41
Figure 4.4: The variation of yearly mean sunspot number (a), yearly mean solar wind speed (SWS) (km/s) (b), yearly mean solar wind dynamic pressure (SW DynP) (nPa) and (c) yearly mean solar wind input energy (SW ε) (Watt or Erg/s) during 23rd solar cycle. ............................. 42
Figure 4.5: The variation of yearly mean sunspot number (a), yearly mean solar wind speed (SWS) (km/s) (b), yearly mean solar wind dynamic pressure (SW DynP) (nPa) and (c) yearly mean solar wind input energy (SW ε) (Watt or Erg/s) during middle of 24th solar cycle. ............. 43
Figure 4.6: The variation of yearly mean sunspot number (a), yearly mean DST index (b), yearly mean Kp index and (c) yearly mean Ap index during 21st solar cycle. ........................................................................................... 45
Figure 4.7: The variation of yearly mean sunspot number (a), yearly mean DST index (b), yearly mean Kp index and (c) yearly mean Ap index during 22nd solar cycle. .......................................................................................... 45
Figure 4.8: The variation of yearly mean sunspot number (a), yearly mean DST index (b), yearly mean Kp index and (c) yearly mean Ap index during 23rd solar cycle. .......................................................................................... 46
Figure 4.9: The variation of yearly mean sunspot number (a), yearly mean DST index (b), yearly mean Kp index and (c) yearly mean Ap index during middle of 24th solar cycle. .......................................................................... 46
Figure 4.10: The variation of an annual number of small magnitude earthquakes during the 21st solar cycle. ......................................................................... 48
Figure 4.11: The variation of an annual number of small magnitude earthquakes during the 22nd solar cycle.......................................................................... 48
Figure 4.12: The variation of an annual number of small magnitude earthquakes during the 23rd solar cycle. ......................................................................... 48
Univers
ity of
Mala
ya

xi
Figure 4.13: The variation of an annual number of small magnitude earthquakes during the middle of the 24th solar cycle. ................................................... 49
Figure 4.14: The variation of annual of large magnitude earthquake during 14th solar cycle................................................................................................... 50
Figure 4.15: The variation of annual of large magnitude earthquake during 15th solar cycle................................................................................................... 50
Figure 4.16: The variation of annual of large magnitude earthquake during 16th solar cycle................................................................................................... 51
Figure 4.17: The variation of annual of large magnitude earthquake during 17th solar cycle................................................................................................... 51
Figure 4.18: The variation of annual of large magnitude earthquake during 18th solar cycle................................................................................................... 51
Figure 4.19: The variation of annual of large magnitude earthquake during 19th solar cycle................................................................................................... 52
Figure 4.20: The variation of annual of large magnitude earthquake during 20th solar cycle................................................................................................... 52
Figure 4.21: The variation of annual of large magnitude earthquake during 21st solar cycle................................................................................................... 52
Figure 4.22: The variation of annual of large magnitude earthquake during 22nd solar cycle................................................................................................... 53
Figure 4.23: The variation of annual of large magnitude earthquake during 23rd solar cycle................................................................................................... 53
Figure 4.24: The variation of annual of large magnitude earthquake during middle of 24th solar cycle. ...................................................................................... 53
Figure 4.25: The variation of solar wind speed during ascending and descending of 21st up to middle of 24th solar cycle. .......................................................... 57
Figure 4.26: The variation of solar wind dynamic pressure during ascending and descending of 21st up to the middle of the 24th solar cycle. ....................... 57
Figure 4.27: The variation of solar wind input energy during ascending and descending of 21st up to the middle of the 24th solar cycle. ....................... 57
Figure 4.28: The variation of DST index during ascending and descending of 21st up to middle of 24th solar cycle. ................................................................. 58
Univers
ity of
Mala
ya

xii
Figure 4.29: The variation of Kp index during ascending and descending of 21st up to middle of 24th solar cycle. ...................................................................... 58
Figure 4.30: The variation of Ap index during ascending and descending of 21st up to middle of 24th solar cycle. ...................................................................... 59
Figure 4.31: The variation of number of small magnitude earthquake during ascending and descending phase of 21st up to middle of 24th solar cycle. .......................................................................................................... 60
Figure 4.32: The variation of number of large magnitude earthquake during ascending and descending phase of 21st up to middle of 24th solar cycle. .......................................................................................................... 60
Figure 4.33: The variation of conventional and modified of 21st up to the middle of the 24th solar cycle. ..................................................................................... 61
Figure 4.34: The trend of annual small magnitude earthquake (a) during the 21st conventional solar cycle, (b) during the 22nd conventional solar cycle, (c) during the 23rd conventional solar cycle and (d) during prediction of the 24th conventional solar cycle. ........................................................... 63
Figure 4.35: The trend of annual large magnitude earthquake (a) during the 21st conventional solar cycle, (b) during the 22nd conventional solar cycle, (c) during the 23rd conventional solar cycle and (d) during prediction of the 24th conventional solar cycle. ........................................................... 64
Figure 4.36: The trend of annual small magnitude earthquake (a) during 21st modified solar cycle, (b) during 22nd modified solar cycle, (c) during 23rd modified solar cycle and (d) during prediction of 24th modified solar cycle................................................................................................... 65
Figure 4.37: The trend of annual large magnitude earthquake (a) during 21st modified solar cycle, (b) during 22nd modified solar cycle, (c) during 23rd modified solar cycle and (d) during prediction of 24th modified solar cycle................................................................................................... 66
Figure 4.38: The variation of (a) small magnitude earthquake and (b) large magnitude earthquake during 24th solar cycle. ........................................... 68
Figure 5.1 : The variation of large + major, medium and small geomagnetic storms in 1964 – 2011 (during 20th up to 23rd solar cycle) associated with CME and CIR (Richardson & Cane, 2012). .............................................. 74
Univers
ity of
Mala
ya

xiii
LIST OF TABLES
Table 1.1: The structure of research outline ..................................................................... 8
Table 2.1: The classification of storm based on minimum DST index. ......................... 18
Table 2.2: The standard scale of K-index planetary. ...................................................... 19
Table 2.3: The conversion scale amplitude from Kp to ap. ........................................... 19
Table 4.1: Data for annual and yearly mean sunspot number. ....................................... 32
Table 4.2: Data of yearly mean solar wind parameters. .................................................. 34
Table 4.3: Data for annual and yearly mean of disturbance storm time (DST), 3-hour interplanetary (Kp) and average planetary (Ap) indices. ...................... 35
Table 4.4: Annual numbers of small and large magnitude earthquakes. ....................... 36
Table 4.5: The year of maximum value number of large magnitude earthquake .......... 54
Table 4.6: Data for SN, SWS, SW DynP, SWε, DST index, Kp index, Ap index, and during ascending phases of 14th up to the middle of the 24th solar cycle .............................................................................................................. 56
Table 4.7: Data for SN, SWS, SW DynP, SWε, DST index, Kp index, Ap index, and EQ during descending phases of 14th up to the middle of the 24th solar cycle...................................................................................................... 56
Table 4.8: Data prediction of earthquake during descending phase of 24th solar .......... 67
Univers
ity of
Mala
ya

xiv
LIST OF SYMBOLS AND ABBREVIATIONS
Ap : Average planetary index
CSC : Conventional Solar Cycle
CIR : Corotating interaction region
CME : Coronal mass ejection
DST : Disturbance storm time
EQ : Earthquake
Kp : 3-hour interplanetary index
MSC : Modified Solar Cycle
SWS : Solar Wind Speed
SC : Solar Cycle
SW dynP : Solar wind dynamic pressure
SN : Sunspot Number
SW ε : Solar wind input energy
Univers
ity of
Mala
ya

xv
LIST OF APPENDICES
Appendix: Data of yearly mean the proton density and interplanetary magnetic Field (IMF)…………………………………………………………………88
Univers
ity of
Mala
ya
1
CHAPTER 1: INTRODUCTION
1.1 Research Background
Sun is the main source of energy in the solar system while the earth is the third planet
nearest to the sun and It is the only planet that has a very large seismic activities (Jusoh
et al., 2012). The sun is magnetically active with a period of about 11 years and it is
called the solar cycle (Gnevyshev, 1967; Howard & LaBonte, 1980). The activities of
the sun ae referred to as the solar activities, which include; sunspot, solar wind, corona
mass ejection (CME), corotating interaction region (CIR) from corona hole, solar flare
and solar radio burst (Gnevyshev, 1967; Krüger, 2012). Several researchers, such as
Akasofu and Chapman (1972), Bartels (1932), Budyko (1969) and Simpson (1967)
consider these events in order to study the impact of the sun’s energetic particles on
various natural phenomena on earth such as; climate change, geomagnetic storm and
seismic activity. However, the mechanism of the sun – earth magnetosphere layer
connection, especially by considering the geomagnetic storm activities, is one of the
greatest mysteries to scientists and geologists for centuries, especially in the study of
their association to earthquake (Sukma & Abidin, 2017).
The solar wind interacts with earth’s magnetosphere layer (earth’s magnetic field)
(Delamere, 2015; Kovner & Feldstein, 1973; Surkov & Hayakawa, 2014). Likewise, the
earth’s magnetic field interacts with the magnetic field of the lithosphere layer, which
may assist us in studying the mechanism of solar activities influence on tectonic plate
motion. The general concept of solar wind and magnetosphere coupling is illustrated in
Figure 1.1.
Univers
ity of
Mala
ya

2
Figure 1.1: Figure of showing the interaction of solar wind energetic particles and earth magnetic field (credit: ESA).
Figure 1.1 shows the wind particles from the sun called the solar wind buffets the
earth’s magnetic field. Interaction between solar wind and earth’s magnetic field
respond to the behavior and movement of the earth’s core (see Figure 1.2).
Figure 1.2: Solar wind interacting the earth’s magnetic field and earth’s core (Credit: DTU Space).
Univers
ity of
Mala
ya

3
In order to study the solar activities, we look at the variation of sunspot number and
solar wind parameters, including; speed, dynamic pressure and input energy of the solar
wind. On the other hand, the geomagnetic storm indices, such as; DST, Kp and Ap were
examined as physical parameters to study the solar and seismicity connection. The
general concept on solar activities and geomagnetic storm coupling, and their
association with earthquake activity is illustrated in Figure 1.3.
Figure 1.3: The General concept of solar and seismic activities coupling.
Basically, the frame of reference of this research focuses on the solar and seismic
activity coupling by considering the concept as illustrated in Figure 1.3. Duma and
Vilardo (1998) studied the relation between solar radio flux and earth’s magnetic field
and their association to earthquake in the local study area: Mt. Vesuvius. They found
that there is correlation between them. The earth’s magnetic field protects our planet
from the energetic particles of the solar wind (Lang, 1995). However, there is a
phenomena for which the earth magnetic field is not enough to protect the earth, namely
during enhanced transfer of energetic particles of the solar wind into the magnetosphere
(Gonzalez et al., 1994). Gonzalez et al. (1994) proposed that this phenomenon is called
as a geomagnetic storm activity.
Univers
ity of
Mala
ya

4
The classification of geomagnetic storms have been studied by Mayaud (1980). On
the other hand, Biktash (2012) studied the variation of the solar wind velocity and DST
index during the 19th up to the 23rd solar cycle. They found that, their variation had a
maxima value during the descending phase in each solar cycle. Hundhausen (1979) also
found the variation of solar wind to be at maxima value during descending phase. They
also mentioned that the variation solar wind is dependent on variation of the activities,
such as; CME (corona mass ejection) and corona interaction rotation (CIR) from
corona. These events will be explained briefly in Chapter 2.
In the interaction between the solar wind and earth’s magnetic field studies, several
researchers had noted their association with earthquake. Anagnostopoulos and
Papandreou (2012) investigated the daily variation of earthquakes with magnitude
M>6.8. Their investigations showed that the occurrences of earthquake about ±1.5 days
after a sudden increase in Kp index triggered by the high speed of solar wind. Sobolev
et al. (2001) and Zakrzhevskaya and Sobolev (2002) also found the evidence of
statistical correlation between geomagnetic storms and seismic activity. Gousheva et al.
(2003) and Odintsov et al. (2006) proposed that the maximum value of earthquake in
every solar cycle is found – one corresponding with solar maxima, and the other one
about ±3 years after solar maxima (during the descending phase). Recently, Sukma and
Abidin (2017) studied the variation of earthquakes by considering ascending and
descending phases of the solar cycle. They also found that the maximum value of
earthquake occurs during the descending phase. On the other hand, they only focused on
solar wind speed and DST index activities as physical parameters of solar and seismic
coupling. In this research, however along with dynamic and input energy of the solar
wind, Kp and Ap indices are involved.
Univers
ity of
Mala
ya

5
1.2 Motivation
Even though several researchers such as Duma and Vilardo (1998), Gousheva et al.
(2003), Duma and Ruzhin (2003), Khain and Khalilov (2007), Rabeh et al. (2010),
Anagnostopoulos and Papandreou (2012) and Midya and Gole (2014) have been studied
and investigated the correlation between solar and seismic activities, but few of them
concentrate on their variation by considering the ascending and descending phases in
long term solar cycle variation. Basically, their research covers different phases of the
solar cycles, while our research covers long term variation of solar cycles, including
currently solar cycle (24th solar cycle).
We are motivated to study the solar and seismic activities correlation by considering
the mechanism of interaction between the solar wind and earth’s magnetic field which
affects the geomagnetic storm indices, likewise the earth’s magnetic field interacts with
the lithosphere magnetic field. Moreover, these interactions influence the induced Sq-
current current (Duma & Ruzhin, 2003).
As we mentioned in the research background, the activities of the sun varies in a
cycle of about 11 years. Hence, we are also motivated to study and investigate the
variation of seismic activities during the ascending and descending phases of the solar
cycle by considering the variation of solar wind and geomagnetic storm activities.
1.3 Research Objectives
Recently, many researchers have investigated the relationship between solar activity
and earthquakes with different physical aspects, longitude and latitude study area, and
the range of the solar cycle. The speed, dynamic pressure and input energy of the solar
wind are treated as a physical mechanism in order to study the energy transfer in to the
magnetosphere. On the other hand, the DST index, KP and Ap indices are used as a
moderator in order to investigate the correlation between solar and seismic activities.
Univers
ity of
Mala
ya
6
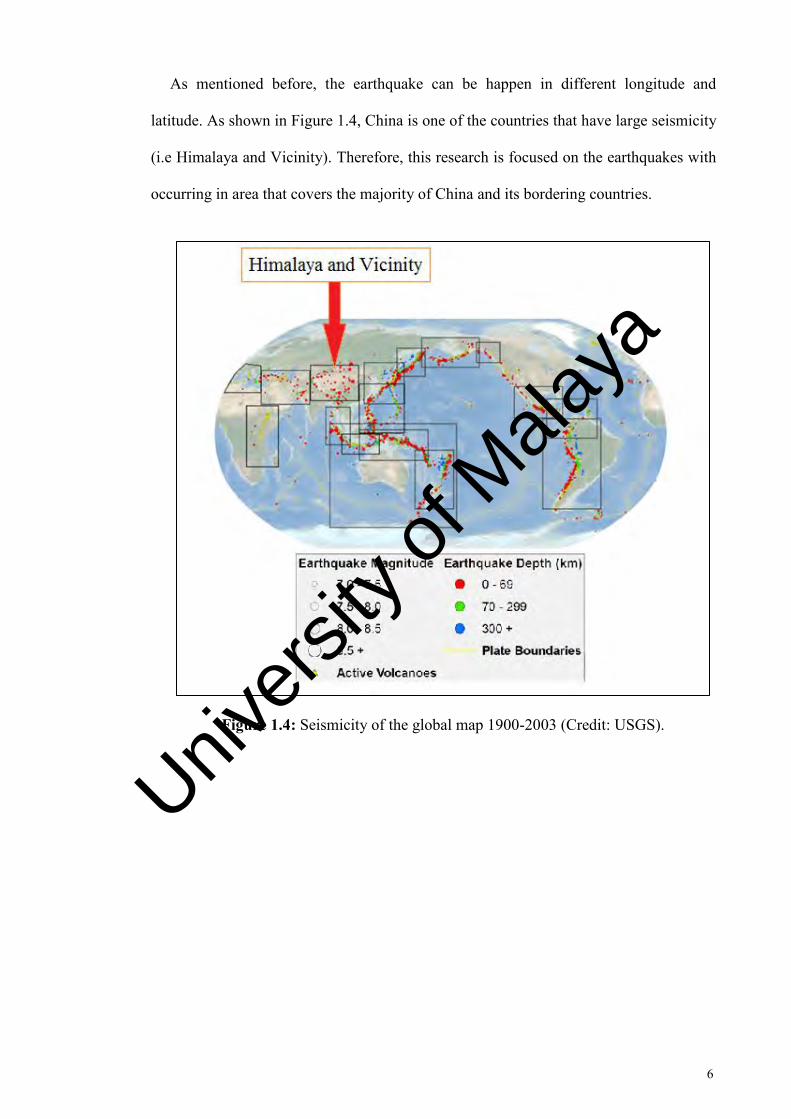
As mentioned before, the earthquake can be happen in different longitude and
latitude. As shown in Figure 1.4, China is one of the countries that have large seismicity
(i.e Himalaya and Vicinity). Therefore, this research is focused on the earthquakes with
occurring in area that covers the majority of China and its bordering countries.
Figure 1.4: Seismicity of the global map 1900-2003 (Credit: USGS).
Univers
ity of
Mala
ya

7
In general, in order to study the correlation between solar and seismic activities, this
research aims;
1. To study the variation of solar wind parameters (speed, dynamic pressure and
input energy of the solar wind) and geomagnetic storm indices (DST, Kp and Ap
indices) during the 21st up to middle of the 24th solar cycle and investigate their
maximum value in every solar cycle.
2. To study the variation of the solar wind parameters and geomagnetic storm
indices by considering the ascending and descending phases of the solar cycle
and investigating their correlation.
3. To evaluate the maximum value (in every solar cycle) of the annual number of
small magnitude earthquakes (M<4.9) during the 21st up to middle of the 24th
solar cycle and examine their association with solar wind and geomagnetic
storm activities.
4. To evaluate the maximum value (in every solar cycle) of the annual number of
large magnitude earthquakes (M>4.9) during the 14th up to middle of the 24th
solar cycle and examine their association with the solar wind and geomagnetic
storm activities.
5. To investigate the variation of small and large magnitude earthquakes by
considering the ascending and descending phases of the solar cycle and
explaining their association with solar wind and geomagnetic storm activities.
6. To predict the variation of small and large magnitude earthquakes during the
incomplete 24th descending phase of the solar cycle.
Univers
ity of
Mala
ya

8
1.4 Outline of the Research
Overall, this research is divided into six chapters. The outline of this research is
structured as follows (see Table 1.1).
Table 1.1: The structure of research outline.
No. of Chapter
Title of Chapter Explanation
1 Introduction This chapter introduces the background of the study of solar and seismicity coupling. This chapter also provides the motivation and objectives of this research.
2 Literature Review
This chapter provides the literature review in 3 sections. Firstly, the literature review on the Sun and its activities, such as; sunspot number, corona mass ejection (CME), corotating interaction region (CIR) from corona hole and solar wind activities. The second part provides the literature review on magnetosphere and the geomagnetic storm index. Thirdly, it covers the literature review regarding Earth and its layers. From this section, the literature review on seismic activities such as earthquakes was also provided.
3 Methodology This chapter explains the methodology on data collection. This chapter also explains the database centers that were used in this research.
4 Results and
Analysis
This chapter presents and analyses the data of sunspot number, solar wind parameters (speed, dynamic pressure and input energy of the solar wind), geomagnetic storm indices (DST, Kp and Ap indices) and earthquake for small (M<4.9) and large (M>4.9) magnitude. This chapter also presents data prediction and analysis in order to predict the earthquakes
5 Discussion
This chapter discusses the possible physical mechanism on studying the correlation between solar and seismic activities. This chapter also discusses the result from Chapter 4.
6 Conclusion and Future
Work
The summary of this research and discusses ideas for future work are presented in this chapter.
Univers
ity of
Mala
ya
9
CHAPTER 2: LITERATURE REVIEW
2.1 Sun
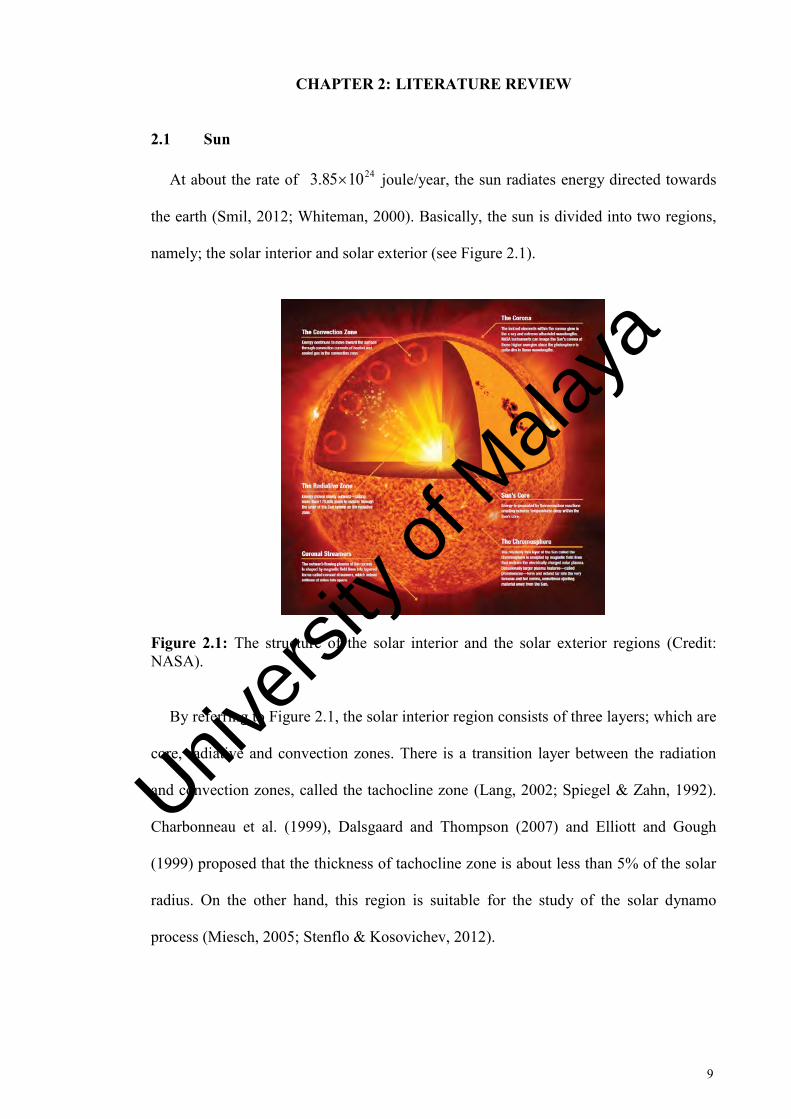
At about the rate of 241085.3 joule/year, the sun radiates energy directed towards
the earth (Smil, 2012; Whiteman, 2000). Basically, the sun is divided into two regions,
namely; the solar interior and solar exterior (see Figure 2.1).
Figure 2.1: The structure of the solar interior and the solar exterior regions (Credit: NASA).
By referring to Figure 2.1, the solar interior region consists of three layers; which are
core, radiative and convection zones. There is a transition layer between the radiation
and convection zones, called the tachocline zone (Lang, 2002; Spiegel & Zahn, 1992).
Charbonneau et al. (1999), Dalsgaard and Thompson (2007) and Elliott and Gough
(1999) proposed that the thickness of tachocline zone is about less than 5% of the solar
radius. On the other hand, this region is suitable for the study of the solar dynamo
process (Miesch, 2005; Stenflo & Kosovichev, 2012).
Univers
ity of
Mala
ya

10
In general, the solar exterior consists of two layers; the chromosphere and corona
(see Figure 2.1). The interface layer between them is called the transition region.
Watson (2012) mentions that the transition region has large temperature gradient. He
also mentions that it is only few thousand kilometers thick with the temperature
increasing from thousands to millions of Kelvin. The layers in the solar exterior have its
own characteristics and different physical properties. The schematic properties of the
temperature and mass density in the solar photosphere, chromosphere, corona and
transition region are illustrated in Figure 2.2.
Figure 2.2: The schematic diagram of temperature (solid curve) and gas mass density (dashed curve) in the solar photosphere, chromosphere, corona and transition region. This plot credit to Praderie et al. (1981).
2.1.1 Solar Activity
The solar activity is affected by a crucial of dynamic magnetic field of the sun
(Watson, 2012). The term solar activity refer to the sunspot, corotating interaction
region (CIR) from corona layer, coronal mass ejection, and solar wind, including the
speed, dynamic pressure and input energy of the solar wind.
Univers
ity of
Mala
ya

11
2.1.1.1 Sunspot
Basically, the sunspot is a dark spot appear in the photosphere layer (Chitre, 1963;
Deinzer, 1965; Thomas & Weiss, 1992). The darkness at the central region as illustrated
in Figure 2.3 is caused by their strong magnetic field which affects the cooler
temperature on that dark region called umbra region, which is surrounded by brighter
region (penumbra region) (Brandt et al., 1990; Brummell et al., 2008; Lites & Thomas,
1985; Thomas & Weiss, 1992).
Figure 2.3: The image of sunspot activity (Credit: NASA).
In addition, the sunspot number is used in order the measure the sunspot activity. It is
the oldest and longest measure of the sun’s activity. The sunspot number is calculated
by normalization constant (k), the group sunspot number (g) and the total sunspot
number (f) (Brekke, 2012; Hoyt & Schatten, 1998; Waldmeier, 1961) (see Equation
(1)).
fgKR 10 (1)
Univers
ity of
Mala
ya

12
On the other hand, the variation of sunspot number is well known to the study of the
solar activity over an 11 year cycle (solar cycle). In this research we assumed the
variation of sunspot number as the conventional solar cycle. Moreover, every solar
cycle consists of 4 phases; minima, ascending, maxima and descending. These phases in
one solar cycle are illustrated in Figure 2.4, while the data was retrieved from SIDC.
Other than sunspot number, the variation of the solar cycle during the ascending and
descending phases can also be measured by various activities of the sun, such as solar
radio flux (Song et al., 2005), solar extreme ultraviolet (Solomon et al., 2010), solar
flare (Gupta & Basu, 1965), cosmic ray (O’Brien, 2007), and solar wind (Gosling &
Bame, 1972; Neugebauer, 1975; Webb & Howard, 1994).
Figure 2.4: The variation of sunspot number and its phases during the 23rd solar cycle.
2.1.1.2 Coronal mass ejection
The coronal mass ejection (CME) is an explosive phenomena in the solar coronal
hole layer that produces and spreads out the energy into the interplanetary medium
(Benjamin & Nayar, 2010). The slow and fast coronal mass ejection interacts with the
interplanetary magnetic field and the solar wind. It is divided into two categories, one is
slow CME activity which accelerates and the other one is fast CME activity which
Univers
ity of
Mala
ya

13
decelerates towards the solar wind (Benjamin & Nayar, 2010). The study of the CME
and its association with the solar wind in the solar cycle has been studied by several
authors, such as Benjamin and Nayar (2010), Richardson and Cane (2012) and
Richardson et al. (2000). From their study, they concluded that the explosive event of
CME occur solar maxima and their variation follow the variation sunspot number in
solar cycle. The illustration of CME activity is presented in Figure 2.5.
Figure 2.5: The massive of CME activity on 27 February 2000 (Credit: SOHO).
2.1.1.3 Corotating interaction region
The phenomenon of the corotating interaction region (CIR) occurs because of the
solar wind interaction at different speeds and it emanates from solar corona holes region
(Gosling, 1996; Prise et al., 2015; Tsurutani et al., 1995). The illustration and schematic
of CIR are presented in Figure 2.6.
Univers
ity of
Mala
ya

14
Figure 2.6: The illustration of (a) CIR activity from solar corona hole and (b) the schematics diagram of CIR (Pizzo, 1978).
The study of CIR activity, especially its explanation regarding solar wind and solar
cycle have been studied by previous researchers such as Ballatore (2002), Guarnieri et
al. (2006), Hundhausen (2012), Pizzo (1978), Richardson et al. (2000) and Xiao‐Fei et
al. (2015). From their investigation, they concluded that the CIR activity mostly occurs
during the year after solar maxima which is during the descending phase of the solar
cycle. During the descending and minima phases, the sun has less activity especially
CME. On the other hand, during the year after solar maxima, the activity from the solar
Univers
ity of
Mala
ya

15
coronal hole expand in size and the energy move towards the solar equator (Guarnieri et
al., 2006; Hundhausen, 2012). Therefore, the maximum of activities of the sun are not
only during solar maxima, especially CIR activity which has maximum activity during
descending phase.
2.1.1.4 Solar wind
The solar wind is one of the solar activities and it is the prime energy transfer and
affects into and affects the magnetosphere layer. Akasofu (1981), Lu et al. (2008),
Nakano et al. (2009) and Xiao‐Fei et al. (2015) have studied the physical mechanism of
the solar wind by considering its parameters, such as; the speed, dynamic pressure and
input energy. They also investigated these parameters in association with geomagnetic
storm indices by including the explanation of the CME and CIR in this study.
Solar wind speed (a)
The flow of the solar wind into the interplanetary magnetic field (IMF) which affects
the earth’s magnetic field can be quantified by studying the speed of the solar wind. The
technique of this quantification was studied by Arge et al. (2003). The solar wind speed
correlates to the dynamic and input energy of the solar wind (see Equations (2) and (3)).
Univers
ity of
Mala
ya

16
Solar wind dynamic pressure (b)
The effects of the solar wind energy transfer into the magnetosphere and ionosphere
system are known as solar wind dynamic pressure (Adebesin et al., 2013). The study of
the solar wind dynamic pressure and their possible effects on the earth’s magnetic field,
especially in study its association to geomagnetism have been discussed by Nakano et
al. (2009), Roelof and Sibeck (1993) and Xiao‐Fei et al. (2015). The solar wind
dynamic pressure is caused by the enhancement of the solar wind speed and proton
density. On the other hand, the solar wind dynamic pressure (Pdyn) can be calculated by
considering the value of solar wind speed (v) in km/s and proton density of the solar
wind (np) in N/cm3 (see Equation (2)).
nPae6726.1Pdyn SW 26 vnP (2)
Solar wind input energy (c)
The penetration of solar wind input energy into the magnetosphere layer is an
important process in solar physics. This input energy can be used to estimate the energy
transferred by solar wind that flows into the magnetosphere and ionosphere layer
(Tenfjord & Østgaard, 2013). The solar wind input energy labelled as ε have been
studied by several researchers, such as Akasofu (1981) and Koskinen and Tanskanen
(2002). They proposed the equation to calculate the solar wind input energy (ε) by using
total magnetic field (B), clock angle (θ) and effective area of interaction (I0) (see
Equation (3)). AmVs-7104 is 0 .
sErgor Watt 2
sin4Epsilon 20
42
0
IvB
(3)
Univers
ity of
Mala
ya

17
2.2 Magnetosphere and Earth Magnetic Field
The earth has a magnetic field which is the most important shield region in order to
protect our planet from energetic particles of the sun by the solar wind. This region
called as magnetosphere (Hynönen, 2013; Lanza & Meloni, 2006). The illustration and
of the earth’s magnetosphere region is illustrated in Figure 2.7.
Figure 2.7: The structure of the earth’s magnetosphere (Lanza & Meloni, 2006).
The shape of the magnetosphere is depending on the solar activity, especially the
energetic and dynamic pressure of the solar wind. The characteristic of the boundary
between solar wind and magnetosphere called as the magnetopause. Merrill and
McElhinny (1983) mentioned that the bow show is formed during the period of high
speed of energetic particle from solar wind collides the magnetosphere region. The
magnetosphere also can be referred as an area to several fluctuation phenomena of
magnetic field, such as; geomagnetic storm, auroral substorm pulsations (Hynönen,
2013).
Univers
ity of
Mala
ya

18
2.2.1 Geomagnetic Storm Index
The geomagnetic storm is the phenomena to study the disturbance in the
magnetosphere which is caused by the interaction between earth’s magnetic field and
solar wind (Gonzalez et al., 1994; Hynönen, 2013; Mayaud, 1980).
This phenomenon is measured by several indices and three of them are DST, Kp and
Ap indices (Mayaud, 1980). The index of geomagnetic storm phenomena is commonly
used as physical parameters on study the solar and seismicity correlation.
2.2.1.1 DST index
Gonzalez et al. (1994) mention that the daily storm time (DST) is the most common
to measure and classify the geomagnetic storm index. Loewe and Prölss (1997)
classified the storm based on minimum DST index (see Table 2.1)
Table 2.1: The classification of storm based on minimum DST index.
Storm Type Minimum DST index below Weak storm -30 nT
Moderate storm -50 nT Strong storm -100 nT Severe storm -200 nT Great Storm -350 nT
2.2.1.2 Kp and Ap indices
Kp index (3-hour planetary) is another common to measure the geomagnetic storm
activity (Hynönen, 2013). The Kp index is derived from K-index planetary. Jankowski
and Sucksdorff (1996) proposed the range of the K-index planetary, which is from zero
to nine digits. They mentioned that the zero value of Kp index indicates as no magnetic
activity while nine digit indicates as significant of geomagnetic storm activity. They
also proposed the standard scale of K-index (see Table 2.2).
Univers
ity of
Mala
ya

19
Table 2.2: The standard scale of K-index planetary.
K-Value 0 1 2 3 4 5 6 7 8 9 Range (nT) 0 5 10 20 40 70 120 200 300 500
The Ap index also well known as linear index, its measure by an average of 8 digits
from the ap indices, where the 3-hour index ap is derived based on conversion of the
quasi logarithmic 3-hour Kp index (Hynönen, 2013; Mayaud, 1980; Meyer, 2006;
Rostoker, 1972). The standard conversion of Kp index correspond to the ap index were
carried by Rostoker (1972) (see Table 2.3).
Table 2.3: The conversion scale amplitude from Kp to ap.
Kp (nT) ap (nT) Kp (nT) ap (nT) 00 0 5- 39 0+ 2 50 48 1- 3 5+ 56 10 4 6- 67 1+ 5 60 80 2- 6 6+ 94 20 7 7- 111 2+ 9 70 132 3- 12 7+ 154 30 15 8- 179 3+ 18 80 207 4- 22 8+ 236 40 27 9- 300 4+ 32 90 400
Univers
ity of
Mala
ya

20
2.3 Earth Seismicity
The study of earthquake physics is a very complex and challenging topic (Pulinets &
Boyarchuk, 2004). It involves the dynamics of the earth’s crust, especially in the
process of the generation of electrically charged particles.
Pulinets and Boyarchuk (2004) mentioned that there is the possibility of the electric
field penetrating the magnetosphere which is called as the plasmaspheric tube
modification when the tube is loaned in area of earthquake preparation.
In this research, we are more focused on the concept of earthquakes; especially it’s
relation with the mechanism solar-dynamo process. This process involves the study on
the possibility of earthquake occurrence caused by the interaction of the solar wind and
geomagnetic field. On the other hand, the geomagnetic field is also caused by the
induced currents in the crust, mantle and oceans. Furthermore, the magnetic field
produces an electric current which circulates in the highly conductive outer core layer.
This geomagnetic field is also contributing (especially, in lithosphere) towards the total
geomagnetic storm produced.
Univers
ity of
Mala
ya

21
CHAPTER 3: METHODOLOGY
3.1 Overview
In this chapter we outline the methodology of our research. This is a theoretical
research, which requires no instrumentation. Therefore, in order to investigate the
correlation between solar and seismic activities by considering the geomagnetic storm
as a physical parameter requiring a large dataset to explain and examine their
relationship. Hence, we collected all the data from valid international databases such as;
the solar influence data analysis center (SIDC), the advanced composition explorer
(ACE) spacecraft, national aeronautics space administration (NASA) via OMNIWeb
data explorer and the space physics data facility and U.S geological survey (USGS). We
also explained the method in order to collect the data from those databases.
3.2 Databases Centre and Data Collection
3.2.1 SIDC
The solar influences data analysis center (SIDC) is the solar physics research
department at the Royal Observatory of Belgium, which includes the world data center
for the sunspot number. The international sunspot number that is available from this
database is among the longest running time-series of solar activity. This database
provides daily, monthly and yearly sunspot number. Therefore, we used the SIDC
database in order to collect the data of annual and yearly mean sunspot number in order
to investigate the variation of solar activity. This database gives the annual sunspot
number by taking a simple sum of the daily total sunspot number over all days of each
year.
Univers
ity of
Mala
ya
22
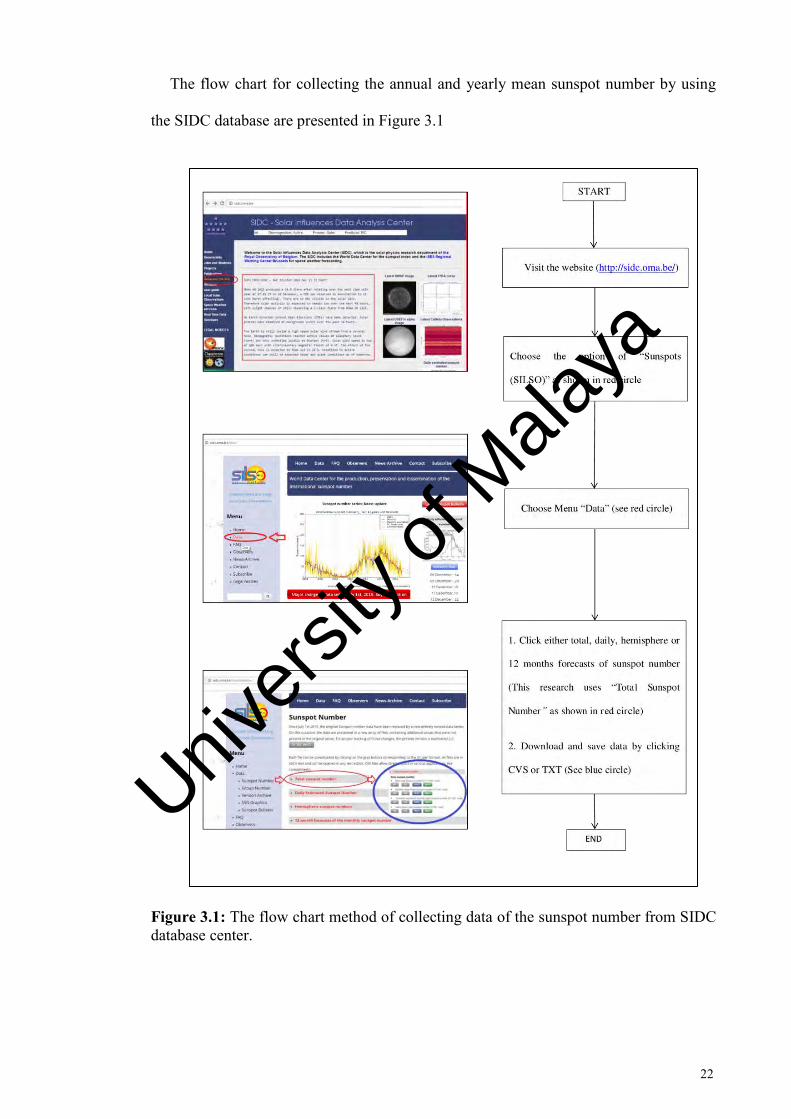
The flow chart for collecting the annual and yearly mean sunspot number by using
the SIDC database are presented in Figure 3.1
Figure 3.1: The flow chart method of collecting data of the sunspot number from SIDC database center.
Univers
ity of
Mala
ya

23
3.2.2 ACE
The Advance Composition Explorer (ACE) is a mission of the National Aeronautics
and Space Administration (NASA) under the Office of Space Science Mission and
Payload Development Division. The ACE spacecraft has three monitoring and six high-
resolution sensors that samples low and high energy particles of solar origin with a
collecting power 10 to 1000 times greater than past experiments. This space mission
provides several data including the solar corona, solar wind, proton density and other
interplanetary particles. Hence, this research used data for solar wind parameters from
the ACE database center. The flow chart of collecting the data of solar wind parameters
was presented in Figure 3.2.
Figure 3.2: The flow chart method of collecting data for Bx, By, Bz, solar wind speed and proton density by using ACE database.
Univers
ity of
Mala
ya

24
As shown in Figure 3.2, the data of solar wind parameters and Interplanetary
Magnetic Field (IMF) are only available since 25th of August 1997. On the other hand,
one of the objectives of this research is to investigate the variation of solar wind
parameters that cover from the 21st up to the middle of the 24th solar cycle (which is the
spans the years 1976-2015). However, data for the solar wind parameters can also be
obtained from the NASA’s Goddard Space Flight Center via OMNIWeb Data Explorer,
and the Space Physics Data Facility (Jusoh et al., 2012) (see Section 3.2.3).
3.2.3 SPDF
The Space Physics Data Facility (SPDF) is based at NASA’s Goddard Space Center
in Greenbelt, MD, U.S.A and also supports the science mission of NASA’s
Heliophysics Great Observatory. The SPDF provides data services and software in order
to understand the physics and dynamics of the Heliosphere.
The SPDF also provides several data services, such as; data of current space physics
via CDAWeb and data of solar wind magnetic field and plasma via OMNIWeb plus. On
the other hand, SPDF via OMNIWeb also provides data of average hourly “near-earth”
magnetic field and plasma magnetic field, particles of energetic proton fluxes, and solar
activity and geomagnetic storm indices. Therefore, this research uses the data of the
solar wind parameters (speed, dynamic pressure and input energy of the solar wind) and
the geomagnetic storm indices (DST, Kp and Ap indices) from the SPDF database via
OMNIWeb. The flow chart of collecting the data of solar wind parameters and
geomagnetic storm indices were presented in Figure 3.3.
Univers
ity of
Mala
ya

25
Figure 3.3: The flow chart method of collecting data solar wind parameters and geomagnetic indices by using NASA’ SPDF via OMNIWeb database.
Univers
ity of
Mala
ya

26
Figure 3.3 shows that the data of solar wind speed and geomagnetic storm indices
(DST, Kp and Ap indices) can be obtained directly. On the other hand, data for solar
wind dynamic pressure and solar wind input energy can be calculated by using
Equations (2) and (3), respectively. Therefore, this research also collects data of proton
density in order to obtain data of solar wind dynamic pressure. By referring those
equations, this research requires to collect data of proton density and IMF magnetic
field (B). All data proton density and IMF magnetic field from 1976 to 2015 were
presented in Appendix.
3.2.4 USGS
The USGS (U.S Geological Survey) is a scientific agency of the United States
government. This agency focuses on four major science disciplines, namely biology,
geology, geography and hydrology.
This agency is in charge of several programs and one of them is the Natural Hazard
Programs, which is part of the National Earthquake Hazards Reduction Program
(NEHRP). This agency also provides several real-time data via the Natural Hazard
Program mission, such as; volcano hazards, landslide hazard, emergency management,
and earthquake hazards etc. Their scientists gather all of the data and information
through periodic and continuous measurement in order to provide a view of current
conditions. Therefore, this research uses the collected data for the number of earthquake
occurrence from the USGS database via real-time data of earthquake hazards. The flow
chart for collecting the data of earthquake was illustrated and explained in Figure 3.4.
Univers
ity of
Mala
ya

27
Figure 3.4: The flow chart method of collecting data of the earthquake by using USGS database center.
Univers
ity of
Mala
ya

28
As mentioned in Chapter 1, the study case area of this research is localized around
China and its bordering countries. From Figure 3.5, we draw and indicate the region of
interest of China and its bordering countries region with latitude [17.309, 53956] and
longitude [72.422, 142.207] (see Figure 3.5).
Figure 3.5 : The case study area for China and its bordering countries (bold area).
3.3 Methodology
From Figures 3.1 until 3.4, the data of annual and yearly mean sunspot number,
yearly mean solar wind parameters, yearly mean geomagnetic indices, and annual
number of earthquake were collected and separated by different initial year. Data of
annual and yearly mean sunspot number are available since 1700, while the data of the
solar wind parameters are available since 1997 and 1963 from the ACE and SPDF
databases respectively. Moreover, from ONNIWeb database we collected the data of
geomagnetic storm index which are available since 1976. On the other hand, based on
the USGS database, data of the annual number small and large magnitude earthquakes
are available since 1973 and 1901, respectively. Therefore, we collected and classified
the data of sunspot number, solar wind parameters, geomagnetic indices and earthquake
into different spans of the solar cycle.
Univers
ity of
Mala
ya

29
This research also predicts the data of earthquakes (i.e for 2017-2019) by considering
the variation of conventional and modified solar cycle. As mentioned in Chapter 2, the
variation of sunspot number used in this research called as the conventional solar cycle.
On the other hand, other type of solar activities such as the solar wind can also be used
in order to study the variation of the solar cycle. This research used the variation of the
solar wind input energy as the modified solar cycle (see Chapter 4). The model data
between solar and seismic activities (see Chapter 4) does not show a linear dependence;
therefore we computed and modeled their relationship by a polynomial function. For
more details on polynomial function, we took references from Priestley and Chao
(1972), O'Hagan and Kingman (1978), Motulsky and Ransnas (1987), Sornette et al.
(2008), Dutta et al. (2013) and Srinivasamurthy et al. (2014).
Finally, by referring to Figures 3.1 until 3.5, the methodology of this research, from
collecting, predicting and analysing of all the data were presented in Figure 3.6.
Univers
ity of
Mala
ya

30
Figure 3.6: The flow chart methodology of this research.
Univers
ity of
Mala
ya

31
CHAPTER 4: RESULTS AND ANALYSIS
4.1 Results
Basically, this research presents three sets of data, which are the data of solar
activities, the geomagnetic storm indices and a number of earthquakes. For solar
activities, we presented the data of sunspot number and data of solar wind parameters;
including data of solar wind speed, solar wind dynamic pressure and solar wind input
energy. We also presented the data of geomagnetic storm indices. They were used as a
mediator to study the relationship between solar and seismic activities. In this research,
we used the data of DST, Kp and Ap indices for studying the geomagnetic storm.
Lastly, we presented the numbers of small (M<4.9) and large (M>4.9) magnitude
earthquakes for China and its bordering countries region (see Figure 3.5).
4.1.1 Data of Solar Activities
4.1.1.1 Sunspot Number
In this section, we presented the data for sunspot number. Several researchers used
either annual sunspot number or yearly mean value of sunspot number to investigate the
variation of the solar cycle. However, our research used the yearly mean sunspot
number in order to study the variation of the solar cycle. We averaged the value of
annual sunspot number for each year. Hence, we presented the data of annual and yearly
mean sunspot number for 115 years (1901-2015) in Table 4.1.
Univers
ity of
Mala
ya

32
Table 4.1: Data for annual and yearly mean sunspot number.
Year Annual SN
Yearly Mean SN Year Annual
SN Yearly Mean
SN 1901 1674 4.6 1959 82165 225.1 1902 3103 8.5 1960 58201 159.0 1903 14875 40.8 1961 27897 76.4 1904 25668 70.1 1962 19473 53.4 1905 38504 105.5 1963 14580 39.9 1906 32887 90.1 1964 5501 15.0 1907 37511 102.8 1965 8020 22.0 1908 29606 80.9 1966 24366 66.8 1909 26724 73.2 1967 48511 132.9 1910 11288 30.9 1968 54905 150.0 1911 3462 9.5 1969 54519 149.4 1912 2202 6.0 1970 54016 148.0 1913 875 2.4 1971 34456 94.4 1914 5859 16.1 1972 35726 97.6 1915 28832 79.0 1973 19756 54.1 1916 34783 95.0 1974 17964 49.2 1917 63374 173.6 1975 8212 22.5 1918 49129 134.6 1976 6740 18.4 1919 38598 105.7 1977 14352 39.3 1920 22958 62.7 1978 47812 131.0 1921 15885 43.5 1979 80322 220.1 1922 8657 23.7 1980 80135 218.9 1923 3527 9.7 1981 72590 198.9 1924 10210 27.9 1982 59268 162.4 1925 27024 74.0 1983 33197 91.0 1926 38871 106.5 1984 22138 60.5 1927 41873 114.7 1985 7511 20.6 1928 47475 129.7 1986 5389 14.8 1929 39499 108.2 1987 12361 33.9 1930 21680 59.4 1988 45017 123.0 1931 12799 35.1 1989 77034 211.1 1932 6793 18.6 1990 69993 191.8 1933 3368 9.2 1991 74195 203.3 1934 5313 14.6 1992 48673 133.0 1935 21964 60.2 1993 27775 76.1 1936 48617 132.8 1994 16383 44.9 1937 69581 190.6 1995 9152 25.1 1938 66654 182.6 1996 4231 11.6 1939 54004 148.0 1997 10562 28.9 1940 41369 113.0 1998 32214 88.3
Univers
ity of
Mala
ya

33
Table 4.1 continued
Year Annual SN
Yearly Mean SN
Year Annual SN
Yearly Mean SN
1941 28894 79.2 1999 49760 136.3 1942 18527 50.8 2000 63632 173.9 1943 9898 27.1 2001 62199 170.4 1944 5881 16.1 2002 59700 163.6 1945 20196 55.3 2003 36235 99.3 1946 56325 154.3 2004 23913 65.3 1947 78374 214.7 2005 16718 45.8 1948 70649 193.0 2006 9007 24.7 1949 69613 190.7 2007 4615 12.6 1950 43388 118.9 2008 1522 4.2 1951 35879 98.3 2009 1745 4.8 1952 16458 45.0 2010 9077 24.9 1953 7348 20.1 2011 29507 80.8 1954 2411 6.6 2012 30941 84.5 1955 19769 54.2 2013 34318 94.0 1956 73443 200.7 2014 41371 113.3 1957 98292 269.3 2015 25483 69.7 1958 95515 261.7
4.1.1.2 Solar Wind
In this section, we presented the data of solar wind parameters, including speed,
dynamic pressure and input energy of the solar wind. As mentioned in Chapter 3 (see
section 3.2.3), data for the dynamic pressure and input energy of the solar wind are
calculated by using equation (2) and (3). All of the data for yearly mean solar wind
parameters from 1976 to 2015 were presented in Table 4.2.
Univers
ity of
Mala
ya

34
Table 4.2: Data of yearly mean solar wind parameters.
Year Yearly Mean
Solar Wind Speed (SWS) (km/s)
Yearly Mean Solar Wind Dynamic
Pressure (SW DynP) (nPa)
Yearly Mean Solar Wind
Input Energy (ε) (Watt)
1976 386.11 2.09 2.61E+17 1977 405.89 2.28 2.32E+17 1978 423.67 2.17 5.07E+17 1979 403.08 1.86 7.52E+17 1980 391.05 1.68 5.90E+17 1981 424.82 2.04 8.12E+17 1982 364.34 2.23 9.89E+17 1983 278.39 1.63 5.27E+17 1984 275.38 1.59 5.39E+17 1985 309.92 1.82 3.39E+17 1986 323.16 1.82 3.40E+17 1987 294.62 1.74 3.64E+17 1988 295.43 1.49 6.02E+17 1989 299.68 1.63 6.68E+17 1990 278.71 1.45 6.48E+17 1991 303.28 1.94 9.90E+17 1992 283.14 1.88 7.24E+17 1993 308.95 1.84 4.43E+17 1994 354.36 1.77 4.10E+17 1995 427.09 2.37 4.07E+17 1996 421.02 2.18 2.41E+17 1997 405.89 2.28 2.35E+17 1998 410.27 1.97 6.52E+17 1999 438.82 1.77 6.15E+17 2000 447.83 1.88 7.24E+17 2001 425.88 1.77 7.65E+17 2002 439.80 1.95 8.35E+17 2003 540.23 2.31 9.89E+17 2004 451.42 1.81 7.21E+17 2005 472.96 2.07 6.10E+17 2006 430.97 1.81 2.92E+17 2007 441.12 1.63 1.92E+17 2008 450.60 1.48 1.89E+17 2009 364.60 1.25 1.29E+17 2010 403.60 1.38 2.51E+17 2011 420.79 1.47 3.19E+17 2012 408.36 1.48 5.27E+17 2013 396.99 1.41 3.92E+17 2014 398.28 1.56 3.70E+17 2015 437.36 2.16 5.79E+17
Univers
ity of
Mala
ya

35
4.1.2 Data of Geomagnetic Storm Index
In this section, we presented the data of the mediator for studying the correlation
between solar and seismic activities. We presented three classifications of
geomagnetic storm indices, which are; DST, Kp and Ap indices. As well as solar
wind parameters, we also presented the yearly mean data of geomagnetic storm
indices (DST, Kp and Ap indices) in Table 4.3.
Table 4.3: Data for annual and yearly mean of disturbance storm time (DST), 3-hour interplanetary (Kp) and average planetary (Ap) indices.
Year Yearly Mean
DST index Yearly Mean
Kp Index Yearly Mean
Ap Index 1976 -13.5 22.4 12.9 1977 -17.0 21.4 11.9 1978 -22.1 25.0 16.9 1979 -16.0 24.5 14.5 1980 -11.5 20.9 11.1 1981 -24.4 25.8 16.3 1982 -23.5 30.6 22.4 1983 -17.1 28.2 18.5 1984 -17.4 28.5 18.8 1985 -15.8 23.5 13.7 1986 -15.6 21.6 12.5 1987 -11.8 20.7 10.9 1988 -19.9 22.5 12.7 1989 -29.8 27.7 19.5 1990 -21.0 25.5 16.2 1991 -30.7 30.2 23.4 1992 -20.2 25.8 16.5 1993 -17.7 24.4 15.0 1994 -21.3 27.4 18.1 1995 -16.8 21.6 12.6 1996 -10.9 18.9 9.3 1997 -14.5 16.3 8.4 1998 -17.0 20.2 12.0 1999 -13.1 21.9 12.5 2000 -19.0 23.6 15.0 2001 -17.7 21.0 12.9 2002 -21.0 22.6 13.1 2003 -22.1 30.7 21.8
Univers
ity of
Mala
ya
36
Table 4.3 continued
Year Yearly Mean DST index
Yearly Mean Kp Index
Yearly Mean Ap Index
2004 -12.2 21.8 13.4 2005 -16.3 21.5 13.5 2006 -11.7 16.1 8.5 2007 -8.2 15.1 7.5 2008 -7.8 14.6 6.9 2009 -2.9 9.0 3.9 2010 -9.5 12.6 6.0 2011 -11.2 14.9 7.5 2012 -8.3 16.8 9.1 2013 -7.8 14.8 7.6 2014 -6.7 16.3 7.7 2015 -15.1 21.2 12.2
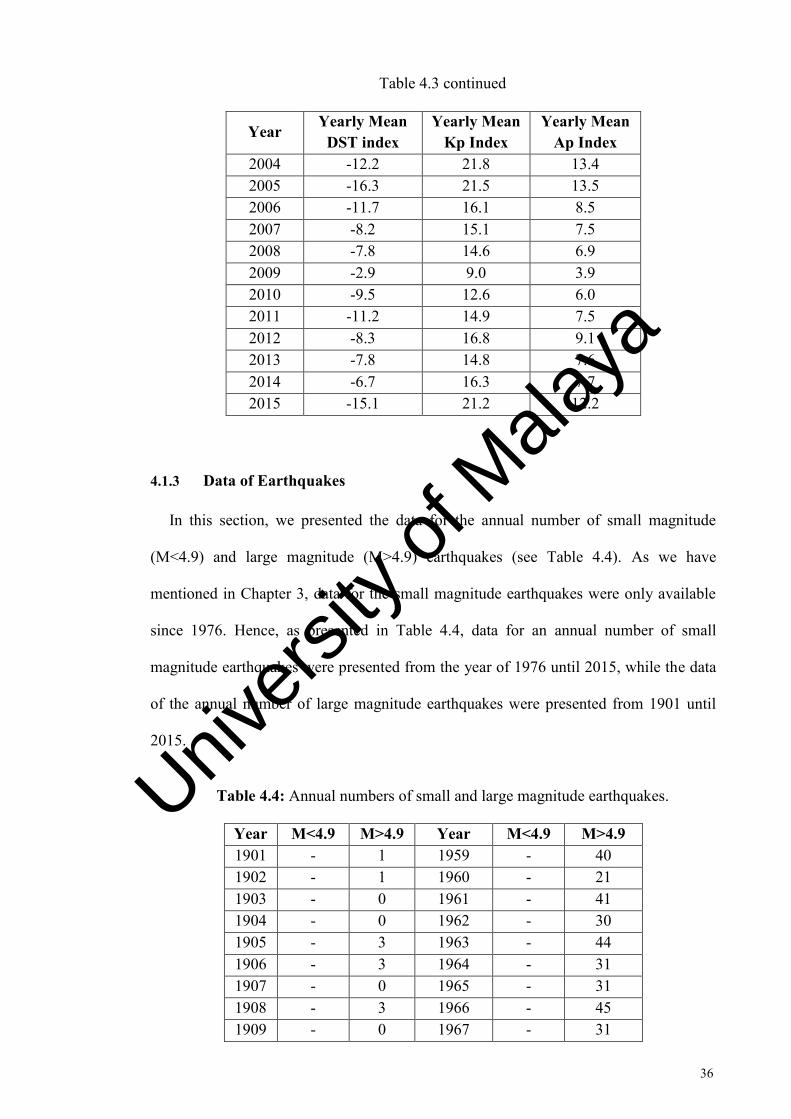
4.1.3 Data of Earthquakes
In this section, we presented the data for the annual number of small magnitude
(M<4.9) and large magnitude (M>4.9) earthquakes (see Table 4.4). As we have
mentioned in Chapter 3, data for the small magnitude earthquakes were only available
since 1976. Hence, as presented in Table 4.4, data for an annual number of small
magnitude earthquakes were presented from the year of 1976 until 2015, while the data
of the annual number of large magnitude earthquakes were presented from 1901 until
2015.
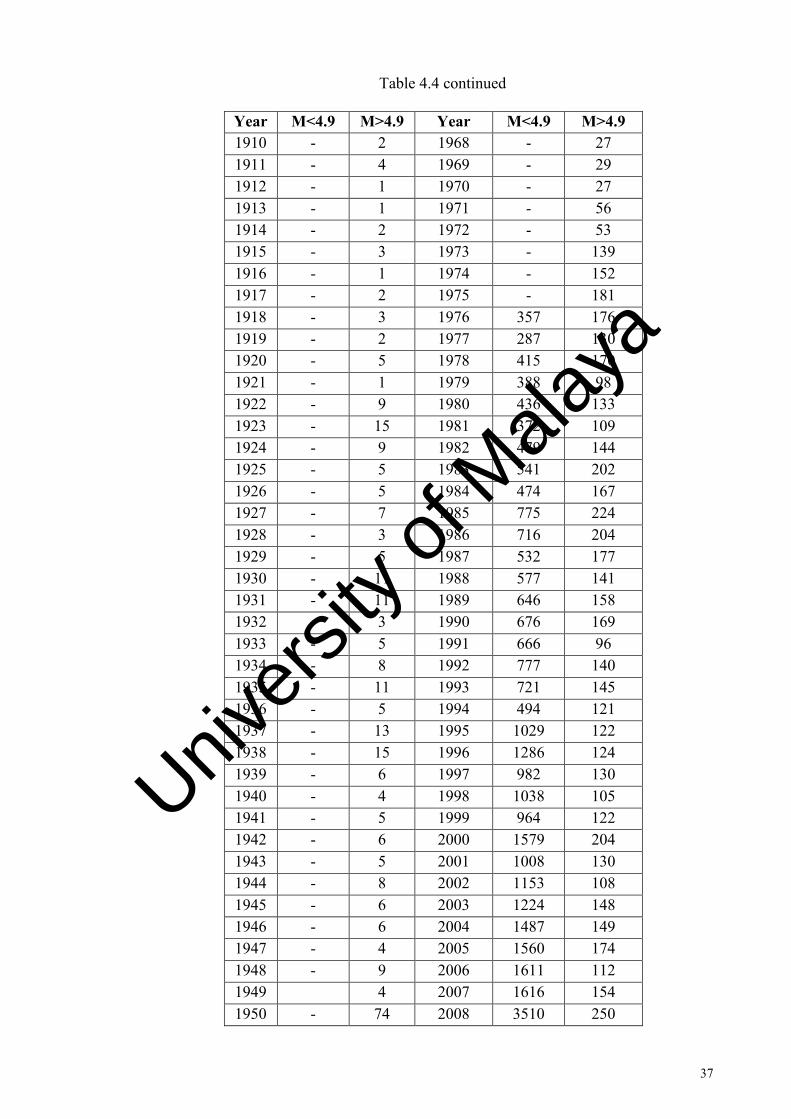
Table 4.4: Annual numbers of small and large magnitude earthquakes.
Year M<4.9 M>4.9 Year M<4.9 M>4.9 1901 - 1 1959 - 40 1902 - 1 1960 - 21 1903 - 0 1961 - 41 1904 - 0 1962 - 30 1905 - 3 1963 - 44 1906 - 3 1964 - 31 1907 - 0 1965 - 31 1908 - 3 1966 - 45 1909 - 0 1967 - 31
Univers
ity of
Mala
ya
37
Table 4.4 continued
Year M<4.9 M>4.9 Year M<4.9 M>4.9 1910 - 2 1968 - 27 1911 - 4 1969 - 29 1912 - 1 1970 - 27 1913 - 1 1971 - 56 1914 - 2 1972 - 53 1915 - 3 1973 - 139 1916 - 1 1974 - 152 1917 - 2 1975 - 181 1918 - 3 1976 357 176 1919 - 2 1977 287 130 1920 - 5 1978 415 170 1921 - 1 1979 388 98 1922 - 9 1980 436 133 1923 - 15 1981 372 109 1924 - 9 1982 479 144 1925 - 5 1983 541 202 1926 - 5 1984 474 167 1927 - 7 1985 775 224 1928 - 3 1986 716 204 1929 - 5 1987 532 177 1930 - 11 1988 577 141 1931 - 11 1989 646 158 1932 - 3 1990 676 169 1933 - 5 1991 666 96 1934 - 8 1992 777 140 1935 - 11 1993 721 145 1936 - 5 1994 494 121 1937 - 13 1995 1029 122 1938 - 15 1996 1286 124 1939 - 6 1997 982 130 1940 - 4 1998 1038 105 1941 - 5 1999 964 122 1942 - 6 2000 1579 204 1943 - 5 2001 1008 130 1944 - 8 2002 1153 108 1945 - 6 2003 1224 148 1946 - 6 2004 1487 149 1947 - 4 2005 1560 174 1948 - 9 2006 1611 112 1949
4 2007 1616 154
1950 - 74 2008 3510 250
Univers
ity of
Mala
ya

38
Table 4.4 continued
Year M<4.9 M>4.9 Year M<4.9 M>4.9 1951 - 68 2009 659 137 1952 - 39 2010 779 133 1953 - 37 2011 2296 464 1954 - 35 2012 1171 164 1955 - 41 2013 1152 171 1956 - 29 2014 1397 137 1957 - 24 2015 1449 142 1958 - 48
4.2 Analysis
4.2.1 Variation of sunspot number
In order to examine and investigate the solar cycle variation, this research plotted the
data of yearly mean sunspot number presented in Table 4.1. The variations of the yearly
mean sunspot numbers from 1901 up to the end of 2015 are illustrated in Figure 4.1.
Figure 4.1: The variation of sunspot number (SN) for 114 years (1901-2015).
Univers
ity of
Mala
ya

39
From Figure 4.1, we found that the whole 114 years (1901-2015) covers about ±11
solar cycles (14th up to the middle of the 24th solar cycle), while Khodairy et al. (2015)
mentioned that the 1st solar cycle begins in 1775. From figure 4.1, we also found that
one solar cycle takes about ±11 years of variation in sunspot number. However, for
every solar cycle, we found that the variation of sunspot number for the ascending phase
varies about ±5 years, while for the descending phase takes about ±7 years (Khain &
Khalilov, 2007).
4.2.2 The Variation of Solar Wind Parameters, Geomagnetic Storm Indices and
Annual Numbers of Earthquake Based On Solar Cycle
4.2.2.1 The variation of solar wind parameters
As mentioned in Chapter 1 that the solar wind transfers energy into the earth
magnetic field. However, the interaction between the solar wind and earth’s magnetic
field will affect the ionospheric current and tectonic plate movement. Hence, in order to
investigate the correlation between solar and seismic activities, we plotted and analysed
the trend of solar wind speed, solar wind dynamic pressure and solar wind input energy
based on the variation of the solar cycle. By referring to Figure 4.1, the data of solar
wind parameters that were presented in Table 4.2 covers about ±4 solar cycles (21st up
to the middle of the 24th solar cycle). Hence, we presented the variations of solar wind
parameters during the 21st up to the middle of the 24th solar cycle in Figures 4.2 until
4.5. Univers
ity of
Mala
ya

40
Figure 4.2: The variation of yearly mean sunspot number (a), yearly mean solar wind speed (SWS) (km/s) (b), yearly mean solar wind dynamic pressure (SW DynP) (nPa) and (c) yearly mean solar wind input energy (SW ε) (Watt or Erg/s) during 21st solar cycle.
Univers
ity of
Mala
ya

41
Figure 4.3: The variation of yearly mean sunspot number (a), yearly mean solar wind speed (SWS) (km/s) (b), yearly mean solar wind dynamic pressure (SW DynP) (nPa) and (c) yearly mean solar wind input energy (SW ε) (Watt or Erg/s) during 22nd solar cycle.
Univers
ity of
Mala
ya

42
Figure 4.4: The variation of yearly mean sunspot number (a), yearly mean solar wind speed (SWS) (km/s) (b), yearly mean solar wind dynamic pressure (SW DynP) (nPa) and (c) yearly mean solar wind input energy (SW ε) (Watt or Erg/s) during 23rd solar cycle.
Univers
ity of
Mala
ya

43
Figure 4.5: The variation of yearly mean sunspot number (a), yearly mean solar wind speed (SWS) (km/s) (b), yearly mean solar wind dynamic pressure (SW DynP) (nPa) and (c) yearly mean solar wind input energy (SW ε) (Watt or Erg/s) during middle of 24th solar cycle.
The red bar charts in Figures 4.2 until 4.5 indicated as the maximum value for solar
wind speed, solar wind dynamic pressure and solar wind input energy in each solar
cycle. Those figures show that the maximum values of the solar wind speed during the
21st up to the middle of the 24th solar cycles were found in 1981, 1995, 2003 and 2008,
respectively. For the same solar cycles, the maximum values of solar wind dynamic
pressure were found in 1982, 1995, 2003 and 2015. On the other hand, the maximum
values of solar wind input energy were found in the year 1982, 1991, 2003 and 2015.
Univers
ity of
Mala
ya

44
Hence, we suggested that the maximum peak value for solar wind speed, solar wind
dynamic pressure and solar wind input energy were found during the years of
descending phase of the solar cycle.
4.2.2.2 The variation of geomagnetic storm indices
In order to use the inclusion of geomagnetic storm in understanding the correlation
between solar and seismic activities, we plotted and analysed the trend of DST, Kp and
Ap indices based on the variation of the solar cycle. By considering Figure 4.1, the data
of geomagnetic storm indices that were presented in Table 4.3 covers about ±4 solar
cycles (21st up to the middle of the 24th solar cycle). Hence, we presented the variations
of geomagnetic storm indices during the 21st up to the middle of the 24th solar cycle (see
Figures 4.6 until 4.9).
Univers
ity of
Mala
ya

45
Figure 4.6: The variation of yearly mean sunspot number (a), yearly mean DST index (b), yearly mean Kp index and (c) yearly mean Ap index during 21st solar cycle.
Figure 4.7: The variation of yearly mean sunspot number (a), yearly mean DST index (b), yearly mean Kp index and (c) yearly mean Ap index during 22nd solar cycle.
Univers
ity of
Mala
ya

46
Figure 4.8: The variation of yearly mean sunspot number (a), yearly mean DST index (b), yearly mean Kp index and (c) yearly mean Ap index during 23rd solar cycle.
Figure 4.9: The variation of yearly mean sunspot number (a), yearly mean DST index (b), yearly mean Kp index and (c) yearly mean Ap index during middle of 24th solar cycle.
Univers
ity of
Mala
ya

47
The green bar charts in Figures 4.6 until 4.9 indicate as the maximum value for DST,
Kp and Ap indices in each solar cycle. Those figures show that during the 21st up to the
middle of 24th of the solar cycle, the maximum peak value of the DST index were found
in 1981, 1991, 2003 and 2015, respectively. On the other hand, the maximum peak
value of Kp index during the 21st up to the middle of the 24th solar cycle were found in
the year 1982, 1991, 2003 and 2015, respectively. At the same solar cycle, the
maximum peak value of Ap index was found in the year 1982, 1991, 2003 and 2015,
respectively. Hence, we suggest that for each solar cycle, the maximum peak value for
DST, Kp and Ap indices were found in years of the descending phase of the solar cycle.
4.2.2.3 The variation of annual number of earthquake
From section 4.2.2.1 and 4.2.2.2, we mentioned that for each solar cycle, the
maximum value of solar wind parameters and geomagnetic indices were found during
the descending phase of the solar cycle (from the 21st up to the middle of the 24th solar
cycle). In this section, we also analysed the variation in annual numbers of small
(M<4.9) and large (M>4.9) magnitude earthquakes based on variation solar cycle. We
also investigated the maximum peak value of small and large magnitudes earthquakes in
every solar cycle.
By considering Figure 4.1, the annual numbers of large magnitude earthquakes that
were presented in Table 4.4 cover about ±11 solar cycles (14th up to the middle of the
24th solar cycle). However, the annual numbers of small magnitude earthquake cover
only about ±4 solar cycles (21st up to the middle of the 24th solar cycle). Hence, we
plotted the variation of annual small (see Figures 4.10 until 4.13) and large (see Figures
4.14 until 4.24) magnitude earthquakes during those solar cycles.
Univers
ity of
Mala
ya

48
Figure 4.10: The variation of an annual number of small magnitude earthquakes during the 21st solar cycle.
Figure 4.11: The variation of an annual number of small magnitude earthquakes during the 22nd solar cycle.
Figure 4.12: The variation of an annual number of small magnitude earthquakes during the 23rd solar cycle.
Univers
ity of
Mala
ya

49
Figure 4.13: The variation of an annual number of small magnitude earthquakes during the middle of the 24th solar cycle.
The yellow lines in bar charts presented in Figure 4.10 to 4.13 indicate as the
maximum value for the annual number of small magnitude earthquakes in each solar
cycle. Those Figures show the annual variations of small magnitude earthquakes are at
the same solar cycle as the solar wind parameters and geomagnetic indices, which are
during the 21st until the middle of the 24th solar cycle. From Figures 4.10 and 4.11, the
maximum value of annual small magnitude earthquakes during the 21st and 22nd solar
cycles was found in the year 1985 and 1986, respectively. On the other hand, for both of
the 23rd and half of 24th solar cycle, the maximum peak value of small magnitude
earthquakes was found in the same year, that is 2008 (see Figures 4.12 and 4.13).
Hence, we also suggest that the maximum value of an annual number of small
magnitude earthquake during 21st up to the middle of the 24th solar cycle were found
during descending phase except during 24th solar cycle. The 24th solar cycle is still
ongoing, while Ajabshirizadeh et al., (2011) were predicted that the last minimum year
for the 24th solar cycle is predicted on year around 2018 or 2019.
Univers
ity of
Mala
ya

50
As mentioned before, data for the annual numbers of large magnitude earthquakes
were available since 1901 until 2015 (see Table 4.4). Hence, we analysed, investigated
and plotted their variation during the 14th up to the middle of the 24th solar cycle (see
Figures 4.14 until 4.24).
Figure 4.14: The variation of annual of large magnitude earthquake during 14th solar cycle.
Figure 4.15: The variation of annual of large magnitude earthquake during 15th solar cycle.
Univers
ity of
Mala
ya
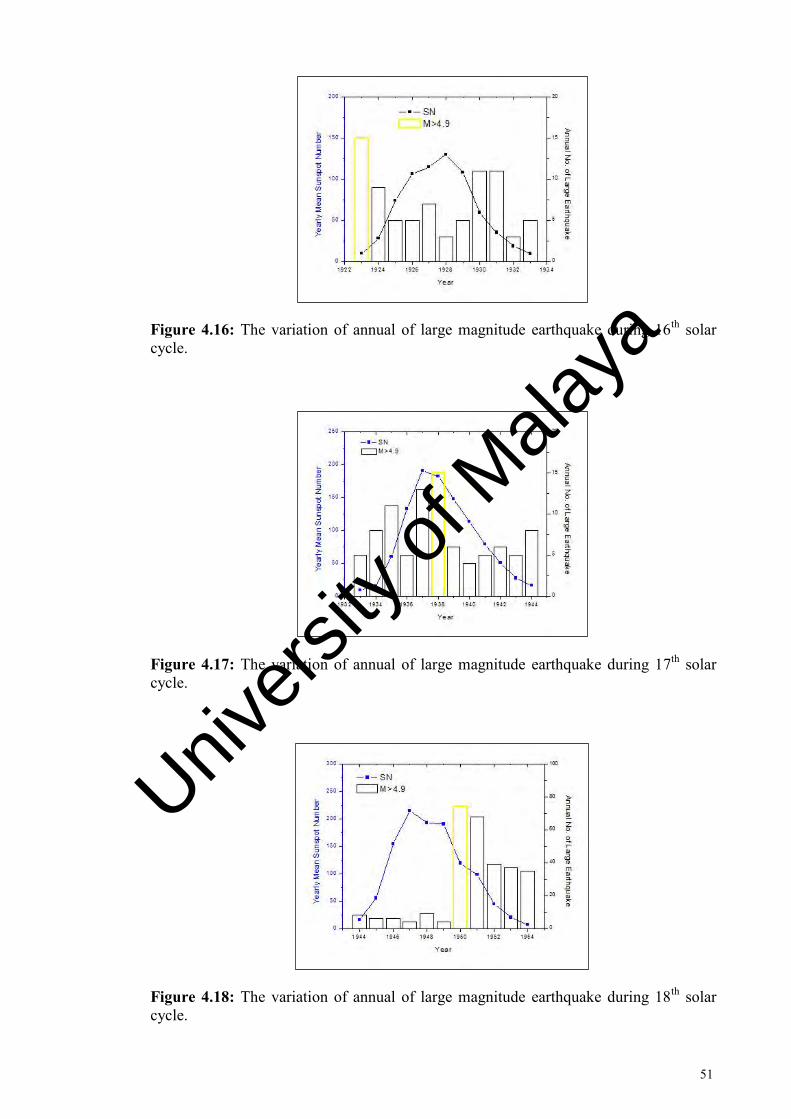
51
Figure 4.16: The variation of annual of large magnitude earthquake during 16th solar cycle.
Figure 4.17: The variation of annual of large magnitude earthquake during 17th solar cycle.
Figure 4.18: The variation of annual of large magnitude earthquake during 18th solar cycle.
Univers
ity of
Mala
ya

52
Figure 4.19: The variation of annual of large magnitude earthquake during 19th solar cycle.
Figure 4.20: The variation of annual of large magnitude earthquake during 20th solar cycle.
Figure 4.21: The variation of annual of large magnitude earthquake during 21st solar cycle.
Univers
ity of
Mala
ya

53
Figure 4.22: The variation of annual of large magnitude earthquake during 22nd solar cycle.
Figure 4.23: The variation of annual of large magnitude earthquake during 23rd solar cycle.
Figure 4.24: The variation of annual of large magnitude earthquake during middle of 24th solar cycle.
Univers
ity of
Mala
ya

54
The yellow lines in bar charts illustrated in Figures 4.14 until 4.24 indicate the
maximum value for the annual number of large magnitude earthquakes in each solar
cycle from the 14th up to the middle of 24th. Table 4.5 shows the peak values of large
magnitude earthquakes by year, it was found that the maximum annual number of large
magnitude earthquakes during those solar cycles were found in 1911, 1923, 1938, 1950,
1958, 1975, 1985, 1986, 2008 and 2011. Note that the 15th and 16th solar cycles overlap
in 1923. All the years presented were during the descending phase except for 1923 (see
Figure 4.16) and 1986 (see Figure 4.22). Hence, we suggest that from the 14th up to the
middle of the 24th solar cycle (excluding the 16th and 22nd solar cycles), the maximum
annual number of large magnitude earthquakes were found during the years of the
descending phase.
Table 4.5: The year of maximum value number of large magnitude earthquake.
Solar Cycle Year of max peak value 14th 1911 15th 1923 16th 1923 17th 1938 18th 1950 19th 1958 20th 1975 21st 1985 22nd 1986 23rd 2008 24th 2011
From our analysis and investigation, we suggest that the maximum value of the solar
wind parameters (speed, dynamic pressure and input energy of solar wind),
geomagnetic storm indices (DST, Kp, and Ap indices) and annual number of
earthquakes (both of small and large magnitudes) for every solar cycle were found
during the year of descending phase.
Univers
ity of
Mala
ya

55
4.2.3 The Variation of the Solar Wind Parameters, Geomagnetic Storm Index and Earthquake during Ascending and Descending Phases of Each Solar Cycle
From section 4.2.2, we mentioned that the maximum peak value for solar wind
parameters, geomagnetic indices and an annual number of small and large magnitude
earthquakes were found during the descending phases of the solar cycle. Therefore we
are motivated to analyse and investigate their variation by considering the ascending
and descending phases of each solar cycle. Hence, by referring to Tables 4.1until 4.4, all
of the data of solar activities, geomagnetic storm indices and a number of earthquakes
during ascending and descending phases of the solar cycle are presented in Tables 4.6
and 4.7, respectively.
For further investigation, by referring to Tables 4.6 and 4.7, we plotted the graphs in
order to examine the variations of solar wind parameters, geomagnetic storm indices
and an annual number of earthquakes during the ascending and descending phases of
the solar cycle.
Firstly, we plotted and analysed the graphs of yearly mean solar wind parameters by
considering the ascending and descending phases of the 21st up to the middle of the 24th
solar cycles. This research has found that the variation of the yearly mean solar wind
speed (see Figure 4.25), solar wind dynamic pressure (see Figure 4.26), and solar wind
input energy (see Figure 4.27) are higher during the descending than the ascending
phase of the solar cycle, except during 24th solar cycle which is still incomplete.
Univers
ity of
Mala
ya

56
Table 4.6: Data for SN, SWS, SW DynP, SWε, DST index, Kp index, Ap index, and during ascending phases of 14th up to the middle of the 24th solar cycle.
SC (Year) SN DST
index KP
index AP
index SW
speed SW
Pdyn SW ε
(E+18) No. of
EQ No. of
EQ 14
(1901-1905) 229.5 - - - - - - - 5
15 (1913-1917) 366.1 - - - - - - - 9
16 (1923-1927) 332.8 - - - - - - - 41
17 (1933-1937) 407.4 - - - - - - - 42
18 (1944-1947) 440.4 - - - - - - - 24
19 (1954-1957) 530.8 - - - - - - - 129
20 (1964-1968) 386.7 - - - - - - - 165
21 (1976-1979) 408.8 -68.6 93.3 56.2 1618.8 8.4 1.8 1447 574
22 (1986-1989) 382.8 -77.1 92.5 55.6 1212.9 6.7 2.0 2471 680
23 (1996-2000) 439.0 -74.6 100.9 57.2 2123.8 10.1 2.5 5849 685
24 (2008-2012) 199.2 -39.7 67.9 33.4 2048.0 7.1 1.4 8415 1148
Table 4.7: Data for SN, SWS, SW DynP, SWε, DST index, Kp index, Ap index, and EQ during descending phases of 14th up to the middle of the 24th solar cycle.
SC (Year)
SN
DST index
KP index
AP index
SW Speed
SW Pdyn
SW ε (E+18)
No. of EQ
No. of EQ
14 (1905-1913) 501.3 - - - - - - - 17
15 (1917-1923) 553.5 - - - - - - - 37
16 (1927-1933) 474.9 - - - - - - - 45
17 (1937-1944) 807.4 - - - - - - - 62
18 (1947-1954) 887.3 - - - - - - - 270
19 (1957-1964) 1099.8 - - - - - - - 279
20 (1968-1976) 783.6 - - - - - - - 840
21 (1979-1986) 987.2 -141.3 203.6 127.8 2770.1 14.67 4.9 4181 1281
22 (1989-1996)
896.9 -168.4 201.5 130.6 2676.2 15.06 4.5 6295 1075
23 (2000-2008) 759.8 -136.0 187.0 112.6 4100.8 16.71 5.3 14748 1429
24 (2012-2015) 361.5 -37.9 69.1 36.6 1641.0 6.61 1.9 5169 614
Univers
ity of
Mala
ya

57
Figure 4.25: The variation of solar wind speed during ascending and descending of 21st up to middle of 24th solar cycle.
Figure 4.26: The variation of solar wind dynamic pressure during ascending and descending of 21st up to the middle of the 24th solar cycle.
Figure 4.27: The variation of solar wind input energy during ascending and descending of 21st up to the middle of the 24th solar cycle.
Univers
ity of
Mala
ya

58
Secondly, in order to investigate the inclusion of geomagnetic storm as a mediator to
study the correlation between solar and earth seismic activities, we also plotted and
examined the graphs of the variation in yearly mean geomagnetic storm indices. We
also presented their variation based on ascending and descending phases of the solar
cycle. From our investigation, we found that yearly mean DST index (see Figure 4.28),
yearly mean Kp index (see Figure 4.29), and yearly mean Ap index (see Figure 4.30)
are higher during the descending phase of each of the 21st up to the middle of the 24th
solar cycle.
Figure 4.28: The variation of DST index during ascending and descending of 21st up to middle of 24th solar cycle.
Figure 4.29: The variation of Kp index during ascending and descending of 21st up to middle of 24th solar cycle.
Univers
ity of
Mala
ya

59
Figure 4.30: The variation of Ap index during ascending and descending of 21st up to middle of 24th solar cycle.
As mentioned before, the solar wind parameters and geomagnetic storm indices were
used as a mediator in order to study the correlation between solar and earth seismic
activities. From graphs that are presented in Figures 4.25 until 4.30, we concluded that
during the 21st up to the middle of the 24th solar cycle, the variation of solar wind
parameters and geomagnetic storm indices are higher during the descending phase,
except during the incomplete of the 24th solar cycle. In this case, we are motivated to
investigate the variation of the annual number of earthquakes during the ascending and
descending phases of the solar cycle.
Data of annual numbers of small magnitude earthquakes during the ascending and
descending phases that were presented in Tables 4.5 and 4.6 were only available for
about ±4 solar cycles only (21st up to middle of 24th solar cycle), while the data of the
annual numbers of large magnitude earthquake available about ±11 solar cycles (14th up
to middle of 24th solar cycle). Therefore, we plotted and investigated their variation
during the ascending and descending phases in different solar cycles. From this
research, we found that the variation of the annual number of small (see Figure 4.31)
and large magnitude earthquakes (see Figure 4.32) are also higher during the
descending phase of the solar cycle, except during the incomplete of the 24th solar cycle.
Univers
ity of
Mala
ya

60
Figure 4.31: The variation of number of small magnitude earthquake during ascending and descending phase of 21st up to middle of 24th solar cycle.
Figure 4.32: The variation of number of large magnitude earthquake during ascending and descending phase of 21st up to middle of 24th solar cycle.
From this section (section 4.2.3), we found that the solar wind parameters,
geomagnetic storm indices and the annual number of the earthquake are higher during
the descending phase for all solar cycles, except during the incomplete 24th solar cycle.
Furthermore, we are motivated to predict the data for the annual number of small and
large magnitude earthquakes during the incomplete descending phase of the 24th solar
cycle, in order to assist us in investigating their variation during the ascending and
descending phase of the 24th solar cycle (from the year 2008 until 2019).
Univers
ity of
Mala
ya

61
4.2.4 The Prediction of the Data of Annual Number of Earthquakes during the Incomplete Descending Phase of the 24th Solar Cycle
This research predicts the data of an annual number of earthquakes by using two
methods of solar cycles, which are based on the yearly mean sunspot number
(conventional solar cycle) and the yearly mean solar wind input energy (modified solar
cycle) (see Figure 4.33). In this research, data for the annual number of small
earthquakes was only available starting from the year 1976 until 2015, which covered
the 21st up to the middle of the 24th solar cycle. Hence, we used a polynomial fitting line
starting from the 21st until the 23rd solar cycle, to predict the data of the annual number
of earthquakes (within next three years (2017-2019)1) during the incomplete descending
phase of the 24th solar cycle.
Figure 4.33 : The variation of conventional and modified of 21st up to the middle of the 24th solar cycle.
1 The annual number of small and large earthquake in 2016 retrieved from USGS on 20th January 2017.
Univers
ity of
Mala
ya

62
4.2.4.1 The prediction by considering the variation of yearly mean sunspot number
The descending phase of the 24th solar cycle was predicted from about 2012 until
2019 (Ajabshirizadeh et al., 2011; Attia et al., 2013; Pesnell, 2008; Pishkalo, 2014;
Schatten, 2003). In this section, data for the small and large magnitude earthquakes
were predicted by considering the conventional solar cycle. The variation of yearly
mean sunspot number was used to indicate the variation of the solar cycle (conventional
solar cycle).
Firstly, we focused on predicting the data of an annual number of small magnitude
earthquake during the incomplete descending phase of the 24th solar cycle. We plotted
the graph of the variation of small magnitude earthquake during the descending phase of
the 21st until 23rd solar cycle (see Figures 4.34(a) until 4.34(c)). From those figures, we
used the averaged polynomial fitting parameters in order to predict data of the annual
number of small magnitude earthquakes during the descending phase of the 24th solar
cycle (see Figure 4.34(d)).
Univers
ity of
Mala
ya

63
Figure 4.34: The trend of annual small magnitude earthquake (a) during the 21st conventional solar cycle, (b) during the 22nd conventional solar cycle, (c) during the 23rd conventional solar cycle and (d) during prediction of the 24th conventional solar cycle.
Secondly, we predicted the data of large magnitude earthquakes during the
incomplete descending phase of the 24th solar cycle. We used the same method with the
prediction of an annual number of small magnitude earthquakes. Hence, from the
averaged polynomial fitting parameters of the variation in annual number of large
magnitude earthquakes during the descending phase of the 21st until 23rd solar cycle (see
Figure 4.35(a) until 4.35(c)), we predicted the data for the annual number of large
magnitude earthquakes during the descending phase of the 24th solar cycle which is
illustrated in Figure 4.35(d). Univers
ity of
Mala
ya

64
Figure 4.35: The trend of annual large magnitude earthquake (a) during the 21st conventional solar cycle, (b) during the 22nd conventional solar cycle, (c) during the 23rd conventional solar cycle and (d) during prediction of the 24th conventional solar cycle.
4.2.4.2 The prediction by considering the variation of the yearly mean solar wind input energy
Basically, this section uses the same method with the previous section (section
4.2.4.1). We also used the averaged polynomial fitting parameters during descending
phase of the 21st until the 23rd solar cycle in order to predict the annual number of small
magnitude earthquake during the descending phase of the 24th solar cycle. However, in
this section, we used the variation of yearly mean solar wind input energy in order to
suggest the modified solar cycle.
For further investigation, firstly, we focused on predicting the data of the annual
number of small magnitude earthquakes during the incomplete descending phase of the
24th modified solar cycle. Figures 4.36(a) until 4.36(c) illustrates the variation of small
magnitude earthquake during the descending phase of the 21st until 23rd modified solar
cycle.
Univers
ity of
Mala
ya

65
By applying the averaged polynomial fitting parameters of those figures, we
predicted the data for the annual number of small magnitude earthquakes during the
descending of 24th modified solar cycle (see Figure 4.36(d)).
Figure 4.36: The trend of annual small magnitude earthquake (a) during 21st modified solar cycle, (b) during 22nd modified solar cycle, (c) during 23rd modified solar cycle and (d) during prediction of 24th modified solar cycle.
Secondly, we predicted the data of the annual number of large magnitude
earthquakes during the incomplete descending phase of the 24th modified solar cycle
(see Figure 4.37(d)). This prediction also used the polynomial fitting parameters of the
variation large magnitude earthquake during the descending phase of the 21st until 23rd
modified solar cycle (see Figure 4.37(a) until 4.37(c)). Univers
ity of
Mala
ya

66
Figure 4.37: The trend of annual large magnitude earthquake (a) during 21st modified solar cycle, (b) during 22nd modified solar cycle, (c) during 23rd modified solar cycle and (d) during prediction of 24th modified solar cycle.
From Figures 4.34 until 4.37, we found that there is an increasing in an annual
number of small and large magnitude earthquakes during the descending phase of the
21st until 24th conventional and modified solar cycles. From those figures, we also found
that the prediction by considering the variation of the conventional and modified solar
cycle, data for the annual small and large magnitude earthquakes for the year 2017 until
2019 increases. From Figures 4.34(d) and 4.36(d), by using the conventional solar
cycle, there will be 1395, 1606 and 1883 small magnitude earthquakes annually; and by
using the modified solar cycle, there will be 2417, 2550 and 2680 small magnitude
earthquakes annually in the year 2017, 2018 and 2019, respectively. As illustrated in
Figures 4.34(d) and 4.37(d), by using the conventional solar cycle, there will be 159,
170 and 185 large magnitude earthquakes annually; and by using modified solar cycle,
there will be 231, 234 and 238 large magnitude earthquakes annually in the year 2017,
2018 and 2019, respectively.
Univers
ity of
Mala
ya

67
All the data prediction during the incomplete descending phase of the 24th
conventional and modified solar cycle which covers from 2017 until 2019 were
presented in Table 4.8. From that Table, we suggested that there is an increasing of the
annual number of small and large magnitude earthquake which predicted by using
conventional and modified solar cycle’s polynomial fitting.
Table 4.8: Data prediction of earthquake during descending phase of 24th solar.
Year Annual No. of prediction
small EQ (M<4.9) Annual No. of prediction
Large EQ (M>4.9) By CSC By MSC By MSC By MSC
2017 1395 2417 159 231 2018 1606 2550 170 234 2019 1883 2680 185 238
Lastly, we compared the different variation of the data prediction for number of
earthquake (2017-2019) between the conventional and modified solar cycles. By
referring Figures 4.34 (d) and 4.36 (d), the different variation of the data prediction of
the small earthquake was presented in Figure 4.38 (a). Furthermore, by referring Figures
4.35 (d) and 4.37 (d), we also presented the different variation data of the number of
large magnitude earthquake (see Figure 3.38 (b)). The yellow bars illustrated in Figure
4.38 are indicate as the data prediction earthquake during 24th conventional solar cycle,
while the orange bars are indicate as the data prediction of earthquake during 24th
modified solar cycle.
Univers
ity of
Mala
ya

68
Figure 4.38: The variation of (a) small magnitude earthquake and (b) large magnitude earthquake during 24th solar cycle.
Univers
ity of
Mala
ya

69
CHAPTER 5: DISCUSSION
From chapter 4, we have investigated and analysed the variation and correlation
between the solar and seismic activities by considering the ascending and descending
phases of the solar cycles. From the result and analysis of this research, it shows that in
each solar cycle, the annual number of small and large magnitude earthquakes were at
maximum value during the years of the descending phase. This research also finds that
the annual variations of small and large magnitude earthquakes are higher during the
descending phase. By implementing the solar wind parameters and geomagnetic storm
indices, this research used those two data sets in order to explain the physical
mechanism of solar and seismic activities. Other than that, several topics such as the
Lorentz force, the interaction between solar wind and earth magnetic field, and
energetic particles driven into the magnetosphere layer are also involved in order to
discuss the physical mechanism of solar activities and its influence on earthquake
occurrences.
5.1 Lorentz Force
The Lorentz force is the total electric and magnetic field forces exerted on an
electrically charged particle in an electromagnetic field (Montalibet et al., 2001). The
ocean's ability to induce electromagnetic fields from the movement of seawater relies on
the deflection of electrically charged sea water ions by the Lorentz force perpendicular
to the velocity and magnetic field vectors (Tyler et al., 2003):
𝑭 𝑳𝒐𝒓𝒆𝒏𝒕𝒛 = 𝒒[𝑬 + (𝑽 × 𝑩)] (4)
where q is the charge of the water ions, v is their velocity and E and B are the electric
and magnetic fields, respectively.
Univers
ity of
Mala
ya

70
This research involves the use of the Lorentz force as a geophysical aspect in order to
explain the piezo magnetic effect. (Sasai (1980),(1984)) investigated the tectonic
magnetic field based on the linear piezo magnetic effect and mentioned that the
magnetic field changes due to stress force. This force is an indication of the effect on
the magnetized earth’s crust and upper mantle due to the underground telluric currents.
The influence of the Lorentz force concept in the process of the tectonic stress and
seismic activities has been studied by Duma and Ruzhin (2003). They suggested that the
Lorentz force results from the interaction between magnetic field of the earth and
lithosphere, where from their interaction induced the sq-variation currents. The sq-
variation can be investigated with different local case area and time. Rabeh et al. (2010)
investigated the diurnal and long-term Sq-variation with seismic activities for an area in
the Sinai Peninsula. Their results showed that there is a good correlation between the
Sq-variation with seismic activity.
Other than that, Duma and Ruzhin (2003) investigated the Sq-variation with
earthquake for the E-China region and they also found the earthquake distribution
follows the Sq-variation. Therefore, the interactions between the induced Sq-variation
current in the earth’s lithosphere and earth’s magnetic field were considered as the
mechanism of that possibly influences the process of the tectonic stress field and
seismic activities.
5.2 Solar Wind and Earth Magnetic Field Interaction
As mentioned before, the interaction between solar wind and earth magnetic field
may assist us in understanding the mechanism of the correlation between solar and
seismic activities. The interaction between solar wind parameters and geomagnetic
activities, and their contributions in the process of the tectonic plate movement are
called as the solar geo-dynamo process. Therefore, this research considers the
Univers
ity of
Mala
ya

71
interaction between the solar wind parameters with the earth’s magnetic field
(geomagnetic storm activities) and how it may affects the movements of the tectonic
plates, which can lead to the occurrence of earthquake.
In addition, Rusov et al. (2010) proposed the mechanism of “solar dynamo-
geodynamo” connection by studying the correlation between energy in the Sun’s core
layer and the earth’s magnetic field. They proposed that the energy initially is
modulated by the magnetic field of the solar tachocline zone and is consequently
absorbed in the Earth’s liquid core layer under the influence of terrestrial magnetic field.
They concluded that the Sun’s core layer is playing the role of the energy source and
acts as a modulator of the earth’s magnetic field. Therefore, in our research, we found
that the geomagnetic storm indices variation follows the variation of the solar wind
parameters in every solar cycle, whereas the solar wind parameters and geomagnetic
storm indices maximum values were found during descending phase of the solar cycle
(see Chapter 4). In other words, the variation between solar wind parameters and
geomagnetic indices show a positive correlation. This result agrees to the previous
studies by Pellinen et al. (1982), where they mentioned that the substorm activity (AE
and AL indices) over the Scandinavia region correlated with to solar wind input energy.
The variation of geomagnetic storm index produced during descending phase of the
solar cycle also agrees with Mansilla (2014). Le et al. (2013) investigated the variation
of DST index by considering ascending and descending phases of the solar cycle. Their
conclusion supports our finding of geomagnetic storm indices at maxima and higher
during descending phase.
By taking into account of the explanation of the Lorentz force and the mechanism of
the “solar dynamo and geodynamo” connection, it can be concluded that the variation in
the energy of the sun is the main source of the earth’s magnetic field which is affecting
Univers
ity of
Mala
ya

72
the geomagnetic storm activities (DST, Kp and Ap indices). On the other hand, the
interaction between the sq-variation in the earth magnetic field and lithosphere layer
have considerable influence on the tectonic plate movement and seismic activity.
Therefore, this research also finds that the maximum values of the annual number for
small and large magnitude earthquakes were during the descending phase of the solar
cycle, whereas the maximum value of the geomagnetic storm activities which results
from the interaction of the solar wind and magnetic field of the earth also found during
the descending phase of the solar cycle.
The results of our research were agreed and supported by several previous
researchers. For example, Florindo and Alfonsi (1995) and Florindo et al. (1996)
investigated and examined the variation of strong earthquakes (M ≥ 7) correlated to the
sudden change of the earth’s magnetic field. They proposed and assumed that the
earthquake occurrences react upon the geodynamo at the Core Mantle Boundary, thus
causing the changes in the geomagnetic storm activity.
Other than that, Duma and Vilardo (1998) investigated the variation of the
earthquakes activities with magnitude not exceeding 3.4 (small earthquake) during 1972
– 1996 in the Mt. Vesuvius area and their correlation to the solar activity (solar flux)
and earth’s magnetic field. They concluded that the variation of the solar activity and
the earth’s magnetic field correlates to the variation of earthquake occurrences. Hence,
from their study, our research assumes that by studying the correlation between solar
activities (by investigating the variation sunspot number and solar wind parameters) and
earth’s magnetic field (by studying the geomagnetic storm indices), likewise the earth’s
magnetic field interacts with the lithosphere layer can be used in order to explain and
investigate the relationship between the solar and seismic activities. Other than that, our
research also agrees with Thébault et al. (2010). They studied on the magnetic field of
Univers
ity of
Mala
ya

73
the lithosphere, which is bounded at depth by mineralogical changes and elevated
temperatures. From their research, they assumed that the magnetic crust can be related
to tectonic and thermal processes.
5.3 Energetic Mass Particles of the Solar Wind
As mentioned in Chapter 2, the solar cycles are divided into 4 phases; ascending,
maxima, descending and minima. However, in Chapter 4, it has been shown that the
annual number of small and large earthquakes for China and its bordering countries are
higher during the descending phase. Therefore, this research also explains the possible
factors influencing earthquake occurrences during that phase by interpreting the solar
energy transfers into the earth magnetosphere layer.
In addition, other possible activities of the Sun that are involved in the interaction
between the solar wind and earth magnetosphere layer also included in this discussion.
Lopez et al. (2004) mentioned that the solar wind is the prime source of energy transfer
into the magnetosphere layer. They suggested that quantifying the energy transfer from
the solar wind into the magnetosphere layer is a fundamental problem in space physics.
Ballatore (2002) studies the Sun-Earth relation by considering the interaction between
the interplanetary medium and the terrestrial magnetosphere. He proposed that the
energy and particles of the Sun can enter the magnetosphere when reconnection occurs
between interplanetary magnetic field (IMF) and geomagnetic field. Augusto et al.
(2012) also mentioned that during the 11 year of solar cycle, the earth’s space
environment varies. It is disturbed by coronal mass ejection and corotating interaction
region from corona layer.
Moreover, there are other solar activities that participate in the transfer of solar wind
energy into the magnetosphere layer, namely; coronal mass ejection (CME) and
corrotating index rotation (CIR). In other words, the variation and correlation between
Univers
ity of
Mala
ya

74
the solar wind parameters and geomagnetic storm indices were based on the activities of
the CME and CIR from corona holes (Xiao‐Fei et al., 2015). On the other hand, the
activities of the CMEs and CIRs are varied by solar cycles. As mentioned in Chapter 2,
in each solar cycle, the maximum activity of the CME is during solar maxima, while
CIR is during descending phase of the solar cycle (Ballatore, 2002; Guarnieri et al.,
2006; Kivelson & Russell, 1995; Richardson & Cane, 2012; Richardson et al., 2000).
The variation of CME and CIR are illustrated in Figure 5.1.
Figure 5.1: The variation of large + major, medium and small geomagnetic storms in 1964 – 2011 (during 20th up to 23rd solar cycle) associated with CME and CIR(Richardson & Cane, 2012).
Richardson and Cane (2012) investigated the variation of geomagnetic indices and
their correlation with the CME and CIR during the 20th up to the 23rd solar cycles. From
their research, they found out that, in every solar cycle variation, the CME activities
follow the variation of sunspot number (solar cycle), while CIR activities are typically
prominent during the descending phase. Hence, by referring to Figure 5.1, we concluded
that the maximum value of solar wind parameters (see Figures 4.2 to 4.5) and
geomagnetic storm indices (see Figures 4.6 to 4.9) during the descending phase are due
to the activities of CIRs prominent on that phase. Therefore, we also found out that the
maximum value of annual small magnitude earthquakes during the descending phase
Univers
ity of
Mala
ya

75
(see Figures 4.10 to 4.13). The maximum value of large magnitude earthquakes from
the 14th up to middle of 24th solar cycle are also found during the descending phase,
except for the 22nd solar cycle (see Figures 4.14 to 4.24). During 22nd solar cycle, the
maximum value of large magnitude earthquake occurs near to solar maxima due to
CME activity.
In addition, the highest activity of the CMEs and CIRs are at maxima and during the
descending phase of the solar cycle, likewise the descending phase is longer than
ascending phase (Khain & Khalilov, 2007). Therefore, as shown in Chapter 4, we found
that the variation of solar wind parameters and geomagnetic storm indices are higher
during the descending phase (see Figures 4.25 to 4.30). Therefore, we also found out
that the variation of small and large magnitude earthquakes are higher during the
descending phase (see Figures 4.31 to 4.32).
Univers
ity of
Mala
ya
76
CHAPTER 6: CONCLUSION AND FUTURE WORK
This research was designed to investigate the correlation between solar and seismic
activities by interpreting the solar wind and geomagnetic storm parameters to
understand the physical phenomena. In the case of the solar wind, we investigated the
variation of speed, dynamic pressure and input energy of the solar wind. For the
geomagnetic storm phenomena, we looked at the variation of the DST, Kp and Ap
indices. All these aspects are divided and investigated by considering the ascending and
descending phases of each solar cycle.
The investigation on the maximum value of the solar wind parameters (speed,
dynamic pressure and input energy of the solar wind) and geomagnetic storm activities
(DST, Kp and Ap indices) during the year of the descending phase of each solar cycle
has shown that the geomagnetic activities are related to the solar wind activities. It has
also shown that the maximum value of the annual number of small and large magnitude
earthquakes is found during the years of the descending phase. These finding suggests
that in general, the increment and maximum value of earthquakes during the descending
phase is triggered by maximum value/activity of the solar wind and geomagnetic storm
during that phase.
The most obvious finding to emerge from this research is that by considering the
ascending and descending phases of each solar cycle, we found that the solar wind
parameters and geomagnetic storm indices are higher during the descending phase of
the solar cycle. On the other hand, the annual numbers of small and large magnitude
earthquakes are also found to be higher during the descending phase. The result of this
investigation shows that the increment of the earthquake occurrence during the
descending phase is triggered by the higher activity of the solar wind and geomagnetic
storm during that phase.
Univers
ity of
Mala
ya

77
By considering the implementation of the polynomial fitting line of the conventional
solar cycle (sunspot number variation) and modified solar cycle (solar wind input
energy variation), the annual numbers of small magnitude earthquakes during the
incomplete descending phase of 24th solar cycle were predicted. It is suggested there
will be significantly higher number of annual small and large magnitude earthquakes
within the next three years until 2019.
As a result of this, the maximum value of earthquake occurrences is during the
descending phase of the solar cycle, and our research seems to support the link with the
increase in geomagnetic and solar wind activities during that phase. The result of this
research supports the idea of the corona rotating streams increasing during the
descending phase of the solar cycle, while the speed of the solar wind is based on the
activities of the CME and corona rotating streams. On the other hand, the suggested
implication of this research is that the higher values of geomagnetic indices are
proportional to the higher value of solar wind energy transferred to the magnetosphere
layer. Hence, we concluded that the increasing of the earthquake occurrences during
descending phase of the solar cycle was triggered by the increment of interaction
between solar wind and earth magnetic field.
The finding from this research makes several contributions to the current literature.
Firstly, the solar physics subject can be used in order to study the geophysical
phenomena. Secondly, the inclusion of geomagnetism phenomena may assist us in
understanding how the solar activities penetrate the magnetosphere layer. Thirdly, the
energy penetration of the solar activity into earth’s core layer through interaction
between the solar wind and earth’s magnetic field may assist us to understand and
investigate the correlation between solar and seismic activities.
Univers
ity of
Mala
ya

78
As the act of solar cycle varies and the occurrences of earthquakes can be happened
in different latitudes and longitudes, further research should be done in order to
investigate the variation of the earthquakes in different case study areas and magnitudes.
Future studies on the next ascending and descending phases of the solar cycle (i.e 25th
solar cycle) are therefore recommended.
Overall, this research achieves all the objectives mentioned at the beginning of this
research (see section 1.3).
Univers
ity of
Mala
ya

79
REFERENCES
Adebesin, B., Ikubanni, S., Kayode, J., & Adekoya, B. (2013). Variability of solar wind dynamic pressure with solar wind parameters during intense and severe storms. The African Review of Physics, 8, 119-128.
Ajabshirizadeh, A., Jouzdani, N. M., & Abbassi, S. (2011). Neural network prediction of solar cycle 24. Research in Astronomy and Astrophysics, 11(4), 491-496.
Akasofu, S.-I. (1981). Energy coupling between the solar wind and the magnetosphere. Space Science Reviews, 28(2), 121-190.
Akasofu, S.-I., & Chapman, S. (1972). Solar-terrestrial physics. Oxford, England: Clarendon Press.
Anagnostopoulos, G., & Papandreou, A. (2012). Space conditions during a month of a sequence of six M> 6.8 earthquakes ending with the tsunami of 26 December 2004. Natural Hazards and Earth System Sciences, 12(5), 1551–1559.
Arge, C. N., Odstrcil, D., Pizzo, V. J., Mayer, L. R., Velli, M., Bruno, R., & Malara, F. (2003). Improved method for specifying solar wind speed near the Sun. Paper presented at the AIP Conference Proceedings, Pisa, Italy: American Institute of Physics.
Attia, A.-F., Ismail, H. A., & Basurah, H. M. (2013). A Neuro-Fuzzy modeling for prediction of solar cycles 24 and 25. Astrophysics and Space Science, 344(1), 5-11.
Augusto, C., Kopenkin, V., Navia, C., Tsui, K., Shigueoka, H., Fauth, A., . . . Miranda, P. (2012). Variations of the muon flux at sea level associated with interplanetary icmes and corotating interaction regions. The Astrophysical Journal, 759(2), 143.
Ballatore, P. (2002). Effects of fast and slow solar wind on the correlations between interplanetary medium and geomagnetic activity. Journal of Geophysical Research: Space Physics, 107(A9).
Bartels, J. (1932). Terrestrial‐magnetic activity and its relations to solar phenomena. Terrestrial Magnetism and Atmospheric Electricity, 37(1), 1-52.
Benjamin, A. D., & Nayar, S. (2010). Characteristics of interplanetary CMEs observed by Ulysses. Indian Journal of Radio & Space Science, 39, 270-275.
Biktash, L. (2012). Statistical study of solar wind parameters and evolution of dst variations during 19-23 solar cycles in relation with cosmic ray variations. Sun and Geosphere, 7, 41-44.
Brandt, P., Schmidt, W., & Steinegger, M. (1990). On the umbra-penumbra area ratio of sunspots. Solar Physics, 129(1), 191-194.
Univers
ity of
Mala
ya
80
Brekke, A. (2012). Physics of the upper polar atmosphere. Berlin, Germany: Springer Science & Business Media.
Brummell, N. H., Tobias, S. M., Thomas, J. H., & Weiss, N. O. (2008). Flux pumping and magnetic fields in the outer penumbra of a sunspot. The Astrophysical Journal, 686(2), 1454.
Budyko, M. I. (1969). The effect of solar radiation variations on the climate of the earth. Tellus, 21(5), 611-619.
Charbonneau, P., Dalsgaard, J. C., Henning, R., Larsen, R. M., Schou, J., Thompson, M. J., & Tomczyk, S. (1999). Helioseismic constraints on the structure of the solar tachocline. The Astrophysical Journal, 527(1), 445.
Chitre, S. (1963). The structure of sunspots. Monthly Notices of the Royal Astronomical Society, 126(5), 431-443.
Dalsgaard, J. C., & Thompson, M. J. (2007). Observational results and issues concerning the tachocline. In D. W. Hughes, R. Rosner & N. O. Weiss (Eds.), Solar Tachocline (pp. 53-85). Cambridge, England: Cambridge University Press.
Deinzer, W. (1965). On the magneto-hydrostatic theory of sunspots. The Astrophysical Journal, 141, 548.
Delamere, P. A. (2015). Solar wind interaction with giant magnetospheres and earth's magnetosphere. In A. Keiling, C. M. Jackman & P. A. Delamere (Eds.), Magnetotails in the Solar System (pp. 217-233). Hoboken, New Jersey: John Wiley & Sons, Inc.
Duma, G., & Ruzhin, Y. (2003). Diurnal changes of earthquake activity and geomagnetic Sq-variations. Natural Hazards and Earth System Sciences, 3(3/4), 171-177.
Duma, G., & Vilardo, G. (1998). Seismicity cycles in the Mt. Vesuvius area and their relation to solar flux and the variations of the earth's magnetic field. Physics and Chemistry of the Earth, 23(9-10), 927-931.
Dutta, P., Mishra, O., & Naskar, M. (2013). A review of operational earthquake forecasting methodologies using linguistic fuzzy rule-based models from imprecise data with weighted regression approach. Journal of Sustainability Science and Management, 8(2), 220-235.
Elliott, J., & Gough, D. (1999). Calibration of the thickness of the solar tachocline. The Astrophysical Journal, 516(1), 475.
Florindo, F., & Alfonsi, L. (1995). Strong earthquakes and geomagnetic jerks: a cause-effect relationship? Annals of Geophysics, 38(3-4), 457–461.
Florindo, F., Alfonsi, L., Piersanti, A., Spada, G., & Marzocchi, W. (1996). Geomagnetic jerks and seismic activity. Annali di Geofisica, 39, 1227-1233.
Univers
ity of
Mala
ya
81
Gnevyshev, M. (1967). On the 11-years cycle of solar activity. Solar Physics, 1(1), 107-120.
Gonzalez, W., Joselyn, J., Kamide, Y., Kroehl, H., Rostoker, G., Tsurutani, B., & Vasyliunas, V. (1994). What is a geomagnetic storm? Journal of Geophysical Research: Space Physics, 99(A4), 5771-5792.
Gosling, J. (1996). Corotating and transient solar wind flows in three dimensions. Annual Review of Astronomy and Astrophysics, 34(1), 35-73.
Gosling, J., & Bame, S. (1972). Solar‐wind speed variations 1964–1967: An autocorrelation analysis. Journal of Geophysical Research, 77(1), 12-26.
Gousheva, M., Georgieva, K., Kirov, B., & Antanasov, D. (2003). On the relation between solar activity and seismicity. Paper presented at the Proceedings of the International Conference on Recent Advances in Space Technologies, Istanbul, Turkey: IEEE.
Guarnieri, F. L., Tsurutani, B. T., Gonzalez, W. D., Echer, E., Gonzalez, A. L., Grande, M., & Soraas, F. (2006). ICME and CIR storms with particular emphasis on HILDCAA events. Paper presented at the ILWS Workshop, Goa, India: Quest Publications for ILWS and Indian Institute of Geomagnetism.
Gupta, M. D., & Basu, D. (1965). Solar-terrestrial events in relation to the phase of the solar cycle. Journal of Atmospheric and Terrestrial Physics, 27(9), 1029-1032.
Howard, R., & LaBonte, B. (1980). The sun is observed to be a torsional oscillator with a period of 11 years. The Astrophysical Journal, 239, L33-L36.
Hoyt, D. V., & Schatten, K. H. (1998). Group sunspot numbers: A new solar activity reconstruction. Solar Physics, 181(2), 491-491.
Hundhausen, A. J. (1979). Solar activity and the solar wind. Reviews of Geophysics, 17(8), 2034-2048.
Hundhausen, A. J. (2012). Coronal expansion and solar wind. Berlin, Germany: Springer Science & Business Media.
Hynönen, R. (2013). Geomagnetic activity and its sources during modern solar maximum. (Master's Thesis), University Of Helsinki. Retrieved from https://helda.helsinki.fi/handle/10138/42004.
Jankowski, J., & Sucksdorff, C. (1996). Guide for magnetic measurements and observatory practice. Boulder, Colorado: International Association of Geomagnetism and Aeronomy Warsaw.
Jusoh, M., Liu, H., Yumoto, K., Uozumi, T., Takla, E., Yousif Suliman, M., . . . Hashim, M. (2012). Investigation on the Possible Relationship between Magnetic Pulsations and Earthquakes. Paper presented at the AGU Fall Meeting Abstracts, Boulder, Colorado: American Geophysical Union.
Univers
ity of
Mala
ya

82
Khain, V., & Khalilov, E. (2007). About possible influence of solar activity upon seismic and volcanic activities: Long-term forecast. Transactions of the International Academy of Science, 217-240.
Khodairy, S. S., El Hadidy, M. S., Semeida, M. A., Hamed, R. A., & Youssef, S. A. (2015). Relationship between seismicity and solar activities during solar cycle 22. International Journal, 3(2), 9-17.
Kivelson, M. G., & Russell, C. T. (1995). Introduction to space physics. Cambridge, United Kingdom: Cambridge University Press.
Koskinen, H. E., & Tanskanen, E. I. (2002). Magnetospheric energy budget and the epsilon parameter. Journal of Geophysical Research: Space Physics, 107(A11), SMP 42-41–SMP 42-10.
Kovner, M., & Feldstein, Y. I. (1973). On solar wind interaction with the Earth's magnetosphere. Planetary and Space Science, 21(7), 1191-1211.
Krüger, A. (2012). Introduction to solar radio astronomy and radio physics. Berlin, Germany: Springer Science & Business Media.
Lang, K. R. (1995). Sun, earth and sky. Earth, Moon, and Planets, 70(1), 1-20.
Lang, K. R. (2002). Latest advances in solar astronomy. Paper presented at the The evolving sun and its influence on planetary environments, San Francisco: Astronomical Society of the Pacific.
Lanza, R., & Meloni, A. (2006). The earth's magnetism. Berlin, Germany: Springer.
Le, G.-M., Cai, Z.-Y., Wang, H.-N., Yin, Z.-Q., & Li, P. (2013). Solar cycle distribution of major geomagnetic storms. Research in Astronomy and Astrophysics, 13(6), 739-748.
Lites, B., & Thomas, J. (1985). Sunspot umbral oscillations in the photosphere and low chromosphere. The Astrophysical Journal, 294, 682-688.
Loewe, C., & Prölss, G. (1997). Classification and mean behavior of magnetic storms. Journal of Geophysical Research: Space Physics, 102(A7), 14209-14213.
Lopez, R., Wiltberger, M., Hernandez, S., & Lyon, J. (2004). Solar wind density control of energy transfer to the magnetosphere. Geophysical Research Letters, 31(8).
Lu, H., Jarvis, M. J., & Hibbins, R. E. (2008). Possible solar wind effect on the northern annular mode and northern hemispheric circulation during winter and spring. Journal of Geophysical Research: Atmospheres, 113(D23).
Mansilla, G. A. (2014). Solar cycle and seasonal distribution of geomagnetic storms with sudden commencement. Earth Science Research, 3(1), 50.
Mayaud, P.-N. (1980). Derivation, meaning, and use of geomagnetic indices. Washington, DC: American Geophysical Union Geophysical Monograph Series.
Univers
ity of
Mala
ya

83
Merrill, R. T., & McElhinny, M. W. (1983). The earth's magnetic field: Its history, origin and planetary perspective. London and New York: Academic Press.
Meyer, F. D. (2006). The geomagnetic aa index as a precursor of solar activity. Brussels, Belgium: Koninklijk Meteorologisch Instituut.
Midya, S., & Gole, P. (2014). Trend of major earthquakes during the period 1900–2011 and its association with some solar and geomagnetic parameters. Indian Journal of Physics, 88(1), 1-4.
Miesch, M. S. (2005). Large-scale dynamics of the convection zone and tachocline. Living Reviews in Solar Physics, 2(1), 1-139.
Montalibet, A., Jossinet, J., & Matias, A. (2001). Scanning electric conductivity gradients with ultrasonically-induced Lorentz force. Ultrasonic Imaging, 23(2), 117-132.
Motulsky, H. J., & Ransnas, L. A. (1987). Fitting curves to data using nonlinear regression: a practical and nonmathematical review. The FASEB Journal, 1(5), 365-374.
Nakano, S., Ueno, G., Ohtani, S., & Higuchi, T. (2009). Impact of the solar wind dynamic pressure on the Region 2 field‐aligned currents. Journal of Geophysical Research: Space Physics, 114(A2).
Neugebauer, M. (1975). Large-scale and solar-cycle variations of the solar wind. Space Science Reviews, 17(2-4), 221-254.
O'Hagan, A., & Kingman, J. (1978). Curve fitting and optimal design for prediction. Journal of the Royal Statistical Society. Series B (Methodological), 1-42.
O’Brien, K. (2007). Cosmic-ray propagation through the disturbed heliosphere. Acta Astronautica, 60(4), 541-546.
Odintsov, S., Boyarchuk, K., Georgieva, K., Kirov, B., & Atanasov, D. (2006). Long-period trends in global seismic and geomagnetic activity and their relation to solar activity. Physics and Chemistry of the Earth, Parts A/B/C, 31(1), 88-93.
Pellinen, R., Baumjohann, W., Heikkila, W., Sergeev, V., Yahnin, A., Marklund, G., & Melnikov, A. (1982). Event study on pre-substorm phases and their relation to the energy coupling between solar wind and magnetosphere. Planetary and Space Science, 30(4), 371-388.
Pesnell, W. D. (2008). Predictions of solar cycle 24. Solar Physics, 252(1), 209-220.
Pishkalo, M. I. (2014). Prediction of solar cycle 24 using sunspot number near the cycle minimum. Solar Physics, 289(5), 1815-1829.
Pizzo, V. (1978). A three‐dimensional model of corotating streams in the solar wind, 1. Theoretical foundations. Journal of Geophysical Research: Space Physics, 83(A12), 5563-5572.
Univers
ity of
Mala
ya
84
Praderie, F., Spicer, D. S., Withbroe, G. L., & Benz, A. O. (1981). Activity and outer atmospheres of the sun and stars: eleventh advanced course of the swiss society of astronomy and astrophysics. Sauverny: Observatoire de Genève.
Priestley, M., & Chao, M. (1972). Non-parametric function fitting. Journal of the Royal Statistical Society. Series B (Methodological), 385-392.
Prise, A., Harra, L., Matthews, S., Arridge, C. S., & Achilleos, N. (2015). Analysis of a coronal mass ejection and corotating interaction region as they travel from the Sun passing Venus, Earth, Mars, and Saturn. Journal of Geophysical Research: Space Physics, 120(3), 1566-1588.
Pulinets, S., & Boyarchuk, K. (2004). Ionospheric precursors of earthquakes. Berlin, Germany: Springer Science & Business Media.
Rabeh, T., Miranda, M., & Hvozdara, M. (2010). Strong earthquakes associated with high amplitude daily geomagnetic variations. Natural Hazards, 53(3), 561-574.
Richardson, I. G., & Cane, H. V. (2012). Solar wind drivers of geomagnetic storms during more than four solar cycles. Journal of Space Weather and Space Climate, 2, A01.
Richardson, I. G., Cliver, E. W., & Cane, H. V. (2000). Sources of geomagnetic activity over the solar cycle: Relative importance of coronal mass ejections, high‐speed streams, and slow solar wind. Journal of Geophysical Research: Space Physics, 105(A8), 18203-18213.
Roelof, E. C., & Sibeck, D. G. (1993). Magnetopause shape as a bivariate function of interplanetary magnetic field Bz and solar wind dynamic pressure. Journal of Geophysical Research: Space Physics, 98(A12), 21421-21450.
Rostoker, G. (1972). Geomagnetic indices. Reviews of Geophysics, 10(4), 935-950.
Rusov, V., Linnik, E., Kudela, K., Mavrodiev, S. C., Zelentsova, T., Smolyar, V., & Merkotan, K. (2010). Solar axions as an energy source and modulator of the Earth magnetic field. arXiv preprint arXiv:1008.1461.
Sasai, Y. (1980). Application of the elasticity theory of dislocations to tectonomagnetic modelling. Bulletin of the Earthquake Research Institute, 55, 387-447.
Sasai, Y. (1984). A surface integral representation of the tectonomagnetic field based on the linear piezomagnetic effect. Bulletin of the Earthquake Research Institute, 58, 763-785.
Schatten, K. (2003). Solar activity and the solar cycle. Advances in Space Research, 32(4), 451-460.
Simpson, J. F. (1967). Solar activity as a triggering mechanism for earthquakes. Earth and Planetary Science Letters, 3, 417-425.
Smil, V. (2012). Energy: a beginner's guide. London, United Kingdom: Oneworld Publications.
Univers
ity of
Mala
ya

85
Sobolev, G., Zakrzhevskaya, N., & Kharin, E. (2001). On the relation between seismicity and magnetic storms. Izvestiya, Physics of the Solid Earth, 37(11), 917-927.
Solomon, S. C., Woods, T. N., Didkovsky, L. V., Emmert, J. T., & Qian, L. (2010). Anomalously low solar extreme‐ultraviolet irradiance and thermospheric density during solar minimum. Geophysical Research Letters, 37(16).
Song, W.-b., Wang, J.-x., & Ma, X. (2005). A study of the north-south asymmetry of solar photospheric magnetic flux. Chinese Astronomy and Astrophysics, 29(3), 274-282.
Sornette, D., Utkin, S., & Saichev, A. (2008). Solution of the nonlinear theory and tests of earthquake recurrence times. Physical Review E, 77(6), 066109.
Spiegel, E., & Zahn, J.-P. (1992). The solar tachocline. Astronomy and Astrophysics, 265, 106-114.
Srinivasamurthy, Y., Kumar, M. V. A., Sandeep, K. V., VJ, S. M., & Reddy, E. V. (2014). Earth quake prognostication using data mining and curve fitting techniques. International Journal of Innovative Technology and Research, 2(5), 1214-1218.
Stenflo, J., & Kosovichev, A. (2012). Bipolar magnetic regions on the Sun: global analysis of the SOHO/MDI data set. The Astrophysical Journal, 745(2), 129.
Sukma, I., & Abidin, Z. Z. (2017). Study of seismic activity during the ascending and descending phases of solar activity. Indian Journal of Physics, 91(6), 595-606.
Surkov, V., & Hayakawa, M. (2014). Ultra and extremely low frequency electromagnetic fields. Berlin, Germany: Springer.
Tenfjord, P., & Østgaard, N. (2013). Energy transfer and flow in the solar wind‐magnetosphere‐ionosphere system: A new coupling function. Journal of Geophysical Research: Space Physics, 118(9), 5659-5672.
Thébault, E., Purucker, M., Whaler, K. A., Langlais, B., & Sabaka, T. J. (2010). The magnetic field of the Earth’s lithosphere. Space Science Reviews, 155(1-4), 95-127.
Thomas, J. H., & Weiss, N. O. (1992). The theory of sunspots. In J. H. T & N. O. W (Eds.), Sunspots: theory and observations (pp. 3-59). Berlin, Germany: Springer.
Tsurutani, B. T., Ho, C. M., Arballo, J. K., Goldstein, B. E., & Balogh, A. (1995). Large amplitude IMF fluctuations in corotating interaction regions: Ulysses at midlatitudes. Geophysical Research Letters, 22(23), 3397-3400.
Tyler, R. H., Maus, S., & Lühr, H. (2003). Satellite observations of magnetic fields due to ocean tidal flow. Science, 299(5604), 239-241.
Waldmeier, M. (1961). The sunspot-activity in the years 1610-1960. Zurich: Schulthess & Company AG.
Univers
ity of
Mala
ya
86
Watson, F. T. (2012). Investigating sunspot and photospheric magnetic field properties using automated solar feature detection. (Doctoral dissertation), University of Glasgow. Retrieved from http://theses.gla.ac.uk/3429/.
Webb, D. F., & Howard, R. A. (1994). The solar cycle variation of coronal mass ejections and the solar wind mass flux. Journal of Geophysical Research: Space Physics, 99(A3), 4201-4220.
Whiteman, C. D. (2000). Mountain meteorology: fundamentals and applications. Oxford, United Kingdom: Oxford University Press.
Xiao‐Fei, S., Bin‐Bin, N., Xu‐Dong, G., Chen, Z., Yong, L., Zheng, X., & Zheng‐Yu, Z. (2015). A Statistical Analysis of Solar Wind Parameters and Geomagnetic Indices during the Solar Cycle 23. Chinese Journal of Geophysics, 58(2), 170-178.
Zakrzhevskaya, N., & Sobolev, G. (2002). On the seismicity effect of magnetic storms. Izvestiya, Physics of the Solid Earth, 38(4), 249-261.
Univers
ity of
Mala
ya

87
LIST OF PUBLICATIONS AND PAPERS PRESENTED
Sukma, I., & Abidin, Z. Z. (2017). Study of seismic activity during the ascending and
descending phases of solar activity. Indian Journal of Physics, 91(6), 595-606.
Sukma, I., & Abidin, Z. Z. (2014, October). Is any possible relationship between solar
and seismic activities? (CHINA). Paper presented at the Southeast Asian Young
Astronomers Collaboration, University of Malaya, Malaysia.
Univers
ity of
Mala
ya