indoor positioning using wlan coverage area …math.tut.fi/posgroup/ipin2010_slides_final.pdftampere...
TRANSCRIPT

TA M P E R E U N I V E R S I T Y O F T E C H N O L O G Y
M a t h e m a t i c s
Indoor positioning using WLANcoverage area estimates
IPIN 2010
Laura Koski , Tommi Perälä, Robert Piché
http://math.tut.fi/posgroup/
– p. 1/16

Outline
Coverage area estimation and positioning
Floor plan in filtering
Filters
RSSI measurements
Example
– p. 2/16

Coverage area -based positioning
Coverage area estimation
Collect fingerprint data
Arrange the fingerprintdata so that for every AP,there is a list of locationreports Y = (y1, . . . ,yn)
For every AP, calculatecoverage are estimates
Positioning
Measure IDs of heard APs
Use coverage areaestimates of heard APs todetermine the position
– p. 3/16

Coverage area estimation, Prior
Measurement model:
Y = 1nµT + ǫ, where ǫ(i)|µ,Σ ∼ N(02,Σ)
– p. 4/16

Coverage area estimation, Likelihood
– p. 5/16

Coverage area estimation, Posterior
x|c ∼ N(µ,Σ)
– p. 6/16
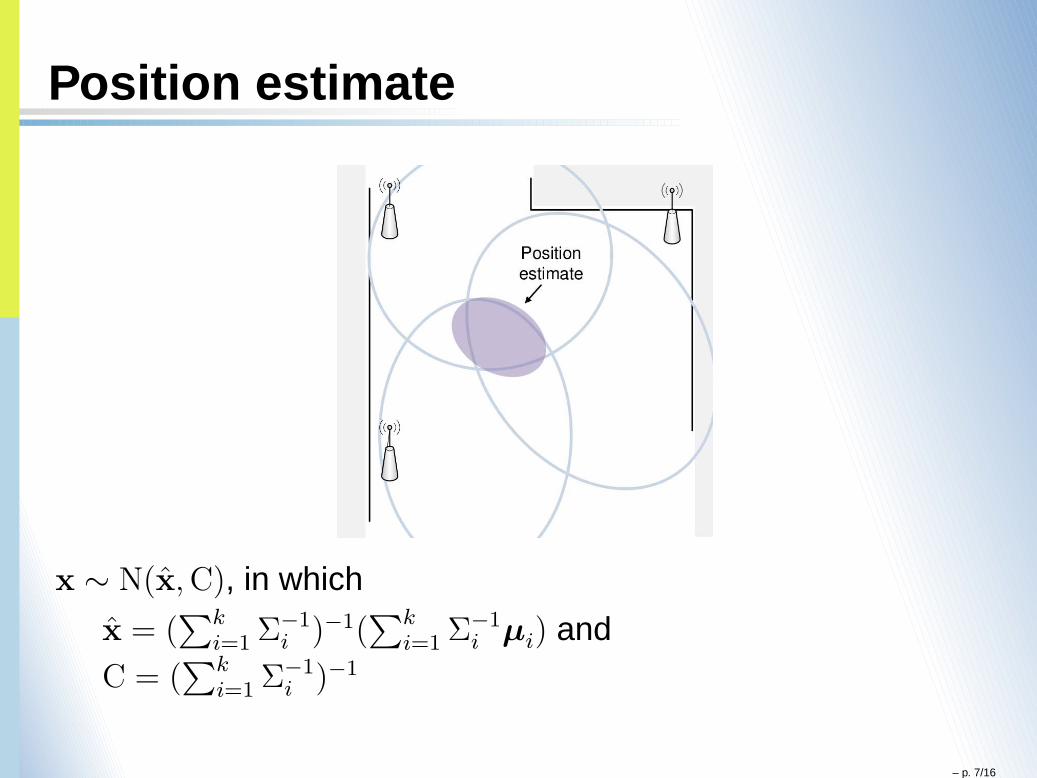
Position estimate
x ∼ N(x̂,C), in which
x̂ = (∑k
i=1 Σ−1i )−1(
∑k
i=1 Σ−1i µi) and
C = (∑k
i=1 Σ−1i )−1
– p. 7/16

Floor plan
Floor plan is divided into boxes
Graph describes the connection between boxes
1 2
3 4 5
G =
1 1 1 0 01 1 0 1 11 0 1 1 00 1 1 1 10 1 0 1 1
ΦT =
1/3 1/3 1/3 0 01/4 1/4 0 1/4 1/41/3 0 1/3 1/3 00 1/4 1/4 1/4 1/40 1/3 0 1/3 1/3
.
– p. 8/16

Filters, Box Filter (BF)
p = ((p)1, . . . , (p)nB)T is the state vector, (p)i is the
probability mass inside the ith box
use the transition matrix Φ for the state evolution
Predict: p−
k = Φpk−1
Update (pk)j = (p−
k )jπ(j),
π(j) is the probability mass inside the jth box
Position estimate xk =
nB∑
i=1
(pk)imi
– p. 9/16

Filters, Particle Filter (PF)
Standard bootstrap filter, but for every time step tk for everyparticle xk, we determine the box jk it is associated with
Weights are assigned as follows:
wik+1 ∝
L(c|xik+1) if Gji
kjik+1
= 1
0 if Gjikjik+1
= 0.
– p. 10/16

RSSI measurements
Discarding weak signals leads to
Smaller coverage area estimates
More accurate positioning performance
Difficulty: definition of RSSI may vary in different MT models.Idea: Each MT could construct its own histogram of RSSI valuesobserved over a long time interval.
−100 −90 −80 −70 −60 −50 −40 −30RSSI
probability
50 60 70 80 90RSSI
probability
– p. 11/16

Test deployment
96 calibration points
206 heard APs
∼29 heard APs per fingerprint
10 m
Calibration pointsTrack 1Track 2
– p. 12/16

ResultsTrack 1 Track 2
ME [m] Max [m] ME [m] Max [m]Coverage area 7.5 29.8 8.7 27.9NN 9.9 31.3 8.1 31.3KFCoverage area 7.4 26.4 7.1 12.6PKFNN 7.4 21.6 6.7 14.4BF 6.4 18.2 7.8 22.5PF 6.4 19.3 8.6 21.5
10 m
Track1KFBFPF
10 m
Track 2KFBFPF
– p. 13/16

Results, RSSI threshold
Threshold in coverage area estimation is median of RSSI valuesand in positioning mean of RSSI values
ME [m] Max [m]
KF 7.4 26.4
BF 6.4 18.2
PF 6.4 19.3
ME [m] Max [m]
KF 5.5 18.7
BF 4.5 14.2
PF 5.0 15.5It is not straightforward to find the optimal RSSI values thatworks in every environment.
– p. 14/16

Conclusion
Coverage area -based positioning achieves same accuracyas NN
Floor plan improves the positioning accuracy
KF achieves almost the same accuracy as PF and BF withsignificantly lower computational load
Use of RSSI values improve positioning accuracy
– p. 15/16

Conclusion
Coverage area -based positioning achieves same accuracyas NN
Floor plan improves the positioning accuracy
KF achieves almost the same accuracy as PF and BF withsignificantly lower computational load
Use of RSSI values improve positioning accuracy
Thank You!Questions?
– p. 16/16