indonesia’s small-scale lng power plant conversion a
TRANSCRIPT

Putra Adhiguna, Energy Analyst August 2021
1
Indonesia’s Small-Scale LNG Power Plant Conversion – A Triple Hit for PGN? The Goal Is Clear but Not the Numbers
Executive Summary Pertamina – and by extension, Perusahaan Gas Negara (PGN) – has been tasked by the government to deliver gas at a low cost to 52 PT Perusahaan Listrik Negara (PLN) power plants. The goal is to convert these 52 units from burning high-cost fuel oil to gas. PGN estimates an investment of US$1.5bn to US$2.5bn will be required to deliver 167 British Thermal Unit per Day (BBTUD) of gas, with half of the power plants using less than 2 Billion BBTUD. In a break from industry norms, this policy initiative is based on deploying new small-scale liquefied natural gas (ssLNG) units that would largely target smaller markets in eastern Indonesia.
The gas conversion plan is a scaled-down version of similar plans, a decade in the making. PLN which previously took the lead in the supply chain establishment, has now moved to the receiving end, essentially shifting all the risk to PGN. The current gas conversion plan would clearly benefit PLN if the gas could indeed be delivered cheaply to its plants. Pertamina may also slightly benefit from fuel oil distribution savings.
What is less clear is whether PGN, a State-Owned Enterprise (SOE) subsidiary with sizeable public ownership, can survive this arrangement. The economics of gas conversion have shifted due to a new gas pricing policy framework that will cut the government’s revenue share from gas production to suppress the downstream gas price. The new policy is a bold action that shows the country’s growing challenge as it absorbs its surplus domestic gas production due to the expiration of existing LNG export contracts and growing price competition as new price-competitive supply is drawn into Asia.
PGN is already under stress due to the impacts of COVID-19 and the new gas pricing policy. With its distribution margin expected to decline from $2.2-2.5 to $1.8-2.00/Million British Thermal Unit (MMBTU), the alarm bells are already ringing. Approximately 80% of PGN’s revenue comes from the distribution segment. Its distribution margin has already been squeezed over the past five years due to multiple factors, like gas contract renegotiations.
The economics of ssLNG for PGN will need to be stress tested by investors. With existing total assets of US$7.5bn, transmission volumes of more than 1,250 BBTUD, and 820 BBTUD of distribution volumes in 2020, PGN investors will be cautious about the merits of a US$1.5bn investment that will only result in 167BBTUD of additional delivery capacity.

Indonesia’s Small-Scale LNG Power Plant Conversion – A Triple Hit for PGN?
2
While ssLNG would increase domestic demand, there is a reason why ssLNG has been on the drawing board for such a long time – justifying its economics is a big challenge. While the LNG market thrives on scale, ssLNG loses the edge on economies of scale. The cost for conventional LNG supply chains typically accounts for 10-20% of the total gas price, while the planned ssLNG supply chain potentially costs 30-50% of the gas price. Build cost – per unit of capacity – of smaller LNG carriers (LNGC) is typically more than three times the cost of their larger counterparts.
Until now, policymakers have not been able to publicly evaluate the cost dynamics that will determine the fate of enthusiastic plans for ssLNG. This lack of attention to economic feasibility may reflect that the wave of global enthusiasm for ssLNG has largely been driven by technology providers and LNG exporters aiming to kick start future markets, where LNG to power generally offers a less attractive opportunity than ship bunkering or truck fuel replacement.
The Institute for Energy Economics and Financial Analysis’ (IEEFA) examination of proposals for ssLNG highlights the following policy implementation risks:
1. The capital expenditure (capex) planned for the project is estimated to be too high to support a standard test of market viability, signalling potential risk for PGN. With multiple investment figures stated by PGN ranging between US$1.5bn – US$2.5bn, the capital needed per unit of delivered capacity is more than two to four times the investment required for existing conventional scale LNG projects. While PGN could use the opportunity to spearhead the development of new gas markets, challenging economics will require caution in this cost sensitive market.
2. PGN is unlikely to spend its own capital, but leasing would not be an easy option. Despite publicly claiming their readiness to invest, IEEFA believes PGN would likely encourage business partners to step in to make capital investments, in line with a pattern observed with other existing LNG projects. With less than US$14mn allocated in 2020 for the ‘quick win’ portion of the project, PGN’s 2021 capex plan does not align with the investment needed to meet the two-year fuel oil to gas conversion deadline.
Regardless of the avenue chosen, the challenge of funding the required LNG
Indonesia Should Remain Prudent in Its Rush to Absorb Domestic Gas
New market imperatives currently shape Indonesia’s gas policies. The government needs to find new sources of domestic demand to absorb surplus gas coming into the market amidst expiring export contracts. To create new demand, small-scale LNG has been re-proposed to expand gas use in the power sector by replacing diesel, and as one of the fiscal justifications for the recent gas price control policy. However, gas consumption in the power sector has largely been stagnant due to the high intrinsic cost of gas and the impact of coal power lock-in. Pertamina – and by extension PGN – has now been instructed by the government to proceed with plans to establish a capital-intensive ssLNG supply chain. IEEFA has examined the project from multiple angles to assess how this initiative will affect PGN, the government, and the power sector. As a state-owned enterprise subsidiary with sizable public ownership, PGN is already under strain from COVID-19 impacts, and the new gas pricing policy. That will make it particularly important to carefully assess the multiple objectives driving the proposed ssLNG policy.

Indonesia’s Small-Scale LNG Power Plant Conversion – A Triple Hit for PGN?
3
infrastructure investment should not be taken lightly. Investors in the company only need to look into its own history with long-term charter leases. PGN’s lease obligations to Lampung Floating Storage Regasification Unit (FSRU) have 13 more years to run, but the unit operates at a very low capacity and still has more than US$400mn of contract obligations remaining. Those who point out that PGN did not plan the relocation of the FSRU Lampung from its original destination in North Sumatera should also be reminded that this history further underscores the complexity of the Indonesian gas landscape.
3. Indonesia’s sudden policy manoeuvres can reverse investment fundamentals in a heartbeat. The recent government decision to drop its gas revenue share points to the high level of policy risk that investors will need to consider. As gas price fluctuates and fiscal priorities shift, the opportunity cost may grow, and so could the temptation to recapture these revenues. Given the revenues involved, it is very unclear whether the gas pricing policy will remain stable, posing a huge question for anyone placing a 20 year investment bet hinging solely on the current policy.
The government’s gas price control policy will come under pressure due to ongoing oil price volatility, particularly with many Indonesian gas prices traditionally still indexed to oil prices. It is noteworthy that Brent crude was hovering at $20-30/barrel (bbl) in April 2020 when the regulation was issued, and has risen above $70/bbl by mid-2021, implying a rising cost to implement the policy. It is also important to note that the ability of the government to impose price control is bounded by the government’s remaining gas revenue, which it can reallocate to compensate producers.
These price risks could put pressure on the revenue model for ssLNG, raising questions about the stability of long-term returns for PGN and its partners. It seems unlikely that investors will be motivated to commit capital to these projects without greater certainty on predictable revenue streams.
4. Investors in ssLNG should learn from PLN’s historical gas use and planning risks. Power sector experts understand that revisions to Indonesia’s power sector development plan (RUPTL) regularly involve changes the gas demand outlook – a pattern that could be a material risk factor for ssLNG investors. Of course, this risk could be shifted to someone else, but the only likely candidate would be PGN. IEEFA believes the 14.5% gas price ‘slope’ toward crude oil policy rolled out by the government in 2017 reflects PLN’s general oil parity benchmark tolerance based on cases of gas demand changes in existing projects. PGN would be wise to understand explicitly what PLN’s required oil parity will be in the coming years. Stakeholders should also focus on a potentially bigger risk factor – the overall outlook for PLN’s gas consumption. Based on an existing draft of the RUPTL, PLN’s gas demand profile could remain relatively stagnant for the coming decade.
In a capital-intensive industry where capital discipline determines returns, PGN will

Indonesia’s Small-Scale LNG Power Plant Conversion – A Triple Hit for PGN?
4
need to tread carefully. Analysts will undoubtedly note the amount of capital required and PGN’s history in the LNG segment in assessing its project pipeline.
IEEFA believes PGN is unlikely to take on the entire ssLNG project on its own, although they may take a piecemeal approach on some projects, as evidenced by the ‘quick win’ projects – which comprised of several projects prioritized by PGN, likely due to the lower economic hurdle. Nevertheless, they are unlikely to escape the inherent liabilities involved in the costly project. With the outlook for pressure on the distribution margin, the weakening upstream segment, and the implementation of PSAK73 accounting rules, which include operational lease obligations on the balance sheet, PGN appears cautious about taking on a controlling interest in the project investments. Based on PGN’s current capex plan, the gas conversion project would clearly compete with other projects that would support more attractive gas market development options that appear to rank higher in the PGN priority list.
Taken together, it’s clear that Indonesia faces a two-fold challenge to build a gas market ASAP and manage a rapid gas production decline risk in the coming decades. Other policy decisions have dictated the need to find ways to create more demand for domestic gas, but it will be crucial to get the economics right. This means that details of the plan warrant careful study if policymakers and investors want to avoid burdening the government, and the key SOEs are to have the right resources to undertake a series of high value but potentially high-risk investments in the energy sector.

Indonesia’s Small-Scale LNG Power Plant Conversion – A Triple Hit for PGN?
5
Table of Contents
Executive Summary ............................................................................................................................... 1
Reviving the ssLNG Plan: Setting the Stage.......................................................................... 6
Indonesia Embarking on Aggressive Policy Moves to Absorb Domestic Gas Production .......................................................................................................................................... 6
ssLNG Has Lacked Consistent State-owned Enterprise Support.............................. 10
Support from ssLNG Technology Providers and LNG Producers ............................. 12
A Triple Shock to PGN? – COVID-19, Gas Pricing Regulation and a US$1.5bn Investment Burden .............................................................................................................................. 16
Red Flags from PGN’s Past Experience With LNG ........................................................... 19
Numbers Matter – Who Will Pay US$1.5bn for 167 BBTUD of Gas? ....................... 24
PLN Has Never Embraced Gas as a Core Fuel ................................................................... 28
Stable Demand Is Critical for the Economics of LNG ..................................................... 30
Will PLN Reverse Its On-Again Off-Again Demand Pattern for LNG? ..................... 31
Conclusion: What’s Different This Time for Gas Conversion? ................................... 32
Appendix ................................................................................................................................................... 34
About the Author................................................................................................................................... 37
Indonesia’s Small-Scale LNG Power Plant Conversion – A Triple Hit for PGN?
6
Reviving the ssLNG Plan: Setting the Stage
Pertamina – and by extension, Perusahaan Gas Negara (PGN) – has been tasked by the government to deliver gas at a low cost to 52 PLN power plants to convert the use of diesel. An estimated US$1.5bn - US$2.5bn investment will be needed to deliver 167 BBTUD of gas to convert 1.7GW power plants.1 Half of the projects demanded less than 2 BBTUD each, and nearly all will need to be delivered through small-scale LNG.
A quick flashback: In 2011, the government announced the ‘gas conversion’ plan from fuel oil to gas supported by the ssLNG distribution chain.2 Both Pertamina and PLN undertook numerous studies on the proposed gas conversion plan.3 Fast forward ten years, and it appears very little progress has been made from the 730 BBTUD and 3.7 gigawatts (GW) initially planned.4
In 2020, the plan was revived again. This time the plan is backed by a ministerial decree, which instructed Pertamina – and by extension, its subsidiary PGN – to deliver gas at a price that would allow PLN to produce power at a lower cost than fuel oil.5 Confirming this plan, the PLN CEO suggested that fuel oil consumption could be reduced from 2.6 million kilo liter (mikL) to 1.6 mikL with potential savings of 4 Trillion IDR (US$280mn) annually.6
As PLN and PGN face the challenge of navigating an uncertain post COVID-19 recovery, it’s critical to examine both the policy framing and financial dynamics of the shift to gas. Indonesia has a narrow margin for error on large investments in new infrastructure. This means the market will need to understand what is likely to be different in 2021 to embrace this push for new gas infrastructure – an investment that can require a minimum demand commitment of 15 plus years to be financially viable.
Indonesia Embarking on Aggressive Policy Moves to Absorb Domestic Gas Production It is important to first understand the key drivers of the aggressive move towards gas in the domestic energy mix to set things in context. Indonesia is potentially stuck with plenty of uncommitted LNG cargoes for the coming years. Production is expected to rise before declining steadily as older fields decline. The expected increase in LNG production from Tangguh Train 3 will likely be offset by the rapidly
1 $1.5bn based on PGN CEO statement in DPR parliamentary hearing. July 2020. $2.5bn based on PGN Public statement. Detik. March 2020. 2 The term ‘Fuel oil’ is used to loosely define liquid fuels derived from petroleum, including High Speed Diesel (HSD) and Marine Fuel Oil (MFO) among others. International Gas Union define ssLNG as projects with <0.5 MTPA of regasification capacity 3 Investor.id. Pertamina-PLN constructing 8 mini-LNG terminals. March 24, 2011. The collaboration also formed PT Perta Daya Gas, a joint venture between Indonesia Power, and Pertamina Gas, subsidiaries of PLN and Pertamina, respectively. 4 MEMR. The government will build virtual pipeline in 4 clusters. November 2016. 5 Ministerial Decree Kepmen 13k/2020 assigned Pertamina to be responsible for LNG supply and LNG infrastructure to deliver gas to PLN, and for PLN to convert the usage of High-Speed Diesel to gas in 52 power plants within two years. This shall be referred to as ‘gas conversion policy.’ 6 Kompas. Conversion from fuel oil to gas, PLN will save 4 Trillion IDR annually. Jan 28, 2020.
Indonesia’s Small-Scale LNG Power Plant Conversion – A Triple Hit for PGN?
7
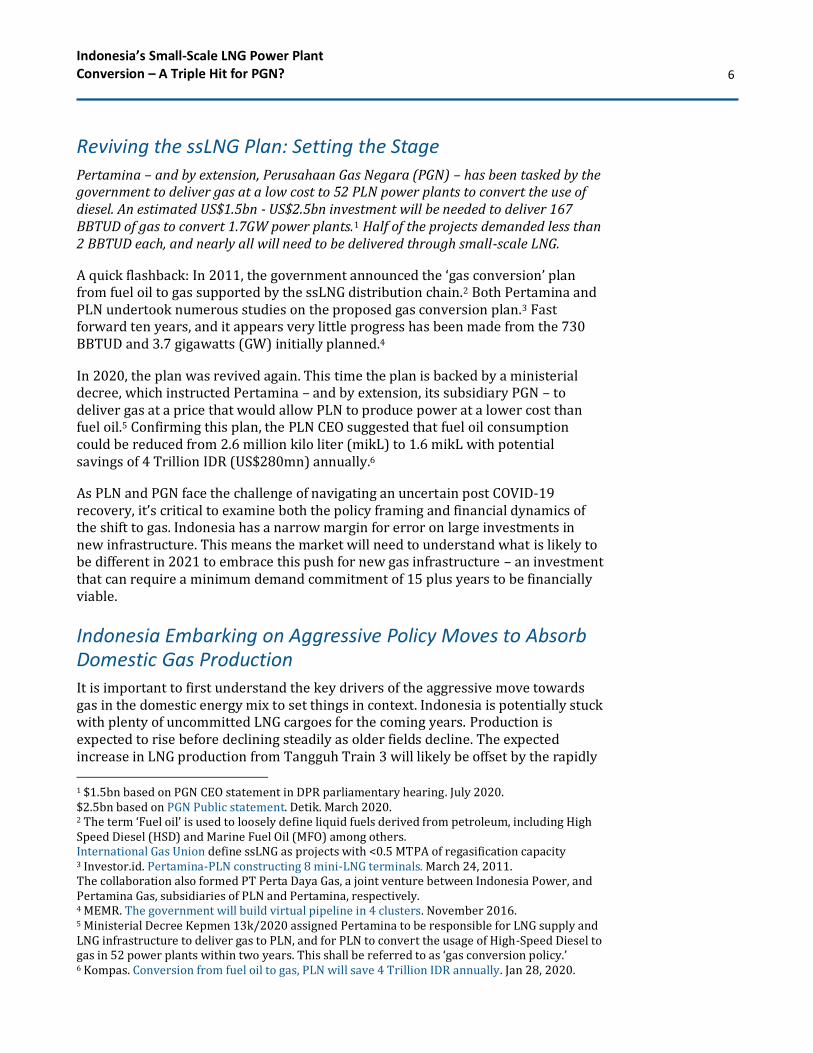
declining output of Badak (Bontang) LNG plant. At the same time, the market status of the Masela LNG export facility, initially planned for 2027, could meet increased uncertainty with Shell heading for the exit.7
Figure 1: Growing Level of Uncommitted LNG
Source: MEMR forecast, Indonesia LNG Market & Prospects Presentation, September 2020.8
Simultaneously, the offtake mix is changing dramatically. Until recently, a sizeable portion of Indonesian gas was historically destined for export markets. But recent and upcoming expiration of long-term gas export contracts has been a game-changer, especially given strong new supply trends in the global gas market. In January 2021, one of Indonesia’s longest LNG export contracts expired,9 with a major pipeline export contract to Singapore likely to expire in 2023.10 This shift in the demand scenario is highly material, because Indonesia produced 6.1 BBTUD of gas in 2019, but consumed only 4 BBTUD, increasing the urgency to establish domestic market demand for gas to absorb the uncommitted supply.11 The imperative for policymakers is two-fold: to quickly create demand for gas domestically and to prepare for a rapid gas supply decline risk in the next decade.
In the power sector, the share of fuel oil in PLN’s power generation mix has declined substantially from 23% in 2011 to 3.2% in 2019.12 This was driven by high cost and Indonesia’s rising oil imports. Nevertheless, fuel oil generation is still prominent in less accessible regions supported by small to medium-sized power plants. Generating units running on fuel oil are expensive to operate due to the high cost of fuel, operations and maintenance. Various types of fuel oil have been utilized by
7 Detik. End of 2021 will be the final call on Shell’s exit from Masela Block. September 30, 2020. 8 Inclusive of anticipated LNG supply addition forecast by MEMR. 9 Bloomberg. One of the world’s oldest LNG deals unravelling on the virus. September 10, 2020. 10 Jakarta Post. Indonesia to stop gas exports to Singapore in 2023. February 8, 2020. As of early 2021 it is not yet clear whether there will be further extension of the contract. 11 Gas production and domestic demand from MEMR. Gas Network Development Prospect presentation. January 15, 2021. 12 Based on available draft of RUPTL2021.

Indonesia’s Small-Scale LNG Power Plant Conversion – A Triple Hit for PGN?
8
PLN, including High-Speed Diesel (HSD), biodiesel blends, and marine fuel oil (MFO). In 2020, PLN spent IDR 15.8 Trillion (US$1.1bn) in fuel oil purchase, with fuel oil representing 15 to 18% of PLN’s total fuel purchase in recent years.13 Gas, whether piped or LNG, has played a sizeable role throughout this fuel oil reduction strategy. In recent years, it has also become notable that the share of LNG in PLN’s gas supplies has been increasing, an unavoidable trend, given the depletion of several key pipeline gas producers.14
The stage was set for this most recent restructuring of the domestic gas market in April 2020. With PLN as a major gas consumer and the anchor buyer of nearly all domestic LNG, looking to PLN to increase their gas consumption presented a natural path for the government. In addition to the renewed focus on the gas-conversion policy, facilitating regulations were issued to support increased domestic gas consumption by controlling the downstream gas price for power and seven industrial sectors.15 While the framework for the regulation was formalized in 2016/17, its implementation has not gained traction.
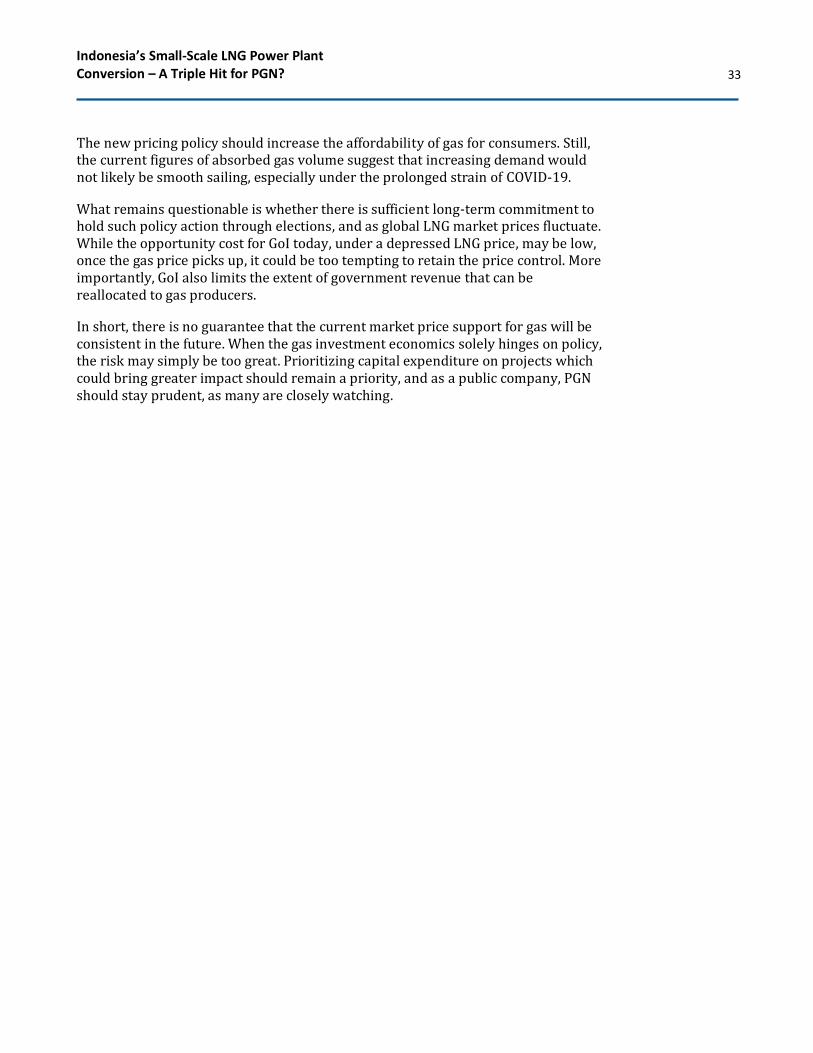
The new gas pricing policy has been a decisive step to change the market by reallocating a portion of government revenue to gas producers to compensate them for the lower gas price. SKK Migas estimates the new pricing policy will potentially reduce state revenue by IDR 87Tn over the 2020-24 period. The revenue loss associated with this change is claimed to be offset by other balancing factors, including the cost savings from converting PLN’s fuel oil use to gas.16
The impact of this new gas pricing policy is bound by two key factors: the limits on how much government revenue can be reassigned to gas producers to compensate them for lower revenues, and what will happen after 2024, as the policy only
13 PLN 2020 Financial Statement. Fuel oil comprised 15% of total fuel purchase expenditure in 2019, and 18% in 2020. 14 PLN Indogas 2019 presentation. 15 Ministerial Regulation ESDM No.8/2020 (for industrial gas) and ESDM No.10/2020 (for the power sector) is followed by Ministerial Decree ESDM No.91/2020 for the power sector. These regulations are a continuation from Presidential Regulation No.40/2016 (later revised through Pres. Reg. No. 121/2020) which outlined specific pricing structures and volumes, and shall be referred to as ‘new gas pricing policy.’ 16 SKK Migas. Impact of Gas Pricing Policy toward Industrial competitiveness. May 16, 2020. IDR13.1Tn of benefit is to be reaped from PLN diesel-to-gas conversion program. Simulated state loss and benefits for FY 2020-24 claimed by the government is outlined in detail in Appendix A
The imperative for policymakers is two-fold: to quickly create demand
for gas domestically, and to prepare for a rapid
gas supply decline risk
in the next decade.

Indonesia’s Small-Scale LNG Power Plant Conversion – A Triple Hit for PGN?
9
outlined gas demand forecast to 2024.17
Figure 2: LNG Price Components at PLN Plant Gate (Kepmen 91k/2020)
Source: MEMR Kepmen 91K/2020 Allocations, IEEFA estimates.18
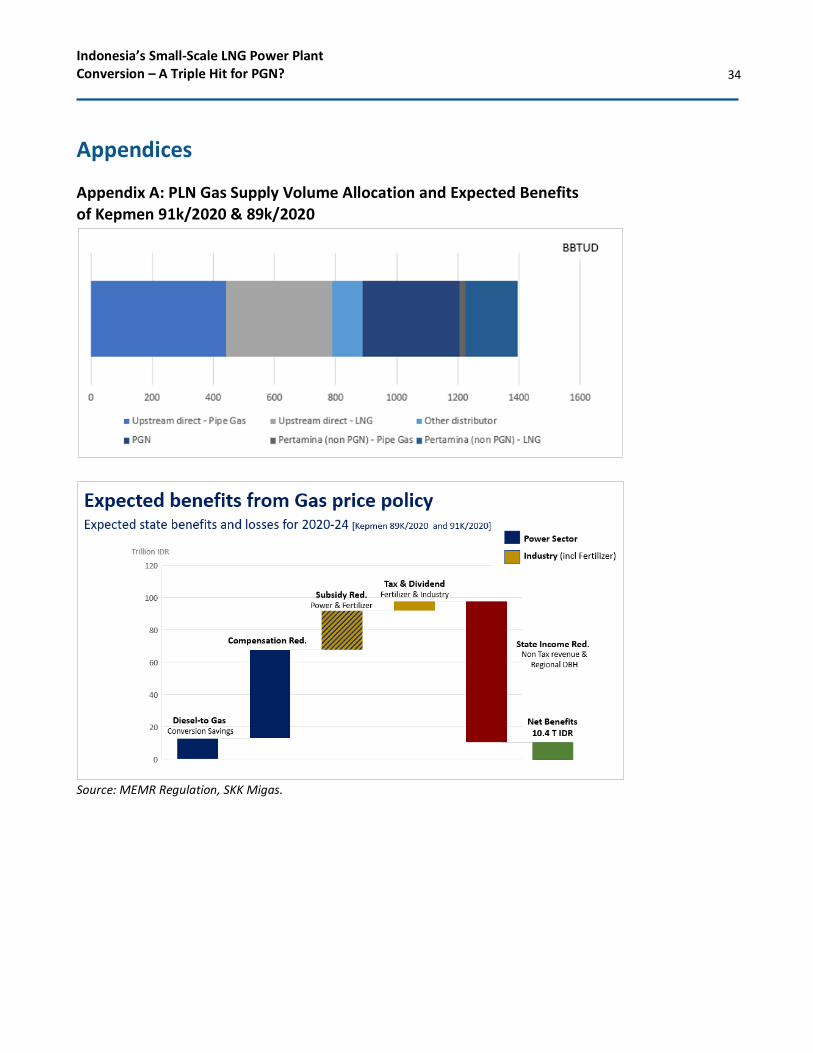
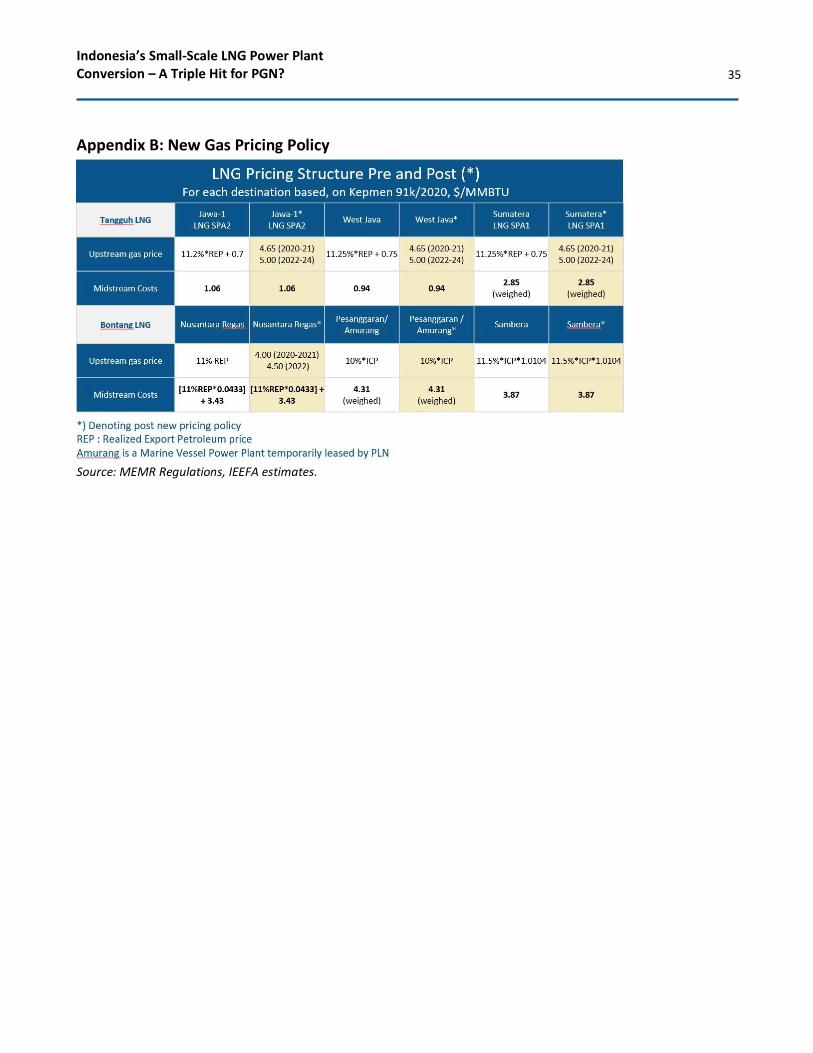
To illustrate the impact of the pricing policy, Figure 2 highlights the potential changes in the structure of LNG prices, with details outlined in Appendix B. With the upstream gas pricing structure changing from oil-indexed to fixed prices in some projects, the policy is a dramatic move that will define the potential for winners and losers in the sector. For example, Tangguh LNG prices were previously oil-indexed and have now been changed into a rigidly fixed price.
The chart further highlights the significant portion of the midstream cost for LNG projects with a smaller demand level. Midstream costs, which typically comprise 10-20% of the delivered gas price for large scale LNG projects, escalate substantially to 35-50% for smaller LNG projects. With many Indonesian traditional gas prices still heavily oil-linked, the ability to retain control on price will diminish as oil price rises. While the regulation was issued in April 2020 – when Brent crude hovered at US$20-30/bbl – crude price has risen to more than US$70/bbl, raising the implied fiscal cost for implementing the policy.
17 To compensate gas producers for the lower price, the government will reassign a portion of the government revenue share to the producers, to the extent that the govt revenue share from non-tax equity share (PNBP) and first tranche petroleum is still available from the production. 18 Terminology consistency is maintained with Kepmen 91K/2020.

Indonesia’s Small-Scale LNG Power Plant Conversion – A Triple Hit for PGN?
10
It is unclear yet how the new pricing policy would influence the ssLNG gas conversion program, as most PLN gas use is concentrated in large single cycle (PLTG) and combined cycle (PLTGU) plants. Nevertheless, the policy clearly indicates the aggressive steps that the Government of Indonesia (GoI) is already taking to utilize its gas production domestically. At a time when global LNG markets embrace greater liquidity and flexibility, Indonesia has responded to market changes by opting for tight price controls with rigid floor and ceiling prices.
Creating a domestic market for this surplus gas is understandable from the perspective of current energy market realities. With the supply glut in regional gas markets, selling uncommitted cargo could be challenging, and selling the gas more cheaply in the domestic market could be preferred by the government over selling abroad. Nevertheless, investing in more than US$1.5bn of capital warrants careful examination. Given the power of regional trends, it’s critical to examine whether this investment would be an asset or a future liability to an energy system already burdened by multiple fixed payment commitments to support coal independent power producers (IPPs) and biodiesel development.
ssLNG Has Lacked Consistent State-owned Enterprise Support Over the years, ssLNG proposals have been championed by various parties, but there has been a lack of focus on creating a stable value chain. Previously, PLN took the commercial lead in establishing the gas conversion supply chain. Now its role has shifted again to a more traditional off-taker role with an emphasis on affordability, which puts pressure on PGN to find ways to cut supply costs. In short, this decision transfers nearly all the financial risks of the gas conversion project to PGN.
The project plan, which has been revised multiple times, targets the conversion of 52 power plants within the next two years.19 Seven distribution clusters are planned
19 Additional plan revision with 56 power plants (1.8GW) has been disclosed by PGN, for the purpose of this paper 52 plants will largely be used to ensure consistency with MEMR policy Kontan. PLTD Gasification held by gas demand and economics, PLN response. January 31, 2021.
Briefly on Indonesian LNG
With resources primarily located in the eastern part of Indonesia, analysts may want to familiarize themselves with the following essential reference points before locking in assumptions: • Primary LNG export terminals are located in
Bontang (East Kalimantan) and Tangguh (Papua). There is also a smaller LNG terminal in Sulawesi (Donggi-Senoro, 2 MTPA).
• The largest demand centre is located in Java, which is associated with lower midstream costs, as noted in NR Tangguh and the upcoming Jawa-1 project.
• Sumatera LNG delivery requires longer transportation routes from Tangguh (Papua) and is coupled with a lower demand level.
• Mid-scale Benoa LNG (Pesanggaran) has the highest midstream cost for a demand level of 32 BBTUD (combined with Amurang Power Plant).
• Small-scale Sambera LNG with a demand level of 8BBTUD exhibits a high midstream cost, despite being located only 80 km away from Bontang LNG plant and relying on trucks for transportation.

Indonesia’s Small-Scale LNG Power Plant Conversion – A Triple Hit for PGN?
11
to be supported by three LNG ‘Hubs’ located at the existing Arun LNG facility, FSRU near Java, with a new hub in Ambon. Three ‘Quick Win’ projects are prioritized in Sorong, Tanjung Selor, and Nias. In fact, Sorong has successfully completed the gasification process. This project was less challenging because Sorong only required a 3.7 kilometre (km) pipeline connection to a nearby gas producer.20 Other power plants in the program do not have the same luxury, with ssLNG likely left as the only mode of gas delivery.
Figure 3: PLN Gas Conversion Plan
Source: PGN 12M-2020 Investor Presentation, updated for 56 plants (1.8GW).
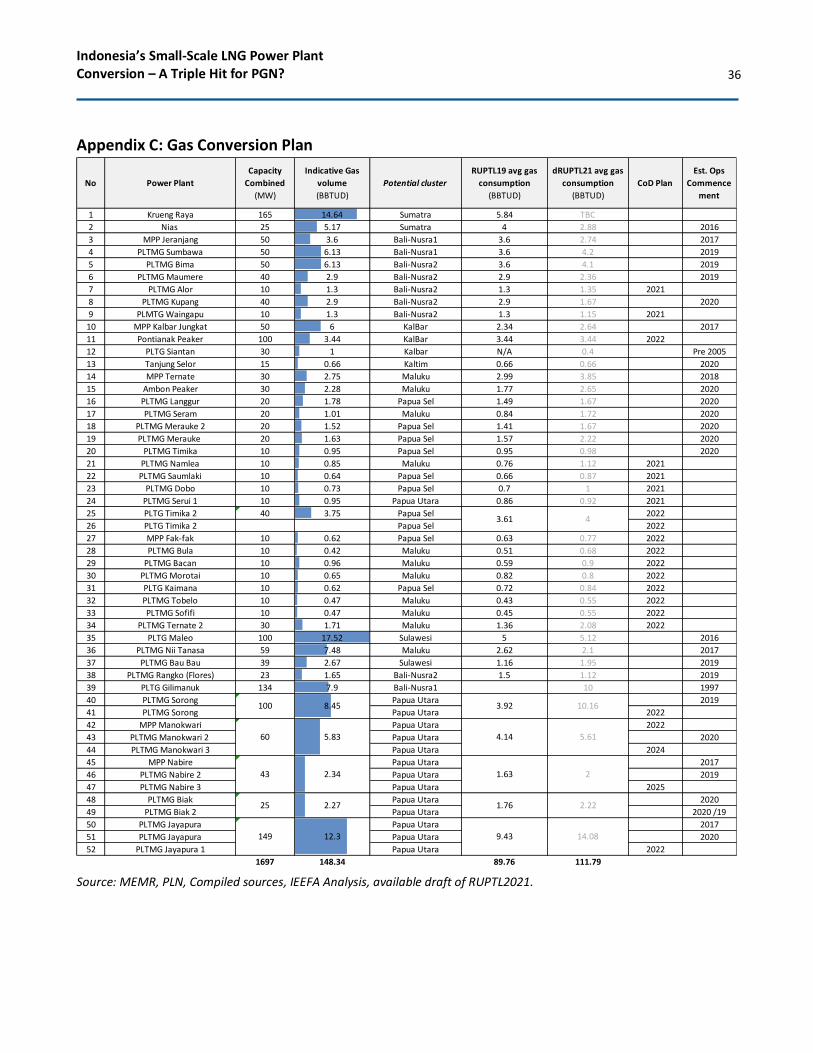
The geographic and economic challenge of this conversion plan is significant. Approximately half of the generating units listed for conversion have only been in operation for the past three to four years. More than 20 are not yet operating, and 17 of these units are planned with only 10 megawatts (MW) of capacity. It’s also noteworthy that more than half of the units require less than 2 BBTUD of gas supplies. Larger plants with a capacity of 40, 50, and even 165MW have been included in the plan. Nevertheless, the forecast gas demand for these units – 2, 6, and 14 BBTUD of gas respectively – are very low despite the plant sizes. Given the highly scale-sensitive nature of the gas supply chain, the demand level remains challenging. The complete list of the demand profile is attached in Appendix C.
Most generating units involved in the gas conversion are newer facilities designated as gas-powered (PLTMG) or dual fuel diesel-powered (PLTD Dual Fuel).21 These newer units were designed to improve fuel efficiency and multi-fuel flexibility compared to older diesel PLTD generators. This trend is evident in estimates of the Power Generation Cost (BPP, Biaya Pokok Penyediaan Pembangkitan) for PLTMG running on HSD/biodiesel blend in PLTMG Sorong operated by Indonesia Power. Its BPP was reported at IDR 1,847/kilowatt hour (kWh), while PLN’s four-year country
20 Perta Daya Gas. PLTMG Sorong 50MW infrastructure flow its first gas. January 25, 2021. 21 PLTMG: Gas Engine Power Plant, PLTD: Diesel Power Plant.

Indonesia’s Small-Scale LNG Power Plant Conversion – A Triple Hit for PGN?
12
average for PLTD (PLTMG-inclusive) was 25% higher at IDR 2,311/kWh.22
In the absence of available gas, however, these PLTMG/PLTDDF units have been operating with fuel oil with the promise that they would be ready to accommodate gas in the future, whenever that supply arrives.
Today, the gas conversion plan is essentially a different version of the LNG-to-power project, with PLN expected to be the anchor buyer. The key difference is that LNG is ‘optional’ for PLN given its established fuel oil supply. While the structuring of LNG- to-power projects typically explores multiple options to best manage the risks, such as cross-ownership or an integrated model. In this plan, PLN is essentially taking little to no risk, and PGN is left in the middle to bear most of the risks.
Support from ssLNG Technology Providers and LNG Producers Enthusiasm about the potential of ssLNG has global roots. ssLNG has been largely pushed by technology providers and LNG producers to create a new market amidst tightening competition. Central America, Central/Eastern Europe, and Asia have been targeted as potential markets by ssLNG advocates, whether for industries and power, road transport fuel, or ship bunkering fuel applications to unlock new gas markets. While Indonesia’s motive for ssLNG today is likely driven by surplus gas absorption, it has also been aimed as a potential export destination in the future.
The LNG industry is well-established, but the ssLNG is still largely a niche segment.23 In the past, gas development has depended on long-term buyer contracts, as gas is a difficult fuel to transport and store. The colossal size of LNG facilities and carriers worldwide reflects the aim of reaching improved economies of scale, while ssLNG is heading in the opposite direction. The economics are also reflected in the composition of the LNG shipping fleet. With the global LNG Carrier (LNGC) fleet of more than 500 vessels, small LNGC accounted for less than 40 vessels listed by the International Gas Union in 2019, while the average LNGC capacity had risen from 140,000 cm in the 2000s to more than 160,000 cm in 2020.24
22 Indonesia Power. 2020 and PLN Statistics Book, 2016-19. 23 IGU World LNG 2020 report. IGU stated that activities in the ssLNG is ‘not well characterized with representative data’. The term ‘ssLNG’ referred to in this report specifically address the mid-and-downstream portion: transport, regasification and storage of LNG. 24 Small LNGC is defined as those with <30,000 cu.m capacity. IGU Annual Report 2019 page 87. LNGC active fleet average capacity, IGU World LNG Report 2020. Page 56.

Indonesia’s Small-Scale LNG Power Plant Conversion – A Triple Hit for PGN?
13
Figure 4: Small-scale LNG Supply Chain
Source: IEEFA.
Globally, the use of ssLNG vessels for seaborne gas distribution has primarily been limited to small coastal cities in East Asia. China’s ssLNG use has been mainly targeted at diesel replacement for trucks in inland regions.25 Despite various strategies explored in different markets, ssLNG has continued to struggle to gain traction in the face of competition from lower-cost options and the high cost of building a low-cost scalable value chain.
Market opportunities for ssLNG have been supported by specific factors, like the maritime sector’s IMO2020 sulphur cap, which slowly pushed the LNG ship bunkering segment. Still, the economic challenges of running LNG at a small scale nevertheless persist. As an example, a smaller LNGC with 7,000 cubic metres (cu.m) capacity can cost upward of US$58mn, while their bigger counterparts sized upward of 175,000 cu.m are priced at US$185-250mn.26 Three to four times the price for more than 20 times the capacity.
This challenge will matter in the Indonesian market. The current ssLNG plan appears to rest on breaking larger LNG cargoes into smaller volumes at the hubs and then loading onto smaller LNGC or International Organization for Standardisation (ISO) tank containers. This plan links to a ‘milk-run’ model where a single LNGC serves multiple delivery points. The use of small LNGC (sub-30,000 cu.m capacity) would be crucial because delivering the LNG to the shore will likely involve navigating through shallow waters and relying on less developed port infrastructures. Alternatively, ISO tank containers could allow the LNG to be transported using transport vessels and overland.
At the receiving end, the logistics required depend on the location. The LNGC could be unloaded at the jetty for delivery to an onshore storage and regasification facility
25 China’s road transport consumed 13 million tonnes of LNG in 2020. Shell LNG Outlook 2021. 26 IEEFA estimates. Bureau Veritas. Outfitting the world with small-scale LNG and bunkering vessels. September 16, 2020. GIIGNL 2019 LNG Update-Information Paper #3. Page 1.
Indonesia’s Small-Scale LNG Power Plant Conversion – A Triple Hit for PGN?
14
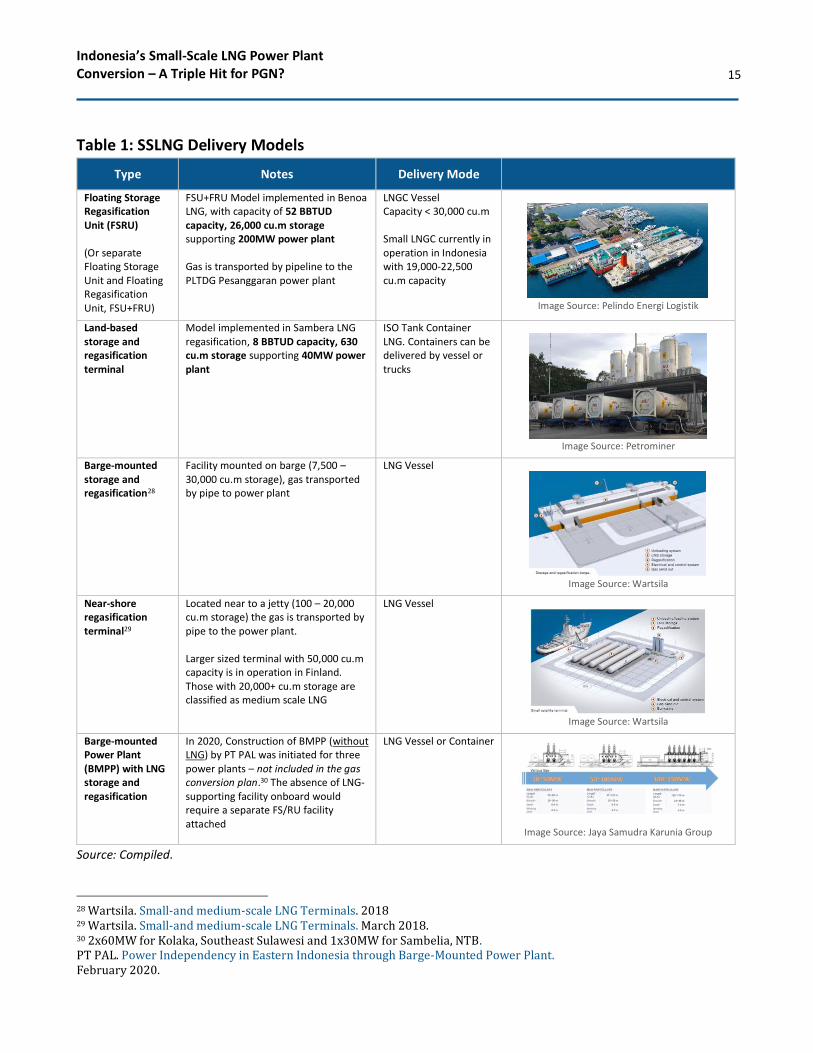
(‘regas’), FSRU, or directly by ISO tank container to the regasification plant, as outlined below in Table 1. The level of storage required on location depends on the demand level of the power plant and travel distance to the LNG source/hubs.
The PGN Director has confirmed this locally driven logistics scenario. In comments in late 2020, the Director indicated that PGN would be responsible for the needed fuel and infrastructure, including LNG supplies, constructing LNG infrastructure including jetties, unloading, storage and regasification facilities, and gas transport to the delivery point.27 It should be noted that support infrastructure like jetties will play a crucial role. Existing projects in Benoa and Teluk Lamong LNG rely heavily on existing infrastructure access.
27 CNBC Indonesia. PGN-PLN signed master agreement for LNG supply. October 5, 2020.
Indonesia’s Small-Scale LNG Power Plant Conversion – A Triple Hit for PGN?
15
Table 1: SSLNG Delivery Models
Type Notes Delivery Mode
Floating Storage Regasification Unit (FSRU) (Or separate Floating Storage Unit and Floating Regasification Unit, FSU+FRU)
FSU+FRU Model implemented in Benoa LNG, with capacity of 52 BBTUD capacity, 26,000 cu.m storage supporting 200MW power plant Gas is transported by pipeline to the PLTDG Pesanggaran power plant
LNGC Vessel Capacity < 30,000 cu.m Small LNGC currently in operation in Indonesia with 19,000-22,500 cu.m capacity
Image Source: Pelindo Energi Logistik
Land-based storage and regasification terminal
Model implemented in Sambera LNG regasification, 8 BBTUD capacity, 630 cu.m storage supporting 40MW power plant
ISO Tank Container LNG. Containers can be delivered by vessel or trucks
Image Source: Petrominer
Barge-mounted storage and regasification28
Facility mounted on barge (7,500 – 30,000 cu.m storage), gas transported by pipe to power plant
LNG Vessel
Image Source: Wartsila
Near-shore regasification terminal29
Located near to a jetty (100 – 20,000 cu.m storage) the gas is transported by pipe to the power plant. Larger sized terminal with 50,000 cu.m capacity is in operation in Finland. Those with 20,000+ cu.m storage are classified as medium scale LNG
LNG Vessel
Image Source: Wartsila
Barge-mounted Power Plant (BMPP) with LNG storage and regasification
In 2020, Construction of BMPP (without LNG) by PT PAL was initiated for three power plants – not included in the gas conversion plan.30 The absence of LNG-supporting facility onboard would require a separate FS/RU facility attached
LNG Vessel or Container
Image Source: Jaya Samudra Karunia Group
Source: Compiled.
28 Wartsila. Small-and medium-scale LNG Terminals. 2018 29 Wartsila. Small-and medium-scale LNG Terminals. March 2018. 30 2x60MW for Kolaka, Southeast Sulawesi and 1x30MW for Sambelia, NTB. PT PAL. Power Independency in Eastern Indonesia through Barge-Mounted Power Plant. February 2020.
Indonesia’s Small-Scale LNG Power Plant Conversion – A Triple Hit for PGN?
16
In addition to the complexity of providing technical solutions for a diverse list of facilities, PGN will also face persistent problems with the limited scale of the offtake. While it is unclear what type of distribution model may emerge, at least 27 power plants have a projected demand level of less than 2 BBTUD. The very small demand level at these sites would likely dictate reliance on the ISO tank container option, given the low likelihood of establishing a dedicated storage/regasification vessel for such scale. Using small ISO tanks has also been reported to be planned for Indonesia’s first mini-LNG liquefaction plant in North Kalimantan to supply 22 BBTUD of gas.31
A Triple Shock to PGN? – COVID-19, Gas Pricing Regulation and a US$1.5bn Investment Burden The capital intensive ssLNG program has been handed to PGN at a time when the economy and PGN itself face high risks. In 2018, PGN was designated the ‘gas subholding’ of Pertamina and acquired a controlling stake in Pertamina Gas (Pertagas).32 This makes PGN a dominant player in the Indonesian gas market, and it owns a commanding 92% market share of Indonesian gas distribution.33 83% of PGN revenue in 2019 originated from the transmission and distribution (T&D) segment, with distribution accounting for approximately 77% of total revenue.34 Its long-term credit rating from Moody’s of Baa2 reflects its standalone Baa3 rating, with a one-notch uplift from the expected support from the Government of Indonesia, potentially through Pertamina (Baa2 stable).35 With 43% of PGN ownership held by the public, it is one of the few examples of an SOE with a large public ownership closely watched by the market.
The near-term challenge for investors and other stakeholders will be to determine how PGN can generate the sustainable cash flows needed to support the required investment in the ssLNG plan.
What’s clear to date is that the current gas conversion plan will benefit PLN if the gas could indeed be delivered cheaper than fuel oil to its plants. Pertamina could also benefit from the lower spending on fuel oil distribution – albeit the 1mkL scale is small compared to Pertamina 60-70mkL annual fuel oil sales.36 Both giant SOEs potentially reaping benefits raise questions about how PGN would financially fare in the plan. With existing total assets of US$7.5bn, 1,250 BBTUD of gas transmission and 820 BBTUD of distribution in 2020, placing US$1.5-2.5bn of investment to deliver an additional 167BBTUD of delivery capacity will strain the company’s
31 Kayan LNG Nusantara is planning to operate Indonesia’s first mini-LNG liquefaction plant. Katadata. Pertamina and Medco to supply gas to Indonesia’s first mini-LNG plant. May 20, 2020. 32 PGN Annual report 2019. Page 42. 33 Excluding direct sales of gas from upstream producers and inter-trader gas trades. 34 77% (US$2,974mn) coming from distribution/trading and US$246mn from transmission segment, excluding affiliates Kalimantan Jawa Gas (KJG) – Transportasi Gas Indonesia (TGI). PGN Annual Report 2019. 35 Moody’s Credit Opinion on PGN. June 2021. 36 Pertamina 2020 Annual Report.
Indonesia’s Small-Scale LNG Power Plant Conversion – A Triple Hit for PGN?
17
balance sheet and cash flow.
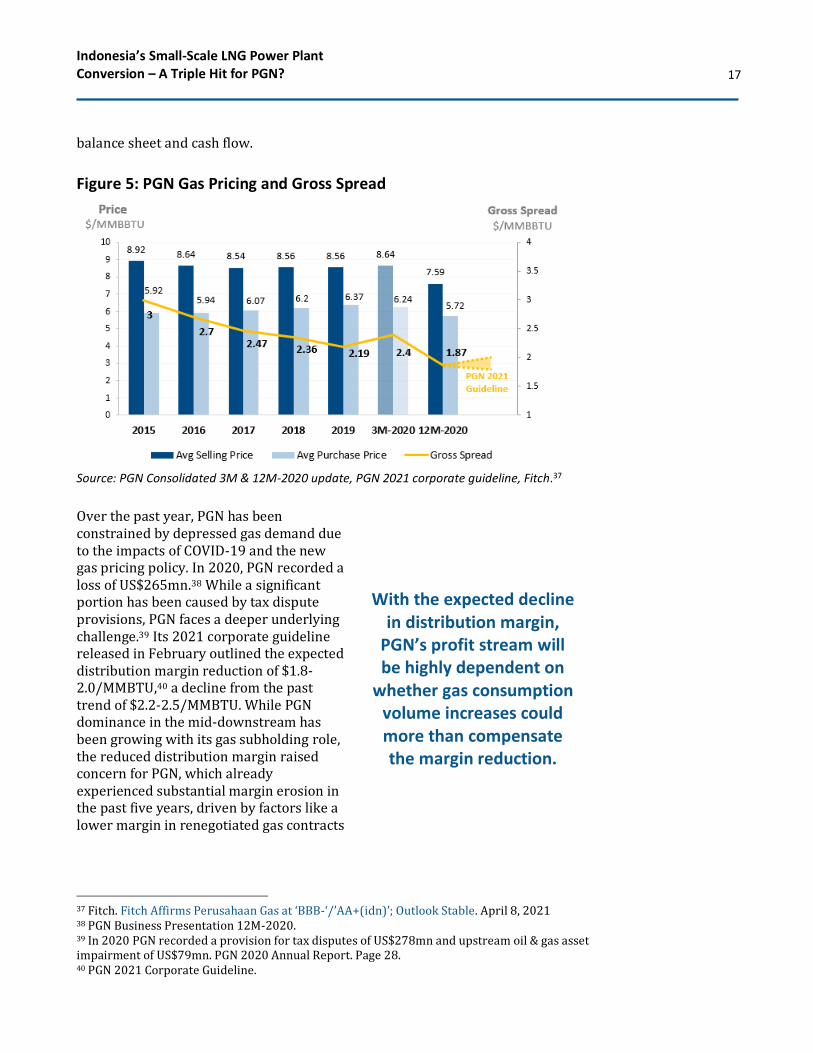
Figure 5: PGN Gas Pricing and Gross Spread
Source: PGN Consolidated 3M & 12M-2020 update, PGN 2021 corporate guideline, Fitch.37
Over the past year, PGN has been constrained by depressed gas demand due to the impacts of COVID-19 and the new gas pricing policy. In 2020, PGN recorded a loss of US$265mn.38 While a significant portion has been caused by tax dispute provisions, PGN faces a deeper underlying challenge.39 Its 2021 corporate guideline released in February outlined the expected distribution margin reduction of $1.8-2.0/MMBTU,40 a decline from the past trend of $2.2-2.5/MMBTU. While PGN dominance in the mid-downstream has been growing with its gas subholding role, the reduced distribution margin raised concern for PGN, which already experienced substantial margin erosion in the past five years, driven by factors like a lower margin in renegotiated gas contracts
37 Fitch. Fitch Affirms Perusahaan Gas at ‘BBB-‘/’AA+(idn)’; Outlook Stable. April 8, 2021 38 PGN Business Presentation 12M-2020. 39 In 2020 PGN recorded a provision for tax disputes of US$278mn and upstream oil & gas asset impairment of US$79mn. PGN 2020 Annual Report. Page 28. 40 PGN 2021 Corporate Guideline.
With the expected decline in distribution margin,
PGN’s profit stream will be highly dependent on
whether gas consumption volume increases could more than compensate the margin reduction.

Indonesia’s Small-Scale LNG Power Plant Conversion – A Triple Hit for PGN?
18
and higher cost of LNG in the supply portfolio.41
With the expected decline in distribution margin, the PGN profit stream will be depend on whether gas consumption volume increase could more than compensate for the margin reduction. PGN 2021 distribution volume forecast stood at 894-930BBTUD, still below the 2019 pre-COVID level of 951 BBTUD.42 In a parliamentary hearing in March 2021, the PGN director stated that the 2020 gas market absorption for the power sector and industry stood at 80% and 61% from the policy allocated volume.43 In June 2021, SKK Migas confirmed that the power sector’s realized gas consumption stood at 64 to 67% of the policy allocated volume, as presented in Figure 6.44 While gas, as a consumption recovery trend, was noted in 1Q2021, the concerns mentioned earlier indicate that the planned increase in gas sales volume will unlikely be a smooth ride, even at a controlled price level.
Figure 6: Policy-Allocated Gas Volume and Realization for Power Sector
Source: SKK Migas, Effectiveness of Gas Pricing Policy presentation, June 2021.
PGN LNG business segments constitute a small but growing part of the business and is operated through multiple channels:
• PGN LNG Indonesia (PLI), a wholly-owned subsidiary that operates FSRU Lampung.
• Nusantara Regas (NR), a joint venture with Pertamina (40% PGN ownership) which operates Nusantara Regas Satu FSRU.
41 Moody’s credit opinion on PGN. June 30, 2020. 42 PGN Operational Highlight May 2021. PGN Business Presentation 12M-2020. 43 DPR Commission VII Parliamentary hearing with PGN director. March 24, 2021. 44 Gas volume allocation per Kepmen ESDM 91K/2020. ‘Upstream direct’ represents direct gas sales from producers, ‘Through BU Niaga’ represents gas sales through licensed midstream trading entities. Addition of Jawa-1 gas power plant will potentially add ~130bbtud consumption to the total, subject to operational requirements.

Indonesia’s Small-Scale LNG Power Plant Conversion – A Triple Hit for PGN?
19
• Perta Arun Gas (PAG), under Pertagas (51% PGN ownership) which operates the land-based Arun LNG regas facility.
In 2020, PGN LNG regasification volume declined by 22% y/y, with a further 43% decline expected for 2021. This cut reflects the weakening demand and has been deeper than the overall decline of distribution (-13%) and transmission (-8%) segments in 2020.45 While PGN has repeatedly stated that it is ‘ready’ for the gas conversion project, the company has not yet disclosed how the investment will be scaled in the coming years and its impact on the company’s financials. With approximately US$2bn of debt maturing in 2024, the company needs to ensure that its financials remain stable.46
Figure 7: PGN LNG Business Segments
Source: PGN.47
Red Flags from PGN’s Past Experience With LNG Risk averse investors will be aware that project risks could be high – even if there is a high level of policy support. Indonesia’s two existing FSRUs were funded via long-term time charter leases, while Arun LNG terminal was converted from an existing
45 PGN 12M-2020 Investor Presentation. PGN 2021 Corporate Guidance. 46 US$1.35bn of Senior Notes PGN and US$625mn of Senior Unsecured Fixed Rate Notes PGN Annual Report 2020. Page 24-25. 47 Serie A Dwiwarna share carries special voting rights.

Indonesia’s Small-Scale LNG Power Plant Conversion – A Triple Hit for PGN?
20
export terminal. The new gas conversion plan would likely need at least one FSRU hub, with multiple small-scale storage and regas plants scattered across multiple regions. FSRU leases are a commonly used funding strategy in global markets. Still, for land-based storage and regas facilities, PGN would likely have only two funding options: direct capital investment or a joint venture with business partners. Whichever route PGN will take, it is worth examining PGN’s experience in the LNG segment.
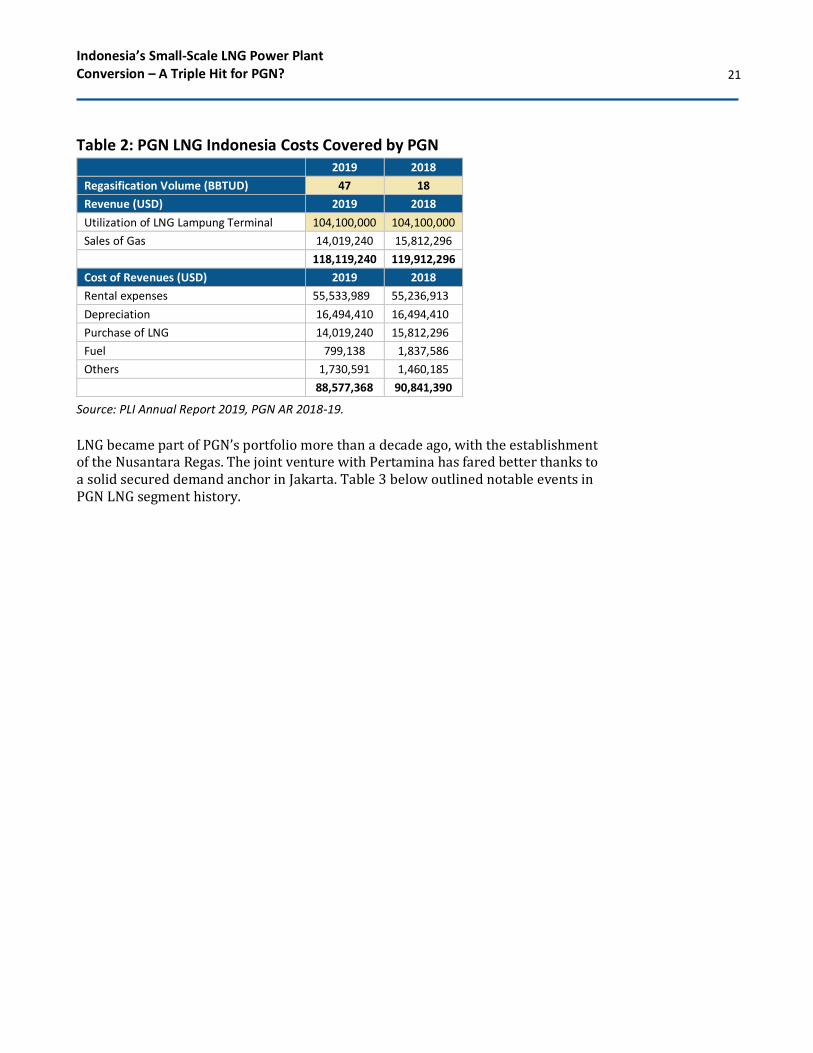
A closer examination of PGN LNG Indonesia (PLI) suggests PGN needs to take careful steps to ensure that LNG business expansion is well-planned and does not increase the financial burden on the company. This caution is warranted because FSRU Lampung is operating at a very low utilization rate of less than 20% in 2019, compared to circa 40% utilization in Nusantara Regas FSRU, which is more in line with the global industry standards.48 While reported profitable, more than 85% of PLI’s 2018-2019 revenue is fully paid by PGN as ‘utilization of LNG terminal cost’, while a mere 12-13% comes from sales of gas, as outlined in Table 2. Company revenue model certainly varies, but PGN as the parent company is essentially covering all of PLI’s financial exposure on the long-term lease and capital investments despite the low utilization rate, potentially until the lease contract expires in 2034.49
Lampung FSRU has indeed been mired in trouble from the beginning with its relocation from its original North Sumatera destination following an SOE ministry decision in 2012.50 Irrespective of the reasoning, this history further emphasizes Indonesia’s gas landscape’s potential complexity, and uncertainty, which often relies on ‘sudden’ policy maneuvers. PGN’s growing dominance in the gas sector does not necessarily elevate it to a position of greater influence. However, the potential impact of the new gas pricing policy certainly serves as a reminder.
48 IEEFA estimates based on PGN LNG Indonesia Annual Reports and PGN Annual Reports. PGN Annual Report 2019. Page 112, 122. Global average regas utilization rate from IGU Annual Report 2020. Page 77. 49 $446mn of FSRU contract value remaining in 2020. PGN Annual Report 2020. Page 505. 50 Relocation of the FSRU was directed by the Ministry of State-owned Enterprise (SOE) in 2012, in following the decision to convert Arun LNG export terminal into regasification terminal. Bisnis.com. LNG Terminal: PGN ready to relocate FSRU to Lampung. March 21, 2012
More than 85% of PLI’s 2018-2019 revenue is fully paid by PGN as ‘utilization
of LNG terminal cost’ while a mere 12-13%
comes from sales of gas.
Indonesia’s Small-Scale LNG Power Plant Conversion – A Triple Hit for PGN?
21
Table 2: PGN LNG Indonesia Costs Covered by PGN 2019 2018
Regasification Volume (BBTUD) 47 18
Revenue (USD) 2019 2018
Utilization of LNG Lampung Terminal 104,100,000 104,100,000
Sales of Gas 14,019,240 15,812,296
118,119,240 119,912,296
Cost of Revenues (USD) 2019 2018
Rental expenses 55,533,989 55,236,913
Depreciation 16,494,410 16,494,410
Purchase of LNG 14,019,240 15,812,296
Fuel 799,138 1,837,586
Others 1,730,591 1,460,185
88,577,368 90,841,390
Source: PLI Annual Report 2019, PGN AR 2018-19.
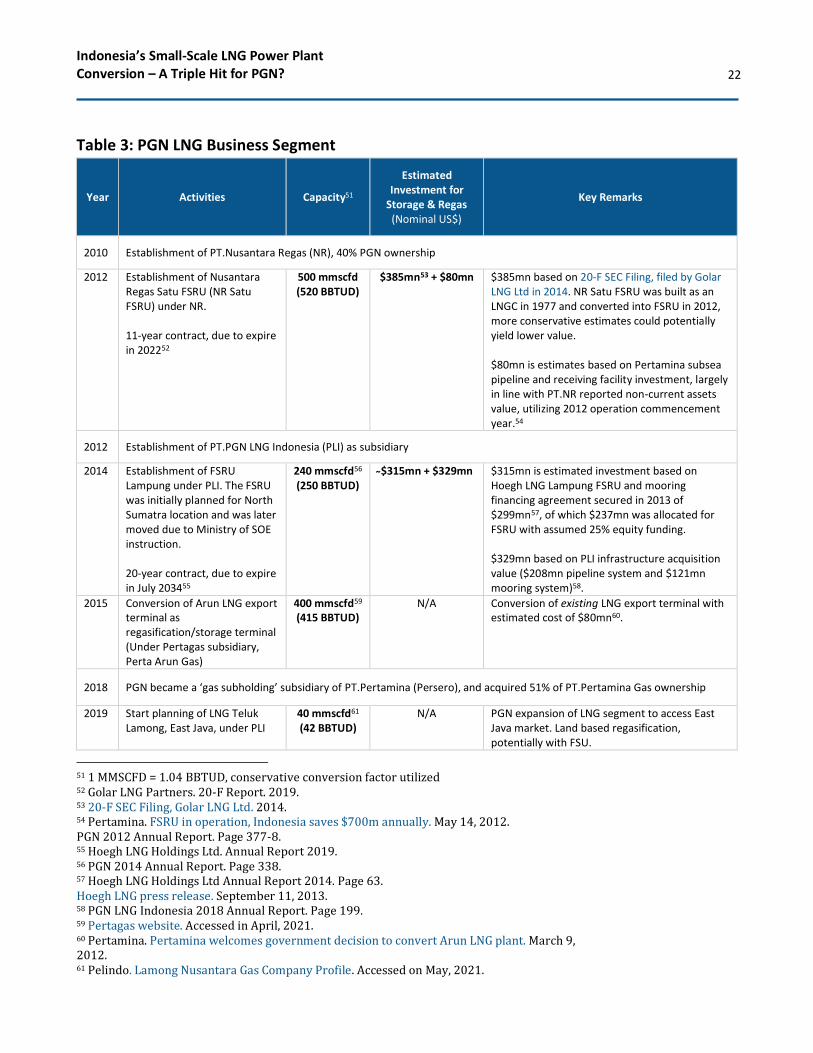
LNG became part of PGN’s portfolio more than a decade ago, with the establishment of the Nusantara Regas. The joint venture with Pertamina has fared better thanks to a solid secured demand anchor in Jakarta. Table 3 below outlined notable events in PGN LNG segment history.
Indonesia’s Small-Scale LNG Power Plant Conversion – A Triple Hit for PGN?
22
Table 3: PGN LNG Business Segment
Year Activities Capacity51
Estimated Investment for
Storage & Regas (Nominal US$)
Key Remarks
2010 Establishment of PT.Nusantara Regas (NR), 40% PGN ownership
2012 Establishment of Nusantara Regas Satu FSRU (NR Satu FSRU) under NR. 11-year contract, due to expire in 202252
500 mmscfd (520 BBTUD)
$385mn53 + $80mn $385mn based on 20-F SEC Filing, filed by Golar LNG Ltd in 2014. NR Satu FSRU was built as an LNGC in 1977 and converted into FSRU in 2012, more conservative estimates could potentially yield lower value. $80mn is estimates based on Pertamina subsea pipeline and receiving facility investment, largely in line with PT.NR reported non-current assets value, utilizing 2012 operation commencement year.54
2012 Establishment of PT.PGN LNG Indonesia (PLI) as subsidiary
2014 Establishment of FSRU Lampung under PLI. The FSRU was initially planned for North Sumatra location and was later moved due to Ministry of SOE instruction. 20-year contract, due to expire in July 203455
240 mmscfd56 (250 BBTUD)
$315mn + $329mn $315mn is estimated investment based on Hoegh LNG Lampung FSRU and mooring financing agreement secured in 2013 of $299mn57, of which $237mn was allocated for FSRU with assumed 25% equity funding. $329mn based on PLI infrastructure acquisition value ($208mn pipeline system and $121mn mooring system)58.
2015 Conversion of Arun LNG export terminal as regasification/storage terminal (Under Pertagas subsidiary, Perta Arun Gas)
400 mmscfd59 (415 BBTUD)
N/A Conversion of existing LNG export terminal with estimated cost of $80mn60.
2018 PGN became a ‘gas subholding’ subsidiary of PT.Pertamina (Persero), and acquired 51% of PT.Pertamina Gas ownership
2019 Start planning of LNG Teluk Lamong, East Java, under PLI
40 mmscfd61 (42 BBTUD)
N/A PGN expansion of LNG segment to access East Java market. Land based regasification, potentially with FSU.
51 1 MMSCFD = 1.04 BBTUD, conservative conversion factor utilized 52 Golar LNG Partners. 20-F Report. 2019. 53 20-F SEC Filing, Golar LNG Ltd. 2014. 54 Pertamina. FSRU in operation, Indonesia saves $700m annually. May 14, 2012. PGN 2012 Annual Report. Page 377-8. 55 Hoegh LNG Holdings Ltd. Annual Report 2019. 56 PGN 2014 Annual Report. Page 338. 57 Hoegh LNG Holdings Ltd Annual Report 2014. Page 63. Hoegh LNG press release. September 11, 2013. 58 PGN LNG Indonesia 2018 Annual Report. Page 199. 59 Pertagas website. Accessed in April, 2021. 60 Pertamina. Pertamina welcomes government decision to convert Arun LNG plant. March 9, 2012. 61 Pelindo. Lamong Nusantara Gas Company Profile. Accessed on May, 2021.
Indonesia’s Small-Scale LNG Power Plant Conversion – A Triple Hit for PGN?
23
subsidiary, Lamong Nusantara Gas (51% PLI stake)
2020 PLN gas conversion project for 52 power plants
280BBTUD estimated required
capacity for 167 BBTUD demand at
60% utilization
rate62
$1.5 - 2.5bn
Investment figures from PGN are assumed to exclude ssLNG Carrier (ssLNGC) vessels, which are more commonly chartered separately. Even when factoring in the cost of procuring five ssLNGC, the vessel is estimated only to amount to $250-400mn63, less than one-fifth of the capital investment, emphasizing that the bulk of the investment likely lies in the storage, hub & regas facilities. Both scenarios, with and without ssLNGC is presented in Figure 8
Source: Compiled.
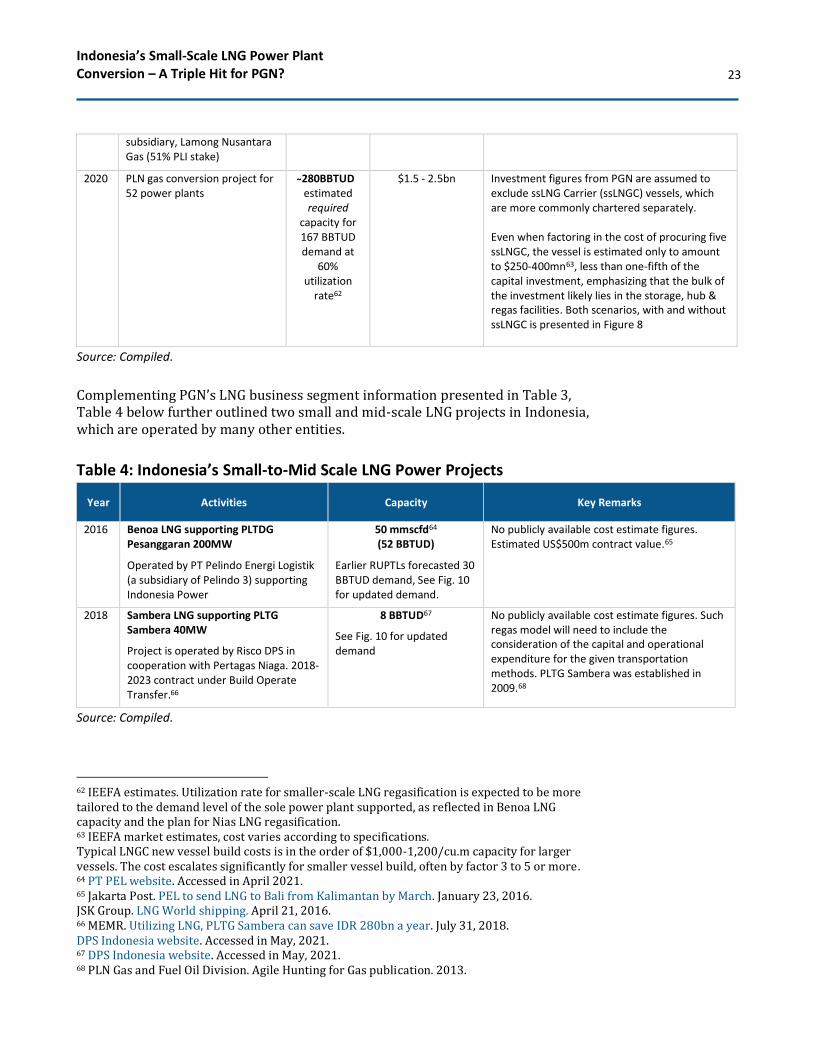
Complementing PGN’s LNG business segment information presented in Table 3, Table 4 below further outlined two small and mid-scale LNG projects in Indonesia, which are operated by many other entities.
Table 4: Indonesia’s Small-to-Mid Scale LNG Power Projects
Year Activities Capacity Key Remarks
2016 Benoa LNG supporting PLTDG Pesanggaran 200MW
Operated by PT Pelindo Energi Logistik (a subsidiary of Pelindo 3) supporting Indonesia Power
50 mmscfd64 (52 BBTUD)
Earlier RUPTLs forecasted 30 BBTUD demand, See Fig. 10 for updated demand.
No publicly available cost estimate figures. Estimated US$500m contract value.65
2018 Sambera LNG supporting PLTG Sambera 40MW
Project is operated by Risco DPS in cooperation with Pertagas Niaga. 2018-2023 contract under Build Operate Transfer.66
8 BBTUD67
See Fig. 10 for updated demand
No publicly available cost estimate figures. Such regas model will need to include the consideration of the capital and operational expenditure for the given transportation methods. PLTG Sambera was established in 2009.68
Source: Compiled.
62 IEEFA estimates. Utilization rate for smaller-scale LNG regasification is expected to be more tailored to the demand level of the sole power plant supported, as reflected in Benoa LNG capacity and the plan for Nias LNG regasification. 63 IEEFA market estimates, cost varies according to specifications. Typical LNGC new vessel build costs is in the order of $1,000-1,200/cu.m capacity for larger vessels. The cost escalates significantly for smaller vessel build, often by factor 3 to 5 or more. 64 PT PEL website. Accessed in April 2021. 65 Jakarta Post. PEL to send LNG to Bali from Kalimantan by March. January 23, 2016. JSK Group. LNG World shipping. April 21, 2016. 66 MEMR. Utilizing LNG, PLTG Sambera can save IDR 280bn a year. July 31, 2018. DPS Indonesia website. Accessed in May, 2021. 67 DPS Indonesia website. Accessed in May, 2021. 68 PLN Gas and Fuel Oil Division. Agile Hunting for Gas publication. 2013.

Indonesia’s Small-Scale LNG Power Plant Conversion – A Triple Hit for PGN?
24
Numbers Matter – Who Will Pay US$1.5bn for 167 BBTUD of Gas? Figure 8 below illustrates the capital expenditure required for several existing LNG projects, and an overview of the high cost of the gas conversion project estimates by PGN. The capital needed per delivered capacity is more than two to four times the investment required for existing LNG projects. Comparison of the LNG transportation, regasification, and delivery cost estimates presented in Figure 9 further illustrates the significant difference between logistic models. While it is possible that PGN could utilize the gas conversion project as a spearhead to establish a larger gas market beyond the power sector, the high up-front cost of the LNG infrastructure raises questions about access to financing when long-term demand risks associated with market development remain unsettled. PGN’s partners and funders will need to carefully consider tailored risk mitigation strategies to match affordable long-term funding for US$1.5bn of LNG infrastructure with the reality of ongoing price and demand risk.
Development of the market in these 52 locations beyond the identified power plants is questionable, especially when the only designated recipients of the ‘special gas’ price are off-takers restricted to certain industries – based on a list that can quickly shift depending on short-term policy preferences. If there is gas market potential beyond PLN power plants – such as smelters and petrochemical plants – such plans should be identified and asked to commit early in the funding cycle.69 Moreover, these buyers should have the financial backing needed to share the infrastructure cost burden.
69 Ferronickel smelter with 500MW PLTG is currently being planned by Vale Indonesia Tbk. Kontan. Vale Indonesia statement on smelter plan in Bahodopi. March 15, 2021.
The high up-front cost of the LNG infrastructure
raises questions about access to financing
when long-term demand risks associated with market development
remain unsettled.
Indonesia’s Small-Scale LNG Power Plant Conversion – A Triple Hit for PGN?
25
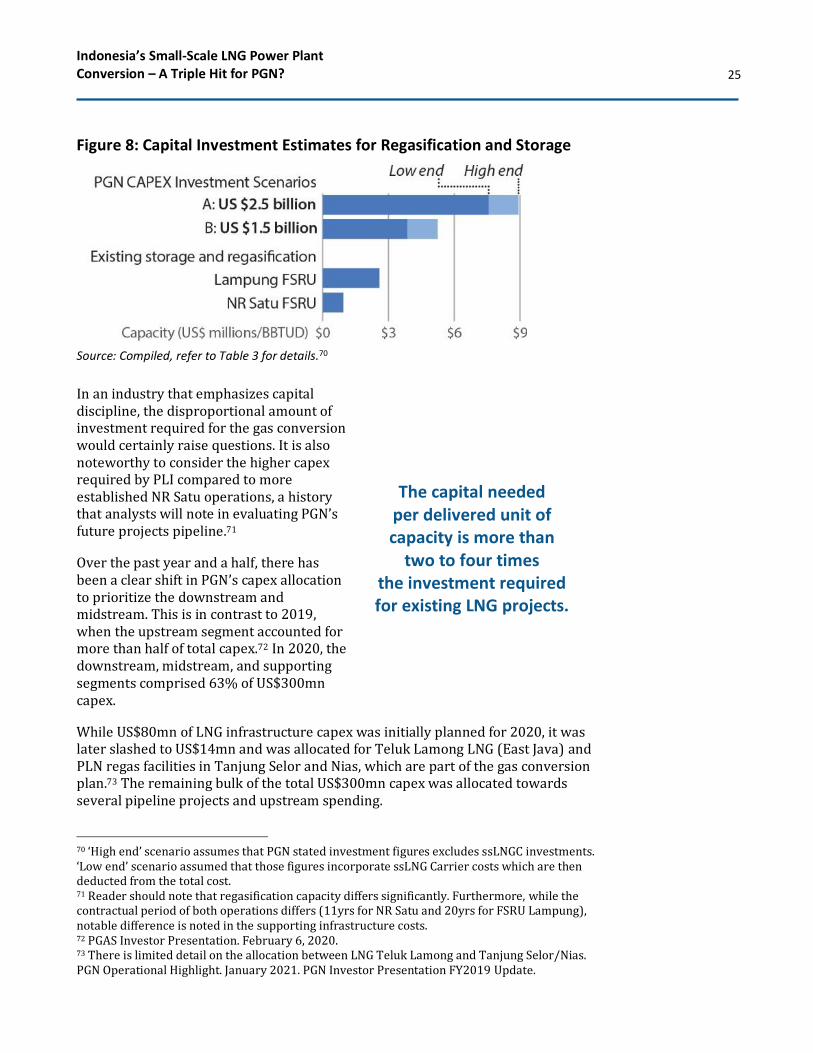
Figure 8: Capital Investment Estimates for Regasification and Storage
Source: Compiled, refer to Table 3 for details.70
In an industry that emphasizes capital discipline, the disproportional amount of investment required for the gas conversion would certainly raise questions. It is also noteworthy to consider the higher capex required by PLI compared to more established NR Satu operations, a history that analysts will note in evaluating PGN’s future projects pipeline.71
Over the past year and a half, there has been a clear shift in PGN’s capex allocation to prioritize the downstream and midstream. This is in contrast to 2019, when the upstream segment accounted for more than half of total capex.72 In 2020, the downstream, midstream, and supporting segments comprised 63% of US$300mn capex.
While US$80mn of LNG infrastructure capex was initially planned for 2020, it was later slashed to US$14mn and was allocated for Teluk Lamong LNG (East Java) and PLN regas facilities in Tanjung Selor and Nias, which are part of the gas conversion plan.73 The remaining bulk of the total US$300mn capex was allocated towards several pipeline projects and upstream spending.
70 ‘High end’ scenario assumes that PGN stated investment figures excludes ssLNGC investments. ‘Low end’ scenario assumed that those figures incorporate ssLNG Carrier costs which are then deducted from the total cost. 71 Reader should note that regasification capacity differs significantly. Furthermore, while the contractual period of both operations differs (11yrs for NR Satu and 20yrs for FSRU Lampung), notable difference is noted in the supporting infrastructure costs. 72 PGAS Investor Presentation. February 6, 2020. 73 There is limited detail on the allocation between LNG Teluk Lamong and Tanjung Selor/Nias. PGN Operational Highlight. January 2021. PGN Investor Presentation FY2019 Update.
The capital needed per delivered unit of capacity is more than
two to four times the investment required for existing LNG projects.

Indonesia’s Small-Scale LNG Power Plant Conversion – A Triple Hit for PGN?
26
Figure 9: LNG Transportation, Regasification and Delivery Cost Estimates
Source: IEEFA estimates.
In 2021-22, PGN’s capex plans anticipated only US$70-80mn of capex for LNG but focused on the Cilacap refinery and Teluk Lamong.74 As of April 2021, PGN has not reported any further capex realization for the gas conversion project.75 With no mention of sizeable gas conversion project capex and other priorities, it is unclear whether PGN is in a position to pursue the gas conversion plan by itself.
Table 5: PGN Capex in 2020 and 2021 (YTD-Apr21)
Source: PGN January, May 2021 Operational highlight, 3M-2021 Business presentation.
74 PGN 2021 Corporate guidance, February 2021. 75 Majority of capex spending YTD-March 2021 have been largely allocated for transmission pipelines (US$30mn of USD$40mn total capex) such as Rokan, Gresik-Semarang, and Senipah pipelines. PGN Operational Highlight May 2021.
Capex
(US$ mn)
Upstream 111 Development of existing oil & gas
blocks
Downstream 169 Rokan oil pipeline, Gresik-
Semarang gas transmission,
Distribution pipeline dev., Kuala
tanjung distribution pipeline
Teluk Lamong LNG infrastructure,
Regasification infrastructure for
PLN plants in Tanjung Selor & Nias
Supporting 6 Fiber optic development
Total 300
Business
SegmentsDetails
14Midstream
2020
Target Capex
(US$ mn)
Portfolio 63-83 10 Development of oil & gas blocks
Transmission
Pipeline
160-197 50 Rokan oil pipeline, Gresik-
Semaran gas pipeline, Senipah
gas pipeline
Gas commercial
infrastructure
147-180 3 Distribution pipeline dev. To
residential and industrial
customers
Services 43-63 1 Internet, telecommunication,
construction, O&M
LNG regasification terminal,
LNG refueling in Bontang,
metering systemLNG in East Java
Conversion of PLN power plants
(MEMR decr.13/2020)
Total 490-620 65
2021
Business
Segments
YTD-Apr21
(US$ mn)Details
Non-gas
transportation
pipeline
42-53 0
Storage 135-44

Indonesia’s Small-Scale LNG Power Plant Conversion – A Triple Hit for PGN?
27
In January 2021, the PGN CEO stated that the conversion plan still has ‘commercial challenges’ to be addressed, particularly relating to the volume of gas demand.76 He further raised questions regarding a 120MW power plant that only requires 2-3 BBTUD of gas in the current plan proposed by PLN. As a comparison, Pesanggaran 200MW PLTDG in Bali has required 20 to 40 BBTUD of gas. While some of these power plants operate as peaker plants, it is also important to note that peaker plants may require high-volume bursts of gas. This requirement can be costly because it would likely require larger storage and regasification capacity. It is not surprising that PGN requested PLN management to be more transparent in disclosing the analytics behind the potential gas volume.77
IEEFA believes that PGN is unlikely to take the project independently, although it may selectively take a piecemeal approach on some projects. With the lower distribution margin outlook, weakening upstream segment, and the implementation of PSAK73 accounting rules – where operational lease obligations must be listed on the balance sheet – PGN would likely tread more carefully in having a controlling interest in the project investment.78 The implication of PSAK73 is particularly relevant for the LNG segment, where long-term time charter leases have been the norm, including for the FSRU held under PLI.79 The current capex plan further emphasized that the gas conversion project does not rank high on the PGN priority list, especially with other projects which could deliver a more promising gas market.
The current structure of the project suggests that an alignment of interest likely does not exist for this gas conversion project, and that PGN would risk being left alone to shoulder the burden. Regardless of whether the project will be delivered by PGN or by business partners, the gas conversion plan will inevitably involve long-term liabilities for PGN. Lessons taken from other PGN LNG businesses should remind PGN to step carefully before making the bold steps.
76 Kontan. PLTD Gasification claimed to be held by gas demand and economics, PLN response. January 31, 2021. 77 Kontan. PGN request PLN to disclose the gas volume for PLTD conversion. January 27, 2021. 78 PSAK 73 is an adoption from IFRS 16 accounting rules for leases. In 2020, PGN recorded a lease liability totaling $533.9mn. PGN Annual Report 2020. Page 167. 79 In 2020 PGN debt to equity ratio increased from 85.04% to 104.6% y/y, and debt to service coverage ratio from 2.02 to 1.30 y/y
Regardless of whether the project will be
delivered by PGN or by business partners,
the gas conversion plan will inevitably involve
long-term liabilities for PGN.

Indonesia’s Small-Scale LNG Power Plant Conversion – A Triple Hit for PGN?
28
PLN Has Never Embraced Gas as a Core Fuel
When gas prices are evaluated purely on an energy-equivalent basis ($/MMBTU), the price is commonly measured against the oil parity benchmark ‘slope’ – 17.2% of crude price – with gas sold higher than parity price considered at a premium to fuel oil.80 GoI made a more pragmatic approach in 2017 with the issuance of Ministerial Regulation ESDM No.45/2017 which limited the gas price to 14.5% of Indonesian Crude Price (ICP) delivered at PLN’s plant gate.81 While a market with a 12-15% slope is common in the global LNG trade, meeting this delivered price level for domestic LNG use has proven challenging, hence the eventual decision to cut GoI revenue to reduce the plant gate price.
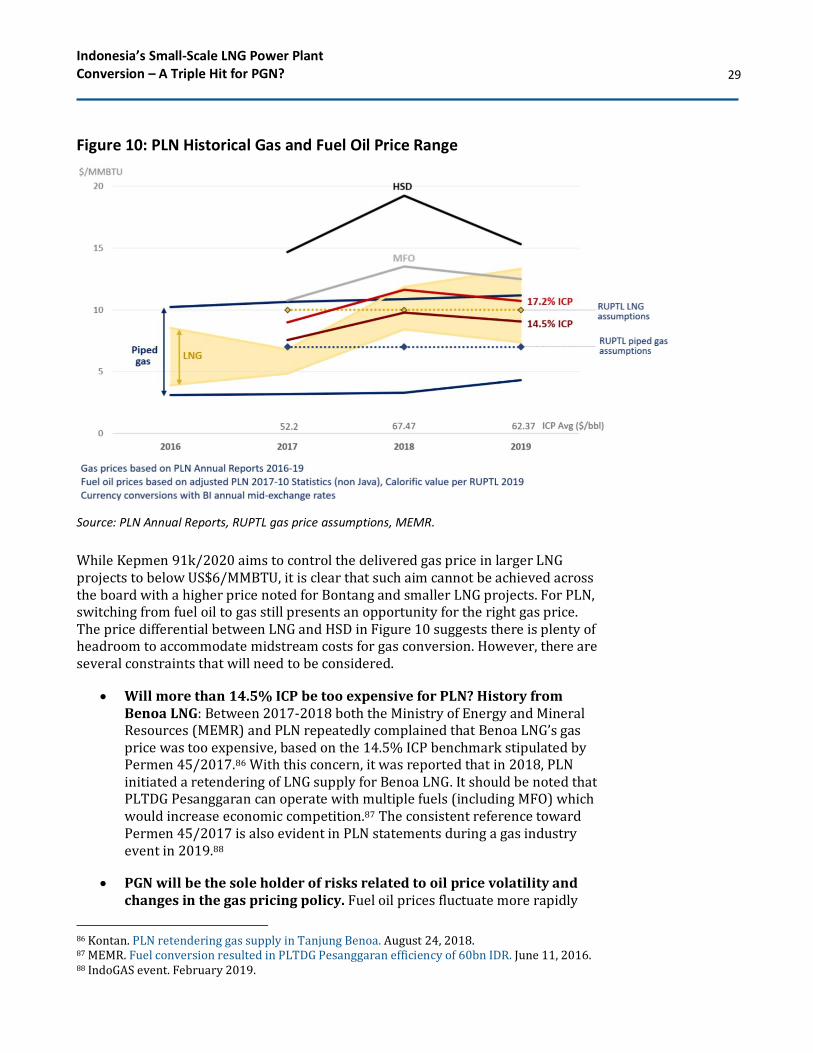
A more nuanced comparison would differentiate the price and energy content of the specific fuels, such as HSD and MFO as outlined in Figure 10. PLTMG, which is already utilizing MFO would present a bigger challenge for gas entry, given the higher energy content and generally lower cost of the MFO procured by PLN.82 The potential utilization of MFO in these new PLTMGs has indeed been one of the key considerations for the PLTMG deployment.83 In 2019, PLN fuel oils had been mainly procured from Pertamina with an average price of 105-106% of Mean of Platts Singapore (MOPS).84 Readers should be cautioned that the comparison of $/MMBTU for HSD against gas is often quoted for the Industrial HSD market price. At the same time, PLN has primarily been able to secure fuel oils at a considerable discount.
The chart below illustrates various gas and fuel oil prices from numerous RUPTL assumptions and actual PLN averages. 2019 RUPTL LNG price assumption of US$10/MMBTU (at US$60/bbl crude) was mainly in line with a US$60/bbl scenario on delivered LNG prices for mid-scale Benoa LNG and small-scale Sambera LNG at US$10.3 - 10.8/MMBTU85. Larger scale LNG projects in western Indonesia undoubtedly have more competitive LNG prices – on the order of US$8-9/MMBTU – with their greater economies of scale. The chart further illustrates the more volatile nature of LNG prices compared to piped gas.
80 A barrel of oil contains approximately 5.8 MMBTU. The ‘slope’ represents the indexation of gas against oil price for the corresponding heat content (MMBTU). IGU Natural Gas conversion hand book. 81 Indonesian Crude Price is a reference price reported by MEMR, the term ICP utilized in this report includes definition of REP (Realized/Representative Export Price) of Indonesian crude oil. 82 RUPTL 2019 assumption of 36,112 BTU/L (HSD) and 38,493 BTU/L (MFO) PLN national consumption of MFO 371mL, HSD 2,746 mL in 2019 (HSD inclusive of biodiesel, olein and others). PLN Statistics 2019. Page 56. 83 Detik. This is the reason PLN chooses gas engine to electrify Maluku-Papua. May 15, 2017. 84 2019 avg price of HSD: 104.95 to 105.03% from MOPS, MFO: 106.04 to 106.93% from MOPS. PLN Annual Report 2019. Page 774-5. 85 Gas, LNG, and liquid fuel price scenario for US$60/bbl crude, as outlined in RUPTL 2019. IEEFA Analysis
Indonesia’s Small-Scale LNG Power Plant Conversion – A Triple Hit for PGN?
29
Figure 10: PLN Historical Gas and Fuel Oil Price Range
Source: PLN Annual Reports, RUPTL gas price assumptions, MEMR.
While Kepmen 91k/2020 aims to control the delivered gas price in larger LNG projects to below US$6/MMBTU, it is clear that such aim cannot be achieved across the board with a higher price noted for Bontang and smaller LNG projects. For PLN, switching from fuel oil to gas still presents an opportunity for the right gas price. The price differential between LNG and HSD in Figure 10 suggests there is plenty of headroom to accommodate midstream costs for gas conversion. However, there are several constraints that will need to be considered.
• Will more than 14.5% ICP be too expensive for PLN? History from Benoa LNG: Between 2017-2018 both the Ministry of Energy and Mineral Resources (MEMR) and PLN repeatedly complained that Benoa LNG’s gas price was too expensive, based on the 14.5% ICP benchmark stipulated by Permen 45/2017.86 With this concern, it was reported that in 2018, PLN initiated a retendering of LNG supply for Benoa LNG. It should be noted that PLTDG Pesanggaran can operate with multiple fuels (including MFO) which would increase economic competition.87 The consistent reference toward Permen 45/2017 is also evident in PLN statements during a gas industry event in 2019.88
• PGN will be the sole holder of risks related to oil price volatility and changes in the gas pricing policy. Fuel oil prices fluctuate more rapidly
86 Kontan. PLN retendering gas supply in Tanjung Benoa. August 24, 2018. 87 MEMR. Fuel conversion resulted in PLTDG Pesanggaran efficiency of 60bn IDR. June 11, 2016. 88 IndoGAS event. February 2019.
Indonesia’s Small-Scale LNG Power Plant Conversion – A Triple Hit for PGN?
30
than gas, especially when the upstream gas price is controlled by a new pricing policy. With PLN expecting LNG to be pegged lower than fuel oil, PGN would be bounded by PLN’s willingness to pay while taking the entire downside risk if oil price dips. A more important note is that PGN’s business decisions should not be made solely on the untested assumption that the current gas pricing policy will remain stable in the future.
Stable Demand Is Critical for the Economics of LNG Those familiar with the development of the RUPTL would be well aware of the pattern of frequent annual changes in planned new capacity. PLI has also noted the challenges encountered in establishing the supply chain for PLN small-scale LNG plans, including changing power plant counts, type of fuels, reduction in electricity demand, and the decrease in oil price.89
Two existing small to mid-scale LNG regasification power projects in Indonesia present the typical situation encountered in gas demand fluctuation from PLN.
• Benoa LNG – Pesanggaran PLTDG 200MW90
With a midstream cost of US$4.31/MMTBU, Pesanggaran involves one of the most expensive Indonesian LNG supply chains. The regasification plant operated by Pelindo Energi Logistik was fitted with 50BBTUD regasification capacity to supply IP’s PLTDG Pesanggaran. Initial 30BBTUD of gas demand forecast in RUPTL 2016/17 was later dropped by more than a third to 20 BBTUD after the LNG plant operation commenced in 2016 – a move that certainly changes the economics of midstream supply.
89PGN LNG Indonesia 2019 Annual Report. Page 50. 90 PLTDG: Diesel and Gas Power Generation Unit. Indonesia Power Statistics book 2019

Indonesia’s Small-Scale LNG Power Plant Conversion – A Triple Hit for PGN?
31
Figure 11: Pesanggaran and Sambera Gas Demand Changes
Source: PLN, MEMR.
• Sambera LNG - PLTG Sambera 40MW
The project was reported to be established with a Build Operate Transfer model for the storage and regasification facility on a 5-year contract.91 The plant was originally planned to commence in 2018 with 7.9 mmscfd (8.2BBTUD) of gas supply.92 But, in RUPTL 2018/19, the gas demand plan dropped substantially to 1-3 BBTUD.
Both projects present the typical challenges faced in dealing with PLN forecasts, a risk that escalates further in the absence of tightly binding take-or-pay agreements. While the issuance of Permen 45/2017 which set the 14.5% slope limit may have been somewhat ambiguous in setting a LNG benchmark, it nevertheless implied a price ceiling, which PLN utilized as a benchmark for its Benoa LNG gas supply.93
IEEFA believes the apparent headroom between gas price and HSD is likely narrower with PLN persistence in utilizing a 14.5% slope reference. PGN therefore will need to clearly understand the PLN definition of ‘cheaper than fuel oil’ gas price.
Will PLN Reverse Its On-Again Off-Again Demand Pattern for LNG? While paying attention to PLN’s gas outlook for the gas conversion plan, policymakers, PGN, and the public should not be diverted from the potentially bigger challenge in domestic gas utilization: the inconsistency common to PLN’s gas demand pattern. Figure 12 below clearly indicates how projections from multiple
91 Kompas. PLTG Sambera becoming a model for 5 PLTG in Eastern Indonesia. July 30, 2018. 92 Tempo. Pertamina and PLN signed a gas sales agreement. September 28, 2017. 93 Katadata. PLN to reauction gas supply in Tanjung Benoa. August 24, 2018.

Indonesia’s Small-Scale LNG Power Plant Conversion – A Triple Hit for PGN?
32
RUPTLs since 2017 have diverged from PLN’s actual gas consumption. With gas infrastructure planning dependent on credible long-term forecasts, often beyond 20 years, risks associated with inconsistency are high. Therefore, any LNG plan will be vulnerable to ongoing volatility depending on how the RUPTL 2021 gas demand scenario is implemented.
Despite the new pricing regulation, a recent draft RUPTL21, issued after the release of the new gas pricing policy, continues to forecast low gas demand for the coming decade. This will naturally pressure PGN and investors to be cautious and heed lessons from PLN’s historical record. While PLN has been reluctant to clarify the exact problem, financial analysts will likely assume that PLN’s inability to absorb gas is likely due to the overbuilding of coal capacity with rigid contracts. Judging from history, this would explain PLN’s reluctance to engage in take-or-pay gas contracts which would lock them into fixed ongoing payments to support the LNG build-out.
Figure 12: Inconsistent PLN Gas Consumption
Source: Available RUPTL.94
Conclusion: What’s Different This Time for Gas Conversion? So, what’s different this time around for the gas conversion? Indonesia is entering a ‘stranded gas mode’, where gas cannot reach the market economically, forcing the government to essentially give away the gas cheaply.
As another government-mandated project assigned to SOE, analysts know that implementation risks can be high. So far, there has been no public statement from the government to provide specific support for PGN, which shoulders the burden.
94 IEEFA has noted that there are unit discrepancies between RUPTLs annual ‘realized gas consumption’ (stated in MBTU) and PLN Statistics Book gas consumption (stated in MMSCF or BBTU). Unit utilized in ‘projected fuel demand’ in RUPTL is consistent with PLN Statistics book.
Indonesia’s Small-Scale LNG Power Plant Conversion – A Triple Hit for PGN?
33
The new pricing policy should increase the affordability of gas for consumers. Still, the current figures of absorbed gas volume suggest that increasing demand would not likely be smooth sailing, especially under the prolonged strain of COVID-19.
What remains questionable is whether there is sufficient long-term commitment to hold such policy action through elections, and as global LNG market prices fluctuate. While the opportunity cost for GoI today, under a depressed LNG price, may be low, once the gas price picks up, it could be too tempting to retain the price control. More importantly, GoI also limits the extent of government revenue that can be reallocated to gas producers.
In short, there is no guarantee that the current market price support for gas will be consistent in the future. When the gas investment economics solely hinges on policy, the risk may simply be too great. Prioritizing capital expenditure on projects which could bring greater impact should remain a priority, and as a public company, PGN should stay prudent, as many are closely watching.
Indonesia’s Small-Scale LNG Power Plant Conversion – A Triple Hit for PGN?
34
Appendices
Appendix A: PLN Gas Supply Volume Allocation and Expected Benefits of Kepmen 91k/2020 & 89k/2020
Source: MEMR Regulation, SKK Migas.
Indonesia’s Small-Scale LNG Power Plant Conversion – A Triple Hit for PGN?
35
Appendix B: New Gas Pricing Policy
Source: MEMR Regulations, IEEFA estimates.
Indonesia’s Small-Scale LNG Power Plant Conversion – A Triple Hit for PGN?
36
Appendix C: Gas Conversion Plan
Source: MEMR, PLN, Compiled sources, IEEFA Analysis, available draft of RUPTL2021.
No Power Plant
Capacity
Combined
(MW)
Indicative Gas
volume
(BBTUD)
Potential cluster
RUPTL19 avg gas
consumption
(BBTUD)
dRUPTL21 avg gas
consumption
(BBTUD)
CoD Plan
Est. Ops
Commence
ment
1 Krueng Raya 165 14.64 Sumatra 5.84 TBC
2 Nias 25 5.17 Sumatra 4 2.88 2016
3 MPP Jeranjang 50 3.6 Bali-Nusra1 3.6 2.74 2017
4 PLTMG Sumbawa 50 6.13 Bali-Nusra1 3.6 4.2 2019
5 PLTMG Bima 50 6.13 Bali-Nusra2 3.6 4.1 2019
6 PLTMG Maumere 40 2.9 Bali-Nusra2 2.9 2.36 2019
7 PLTMG Alor 10 1.3 Bali-Nusra2 1.3 1.35 2021
8 PLTMG Kupang 40 2.9 Bali-Nusra2 2.9 1.67 2020
9 PLMTG Waingapu 10 1.3 Bali-Nusra2 1.3 1.15 2021
10 MPP Kalbar Jungkat 50 6 KalBar 2.34 2.64 2017
11 Pontianak Peaker 100 3.44 KalBar 3.44 3.44 2022
12 PLTG Siantan 30 1 Kalbar N/A 0.4 Pre 2005
13 Tanjung Selor 15 0.66 Kaltim 0.66 0.66 2020
14 MPP Ternate 30 2.75 Maluku 2.99 3.85 2018
15 Ambon Peaker 30 2.28 Maluku 1.77 2.65 2020
16 PLTMG Langgur 20 1.78 Papua Sel 1.49 1.67 2020
17 PLTMG Seram 20 1.01 Maluku 0.84 1.72 2020
18 PLTMG Merauke 2 20 1.52 Papua Sel 1.41 1.67 2020
19 PLTMG Merauke 20 1.63 Papua Sel 1.57 2.22 2020
20 PLTMG Timika 10 0.95 Papua Sel 0.95 0.98 2020
21 PLTMG Namlea 10 0.85 Maluku 0.76 1.12 2021
22 PLTMG Saumlaki 10 0.64 Papua Sel 0.66 0.87 2021
23 PLTMG Dobo 10 0.73 Papua Sel 0.7 1 2021
24 PLTMG Serui 1 10 0.95 Papua Utara 0.86 0.92 2021
25 PLTG Timika 2 40 3.75 Papua Sel 2022
26 PLTG Timika 2 Papua Sel 2022
27 MPP Fak-fak 10 0.62 Papua Sel 0.63 0.77 2022
28 PLTMG Bula 10 0.42 Maluku 0.51 0.68 2022
29 PLTMG Bacan 10 0.96 Maluku 0.59 0.9 2022
30 PLTMG Morotai 10 0.65 Maluku 0.82 0.8 2022
31 PLTG Kaimana 10 0.62 Papua Sel 0.72 0.84 2022
32 PLTMG Tobelo 10 0.47 Maluku 0.43 0.55 2022
33 PLTMG Sofifi 10 0.47 Maluku 0.45 0.55 2022
34 PLTMG Ternate 2 30 1.71 Maluku 1.36 2.08 2022
35 PLTG Maleo 100 17.52 Sulawesi 5 5.12 2016
36 PLTMG Nii Tanasa 59 7.48 Maluku 2.62 2.1 2017
37 PLTMG Bau Bau 39 2.67 Sulawesi 1.16 1.95 2019
38 PLTMG Rangko (Flores) 23 1.65 Bali-Nusra2 1.5 1.12 2019
39 PLTG Gilimanuk 134 7.9 Bali-Nusra1 10 1997
40 PLTMG Sorong Papua Utara 2019
41 PLTMG Sorong Papua Utara 2022
42 MPP Manokwari Papua Utara 2022
43 PLTMG Manokwari 2 Papua Utara 2020
44 PLTMG Manokwari 3 Papua Utara 2024
45 MPP Nabire Papua Utara 2017
46 PLTMG Nabire 2 Papua Utara 2019
47 PLTMG Nabire 3 Papua Utara 2025
48 PLTMG Biak Papua Utara 2020
49 PLTMG Biak 2 Papua Utara 2020 /19
50 PLTMG Jayapura Papua Utara 2017
51 PLTMG Jayapura Papua Utara 2020
52 PLTMG Jayapura 1 Papua Utara 2022
1697 148.34 89.76 111.79
25 2.27 1.76 2.22
149 12.3 9.43 14.08
60 5.83 4.14 5.61
43 2.34 1.63 2
3.61 4
100 8.45 3.92 10.16

Indonesia’s Small-Scale LNG Power Plant Conversion – A Triple Hit for PGN?
37
About IEEFA The Institute for Energy Economics and Financial Analysis (IEEFA) examines issues related to energy markets, trends and policies. The Institute’s mission is to accelerate the transition to a diverse, sustainable and profitable energy economy. www.ieefa.org
About the Author
Putra Adhiguna Putra Adhiguna is an Energy Analyst with 15 years of experience leading F500 organizations in the energy sector. He holds an engineering degree from Institut Teknologi Bandung and a Master’s degree in public policy from the London School of Economics & Political Science.