indonesian infrastructure: stable foundations for growth
TRANSCRIPT
www.pwc.com/id
Indonesian InfrastructureStable foundations for growth
The second edition of PwC’s annual Indonesian infrastructure report.

PwC | Indonesian Infrastructure 1
Indonesian Infrastructure Stable foundations for growth
Executive Summary
Infrastructure Spending Outlook
Overall, total government infrastructure spend in Indonesia increased by a substantial 51% from IDR 139trn (US$ 11.7bn) in 2014 to IDR 209trn (US$ 15.5bn) in 2015. While this represents significant progress in pursuing the government's ambitious infrastructure expansion plans, it was below the planned increase of 63%, due to a variety of reasons discussed in this report. The realization rate compared to the planned infrastructure budget also decreased slightly from 78% in 2014 to 72% in 2015. It should also be noted that not all of this spending has immediately flowed down to actual construction activity, since it includes money disbursed by the central government but not yet spent on construction (e.g. equity injections to state-owned enterprises (SOEs)) and also the overhead/administration costs of line ministries. As this indicates that some of the preparatory financing and administrative arrangements have now been progressed, this has provided the stable foundations for growth in spending in 2016 and beyond.
In the first 2016 revised budget (APBN-P), planned infrastructure spending rose by 9% from the 2015 planned budget, aligned with the government's long-term plan to drive the economy with multi-year infrastructure projects. Indeed, actual spending on infrastructure in the second quarter of 2016 rose compared to the first quarter of 2016. The government has further increased planned infrastructure spending in the 2017 draft budget (RAPBN) to IDR 346.6trn. Since August 2016, however, cuts have been made to infrastructure components of the 2016 budget, on account of a fiscal revenue shortfall.
On the private sector side, Foreign Direct Investment (FDI) has increased. In total, FDI reached US$ 29.27bn in 2015, a 2.6% rise from US$ 28.53bn in 2014. In key infrastructure-related sectors, FDI also increased by 9.6% in 2015 (25% in IDR terms), while Domestic Direct Investment (DDI) was actually down 4% year-on-year. In the first half of 2016, FDI in key infrastructure sectors plummeted by 67% compared to the same period in 2015 but this was offset by an increase in other sectors. Furthermore, a number of project finance deals closed during the period, which should help to reverse this trend.
The Jokowi administration has continued with many initiatives intended to increase infrastructure spending over the period to 2019. We previously forecasted a peak at 7.7% of gross domestic product (GDP) in 2017. While this seems optimistic given the progress to date, the success of the first year of the infrastructure programme (at least on paper) suggests that overall infrastructure spend will indeed rise above the historical average of 5.7% of GDP. However, we continue to believe that, as the Indonesian economy matures, infrastructure spend will fall again after 2019 as a proportion of GDP, to 5.3% by 2025.
The Asia-Pacific region spent US$ 2,144bn on infrastructure investment in 2015. Growth in infrastructure spending is estimated to have slowed in 2016 as GDP growth has moderated, especially in China. Whilst we have not updated our Indonesia forecast, our updated regional forecasts suggest that growth in Asia-Pacific infrastructure spending will be 3.4% in 2016, taking total spending to US$ 2,217bn. This implies an increase in Indonesia’s relative importance in the Asia-Pacific infrastructure market.
We continue to expect that investment in social infrastructure such as hospitals and health centers will grow strongly from the current low base – by more than 10% per year on average between 2015 and 2025. It is expected to account for 10% of total spend by 2025, up from 7% in 2014. In 2015, actual realisation of the budget for the health and education sectors (including both infrastructure and non-infrastructure spending) was about 93%. In the 2016 revised budget, the government has increased the budget of the health and education sectors compared to 2015 by 39% and 2% respectively. Both sectors will remain a high priority for the government, despite a minor reduction in the 2017 draft budget (both decreased by 0.6%) mainly due to difficulties with tax revenue collection (which however may be improved going forward with the government's recent highly successful tax amnesty programme).
Infrastructure Policy
The Indonesian government has in recent years put in place a robust institutional framework to support its infrastructure plans. In the last year it has announced 13 economic policy packages (“deregulation packages”) focusing on the deregulation of investment and tax incentives. The government expects these deregulation packages to improve Indonesia’s competitiveness and help to attract investment by cutting bureaucracy and providing greater legal and business certainty. A key target announced by the President is to raise Indonesia’s position in the World Bank’s Ease of Doing Business index to 40 by 2017. Indonesia has moved to position 109 this year, compared to 120 last year, out of 189 economies, but it is still behind directly competing Association of Southeast Asian Nations (ASEAN) countries such as Singapore, Malaysia and Thailand. The government expects that the impact of the deregulation programme will be more significant in the coming years since it plans to speed up implementation of deregulation packages at the working level.
2 PwC | Indonesian Infrastructure
Indonesian Infrastructure Stable foundations for growth
Sub-national governments have been allocated significantly larger infrastructure budgets in the 2016 state budget. This raises questions about the effectiveness of infrastructure spending given local government's capacity to absorb new funds. It is crucial that these funds are carefully monitored and the related infrastructure projects are well-managed.
In 2015 and 2016, the government injected significant equity funding into State-owned Enterprises (SOEs) to fund infrastructure projects but it has acknowledged that this is a short-term measure. It has made efforts to secure funding from international development agencies and introduced many regulatory reforms to create a more conducive environment for private sector participation in infrastructure.
The government now benefits from majority support in Parliament which should make it easier to implement its policies. The main focus of the July 2016 cabinet reshuffle was to improve co-ordination. There are also moves towards improved transparency in government institutions, with the appointment of a new chief of National Police and a number of arrests of judicial officials on corruption charges.
Recommendations
Key challenges for private sector investors in Indonesia Infrastructure continues to be a top priority for the Jokowi administration. However, the following historic obstacles remain to be addressed, and need to be considered by any investor considering the Indonesian market: The pipeline of projects is not yet fully transparent.
The legal/regulatory framework for projects is sometimes uncertain.
The judicial system cannot be fully relied upon to enforce contracts impartially and objectively.
Procurement processes are improving but are still not always clear and transparent.
Government policy and strategy is often unclear or subject to change at short notice.
Different public organisations may be uncoordinated and have conflicting goals and policies.
Many officials are risk-averse and not incentivised to deliver investment.
Public agencies often do not have budgets for high-quality project preparation by international consultants.
There is a high regulatory burden on new and existing businesses with a need for a large number of permits to operate or construct projects.
We believe that there has been real progress in the above areas in the last year as explained in detail in this report, but that the government still needs to take the following steps to achieve its infrastructure ambitions:
Key success factors for the infrastructure programme
Continued improvement in the investment climate, for example real coordinated improvement in bureaucracy across ministries to achieve the President’s “Ease of Doing Business” target, further de-regulation, and continuing improvements to transparency in state institutions.
Better coordination within and between government institutions. For example, there needs to be a strategy for infrastructure and public-private partnerships (PPPs) which defines a clear project pipeline and clear roles for different levels of government. The current approach is still based on a list of priority projects with ad hoc top-down decision-making.
Reduced reliance on SOEs. The majority of projects are still being implemented directly by SOEs, which do not always have the management capacity and funding for the tasks they are allocated. SOEs and Ministries need to be more willing to work with private sector partners to get projects implemented faster. The Ministry of State Owned Enterprises (MSOE), as shareholder, needs to hold SOEs accountable for delivering high quality project management and leveraging private sector finance and delivery capability for their projects.
Capacity building in project preparation and procurement and a new emphasis on finding, training and motivating talented people to manage the projects.
PwC | Indonesian Infrastructure 3
Indonesian Infrastructure Stable foundations for growth
Further streamlining and improvements to the land acquisition process and a much bigger budget allocation for LMAN, the new land acquisition agency. Land acquisition is critical for infrastructure development, as historically it has delayed many projects.
Recommendations for each infrastructure sector
Mining1: The government should (1) develop a strategic, economically feasible master plan for the various mineral sectors to incentivize downstream investment; (2) develop a plan for supporting infrastructure including ports, rail, roads and power; and (3) create a simplified, internationally competitive foreign investment process.
Oil & Gas1: Foreign investment in downstream infrastructure, e.g. oil refining capacity and gas distribution, needs to be encouraged through improvements to risk allocation.
Power: The government should focus on specific bottlenecks in the 35 gigawatt (GW) programme, including land acquisition and investment in transmission infrastructure, building on the measures included in the recent Presidential Regulation (Perpres 04/2016). It is important that new tariffs are agreed between Ministry of Energy and Mineral Resources (MEMR) and PT. PLN (Persero) (PLN) before they are issued.
Water: Clearer regulation is needed to reduce risk for the private sector, as well as continued reform and consolidation of PDAMs/PD PALs (local water and sewerage authorities), and increases in tariffs or other new funding arrangements to make them more independent, commercial and financially robust and enable them to fund capital investment.
Roads: The success of the roads programme requires implementation of availability payment-based PPP contracts and the creation of an open and transparent market to encourage private/international bidders to participate in this sector. This also requires a simplified budget process to make it easy for agencies to sign multi-year contractual commitments.
Rail: The public sector requires improved capability for planning, developing and managing rail projects and needs to develop mechanisms to increase the involvement of private/international players.
Ports: There needs to be improved co-ordination between the agencies involved in this sector (e.g. the four Pelindo companies and the Ministry of Fisheries) and further steps to encourage participants from the private sector).
Airports: The market requires greater clarity on the government’s strategy for expanding airport capacity and the ways it can participate, including a simplified PPP investment model and a greater openness to private sector participation so that projects can be delivered more quickly.
Telecoms: The government needs to set a clear policy to make it easier for companies laying fiber and building towers to gain access and rights of way. A tailored region-by-region target for fiber development is important too.
Healthcare: The government should encourage private investors by developing pilot PPP models plus (as for roads) clearer rules on how contracting agencies can commit to multi-year contracts.
1 This paper does not comment on upstream parts of these industries (e.g. exploration).
4 PwC | Indonesian Infrastructure
Indonesian Infrastructure Stable foundations for growth
1. The macroeconomic environment
The Indonesian economy experienced an uptick in growth in the third and fourth quarters of 2015 after following a downward trend at the beginning of 2015. Total 2015 growth came in at 4.8%.
This growth was driven largely by increased government spending, in line with President Jokowi’s plan to increase the share of public expenditure in the economy.
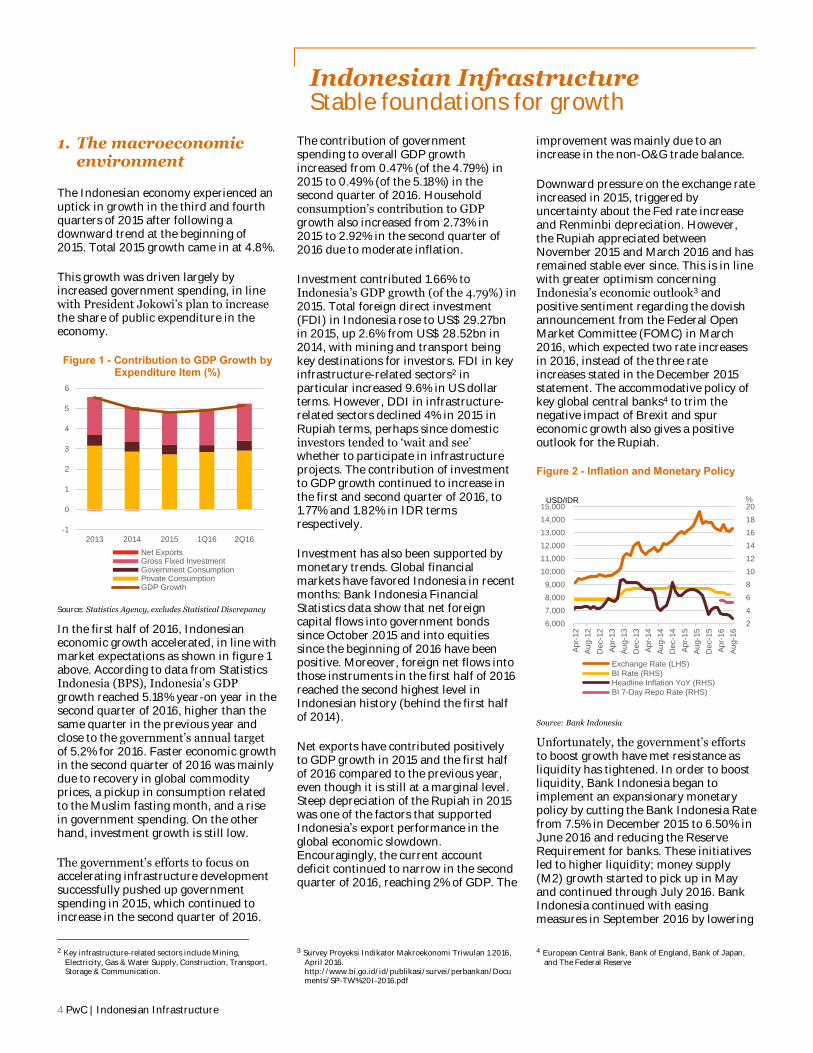
Figure 1 - Contribution to GDP Growth by Expenditure Item (%)
Source: Statistics Agency, excludes Statistical Discrepancy
In the first half of 2016, Indonesian economic growth accelerated, in line with market expectations as shown in figure 1 above. According to data from Statistics Indonesia (BPS), Indonesia’s GDP growth reached 5.18% year-on year in the second quarter of 2016, higher than the same quarter in the previous year and close to the government’s annual target of 5.2% for 2016. Faster economic growth in the second quarter of 2016 was mainly due to recovery in global commodity prices, a pickup in consumption related to the Muslim fasting month, and a rise in government spending. On the other hand, investment growth is still low.
The government’s efforts to focus on accelerating infrastructure development successfully pushed up government spending in 2015, which continued to increase in the second quarter of 2016.
2 Key infrastructure-related sectors include Mining,
Electricity, Gas & Water Supply, Construction, Transport, Storage & Communication.
The contribution of government spending to overall GDP growth increased from 0.47% (of the 4.79%) in 2015 to 0.49% (of the 5.18%) in the second quarter of 2016. Household consumption’s contribution to GDP growth also increased from 2.73% in 2015 to 2.92% in the second quarter of 2016 due to moderate inflation.
Investment contributed 1.66% to Indonesia’s GDP growth (of the 4.79%) in 2015. Total foreign direct investment (FDI) in Indonesia rose to US$ 29.27bn in 2015, up 2.6% from US$ 28.52bn in 2014, with mining and transport being key destinations for investors. FDI in key infrastructure-related sectors2 in particular increased 9.6% in US dollar terms. However, DDI in infrastructure-related sectors declined 4% in 2015 in Rupiah terms, perhaps since domestic investors tended to ‘wait and see’ whether to participate in infrastructure projects. The contribution of investment to GDP growth continued to increase in the first and second quarter of 2016, to 1.77% and 1.82% in IDR terms respectively.
Investment has also been supported by monetary trends. Global financial markets have favored Indonesia in recent months: Bank Indonesia Financial Statistics data show that net foreign capital flows into government bonds since October 2015 and into equities since the beginning of 2016 have been positive. Moreover, foreign net flows into those instruments in the first half of 2016 reached the second highest level in Indonesian history (behind the first half of 2014).
Net exports have contributed positively to GDP growth in 2015 and the first half of 2016 compared to the previous year, even though it is still at a marginal level. Steep depreciation of the Rupiah in 2015 was one of the factors that supported Indonesia’s export performance in the global economic slowdown. Encouragingly, the current account deficit continued to narrow in the second quarter of 2016, reaching 2% of GDP. The
3 Survey Proyeksi Indikator Makroekonomi Triwulan 1 2016, April 2016. http://www.bi.go.id/id/publikasi/survei/perbankan/Documents/SP-TW%20I-2016.pdf
improvement was mainly due to an increase in the non-O&G trade balance.
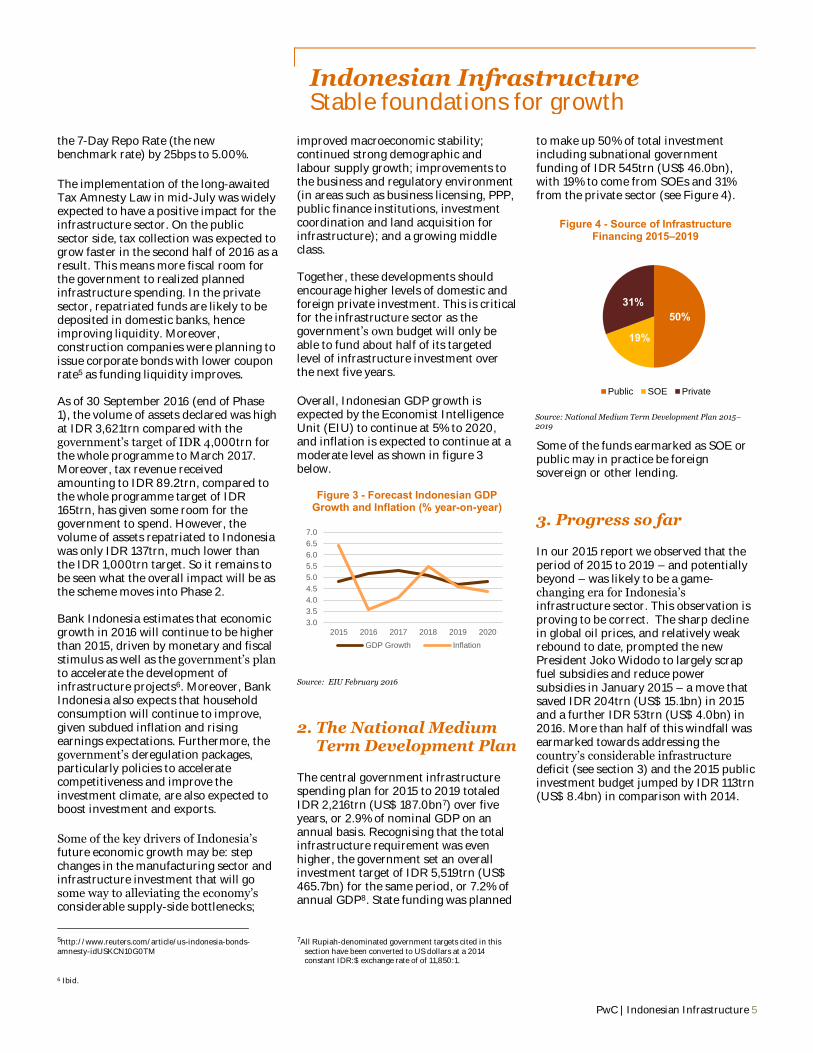
Downward pressure on the exchange rate increased in 2015, triggered by uncertainty about the Fed rate increase and Renminbi depreciation. However, the Rupiah appreciated between November 2015 and March 2016 and has remained stable ever since. This is in line with greater optimism concerning Indonesia’s economic outlook3 and positive sentiment regarding the dovish announcement from the Federal Open Market Committee (FOMC) in March 2016, which expected two rate increases in 2016, instead of the three rate increases stated in the December 2015 statement. The accommodative policy of key global central banks4 to trim the negative impact of Brexit and spur economic growth also gives a positive outlook for the Rupiah.
Figure 2 - Inflation and Monetary Policy
Source: Bank Indonesia
Unfortunately, the government’s efforts to boost growth have met resistance as liquidity has tightened. In order to boost liquidity, Bank Indonesia began to implement an expansionary monetary policy by cutting the Bank Indonesia Rate from 7.5% in December 2015 to 6.50% in June 2016 and reducing the Reserve Requirement for banks. These initiatives led to higher liquidity; money supply (M2) growth started to pick up in May and continued through July 2016. Bank Indonesia continued with easing measures in September 2016 by lowering
4 European Central Bank, Bank of England, Bank of Japan, and The Federal Reserve
-1
0
1
2
3
4
5
6
2013 2014 2015 1Q16 2Q16
Net ExportsGross Fixed InvestmentGovernment ConsumptionPrivate ConsumptionGDP Growth
2
4
6
8
10
12
14
16
18
20
6,000
7,000
8,000
9,000
10,000
11,000
12,000
13,000
14,000
15,000
Ap
r-1
2
Au
g-1
2
Dec-1
2
Ap
r-1
3
Au
g-1
3
Dec-1
3
Ap
r-1
4
Au
g-1
4
Dec-1
4
Ap
r-1
5
Au
g-1
5
Dec-1
5
Ap
r-1
6
Au
g-1
6
%
Exchange Rate (LHS)
BI Rate (RHS)
Headline Inflation YoY (RHS)
BI 7-Day Repo Rate (RHS)
USD/IDR
PwC | Indonesian Infrastructure 5
Indonesian Infrastructure Stable foundations for growth
the 7-Day Repo Rate (the new benchmark rate) by 25bps to 5.00%.
The implementation of the long-awaited Tax Amnesty Law in mid-July was widely expected to have a positive impact for the infrastructure sector. On the public sector side, tax collection was expected to grow faster in the second half of 2016 as a result. This means more fiscal room for the government to realized planned infrastructure spending. In the private sector, repatriated funds are likely to be deposited in domestic banks, hence improving liquidity. Moreover, construction companies were planning to issue corporate bonds with lower coupon rate5 as funding liquidity improves.
As of 30 September 2016 (end of Phase 1), the volume of assets declared was high at IDR 3,621trn compared with the government’s target of IDR 4,000trn for the whole programme to March 2017. Moreover, tax revenue received amounting to IDR 89.2trn, compared to the whole programme target of IDR 165trn, has given some room for the government to spend. However, the volume of assets repatriated to Indonesia was only IDR 137trn, much lower than the IDR 1,000trn target. So it remains to be seen what the overall impact will be as the scheme moves into Phase 2.
Bank Indonesia estimates that economic growth in 2016 will continue to be higher than 2015, driven by monetary and fiscal stimulus as well as the government’s plan to accelerate the development of infrastructure projects6. Moreover, Bank Indonesia also expects that household consumption will continue to improve, given subdued inflation and rising earnings expectations. Furthermore, the government’s deregulation packages, particularly policies to accelerate competitiveness and improve the investment climate, are also expected to boost investment and exports.
Some of the key drivers of Indonesia’s future economic growth may be: step changes in the manufacturing sector and infrastructure investment that will go some way to alleviating the economy’s considerable supply-side bottlenecks;
5http://www.reuters.com/article/us-indonesia-bonds-amnesty-idUSKCN10G0TM
6 Ibid.
improved macroeconomic stability; continued strong demographic and labour supply growth; improvements to the business and regulatory environment (in areas such as business licensing, PPP, public finance institutions, investment coordination and land acquisition for infrastructure); and a growing middle class. Together, these developments should encourage higher levels of domestic and foreign private investment. This is critical for the infrastructure sector as the government’s own budget will only be able to fund about half of its targeted level of infrastructure investment over the next five years.
Overall, Indonesian GDP growth is expected by the Economist Intelligence Unit (EIU) to continue at 5% to 2020, and inflation is expected to continue at a moderate level as shown in figure 3 below.
Figure 3 - Forecast Indonesian GDP Growth and Inflation (% year-on-year)
Source: EIU February 2016
2. The National Medium Term Development Plan
The central government infrastructure spending plan for 2015 to 2019 totaled IDR 2,216trn (US$ 187.0bn7) over five years, or 2.9% of nominal GDP on an annual basis. Recognising that the total infrastructure requirement was even higher, the government set an overall investment target of IDR 5,519trn (US$ 465.7bn) for the same period, or 7.2% of annual GDP8. State funding was planned
7All Rupiah-denominated government targets cited in this section have been converted to US dollars at a 2014 constant IDR:$ exchange rate of of 11,850:1.
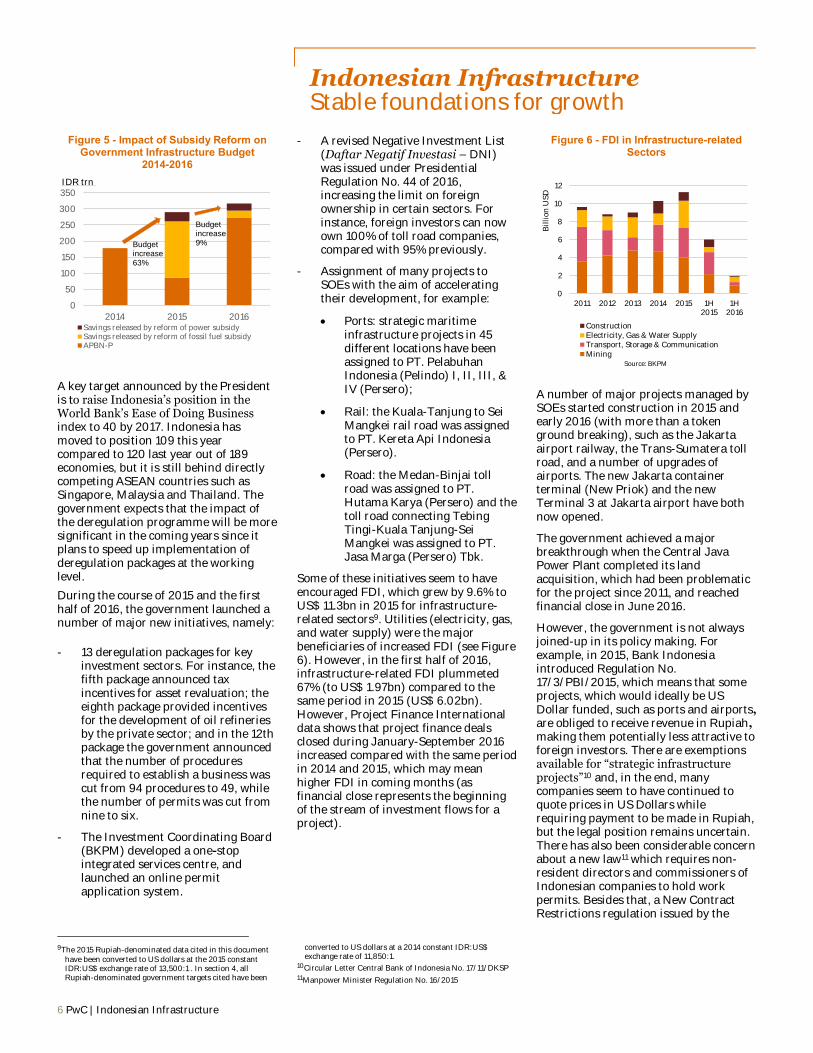
to make up 50% of total investment including subnational government funding of IDR 545trn (US$ 46.0bn), with 19% to come from SOEs and 31% from the private sector (see Figure 4).
Some of the funds earmarked as SOE or public may in practice be foreign sovereign or other lending.
3. Progress so far
In our 2015 report we observed that the period of 2015 to 2019 – and potentially beyond – was likely to be a game-changing era for Indonesia’s infrastructure sector. This observation is proving to be correct. The sharp decline in global oil prices, and relatively weak rebound to date, prompted the new President Joko Widodo to largely scrap fuel subsidies and reduce power subsidies in January 2015 – a move that saved IDR 204trn (US$ 15.1bn) in 2015 and a further IDR 53trn (US$ 4.0bn) in 2016. More than half of this windfall was earmarked towards addressing the country’s considerable infrastructure deficit (see section 3) and the 2015 public investment budget jumped by IDR 113trn (US$ 8.4bn) in comparison with 2014.
3.0
3.5
4.0
4.5
5.0
5.5
6.0
6.5
7.0
2015 2016 2017 2018 2019 2020
GDP Growth Inflation
Figure 4 - Source of Infrastructure Financing 2015–2019
Source: National Medium Term Development Plan 2015–2019
50%
19%
31%
Public SOE Private
6 PwC | Indonesian Infrastructure
Indonesian Infrastructure Stable foundations for growth
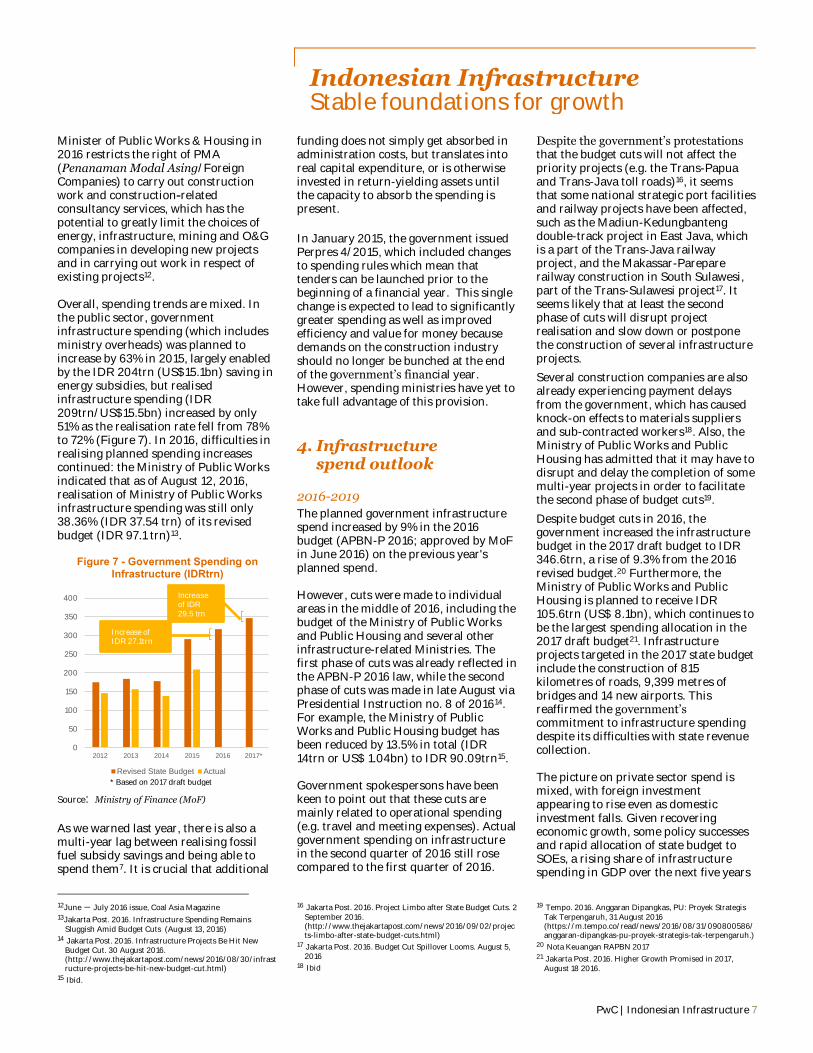
Figure 5 - Impact of Subsidy Reform on Government Infrastructure Budget
2014-2016
A key target announced by the President is to raise Indonesia’s position in the World Bank’s Ease of Doing Business index to 40 by 2017. Indonesia has moved to position 109 this year compared to 120 last year out of 189 economies, but it is still behind directly competing ASEAN countries such as Singapore, Malaysia and Thailand. The government expects that the impact of the deregulation programme will be more significant in the coming years since it plans to speed up implementation of deregulation packages at the working level.
During the course of 2015 and the first half of 2016, the government launched a number of major new initiatives, namely:
- 13 deregulation packages for key investment sectors. For instance, the fifth package announced tax incentives for asset revaluation; the eighth package provided incentives for the development of oil refineries by the private sector; and in the 12th package the government announced that the number of procedures required to establish a business was cut from 94 procedures to 49, while the number of permits was cut from nine to six.
- The Investment Coordinating Board (BKPM) developed a one-stop integrated services centre, and launched an online permit application system.
9The 2015 Rupiah-denominated data cited in this document
have been converted to US dollars at the 2015 constant IDR:US$ exchange rate of 13,500:1 . In section 4, all Rupiah-denominated government targets cited have been
- A revised Negative Investment List (Daftar Negatif Investasi – DNI) was issued under Presidential Regulation No. 44 of 2016, increasing the limit on foreign ownership in certain sectors. For instance, foreign investors can now own 100% of toll road companies, compared with 95% previously.
- Assignment of many projects to SOEs with the aim of accelerating their development, for example:
Ports: strategic maritime infrastructure projects in 45 different locations have been assigned to PT. Pelabuhan Indonesia (Pelindo) I, II, III, & IV (Persero);
Rail: the Kuala-Tanjung to Sei Mangkei rail road was assigned to PT. Kereta Api Indonesia (Persero).
Road: the Medan-Binjai toll road was assigned to PT. Hutama Karya (Persero) and the toll road connecting Tebing Tingi-Kuala Tanjung-Sei Mangkei was assigned to PT. Jasa Marga (Persero) Tbk.
Some of these initiatives seem to have encouraged FDI, which grew by 9.6% to US$ 11.3bn in 2015 for infrastructure-related sectors9. Utilities (electricity, gas, and water supply) were the major beneficiaries of increased FDI (see Figure 6). However, in the first half of 2016, infrastructure-related FDI plummeted 67% (to US$ 1.97bn) compared to the same period in 2015 (US$ 6.02bn). However, Project Finance International data shows that project finance deals closed during January-September 2016 increased compared with the same period in 2014 and 2015, which may mean higher FDI in coming months (as financial close represents the beginning of the stream of investment flows for a project).
converted to US dollars at a 2014 constant IDR:US$ exchange rate of 11,850:1.
10Circular Letter Central Bank of Indonesia No. 17/11/DKSP 11Manpower Minister Regulation No. 16/2015
Figure 6 - FDI in Infrastructure-related Sectors
A number of major projects managed by SOEs started construction in 2015 and early 2016 (with more than a token ground breaking), such as the Jakarta airport railway, the Trans-Sumatera toll road, and a number of upgrades of airports. The new Jakarta container terminal (New Priok) and the new Terminal 3 at Jakarta airport have both now opened.
The government achieved a major breakthrough when the Central Java Power Plant completed its land acquisition, which had been problematic for the project since 2011, and reached financial close in June 2016.
However, the government is not always joined-up in its policy making. For example, in 2015, Bank Indonesia introduced Regulation No. 17/3/PBI/2015, which means that some projects, which would ideally be US Dollar funded, such as ports and airports, are obliged to receive revenue in Rupiah, making them potentially less attractive to foreign investors. There are exemptions available for “strategic infrastructure projects”10 and, in the end, many companies seem to have continued to quote prices in US Dollars while requiring payment to be made in Rupiah, but the legal position remains uncertain. There has also been considerable concern about a new law11 which requires non-resident directors and commissioners of Indonesian companies to hold work permits. Besides that, a New Contract Restrictions regulation issued by the
0
50
100
150
200
250
300
350
2014 2015 2016Savings released by reform of power subsidySavings released by reform of fossil fuel subsidyAPBN-P
Budgetincrease 63%
Budget increase9%
IDR trn
0
2
4
6
8
10
12
2011 2012 2013 2014 2015 1H2015
1H2016
Bil
lio
n U
SD
Source: BKPM
ConstructionElectricity, Gas & Water SupplyTransport, Storage & CommunicationMining
PwC | Indonesian Infrastructure 7
Indonesian Infrastructure Stable foundations for growth
Minister of Public Works & Housing in 2016 restricts the right of PMA (Penanaman Modal Asing/Foreign Companies) to carry out construction work and construction-related consultancy services, which has the potential to greatly limit the choices of energy, infrastructure, mining and O&G companies in developing new projects and in carrying out work in respect of existing projects12. Overall, spending trends are mixed. In the public sector, government infrastructure spending (which includes ministry overheads) was planned to increase by 63% in 2015, largely enabled by the IDR 204trn (US$15.1bn) saving in energy subsidies, but realised infrastructure spending (IDR 209trn/US$15.5bn) increased by only 51% as the realisation rate fell from 78% to 72% (Figure 7). In 2016, difficulties in realising planned spending increases continued: the Ministry of Public Works indicated that as of August 12, 2016, realisation of Ministry of Public Works infrastructure spending was still only 38.36% (IDR 37.54 trn) of its revised budget (IDR 97.1 trn)13.
Figure 7 - Government Spending on Infrastructure (IDRtrn)
Source: Ministry of Finance (MoF)
As we warned last year, there is also a multi-year lag between realising fossil fuel subsidy savings and being able to spend them7. It is crucial that additional
12June – July 2016 issue, Coal Asia Magazine 13Jakarta Post. 2016. Infrastructure Spending Remains
Sluggish Amid Budget Cuts (August 13, 2016) 14 Jakarta Post. 2016. Infrastructure Projects Be Hit New
Budget Cut. 30 August 2016. (http://www.thejakartapost.com/news/2016/08/30/infrastructure-projects-be-hit-new-budget-cut.html)
15 Ibid.
funding does not simply get absorbed in administration costs, but translates into real capital expenditure, or is otherwise invested in return-yielding assets until the capacity to absorb the spending is present.
In January 2015, the government issued Perpres 4/2015, which included changes to spending rules which mean that tenders can be launched prior to the beginning of a financial year. This single change is expected to lead to significantly greater spending as well as improved efficiency and value for money because demands on the construction industry should no longer be bunched at the end of the government’s financial year. However, spending ministries have yet to take full advantage of this provision.
4. Infrastructure
spend outlook
2016-2019
The planned government infrastructure spend increased by 9% in the 2016 budget (APBN-P 2016; approved by MoF in June 2016) on the previous year's planned spend. However, cuts were made to individual areas in the middle of 2016, including the budget of the Ministry of Public Works and Public Housing and several other infrastructure-related Ministries. The first phase of cuts was already reflected in the APBN-P 2016 law, while the second phase of cuts was made in late August via Presidential Instruction no. 8 of 201614. For example, the Ministry of Public Works and Public Housing budget has been reduced by 13.5% in total (IDR 14trn or US$ 1.04bn) to IDR 90.09trn15. Government spokespersons have been keen to point out that these cuts are mainly related to operational spending (e.g. travel and meeting expenses). Actual government spending on infrastructure in the second quarter of 2016 still rose compared to the first quarter of 2016.
16 Jakarta Post. 2016. Project Limbo after State Budget Cuts. 2 September 2016. (http://www.thejakartapost.com/news/2016/09/02/projects-limbo-after-state-budget-cuts.html)
17 Jakarta Post. 2016. Budget Cut Spillover Looms. August 5, 2016
18 Ibid
Despite the government’s protestations that the budget cuts will not affect the priority projects (e.g. the Trans-Papua and Trans-Java toll roads)16, it seems that some national strategic port facilities and railway projects have been affected, such as the Madiun-Kedungbanteng double-track project in East Java, which is a part of the Trans-Java railway project, and the Makassar-Parepare railway construction in South Sulawesi, part of the Trans-Sulawesi project17. It seems likely that at least the second phase of cuts will disrupt project realisation and slow down or postpone the construction of several infrastructure projects.
Several construction companies are also already experiencing payment delays from the government, which has caused knock-on effects to materials suppliers and sub-contracted workers18. Also, the Ministry of Public Works and Public Housing has admitted that it may have to disrupt and delay the completion of some multi-year projects in order to facilitate the second phase of budget cuts19.
Despite budget cuts in 2016, the government increased the infrastructure budget in the 2017 draft budget to IDR 346.6trn, a rise of 9.3% from the 2016 revised budget.20 Furthermore, the Ministry of Public Works and Public Housing is planned to receive IDR 105.6trn (US$ 8.1bn), which continues to be the largest spending allocation in the 2017 draft budget21. Infrastructure projects targeted in the 2017 state budget include the construction of 815 kilometres of roads, 9,399 metres of bridges and 14 new airports. This reaffirmed the government’s commitment to infrastructure spending despite its difficulties with state revenue collection. The picture on private sector spend is mixed, with foreign investment appearing to rise even as domestic investment falls. Given recovering economic growth, some policy successes and rapid allocation of state budget to SOEs, a rising share of infrastructure spending in GDP over the next five years
19 Tempo. 2016. Anggaran Dipangkas, PU: Proyek Strategis Tak Terpengaruh, 31 August 2016 (https://m.tempo.co/read/news/2016/08/31/090800586/
anggaran-dipangkas-pu-proyek-strategis-tak-terpengaruh.) 20 Nota Keuangan RAPBN 2017 21 Jakarta Post. 2016. Higher Growth Promised in 2017,
August 18 2016.
0
50
100
150
200
250
300
350
400
2012 2013 2014 2015 2016 2017*
Revised State Budget Actual
Increase of IDR29.5 trn
Increase of IDR 27.1trn
* Based on 2017 draft budget
8 PwC | Indonesian Infrastructure
Indonesian Infrastructure Stable foundations for growth
continues to be attainable, as projected in our last year’s report. However, a strong pipeline of private sector projects (including PPP projects) will be needed to sustain rapid growth, as well as the other enabling factors highlighted in this document.
Public investment in the years up to 2019 is set to remain high as the government continues its ambitious medium-term infrastructure programme, but the government needs to do better than it has done to date to ensure the extra resources that are available are actually spent.
Last year, we projected that total infrastructure investment between 2015 and 2019, in 2014 constant exchange rate terms and covering all sectors included in this study (which is a wider definition than that of the government’s), would be around 87% higher than the preceding five-year period. Our projections implied that the government would fall short of its ambitious targets by around 19%.
There are several causes of this shortfall. Despite a number of positive steps, bureaucratic, procurement, land acquisition and skills bottlenecks in the infrastructure sector are likely to continue to give rise to underperformance against the target.
According to our analysis, there are also inherent frictions in the macro economy that constrain the volume of investment, such as banks’ capacity to absorb FDI and shortages of skilled labour.
However, even achieving our forecasts of US$ 312bn on core infrastructure would be a huge achievement for Indonesia, and would ease a critical constraint on economic development.
Spending growth can be expected to be strong in absolute terms. Economic and demographic factors will continue to drive investment, and the infrastructure project pipelines significant.
The outlook is mixed across sectors and some sectors like roads, airports and power may see investment close to target. Others will fall significantly short (e.g., water). We discuss the main sectors one by one in Section 7.
22Source: Petromindo, Indonesia Oil, Gas & Power, May 2016
In Utilities, several landmark water projects are moving forward and 19.3 GW of power contracts have now been signed22: most will be looking for finance in the next 12 months.
In Transport, investment by SOEs in major projects will likely continue to increase the sector’s share of overall infrastructure spend.
Mining, oil and gas remain uncertain, given regulatory inefficiency and dependence on energy/commodity prices, and 2015-16 has been a bleak period for new project investment.
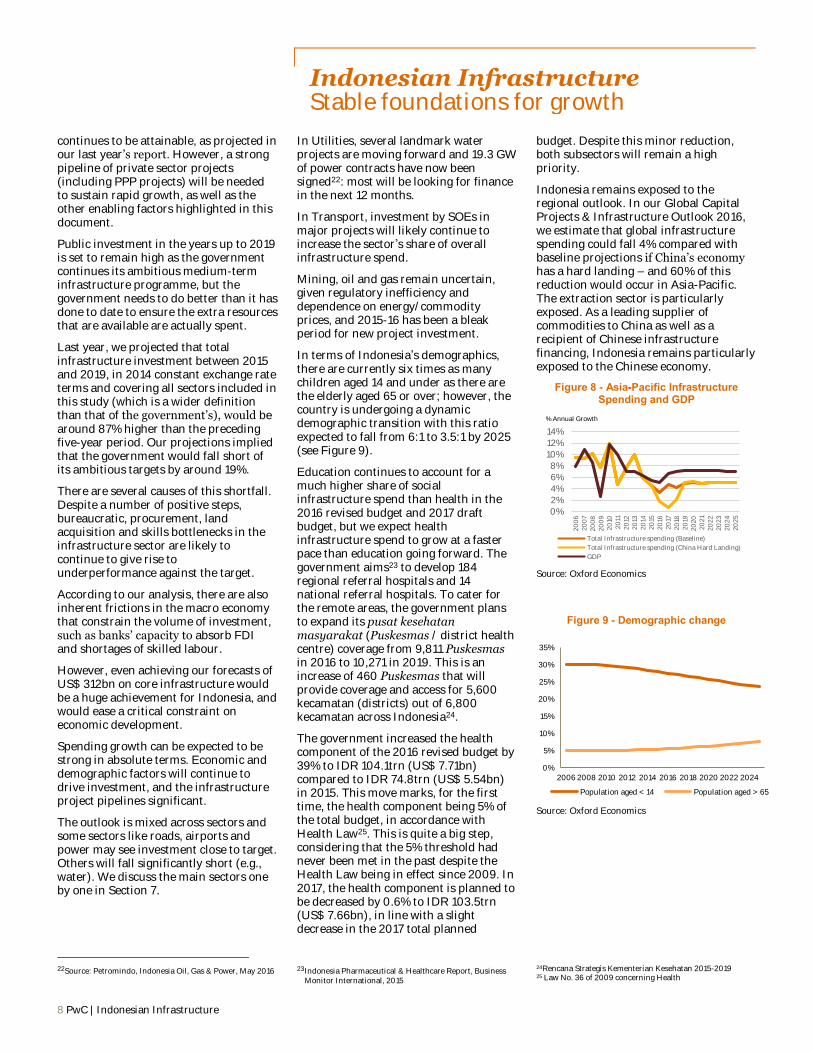
In terms of Indonesia’s demographics, there are currently six times as many children aged 14 and under as there are the elderly aged 65 or over; however, the country is undergoing a dynamic demographic transition with this ratio expected to fall from 6:1 to 3.5:1 by 2025 (see Figure 9).
Education continues to account for a much higher share of social infrastructure spend than health in the 2016 revised budget and 2017 draft budget, but we expect health infrastructure spend to grow at a faster pace than education going forward. The government aims23 to develop 184 regional referral hospitals and 14 national referral hospitals. To cater for the remote areas, the government plans to expand its pusat kesehatan masyarakat (Puskesmas / district health centre) coverage from 9,811 Puskesmas in 2016 to 10,271 in 2019. This is an increase of 460 Puskesmas that will provide coverage and access for 5,600 kecamatan (districts) out of 6,800 kecamatan across Indonesia24.
The government increased the health component of the 2016 revised budget by 39% to IDR 104.1trn (US$ 7.71bn) compared to IDR 74.8trn (US$ 5.54bn) in 2015. This move marks, for the first time, the health component being 5% of the total budget, in accordance with Health Law25. This is quite a big step, considering that the 5% threshold had never been met in the past despite the Health Law being in effect since 2009. In 2017, the health component is planned to be decreased by 0.6% to IDR 103.5trn (US$ 7.66bn), in line with a slight decrease in the 2017 total planned
23Indonesia Pharmaceutical & Healthcare Report, Business Monitor International, 2015
budget. Despite this minor reduction, both subsectors will remain a high priority.
Indonesia remains exposed to the regional outlook. In our Global Capital Projects & Infrastructure Outlook 2016, we estimate that global infrastructure spending could fall 4% compared with baseline projections if China’s economy has a hard landing – and 60% of this reduction would occur in Asia-Pacific. The extraction sector is particularly exposed. As a leading supplier of commodities to China as well as a recipient of Chinese infrastructure financing, Indonesia remains particularly exposed to the Chinese economy.
Figure 8 - Asia-Pacific Infrastructure Spending and GDP
Source: Oxford Economics
Figure 9 - Demographic change
Source: Oxford Economics
24Rencana Strategis Kementerian Kesehatan 2015-2019 25 Law No. 36 of 2009 concerning Health
0%
2%
4%
6%
8%
10%
12%
14%
20
06
20
07
20
08
20
09
20
10
20
11
20
12
20
13
20
14
20
15
20
16
20
17
20
18
20
19
20
20
20
21
20
22
20
23
20
24
20
25
Total Infrastructure spending (Baseline)
Total Infrastructure spending (China Hard Landing)
GDP
0%
5%
10%
15%
20%
25%
30%
35%
2006 2008 2010 2012 2014 2016 2018 2020 2022 2024
Population aged < 14 Population aged > 65
% Annual Growth
PwC | Indonesian Infrastructure 9
Indonesian Infrastructure Stable foundations for growth
Beyond 2019
We continue to focus on the period 2015-2019, as this coincides with the government’s planning timeframe. It is more difficult to make predictions for the period from 2020 onwards as this will be strongly influenced by the outcome of the 2018 Presidential election and the government’s next five-year plan. In our 2015 report we assumed a slowdown in the growth of infrastructure spend in the latter half of our forecast period (see Appendix 2), resulting in a decrease in infrastructure’s share of GDP and total economy investment. This would mean that between 2014 and 2025, infrastructure spend in Indonesia would grow at a pace similar to the neighboring Philippines, but faster than Malaysia (see Appendix 2. With the government likely to undershoot its infrastructure investment target from 2015 to 2019, it seems increasingly likely that investment will
spill over into the 2020-24 period – provided there is sufficient fiscal space to fund this, since the need for improved infrastructure will remain. Such a spillover is not reflected in our forecasts.
While the outlook is generally positive for Indonesian infrastructure, there are important risks as well. The Rupiah’s performance over the past year has shown Indonesia’s exposure to expectations of US Monetary Policy (both upwards and downwards). Since interest rate hikes are still expected in the medium term, this could put downwards pressure on the Rupiah again.
And even as the government gradually addresses the known implementation challenges, other specific bottlenecks are emerging. For example, in the power sector, transmission capacity and land acquisition for transmission corridors are
major concerns for Independent Power Producer (IPP) deals.
Overall, there are significant risks in our forecasts but we have sought to strike a balanced view.
The forecasts were based on a macroeconomic model at a global level. They have also been reviewed at a country level. Our forecasts take into account implementation risk generally in Indonesia but they do not account for such risks as political opposition and implementation issues related to individual projects and programmes that might continue to affect actual results at a country level.
10 PwC | Indonesian Infrastructure
Indonesian Infrastructure Stable foundations for growth
2014
(APBN-P)
2015
(APBN-P)
%Change
(yoy)
2014-2015
2016
(APBN-P)
%Change
(yoy)
2015-2016
2017
(RAPBN)
%Change
(yoy)
2016-2017
Final/Amended Budget Allocation:
Ministries 149.4 196.8 32% 151.2 -23% 161.0 6%
Ministry of Public Works and Public
Housing
67.1 111.1 66% 94.7 -15% 102.9 9%
Ministry of Transportation 27.3 59.1 116% 39.9 -32% 44.9 13%
Ministry of Energy and Mineral Resources 9.3 8.1 -13% 3.7 -54% 3.8 3%
Others 45.7 18.5 -60% 12.9 -30% 9.4 -27%
Non-Ministries 3.0 6.8 127% 5.9 -13% 2.7 -54%
Viability Gap Funding for projects 0.2 1.2 500% 1.1 -8% 0.5 -55%
Grants 2.8 4.5 61% 4.6 2% 2.2 -52%
Others - 1.1 110% 0.2 -82% - -100%
Regional and Local Funds 14.9 41.0 175% 88.0 115% 133.7 52%
Specific Allocation Funds (Dana Alokasi Khusus/DAK) 12.4 29.7 140% 66.3 123% 33.8 -49%
Projected General Allocation Funds (Dana Alokasi Umum/DAU) for Infrastructure
- - - - - 72.5 -
Others 2.5 11.3 352% 21.7 92% 24.0 360%
Financing 6.0 35.7 495% 62.1 74% 39.5 -36%
Financing Liquidity Facility for Housing/Government Investment in Infrastructure
3.0 5.1 70% 9.2 80% 9.7 5%
Government Capital Injection to SOEs 3.0 28.8 860% 36.2 26% 7.2 -80%
Others - 1.8 180% 16.7 828% 22.6 35%
Others 4.6 10.0 117% 9.9 -1% 9.7 -2%
Total 177.9 290.3 63% 317.1 9% 346.6 9%
Realised Spending 139.0 209.0 51%
Realisation Rate 78% 72%
Notes: APBN-P = Anggaran Pendapatan dan Belanja Negara – Perubahan (Revised State Budget) RAPBN = Rencana Anggaran Pendapatan dan Belanja Negara (Draft Budget presented to the Parliament)
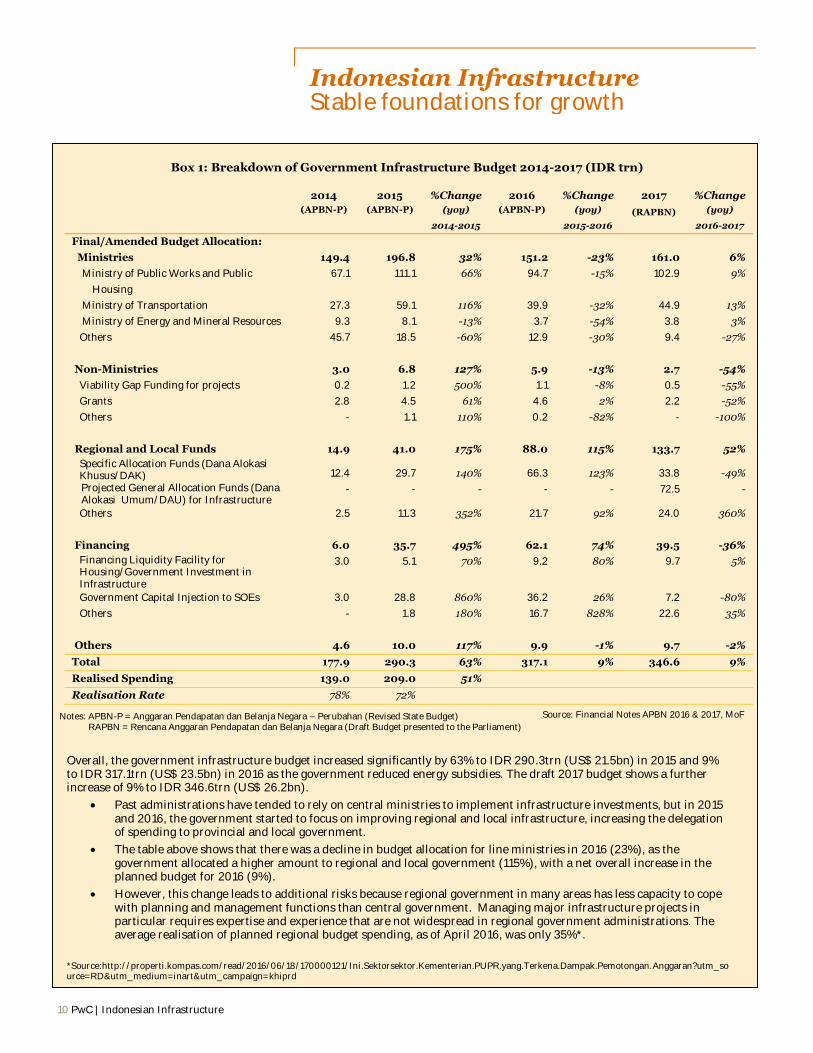
Box 1: Breakdown of Government Infrastructure Budget 2014-2017 (IDR trn)
Overall, the government infrastructure budget increased significantly by 63% to IDR 290.3trn (US$ 21.5bn) in 2015 and 9% to IDR 317.1trn (US$ 23.5bn) in 2016 as the government reduced energy subsidies. The draft 2017 budget shows a further increase of 9% to IDR 346.6trn (US$ 26.2bn).
Past administrations have tended to rely on central ministries to implement infrastructure investments, but in 2015 and 2016, the government started to focus on improving regional and local infrastructure, increasing the delegation of spending to provincial and local government.
The table above shows that there was a decline in budget allocation for line ministries in 2016 (23%), as the government allocated a higher amount to regional and local government (115%), with a net overall increase in the planned budget for 2016 (9%).
However, this change leads to additional risks because regional government in many areas has less capacity to cope with planning and management functions than central government. Managing major infrastructure projects in particular requires expertise and experience that are not widespread in regional government administrations. The average realisation of planned regional budget spending, as of April 2016, was only 35%*.
*Source:http://properti.kompas.com/read/2016/06/18/170000121/Ini.Sektorsektor.Kementerian.PUPR.yang.Terkena.Dampak.Pemotongan.Anggaran?utm_source=RD&utm_medium=inart&utm_campaign=khiprd
Source: Financial Notes APBN 2016 & 2017, MoF
PwC | Indonesian Infrastructure 11
Indonesian Infrastructure Stable foundations for growth
5. Infrastructure policy
Infrastructure continues to be a top priority for the Jokowi administration, as reflected in the spending increases described in Section 2.
In 2015, the government set aggressive targets, announced new funding commitments and displayed an openness to the leverage of private sector finance.
The funds were allocated across a range of infrastructure2sectors including oil and gas, power, water supply and waste treatment, irrigation, housing, road and urban transport, rail, ports and airports.
In 2015 and 2016, many SOEs received government equity injections totaling approximately IDR 95.40trn (US$ 7.2bn)26 especially focused on funding infrastructure projects. However, the government has acknowledged that this is not a sustainable long term approach to infrastructure funding.
The government acknowledges potential funding challenges. BKPM has stated that around half the planned expenditure is not likely to be funded from known public, SOE or private sources and so will require additional private investment. The Committee for Acceleration of Priority Infrastructure Delivery (KPPIP) has also highlighted gaps in SOE and other planned funding sources in the overall targets.
Indeed, the government has sought to fill the funding gap and speed up delivery through a series of government-to-government deals, which it sees as complementary to the Medium-Term Development Plan, including:
A US$ 20bn Memorandum of Understanding with the China Development Bank (CDB), signed in June 2015, to finance infrastructure, which is planned to be channeled through SOEs27; CDB is also expected to provide finance for the
26See the completed government injection list in Appendix 1. 27http://www.thejakartapost.com/news/2015/06/18/state-
firms-get-20b-loan-commitment-china-bank.html. 28http://www.worldbank.org/en/news/press-
release/2015/05/20/world-bank-group-president-pledges-up-to-usd-11-billion-in-support-to-indonesia
planned Jakarta-Bandung High Speed Rail Line;
A loan offer of up to US$ 11bn from the World Bank28;
Heads of Agreement to develop the Cilacap Refinery, signed between PT. Pertamina and Saudi Aramco, the state-owned company of Saudi Arabia29;
GBP 1bn in unspecified UK Export Finance facilities;
An agreement with Russia to develop the Tuban Oil Refinery and a passenger railway in Kalimantan30;
An agreement with Japan to develop a new port at Patimban, Java (after the previous plan at Cilamaya was cancelled)31;
A US$ 216.5mn loan co-financed by Asia Infrastructure Investment Bank (AIIB) and the World Bank for slum upgrading32;
A US$ 500mn loan from the Asian Development Bank (ADB) to continue investment reforms33.
However, some of these deals are politically rather than commercially driven, focusing on debt rather than more difficult equity, lacking in detail on implementation, and sometimes conflicting with government procurement rules, which means that project owners have difficulty accessing the funding or the conditions attached make it unattractive. The consequence is that the funds are slow to be dispersed and often not fully utilised.
In addition, several public finance institutions have been set up, such as the Indonesia Infrastructure Guarantee Fund (IIGF), PT. Sarana Multi Infrastruktur (SMI) and PT. Indonesia Infrastructure Finance (IIF). In 2015, the government announced that SMI would become the
29http://www.saudiaramco.com/en/home/news-media/news/Pertamina-project.html
30http://www.thejakartapost.com/news/2016/05/21/indonesia-russia-business-ties-hit-new-high.html
31http://www.thejakartapost.com/news/2016/06/14/govt-ups-commitment-new-patimban-deep-sea-port.html
32http://euweb.aiib.org/html/2016/NEWS_0624/120.html
government’s infrastructure bank and it has started to transform into this role, offering debt and equity to infrastructure projects.
Support to infrastructure projects may also come from Indonesia's Social Security Fund (BPJS Ketenagakerjaan), which is planning to increase its asset allocation to SOE-led infrastructure34. While the new portfolio allocation to infrastructure is not disclosed, this could be a substantial amount in absolute terms considering BPJS Ketenagakerjaan has the largest pool of funds in Indonesia35.
More broadly, we believe that the availability of finance is not the key constraint on the infrastructure programme; domestic and international funding is available for well-conceived and well-structured projects. Domestic bank funding is dominated by short tenors (five to eight years) whether in Rupiah or US$; whilst international funding in US$ brings longer tenors; approximately 15-20 years. Domestic US$ funding also carries a higher cost than international, due to domestic banks’ capital constraints. In certain sectors, however, for example in toll roads, domestic financiers can provide longer tenors in IDR up to 15 years.
Regulatory and policy reforms have gradually been put in place to create a more conducive environment for private sector participation, including:
PPP directives: Presidential Regulation No.67/2005 has been superseded by Presidential Regulation No.38/2015 to stimulate investment in PPP projects by expanding eligible sectors and offering a more favorable legal framework.
33http://www.adb.org/news/adb-500-million-loan-indonesia-continue-investment-reforms
34http://jakartaglobe.beritasatu.com/business/bpjs-ketenagakerjaan-boost-investment-infrastructure-projects/ 35Ibid.

12 PwC | Indonesian Infrastructure
Indonesian Infrastructure Stable foundations for growth
Land Acquisition Law: Law No.2/2012 and Presidential Regulation No.71/2012 regarding Land Acquisition for Public Interest, effective as of 2015, now limits the land acquisition procedure to 583 days and allows for revocation of land rights in the public interest. This is crucial as many projects (such as the Central Java Power Plant) were previously held up by extended land acquisition disputes.
BKPM One-Stop Service: BKPM, the Investment Coordinating Board, now provides a centralised licensing point for certain sectors, which should increase the efficiency of the investment approval process.
Availability payment-based PPPs: The government has issued MoF decree PMK no. 190/ PMK. 08/ 2015 regarding availability payment contracts (also known as Performance Based Annuity Schemes or PBAS); which should serve as the basis for the government in providing fiscal support to enhance infrastructure projects’ attractiveness. The first availability-based contracts were signed in March 2016, for the Palapa Ring Broadband projects for Western and Central Indonesia. Whilst the Eastern region contract has just been signed in September 2016. It is also planned to use this mechanism for toll road deals.
Strategic Projects and Priority Projects: The government has identified projects which have strategic value to Indonesia’s economy. There are 225 projects and one programme classified as Strategic Projects (under Presidential Regulation No. 3/ 2016). Thirty of these projects are identified as Priority Projects. For both Strategic and Priority Projects, KPPIP has a central role in monitoring, coordinating and speeding up the deliveries of those projects, sometimes commissioning or amending the feasibility studies to prepare them for the market.
Establishment of PPP unit in the MoF: The MoF has established a PPP unit which will be responsible for conducting project development for
PPP projects. In conducting this project development, the PPP unit can procure advisors directly or can assign other government agencies, e.g. SMI.
Establishment of LMAN: The government has established an agency to manage the state assets, include land acquisition. It is expected that LMAN will expedite the financing process for land, in particular, which ultimately will speed up the overall land acquisition process. LMAN has a flexible budgeting system which allows them to use the budget any time, without any obligation to return the unused budget to the MoF. However, as they have just been established, they have not been provided with a sufficient budget to procure land. Hence, in some of the recent tenders (e.g. in toll roads), the government asked the private sector to provide bridging finance for the land acquisition.
6. Challenges and the keys to success
There are many issues hindering projects in the pipeline right now, as well as bottlenecks in public and PPP procurement. Notably, almost all of the projects listed as ‘Ready for Tender’ in the 2015 Book of PPP Projects have stalled for one reason or another. As discussed in the following sections, bottlenecks are often sector-specific. Crucially, many individual projects are
not designed, documented and structured in line with international best practices, but KPPIP is gradually addressing this for the Strategic/Priority Projects.
There are some key challenges for private sector investors in Indonesia:
The pipeline of projects is not yet fully transparent.
The legal/regulatory framework for projects is sometimes uncertain.
The judicial system cannot be fully relied upon to enforce contracts impartially and objectively.
Procurement processes are improving but still are not always clear and transparent.
Government policy and strategy are often unclear or subject to change at short notice.
Different public organisations may be uncoordinated and have conflicting goals.
Many officials are risk-averse and not incentivised to deliver investment.
Public agencies do not have budgets for high quality project preparation by international consultants.
There is a high regulatory burden on new and existing businesses with a need for a large number of permits to operate or construct projects.
There are several economy-wide critical success factors:
Stable investment climate: This important success factor has been undermined by last year’s constitutional court ruling rejecting private sector participation in water projects as well as the lower court ruling questioning the rights of offshore corporate bondholders to vote on restructurings. Even though the former was specific to water, and the government has implemented a solution (see Section 7 (Water)),
PwC | Indonesian Infrastructure 13
Indonesian Infrastructure Stable foundations for growth
investors will naturally wonder whether similar rulings could affect other sectors.
Leadership: Strong political will is a critical factor in driving forward bottlenecked projects. Jokowi’s reputation to ‘get his hands dirty’ and drive on-the-ground performance was initially encouraging. He faced significant opposition in his first year, but this has now eased since he gained majority support in Parliament and reshuffled the cabinet. He has been applying pressure to ministers and officials to get projects delivered, and whilst this may affect the quality of the projects (because construction sometimes starts without full consideration of the optimum specification), it has sent an important message about the urgency of the infrastructure programme generally. However, there is an urgent need to improve the quality of leadership and decision-making at the lower levels to reduce the unsustainable dependence on the top-down approach. There have been some good individual appointments but a more systematic approach is needed.
Change in SOEs’ attitude to partnering with the private sector: Many SOEs and ministries continue to see PPPs as a last resort, preferring to use them for non-financially feasible projects which may well not be attractive to investors. Yet with so many projects having been “assigned” to SOEs, they are likely to experience shortages of funds and capability, leading to project delays and low-quality delivery. MSOE sees itself as a corporate conglomerate and we therefore suggest that it should be optimising the implementation and financing of its total project portfolio, including identifying more projects that could be tendered on a “B2B” basis before these problems materialise.
36Jakarta Post ‘Road delays Kuala Namu International Airport
Opening’, March 2013. 37This excludes investment in mineral smelting, which is
included in metal manufacturing investment (US$ 44bn).
Phasing investment: Given the procurement bottlenecks and uncertainty over future fiscal resources, staggering or phasing some investment will help minimize wastage of public funds. This is the case with the Jakarta Light Rail Transit (LRT), where the decision to press ahead with a very short stretch in time for the Asian Games in 2018 will allow time to optimize the remainder of the network.
Government coordination: There continues to be a lack of coordination between the central, provincial, and regional governments; for example, the opening of Kuala Namu International Airport in Medan, North Sumatra was postponed in 2013 due to delays in the construction of the 14 km road linking Medan to the airport36. A strong, centralised strategy for infrastructure and PPPs with clearly defined roles for different levels of government, would help. This means that KPPIP needs to become more strategic, as it is not sustainable for it to continue to be directly responsible for “de-bottlenecking” the many projects that the country needs (despite the fact that it seems to be effective at this task).
Capacity building in project preparation and procurement: Indonesia would benefit from faster and more transparent procurement as well as better project preparation at the feasibility study stage. KPPIP has an important role to play in facilitating capacity building for government officials, especially at the regional government level.
Land acquisition: Land acquisition has historically delayed many projects. The new land acquisition law appears to be working (e.g. it was used to complete land acquisition for the Central Java Power Plant) but the lack of sufficient budget for LMAN and the lack of clear, consolidated, nationwide land tenure data recognised by the national and
38http://www.pwc.com/id/en/pwc-publications/industry-publications/energy--utilities---mining-publications/mine-2016--slower--lower--weaker----but-not-defeated.html
39http://www.imf.org/external/np/res/commod/pdf/monthly/091516.pdf
subnational government agencies as well as the courts will remain an ongoing challenge which needs to be addressed by rapid implementation of the government’s “Single Map” initiative.
7. Trends and outlook by sector
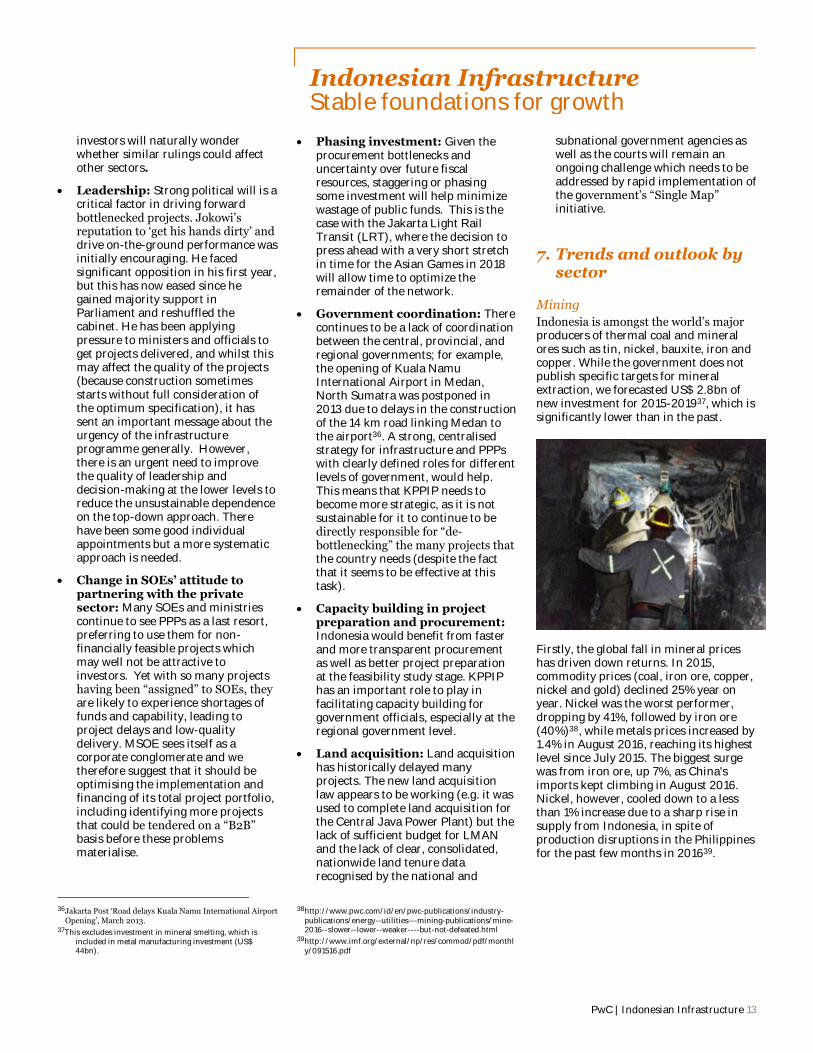
Mining
Indonesia is amongst the world’s major producers of thermal coal and mineral ores such as tin, nickel, bauxite, iron and copper. While the government does not publish specific targets for mineral extraction, we forecasted US$ 2.8bn of new investment for 2015-201937, which is significantly lower than in the past.
Firstly, the global fall in mineral prices has driven down returns. In 2015, commodity prices (coal, iron ore, copper, nickel and gold) declined 25% year on year. Nickel was the worst performer, dropping by 41%, followed by iron ore (40%)38, while metals prices increased by 1.4% in August 2016, reaching its highest level since July 2015. The biggest surge was from iron ore, up 7%, as China's imports kept climbing in August 2016. Nickel, however, cooled down to a less than 1% increase due to a sharp rise in supply from Indonesia, in spite of production disruptions in the Philippines for the past few months in 201639.
14 PwC | Indonesian Infrastructure
Indonesian Infrastructure Stable foundations for growth
Secondly, in January 2014, a ban on the export of unprocessed mineral ores came into force as part of the implementation of mineral value-add requirements contained in the 2009 Mining Law. A three-year reprieve was granted for certain semi-processed ores (in particular, copper concentrates) subject to stiff export duties and commitments by exporters to build refining facilities.
This was a negative development for a sector that provides an enormous export and GDP contribution as well as hundreds of thousands of jobs. Once agreed though, major players generally appeared to take their commitments seriously and many smelting projects were started. So it was surprising that the government has been openly considering whether it would reverse the ban, thus adding further uncertainty to the investment climate.
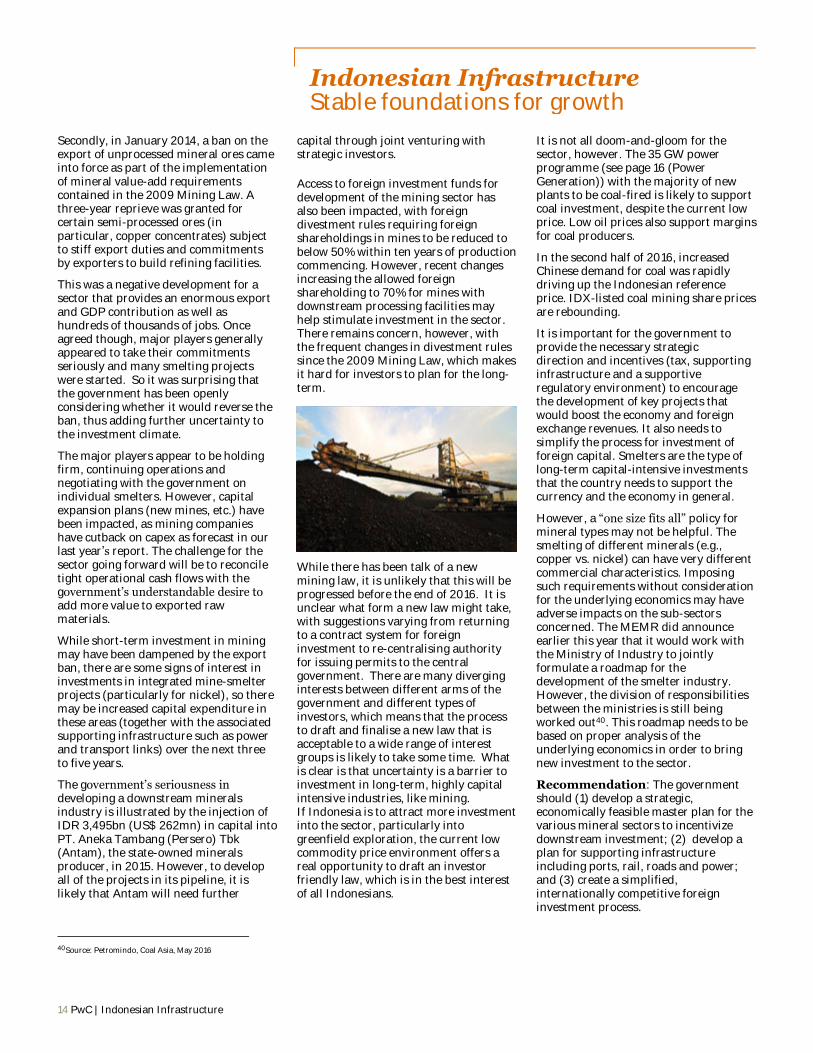
The major players appear to be holding firm, continuing operations and negotiating with the government on individual smelters. However, capital expansion plans (new mines, etc.) have been impacted, as mining companies have cutback on capex as forecast in our last year’s report. The challenge for the sector going forward will be to reconcile tight operational cash flows with the government’s understandable desire to add more value to exported raw materials.
While short-term investment in mining may have been dampened by the export ban, there are some signs of interest in investments in integrated mine-smelter projects (particularly for nickel), so there may be increased capital expenditure in these areas (together with the associated supporting infrastructure such as power and transport links) over the next three to five years.
The government’s seriousness in developing a downstream minerals industry is illustrated by the injection of IDR 3,495bn (US$ 262mn) in capital into PT. Aneka Tambang (Persero) Tbk (Antam), the state-owned minerals producer, in 2015. However, to develop all of the projects in its pipeline, it is likely that Antam will need further
40Source: Petromindo, Coal Asia, May 2016
capital through joint venturing with strategic investors.
Access to foreign investment funds for development of the mining sector has also been impacted, with foreign divestment rules requiring foreign shareholdings in mines to be reduced to below 50% within ten years of production commencing. However, recent changes increasing the allowed foreign shareholding to 70% for mines with downstream processing facilities may help stimulate investment in the sector. There remains concern, however, with the frequent changes in divestment rules since the 2009 Mining Law, which makes it hard for investors to plan for the long-term.
While there has been talk of a new mining law, it is unlikely that this will be progressed before the end of 2016. It is unclear what form a new law might take, with suggestions varying from returning to a contract system for foreign investment to re-centralising authority for issuing permits to the central government. There are many diverging interests between different arms of the government and different types of investors, which means that the process to draft and finalise a new law that is acceptable to a wide range of interest groups is likely to take some time. What is clear is that uncertainty is a barrier to investment in long-term, highly capital intensive industries, like mining. If Indonesia is to attract more investment into the sector, particularly into greenfield exploration, the current low commodity price environment offers a real opportunity to draft an investor friendly law, which is in the best interest of all Indonesians.
It is not all doom-and-gloom for the sector, however. The 35 GW power programme (see page 16 (Power Generation)) with the majority of new plants to be coal-fired is likely to support coal investment, despite the current low price. Low oil prices also support margins for coal producers.
In the second half of 2016, increased Chinese demand for coal was rapidly driving up the Indonesian reference price. IDX-listed coal mining share prices are rebounding.
It is important for the government to provide the necessary strategic direction and incentives (tax, supporting infrastructure and a supportive regulatory environment) to encourage the development of key projects that would boost the economy and foreign exchange revenues. It also needs to simplify the process for investment of foreign capital. Smelters are the type of long-term capital-intensive investments that the country needs to support the currency and the economy in general.
However, a “one size fits all” policy for mineral types may not be helpful. The smelting of different minerals (e.g., copper vs. nickel) can have very different commercial characteristics. Imposing such requirements without consideration for the underlying economics may have adverse impacts on the sub-sectors concerned. The MEMR did announce earlier this year that it would work with the Ministry of Industry to jointly formulate a roadmap for the development of the smelter industry. However, the division of responsibilities between the ministries is still being worked out40. This roadmap needs to be based on proper analysis of the underlying economics in order to bring new investment to the sector.
Recommendation: The government should (1) develop a strategic, economically feasible master plan for the various mineral sectors to incentivize downstream investment; (2) develop a plan for supporting infrastructure including ports, rail, roads and power; and (3) create a simplified, internationally competitive foreign investment process.
PwC | Indonesian Infrastructure 15
Indonesian Infrastructure Stable foundations for growth
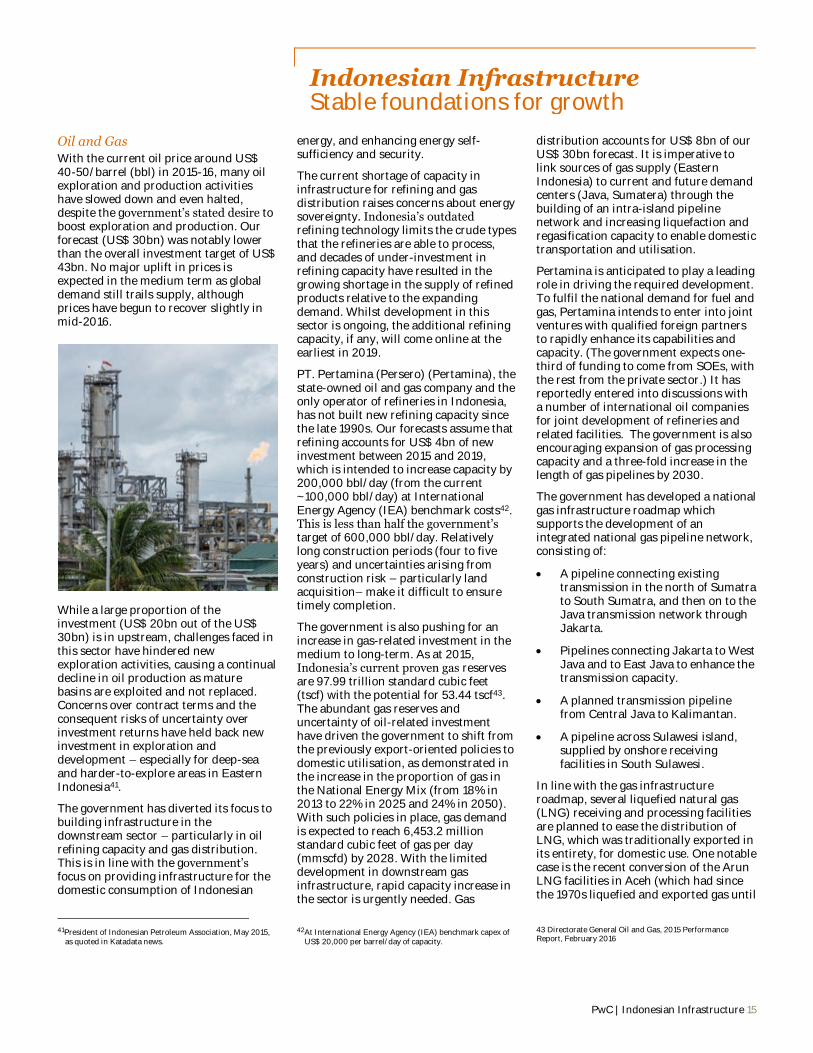
Oil and Gas
With the current oil price around US$ 40-50/barrel (bbl) in 2015-16, many oil exploration and production activities have slowed down and even halted, despite the government’s stated desire to boost exploration and production. Our forecast (US$ 30bn) was notably lower than the overall investment target of US$ 43bn. No major uplift in prices is expected in the medium term as global demand still trails supply, although prices have begun to recover slightly in mid-2016.
While a large proportion of the investment (US$ 20bn out of the US$ 30bn) is in upstream, challenges faced in this sector have hindered new exploration activities, causing a continual decline in oil production as mature basins are exploited and not replaced. Concerns over contract terms and the consequent risks of uncertainty over investment returns have held back new investment in exploration and development – especially for deep-sea and harder-to-explore areas in Eastern Indonesia41.
The government has diverted its focus to building infrastructure in the downstream sector – particularly in oil refining capacity and gas distribution. This is in line with the government’s focus on providing infrastructure for the domestic consumption of Indonesian
41President of Indonesian Petroleum Association, May 2015,
as quoted in Katadata news.
energy, and enhancing energy self-sufficiency and security.
The current shortage of capacity in infrastructure for refining and gas distribution raises concerns about energy sovereignty. Indonesia’s outdated refining technology limits the crude types that the refineries are able to process, and decades of under-investment in refining capacity have resulted in the growing shortage in the supply of refined products relative to the expanding demand. Whilst development in this sector is ongoing, the additional refining capacity, if any, will come online at the earliest in 2019.
PT. Pertamina (Persero) (Pertamina), the state-owned oil and gas company and the only operator of refineries in Indonesia, has not built new refining capacity since the late 1990s. Our forecasts assume that refining accounts for US$ 4bn of new investment between 2015 and 2019, which is intended to increase capacity by 200,000 bbl/day (from the current ~100,000 bbl/day) at International Energy Agency (IEA) benchmark costs42. This is less than half the government’s target of 600,000 bbl/day. Relatively long construction periods (four to five years) and uncertainties arising from construction risk – particularly land acquisition– make it difficult to ensure timely completion.
The government is also pushing for an increase in gas-related investment in the medium to long-term. As at 2015, Indonesia’s current proven gas reserves are 97.99 trillion standard cubic feet (tscf) with the potential for 53.44 tscf43. The abundant gas reserves and uncertainty of oil-related investment have driven the government to shift from the previously export-oriented policies to domestic utilisation, as demonstrated in the increase in the proportion of gas in the National Energy Mix (from 18% in 2013 to 22% in 2025 and 24% in 2050). With such policies in place, gas demand is expected to reach 6,453.2 million standard cubic feet of gas per day (mmscfd) by 2028. With the limited development in downstream gas infrastructure, rapid capacity increase in the sector is urgently needed. Gas
42At International Energy Agency (IEA) benchmark capex of US$ 20,000 per barrel/day of capacity.
distribution accounts for US$ 8bn of our US$ 30bn forecast. It is imperative to link sources of gas supply (Eastern Indonesia) to current and future demand centers (Java, Sumatera) through the building of an intra-island pipeline network and increasing liquefaction and regasification capacity to enable domestic transportation and utilisation.
Pertamina is anticipated to play a leading role in driving the required development. To fulfil the national demand for fuel and gas, Pertamina intends to enter into joint ventures with qualified foreign partners to rapidly enhance its capabilities and capacity. (The government expects one-third of funding to come from SOEs, with the rest from the private sector.) It has reportedly entered into discussions with a number of international oil companies for joint development of refineries and related facilities. The government is also encouraging expansion of gas processing capacity and a three-fold increase in the length of gas pipelines by 2030.
The government has developed a national gas infrastructure roadmap which supports the development of an integrated national gas pipeline network, consisting of:
A pipeline connecting existing transmission in the north of Sumatra to South Sumatra, and then on to the Java transmission network through Jakarta.
Pipelines connecting Jakarta to West Java and to East Java to enhance the transmission capacity.
A planned transmission pipeline from Central Java to Kalimantan.
A pipeline across Sulawesi island, supplied by onshore receiving facilities in South Sulawesi.
In line with the gas infrastructure roadmap, several liquefied natural gas (LNG) receiving and processing facilities are planned to ease the distribution of LNG, which was traditionally exported in its entirety, for domestic use. One notable case is the recent conversion of the Arun LNG facilities in Aceh (which had since the 1970s liquefied and exported gas until
43 Directorate General Oil and Gas, 2015 Performance Report, February 2016
16 PwC | Indonesian Infrastructure
Indonesian Infrastructure Stable foundations for growth
gas reserves were depleted) into a receiving terminal. Future planned expansion includes development of regasification facilities in the Banten/West Java area, closer to Jakarta and dense population centres in West Java, and the cluster development of several mini receiving and regasification facilities to serve other parts of Indonesia.
Recommendation: Foreign investment in downstream infrastructure, e.g. oil refining capacity and gas distribution, needs to be encouraged through improvements to risk allocation.
Utilities
Utilities is expected to grow to a little over a quarter of the infrastructure market by 2019. Power generation and water will be two major areas of focus.
Figure 10 - Utilities infrastructure investment
Source: Oxford Economics
Power generation
Economic and demographic trends, as well as relatively low power consumption per capita, favor strong ongoing growth in the power sector.
Given this situation, the government of Indonesia has set an ambitious target of adding 35 GW of capacity before 2019. Given 8 GW of ongoing projects, PLN, the national state-owned utility, is planning for a total of 43 GW of new
44PLN RUPTL (Annual Business Plan) 2015-2024, and
subsequent presentations by PLN 45http://www.pwc.com/id/en/pwc-publications/industry
publications/energy--utilities---mining-
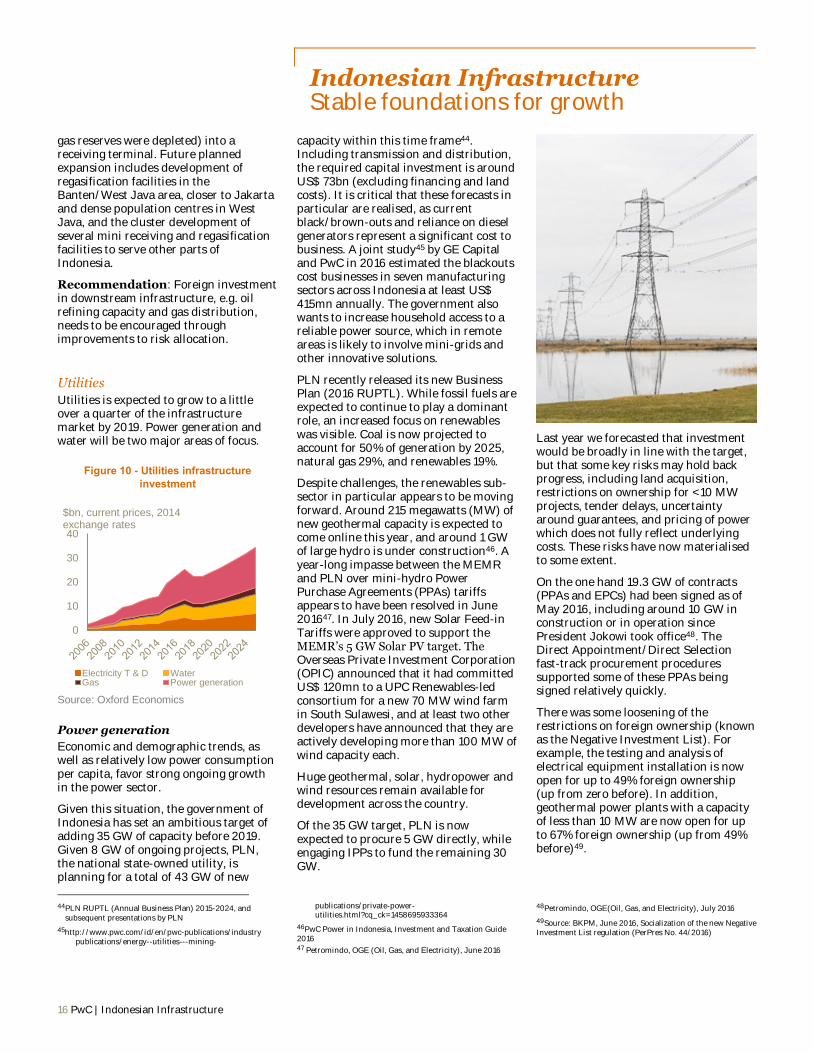
capacity within this time frame44. Including transmission and distribution, the required capital investment is around US$ 73bn (excluding financing and land costs). It is critical that these forecasts in particular are realised, as current black/brown-outs and reliance on diesel generators represent a significant cost to business. A joint study45 by GE Capital and PwC in 2016 estimated the blackouts cost businesses in seven manufacturing sectors across Indonesia at least US$ 415mn annually. The government also wants to increase household access to a reliable power source, which in remote areas is likely to involve mini-grids and other innovative solutions.
PLN recently released its new Business Plan (2016 RUPTL). While fossil fuels are expected to continue to play a dominant role, an increased focus on renewables was visible. Coal is now projected to account for 50% of generation by 2025, natural gas 29%, and renewables 19%.
Despite challenges, the renewables sub-sector in particular appears to be moving forward. Around 215 megawatts (MW) of new geothermal capacity is expected to come online this year, and around 1 GW of large hydro is under construction46. A year-long impasse between the MEMR and PLN over mini-hydro Power Purchase Agreements (PPAs) tariffs appears to have been resolved in June 201647. In July 2016, new Solar Feed-in Tariffs were approved to support the MEMR’s 5 GW Solar PV target. The Overseas Private Investment Corporation (OPIC) announced that it had committed US$ 120mn to a UPC Renewables-led consortium for a new 70 MW wind farm in South Sulawesi, and at least two other developers have announced that they are actively developing more than 100 MW of wind capacity each.
Huge geothermal, solar, hydropower and wind resources remain available for development across the country.
Of the 35 GW target, PLN is now expected to procure 5 GW directly, while engaging IPPs to fund the remaining 30 GW.
publications/private-power-utilities.html?cq_ck=1458695933364
46PwC Power in Indonesia, Investment and Taxation Guide 2016 47 Petromindo, OGE (Oil, Gas, and Electricity), June 2016
Last year we forecasted that investment would be broadly in line with the target, but that some key risks may hold back progress, including land acquisition, restrictions on ownership for <10 MW projects, tender delays, uncertainty around guarantees, and pricing of power which does not fully reflect underlying costs. These risks have now materialised to some extent.
On the one hand 19.3 GW of contracts (PPAs and EPCs) had been signed as of May 2016, including around 10 GW in construction or in operation since President Jokowi took office48. The Direct Appointment/Direct Selection fast-track procurement procedures supported some of these PPAs being signed relatively quickly.
There was some loosening of the restrictions on foreign ownership (known as the Negative Investment List). For example, the testing and analysis of electrical equipment installation is now open for up to 49% foreign ownership (up from zero before). In addition, geothermal power plants with a capacity of less than 10 MW are now open for up to 67% foreign ownership (up from 49% before)49.
48Petromindo, OGE(Oil, Gas, and Electricity), July 2016 49Source: BKPM, June 2016, Socialization of the new Negative Investment List regulation (PerPres No. 44/2016)
0
10
20
30
40
Electricity T & D WaterGas Power generation
$bn, current prices, 2014 exchange rates
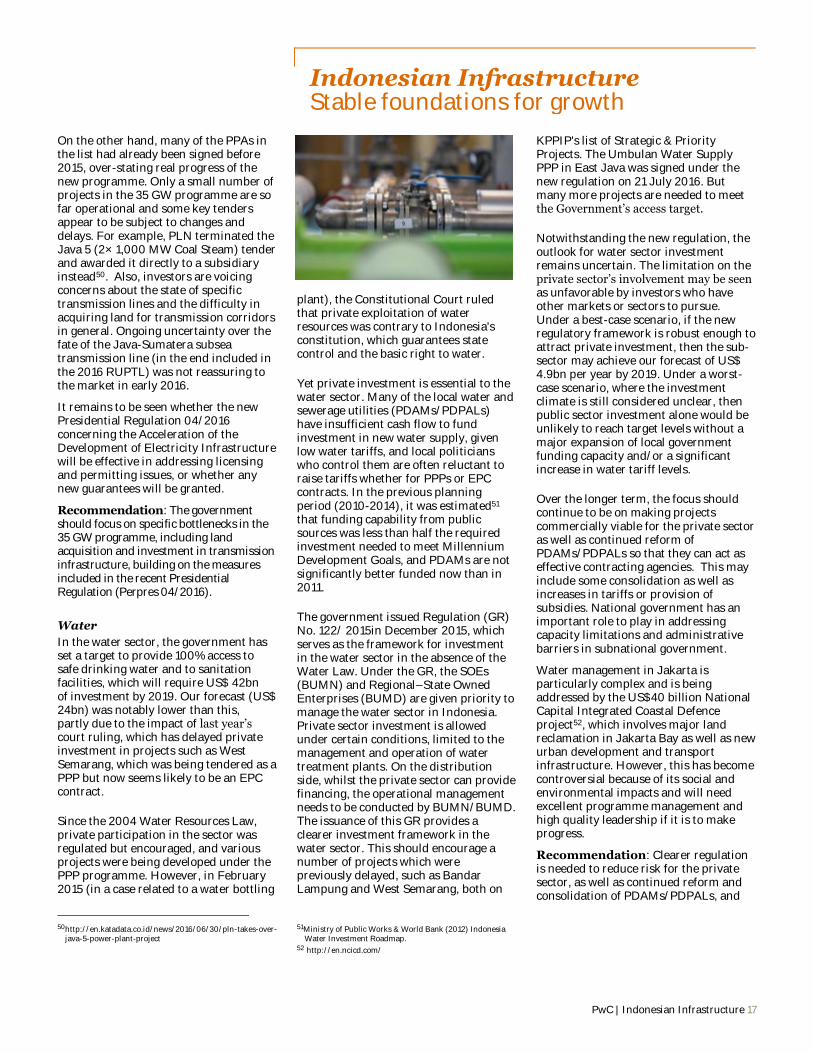
PwC | Indonesian Infrastructure 17
Indonesian Infrastructure Stable foundations for growth
On the other hand, many of the PPAs in the list had already been signed before 2015, over-stating real progress of the new programme. Only a small number of projects in the 35 GW programme are so far operational and some key tenders appear to be subject to changes and delays. For example, PLN terminated the Java 5 (2× 1,000 MW Coal Steam) tender and awarded it directly to a subsidiary instead50. Also, investors are voicing concerns about the state of specific transmission lines and the difficulty in acquiring land for transmission corridors in general. Ongoing uncertainty over the fate of the Java-Sumatera subsea transmission line (in the end included in the 2016 RUPTL) was not reassuring to the market in early 2016.
It remains to be seen whether the new Presidential Regulation 04/2016 concerning the Acceleration of the Development of Electricity Infrastructure will be effective in addressing licensing and permitting issues, or whether any new guarantees will be granted.
Recommendation: The government should focus on specific bottlenecks in the 35 GW programme, including land acquisition and investment in transmission infrastructure, building on the measures included in the recent Presidential Regulation (Perpres 04/2016).
Water
In the water sector, the government has set a target to provide 100% access to safe drinking water and to sanitation facilities, which will require US$ 42bn of investment by 2019. Our forecast (US$ 24bn) was notably lower than this, partly due to the impact of last year’s court ruling, which has delayed private investment in projects such as West Semarang, which was being tendered as a PPP but now seems likely to be an EPC contract.
Since the 2004 Water Resources Law, private participation in the sector was regulated but encouraged, and various projects were being developed under the PPP programme. However, in February 2015 (in a case related to a water bottling
50http://en.katadata.co.id/news/2016/06/30/pln-takes-over-
java-5-power-plant-project
plant), the Constitutional Court ruled that private exploitation of water resources was contrary to Indonesia's constitution, which guarantees state control and the basic right to water.
Yet private investment is essential to the water sector. Many of the local water and sewerage utilities (PDAMs/PDPALs) have insufficient cash flow to fund investment in new water supply, given low water tariffs, and local politicians who control them are often reluctant to raise tariffs whether for PPPs or EPC contracts. In the previous planning period (2010-2014), it was estimated51 that funding capability from public sources was less than half the required investment needed to meet Millennium Development Goals, and PDAMs are not significantly better funded now than in 2011.
The government issued Regulation (GR) No. 122/ 2015in December 2015, which serves as the framework for investment in the water sector in the absence of the Water Law. Under the GR, the SOEs (BUMN) and Regional–State Owned Enterprises (BUMD) are given priority to manage the water sector in Indonesia. Private sector investment is allowed under certain conditions, limited to the management and operation of water treatment plants. On the distribution side, whilst the private sector can provide financing, the operational management needs to be conducted by BUMN/BUMD. The issuance of this GR provides a clearer investment framework in the water sector. This should encourage a number of projects which were previously delayed, such as Bandar Lampung and West Semarang, both on
51Ministry of Public Works & World Bank (2012) Indonesia Water Investment Roadmap.
52 http://en.ncicd.com/
KPPIP's list of Strategic & Priority Projects. The Umbulan Water Supply PPP in East Java was signed under the new regulation on 21 July 2016. But many more projects are needed to meet the Government’s access target.
Notwithstanding the new regulation, the outlook for water sector investment remains uncertain. The limitation on the private sector’s involvement may be seen as unfavorable by investors who have other markets or sectors to pursue. Under a best-case scenario, if the new regulatory framework is robust enough to attract private investment, then the sub-sector may achieve our forecast of US$ 4.9bn per year by 2019. Under a worst-case scenario, where the investment climate is still considered unclear, then public sector investment alone would be unlikely to reach target levels without a major expansion of local government funding capacity and/or a significant increase in water tariff levels.
Over the longer term, the focus should continue to be on making projects commercially viable for the private sector as well as continued reform of PDAMs/PDPALs so that they can act as effective contracting agencies. This may include some consolidation as well as increases in tariffs or provision of subsidies. National government has an important role to play in addressing capacity limitations and administrative barriers in subnational government.
Water management in Jakarta is particularly complex and is being addressed by the US$40 billion National Capital Integrated Coastal Defence project52, which involves major land reclamation in Jakarta Bay as well as new urban development and transport infrastructure. However, this has become controversial because of its social and environmental impacts and will need excellent programme management and high quality leadership if it is to make progress.
Recommendation: Clearer regulation is needed to reduce risk for the private sector, as well as continued reform and consolidation of PDAMs/PDPALs, and
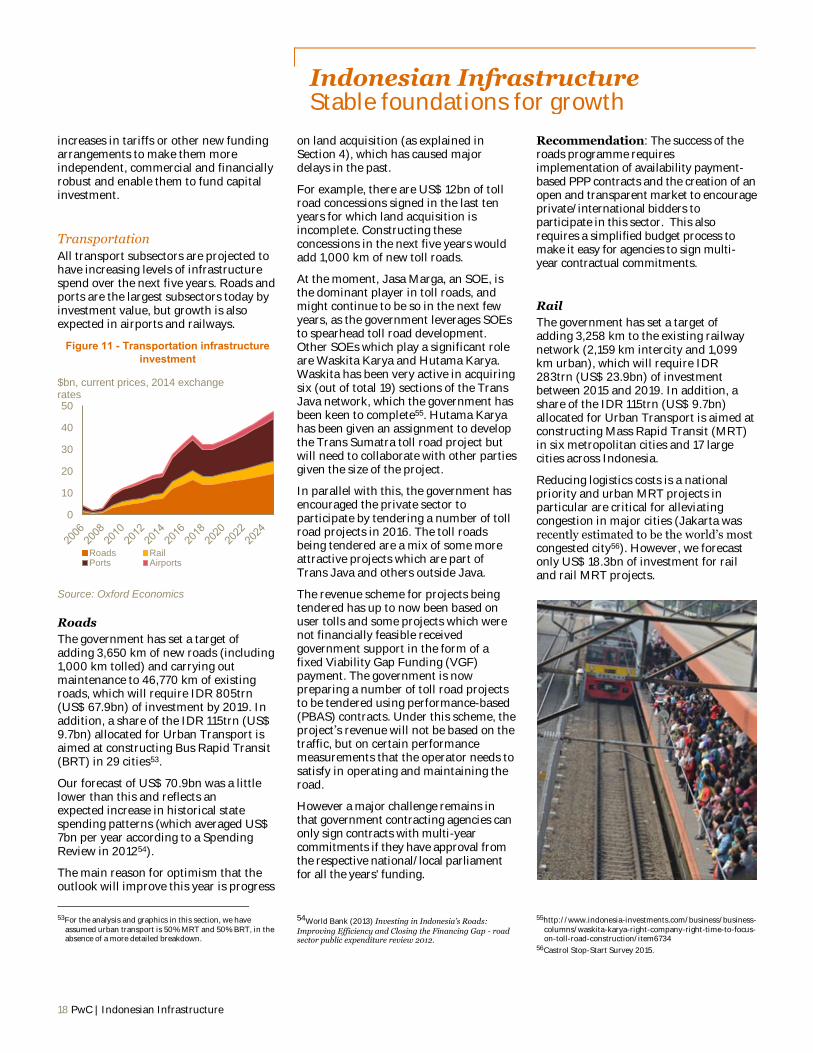
18 PwC | Indonesian Infrastructure
Indonesian Infrastructure Stable foundations for growth
increases in tariffs or other new funding arrangements to make them more independent, commercial and financially robust and enable them to fund capital investment.
Transportation
All transport subsectors are projected to have increasing levels of infrastructure spend over the next five years. Roads and ports are the largest subsectors today by investment value, but growth is also expected in airports and railways.
Figure 11 - Transportation infrastructure investment
Source: Oxford Economics
Roads
The government has set a target of adding 3,650 km of new roads (including 1,000 km tolled) and carrying out maintenance to 46,770 km of existing roads, which will require IDR 805trn (US$ 67.9bn) of investment by 2019. In addition, a share of the IDR 115trn (US$ 9.7bn) allocated for Urban Transport is aimed at constructing Bus Rapid Transit (BRT) in 29 cities53.
Our forecast of US$ 70.9bn was a little lower than this and reflects an expected increase in historical state spending patterns (which averaged US$ 7bn per year according to a Spending Review in 201254).
The main reason for optimism that the outlook will improve this year is progress
53For the analysis and graphics in this section, we have
assumed urban transport is 50% MRT and 50% BRT, in the absence of a more detailed breakdown.
on land acquisition (as explained in Section 4), which has caused major delays in the past.
For example, there are US$ 12bn of toll road concessions signed in the last ten years for which land acquisition is incomplete. Constructing these concessions in the next five years would add 1,000 km of new toll roads.
At the moment, Jasa Marga, an SOE, is the dominant player in toll roads, and might continue to be so in the next few years, as the government leverages SOEs to spearhead toll road development. Other SOEs which play a significant role are Waskita Karya and Hutama Karya. Waskita has been very active in acquiring six (out of total 19) sections of the Trans Java network, which the government has been keen to complete55. Hutama Karya has been given an assignment to develop the Trans Sumatra toll road project but will need to collaborate with other parties given the size of the project.
In parallel with this, the government has encouraged the private sector to participate by tendering a number of toll road projects in 2016. The toll roads being tendered are a mix of some more attractive projects which are part of Trans Java and others outside Java.
The revenue scheme for projects being tendered has up to now been based on user tolls and some projects which were not financially feasible received government support in the form of a fixed Viability Gap Funding (VGF) payment. The government is now preparing a number of toll road projects to be tendered using performance-based (PBAS) contracts. Under this scheme, the project’s revenue will not be based on the traffic, but on certain performance measurements that the operator needs to satisfy in operating and maintaining the road.
However a major challenge remains in that government contracting agencies can only sign contracts with multi-year commitments if they have approval from the respective national/local parliament for all the years' funding.
54World Bank (2013) Investing in Indonesia’s Roads:
Improving Efficiency and Closing the Financing Gap - road sector public expenditure review 2012.
Recommendation: The success of the roads programme requires implementation of availability payment-based PPP contracts and the creation of an open and transparent market to encourage private/international bidders to participate in this sector. This also requires a simplified budget process to make it easy for agencies to sign multi-year contractual commitments.
Rail
The government has set a target of adding 3,258 km to the existing railway network (2,159 km intercity and 1,099 km urban), which will require IDR 283trn (US$ 23.9bn) of investment between 2015 and 2019. In addition, a share of the IDR 115trn (US$ 9.7bn) allocated for Urban Transport is aimed at constructing Mass Rapid Transit (MRT) in six metropolitan cities and 17 large cities across Indonesia.
Reducing logistics costs is a national priority and urban MRT projects in particular are critical for alleviating congestion in major cities (Jakarta was recently estimated to be the world’s most congested city56). However, we forecast only US$ 18.3bn of investment for rail and rail MRT projects.
55http://www.indonesia-investments.com/business/business-columns/waskita-karya-right-company-right-time-to-focus-on-toll-road-construction/item6734
56Castrol Stop-Start Survey 2015.
0
10
20
30
40
50
Roads RailPorts Airports
$bn, current prices, 2014 exchange rates
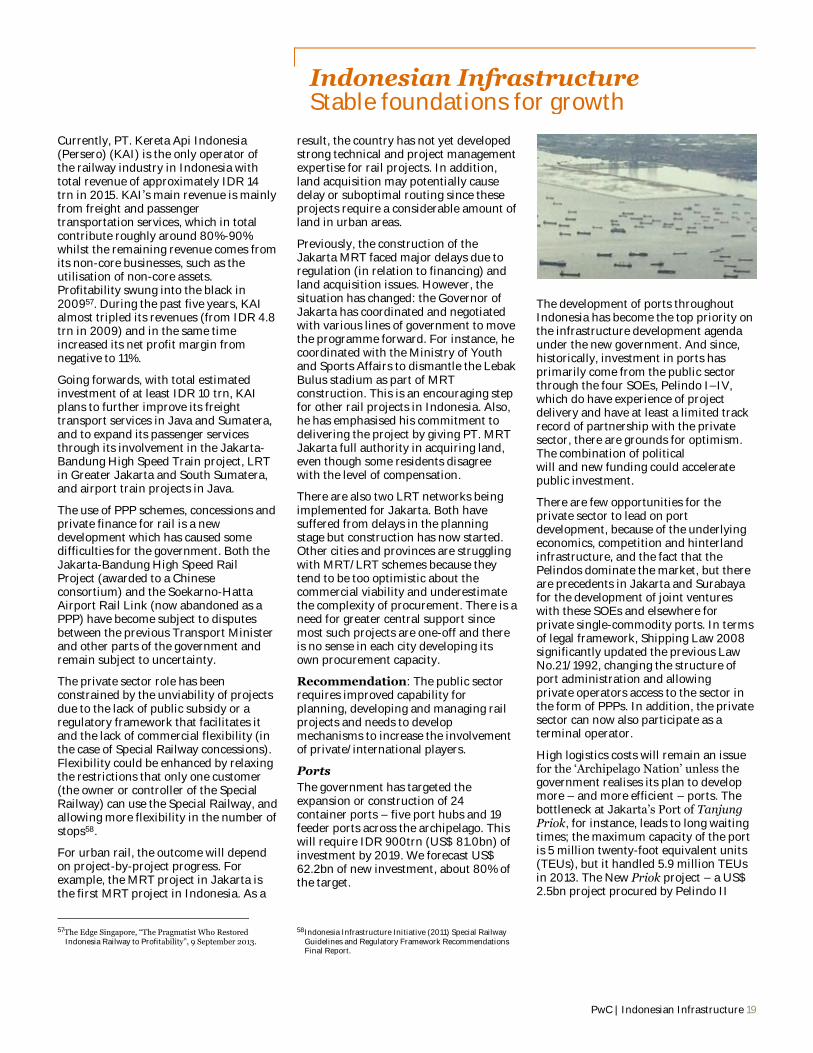
PwC | Indonesian Infrastructure 19
Indonesian Infrastructure Stable foundations for growth
Currently, PT. Kereta Api Indonesia (Persero) (KAI) is the only operator of the railway industry in Indonesia with total revenue of approximately IDR 14 trn in 2015. KAI’s main revenue is mainly from freight and passenger transportation services, which in total contribute roughly around 80%-90% whilst the remaining revenue comes from its non-core businesses, such as the utilisation of non-core assets. Profitability swung into the black in 200957. During the past five years, KAI almost tripled its revenues (from IDR 4.8 trn in 2009) and in the same time increased its net profit margin from negative to 11%.
Going forwards, with total estimated investment of at least IDR 10 trn, KAI plans to further improve its freight transport services in Java and Sumatera, and to expand its passenger services through its involvement in the Jakarta-Bandung High Speed Train project, LRT in Greater Jakarta and South Sumatera, and airport train projects in Java.
The use of PPP schemes, concessions and private finance for rail is a new development which has caused some difficulties for the government. Both the Jakarta-Bandung High Speed Rail Project (awarded to a Chinese consortium) and the Soekarno-Hatta Airport Rail Link (now abandoned as a PPP) have become subject to disputes between the previous Transport Minister and other parts of the government and remain subject to uncertainty.
The private sector role has been constrained by the unviability of projects due to the lack of public subsidy or a regulatory framework that facilitates it and the lack of commercial flexibility (in the case of Special Railway concessions). Flexibility could be enhanced by relaxing the restrictions that only one customer (the owner or controller of the Special Railway) can use the Special Railway, and allowing more flexibility in the number of stops58.
For urban rail, the outcome will depend on project-by-project progress. For example, the MRT project in Jakarta is the first MRT project in Indonesia. As a
57The Edge Singapore, “The Pragmatist Who Restored
Indonesia Railway to Profitability”, 9 September 2013.
result, the country has not yet developed strong technical and project management expertise for rail projects. In addition, land acquisition may potentially cause delay or suboptimal routing since these projects require a considerable amount of land in urban areas.
Previously, the construction of the Jakarta MRT faced major delays due to regulation (in relation to financing) and land acquisition issues. However, the situation has changed: the Governor of Jakarta has coordinated and negotiated with various lines of government to move the programme forward. For instance, he coordinated with the Ministry of Youth and Sports Affairs to dismantle the Lebak Bulus stadium as part of MRT construction. This is an encouraging step for other rail projects in Indonesia. Also, he has emphasised his commitment to delivering the project by giving PT. MRT Jakarta full authority in acquiring land, even though some residents disagree with the level of compensation.
There are also two LRT networks being implemented for Jakarta. Both have suffered from delays in the planning stage but construction has now started. Other cities and provinces are struggling with MRT/LRT schemes because they tend to be too optimistic about the commercial viability and underestimate the complexity of procurement. There is a need for greater central support since most such projects are one-off and there is no sense in each city developing its own procurement capacity.
Recommendation: The public sector requires improved capability for planning, developing and managing rail projects and needs to develop mechanisms to increase the involvement of private/international players.
Ports
The government has targeted the expansion or construction of 24 container ports – five port hubs and 19 feeder ports across the archipelago. This will require IDR 900trn (US$ 81.0bn) of investment by 2019. We forecast US$ 62.2bn of new investment, about 80% of the target.
58Indonesia Infrastructure Initiative (2011) Special Railway Guidelines and Regulatory Framework Recommendations Final Report.
The development of ports throughout Indonesia has become the top priority on the infrastructure development agenda under the new government. And since, historically, investment in ports has primarily come from the public sector through the four SOEs, Pelindo I–IV, which do have experience of project delivery and have at least a limited track record of partnership with the private sector, there are grounds for optimism. The combination of political will and new funding could accelerate public investment.
There are few opportunities for the private sector to lead on port development, because of the underlying economics, competition and hinterland infrastructure, and the fact that the Pelindos dominate the market, but there are precedents in Jakarta and Surabaya for the development of joint ventures with these SOEs and elsewhere for private single-commodity ports. In terms of legal framework, Shipping Law 2008 significantly updated the previous Law No.21/1992, changing the structure of port administration and allowing private operators access to the sector in the form of PPPs. In addition, the private sector can now also participate as a terminal operator.
High logistics costs will remain an issue for the ‘Archipelago Nation’ unless the government realises its plan to develop more – and more efficient – ports. The bottleneck at Jakarta’s Port of Tanjung Priok, for instance, leads to long waiting times; the maximum capacity of the port is 5 million twenty-foot equivalent units (TEUs), but it handled 5.9 million TEUs in 2013. The New Priok project – a US$ 2.5bn project procured by Pelindo II
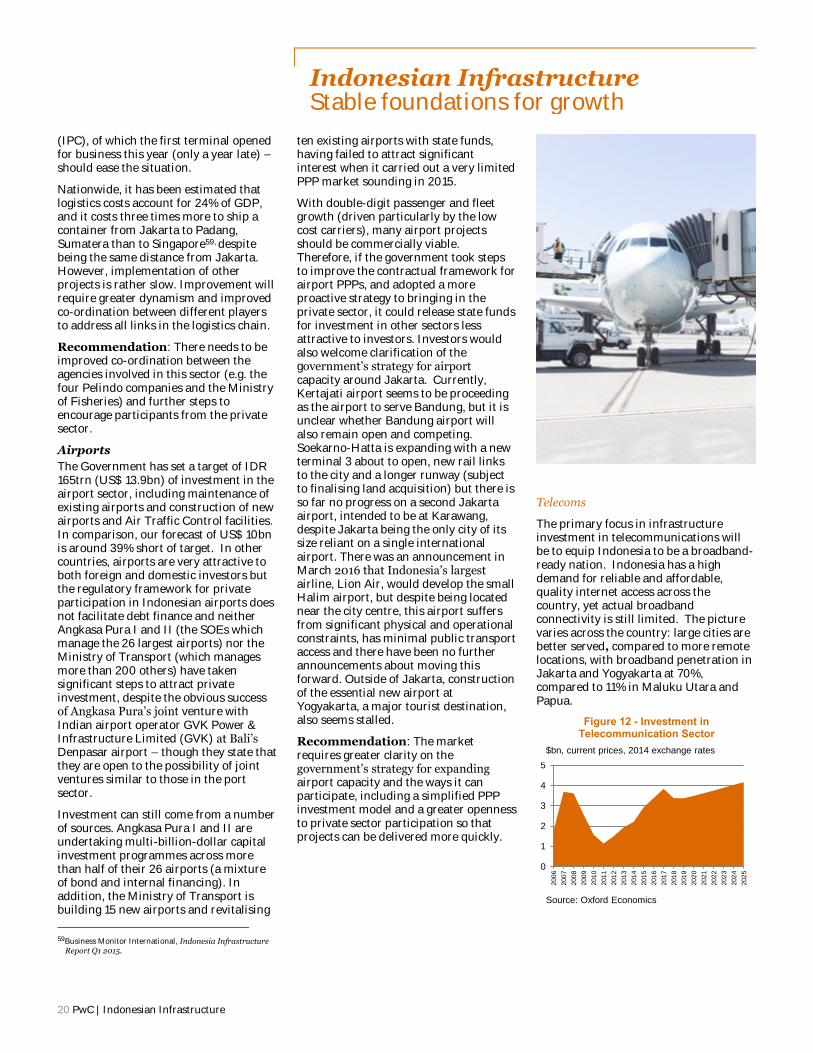
20 PwC | Indonesian Infrastructure
Indonesian Infrastructure Stable foundations for growth
(IPC), of which the first terminal opened for business this year (only a year late) – should ease the situation.
Nationwide, it has been estimated that logistics costs account for 24% of GDP, and it costs three times more to ship a container from Jakarta to Padang, Sumatera than to Singapore59, despite being the same distance from Jakarta. However, implementation of other projects is rather slow. Improvement will require greater dynamism and improved co-ordination between different players to address all links in the logistics chain.
Recommendation: There needs to be improved co-ordination between the agencies involved in this sector (e.g. the four Pelindo companies and the Ministry of Fisheries) and further steps to encourage participants from the private sector.
Airports
The Government has set a target of IDR 165trn (US$ 13.9bn) of investment in the airport sector, including maintenance of existing airports and construction of new airports and Air Traffic Control facilities. In comparison, our forecast of US$ 10bn is around 39% short of target. In other countries, airports are very attractive to both foreign and domestic investors but the regulatory framework for private participation in Indonesian airports does not facilitate debt finance and neither Angkasa Pura I and II (the SOEs which manage the 26 largest airports) nor the Ministry of Transport (which manages more than 200 others) have taken significant steps to attract private investment, despite the obvious success of Angkasa Pura’s joint venture with Indian airport operator GVK Power & Infrastructure Limited (GVK) at Bali’s Denpasar airport – though they state that they are open to the possibility of joint ventures similar to those in the port sector.
Investment can still come from a number of sources. Angkasa Pura I and II are undertaking multi-billion-dollar capital investment programmes across more than half of their 26 airports (a mixture of bond and internal financing). In addition, the Ministry of Transport is building 15 new airports and revitalising
59Business Monitor International, Indonesia Infrastructure
Report Q1 2015.
ten existing airports with state funds, having failed to attract significant interest when it carried out a very limited PPP market sounding in 2015.
With double-digit passenger and fleet growth (driven particularly by the low cost carriers), many airport projects should be commercially viable. Therefore, if the government took steps to improve the contractual framework for airport PPPs, and adopted a more proactive strategy to bringing in the private sector, it could release state funds for investment in other sectors less attractive to investors. Investors would also welcome clarification of the government’s strategy for airport capacity around Jakarta. Currently, Kertajati airport seems to be proceeding as the airport to serve Bandung, but it is unclear whether Bandung airport will also remain open and competing. Soekarno-Hatta is expanding with a new terminal 3 about to open, new rail links to the city and a longer runway (subject to finalising land acquisition) but there is so far no progress on a second Jakarta airport, intended to be at Karawang, despite Jakarta being the only city of its size reliant on a single international airport. There was an announcement in March 2016 that Indonesia’s largest airline, Lion Air, would develop the small Halim airport, but despite being located near the city centre, this airport suffers from significant physical and operational constraints, has minimal public transport access and there have been no further announcements about moving this forward. Outside of Jakarta, construction of the essential new airport at Yogyakarta, a major tourist destination, also seems stalled.
Recommendation: The market requires greater clarity on the government’s strategy for expanding airport capacity and the ways it can participate, including a simplified PPP investment model and a greater openness to private sector participation so that projects can be delivered more quickly.
Telecoms
The primary focus in infrastructure investment in telecommunications will be to equip Indonesia to be a broadband-ready nation. Indonesia has a high demand for reliable and affordable, quality internet access across the country, yet actual broadband connectivity is still limited. The picture varies across the country: large cities are better served, compared to more remote locations, with broadband penetration in Jakarta and Yogyakarta at 70%, compared to 11% in Maluku Utara and Papua.
Figure 12 - Investment in Telecommunication Sector
0
1
2
3
4
5
200
6
200
7
200
8
200
9
201
0
201
1
201
2
201
3
201
4
201
5
201
6
201
7
201
8
201
9
202
0
202
1
202
2
202
3
202
4
202
5
Source: Oxford Economics
$bn, current prices, 2014 exchange rates
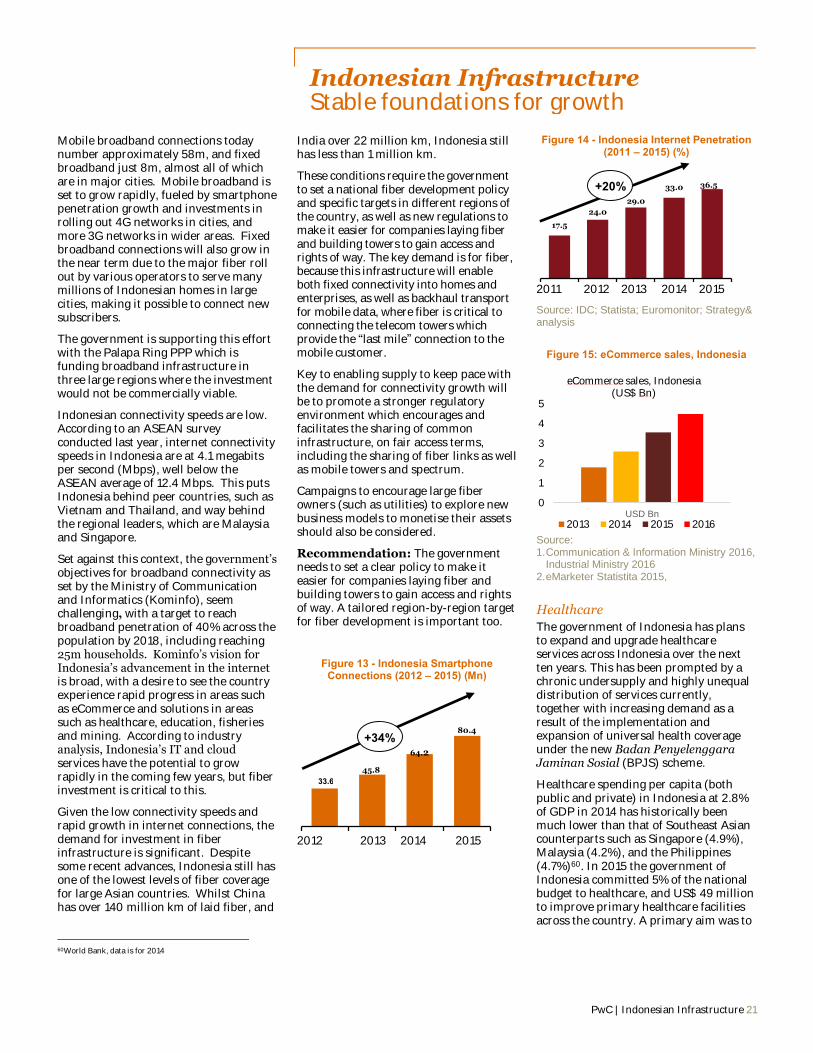
PwC | Indonesian Infrastructure 21
Indonesian Infrastructure Stable foundations for growth
Mobile broadband connections today number approximately 58m, and fixed broadband just 8m, almost all of which are in major cities. Mobile broadband is set to grow rapidly, fueled by smartphone penetration growth and investments in rolling out 4G networks in cities, and more 3G networks in wider areas. Fixed broadband connections will also grow in the near term due to the major fiber roll out by various operators to serve many millions of Indonesian homes in large cities, making it possible to connect new subscribers.
The government is supporting this effort with the Palapa Ring PPP which is funding broadband infrastructure in three large regions where the investment would not be commercially viable.
Indonesian connectivity speeds are low. According to an ASEAN survey conducted last year, internet connectivity speeds in Indonesia are at 4.1 megabits per second (Mbps), well below the ASEAN average of 12.4 Mbps. This puts Indonesia behind peer countries, such as Vietnam and Thailand, and way behind the regional leaders, which are Malaysia and Singapore.
Set against this context, the government’s objectives for broadband connectivity as set by the Ministry of Communication and Informatics (Kominfo), seem challenging, with a target to reach broadband penetration of 40% across the population by 2018, including reaching 25m households. Kominfo’s vision for Indonesia’s advancement in the internet is broad, with a desire to see the country experience rapid progress in areas such as eCommerce and solutions in areas such as healthcare, education, fisheries and mining. According to industry analysis, Indonesia’s IT and cloud services have the potential to grow rapidly in the coming few years, but fiber investment is critical to this.
Given the low connectivity speeds and rapid growth in internet connections, the demand for investment in fiber infrastructure is significant. Despite some recent advances, Indonesia still has one of the lowest levels of fiber coverage for large Asian countries. Whilst China has over 140 million km of laid fiber, and
60World Bank, data is for 2014
India over 22 million km, Indonesia still has less than 1 million km.
These conditions require the government to set a national fiber development policy and specific targets in different regions of the country, as well as new regulations to make it easier for companies laying fiber and building towers to gain access and rights of way. The key demand is for fiber, because this infrastructure will enable both fixed connectivity into homes and enterprises, as well as backhaul transport for mobile data, where fiber is critical to connecting the telecom towers which provide the “last mile” connection to the mobile customer.
Key to enabling supply to keep pace with the demand for connectivity growth will be to promote a stronger regulatory environment which encourages and facilitates the sharing of common infrastructure, on fair access terms, including the sharing of fiber links as well as mobile towers and spectrum.
Campaigns to encourage large fiber owners (such as utilities) to explore new business models to monetise their assets should also be considered.
Recommendation: The government needs to set a clear policy to make it easier for companies laying fiber and building towers to gain access and rights of way. A tailored region-by-region target for fiber development is important too.
Figure 13 - Indonesia Smartphone Connections (2012 – 2015) (Mn)
2012 2013 2014 2015
Figure 14 - Indonesia Internet Penetration (2011 – 2015) (%)
2011 2012 2013 2014 2015
Source: IDC; Statista; Euromonitor; Strategy& analysis
Figure 15: eCommerce sales, Indonesia
Source: 1. Communication & Information Ministry 2016,
Industrial Ministry 2016 2. eMarketer Statistita 2015,
Healthcare
The government of Indonesia has plans to expand and upgrade healthcare services across Indonesia over the next ten years. This has been prompted by a chronic undersupply and highly unequal distribution of services currently, together with increasing demand as a result of the implementation and expansion of universal health coverage under the new Badan Penyelenggara Jaminan Sosial (BPJS) scheme.
Healthcare spending per capita (both public and private) in Indonesia at 2.8% of GDP in 2014 has historically been much lower than that of Southeast Asian counterparts such as Singapore (4.9%), Malaysia (4.2%), and the Philippines (4.7%)60. In 2015 the government of Indonesia committed 5% of the national budget to healthcare, and US$ 49 million to improve primary healthcare facilities across the country. A primary aim was to
17.5
24.0
29.0
33.0 36.5
0
1
2
3
4
5
USD Bn
eCommerce sales, Indonesia (US$ Bn)
2013 2014 2015 2016
+34% 80.4
+20%
33.6
45.8
64.2
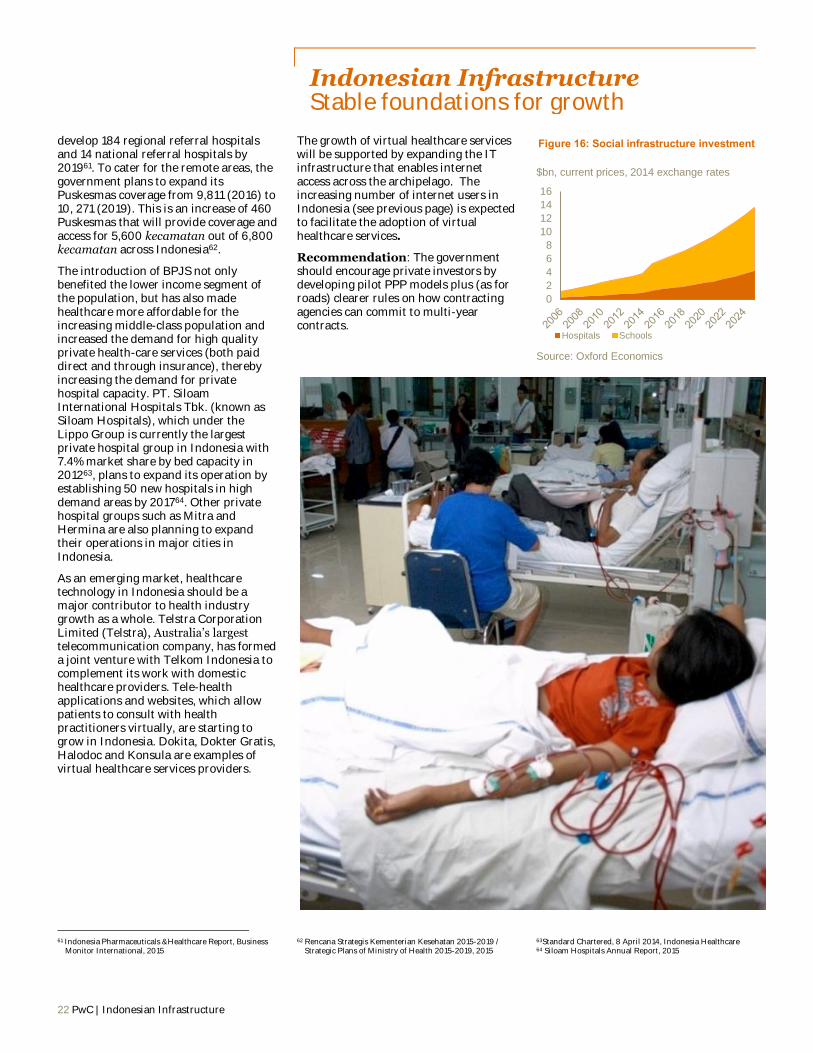
22 PwC | Indonesian Infrastructure
Indonesian Infrastructure Stable foundations for growth
develop 184 regional referral hospitals and 14 national referral hospitals by 201961. To cater for the remote areas, the government plans to expand its Puskesmas coverage from 9,811 (2016) to 10, 271 (2019). This is an increase of 460 Puskesmas that will provide coverage and access for 5,600 kecamatan out of 6,800 kecamatan across Indonesia62.
The introduction of BPJS not only benefited the lower income segment of the population, but has also made healthcare more affordable for the increasing middle-class population and increased the demand for high quality private health-care services (both paid direct and through insurance), thereby increasing the demand for private hospital capacity. PT. Siloam International Hospitals Tbk. (known as Siloam Hospitals), which under the Lippo Group is currently the largest private hospital group in Indonesia with 7.4% market share by bed capacity in 201263, plans to expand its operation by establishing 50 new hospitals in high demand areas by 201764. Other private hospital groups such as Mitra and Hermina are also planning to expand their operations in major cities in Indonesia.
As an emerging market, healthcare technology in Indonesia should be a major contributor to health industry growth as a whole. Telstra Corporation Limited (Telstra), Australia’s largest telecommunication company, has formed a joint venture with Telkom Indonesia to complement its work with domestic healthcare providers. Tele-health applications and websites, which allow patients to consult with health practitioners virtually, are starting to grow in Indonesia. Dokita, Dokter Gratis, Halodoc and Konsula are examples of virtual healthcare services providers.
61 Indonesia Pharmaceuticals &Healthcare Report, Business
Monitor International, 2015
The growth of virtual healthcare services will be supported by expanding the IT infrastructure that enables internet access across the archipelago. The increasing number of internet users in Indonesia (see previous page) is expected to facilitate the adoption of virtual healthcare services.
Recommendation: The government should encourage private investors by developing pilot PPP models plus (as for roads) clearer rules on how contracting agencies can commit to multi-year contracts.
62 Rencana Strategis Kementerian Kesehatan 2015-2019 / Strategic Plans of Ministry of Health 2015-2019, 2015
Figure 16: Social infrastructure investment
Source: Oxford Economics
63Standard Chartered, 8 April 2014, Indonesia Healthcare 64 Siloam Hospitals Annual Report, 2015
0
2
4
6
8
10
12
14
16
Hospitals Schools
$bn, current prices, 2014 exchange rates
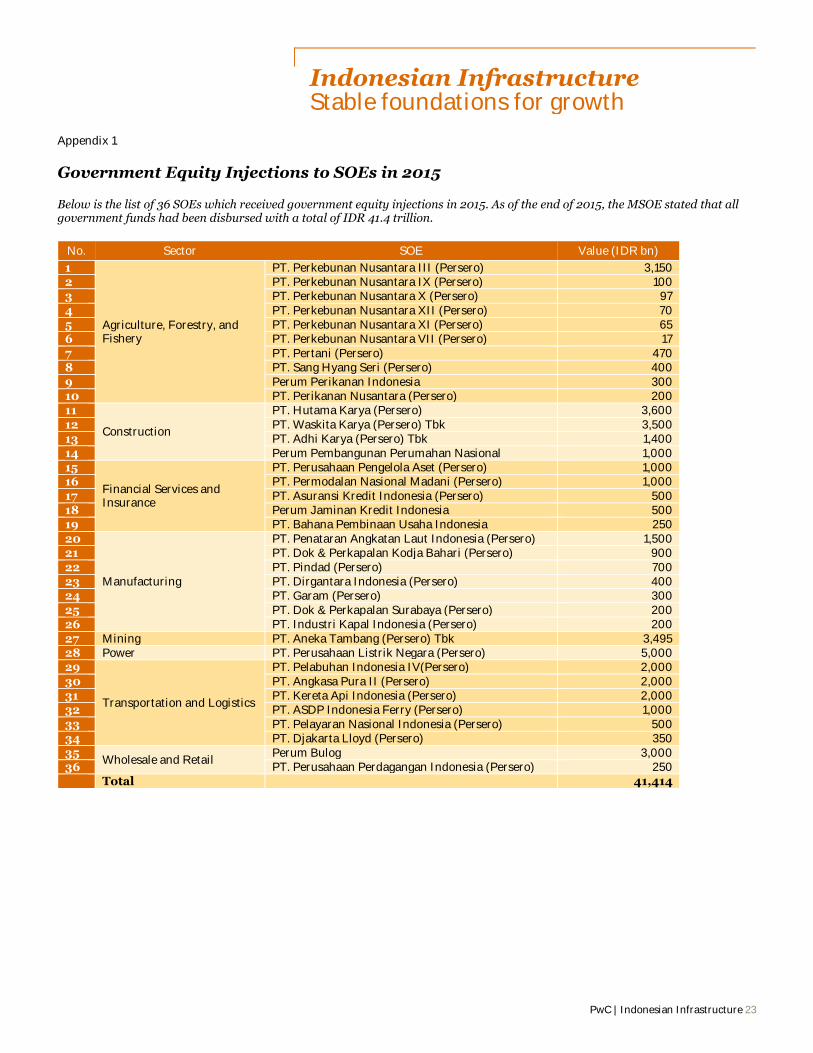
PwC | Indonesian Infrastructure 23
Indonesian Infrastructure Stable foundations for growth
Appendix 1
Government Equity Injections to SOEs in 2015
Below is the list of 36 SOEs which received government equity injections in 2015. As of the end of 2015, the MSOE stated that all government funds had been disbursed with a total of IDR 41.4 trillion.
No. Sector SOE Value (IDR bn)
1
Agriculture, Forestry, and Fishery
PT. Perkebunan Nusantara III (Persero) 3,150 2 PT. Perkebunan Nusantara IX (Persero) 100 3 PT. Perkebunan Nusantara X (Persero) 97 4 PT. Perkebunan Nusantara XII (Persero) 70 5 PT. Perkebunan Nusantara XI (Persero) 65 6 PT. Perkebunan Nusantara VII (Persero) 17 7 PT. Pertani (Persero) 470 8 PT. Sang Hyang Seri (Persero) 400 9 Perum Perikanan Indonesia 300 10 PT. Perikanan Nusantara (Persero) 200 11
Construction
PT. Hutama Karya (Persero) 3,600 12 PT. Waskita Karya (Persero) Tbk 3,500 13 PT. Adhi Karya (Persero) Tbk 1,400 14 Perum Pembangunan Perumahan Nasional 1,000 15
Financial Services and Insurance
PT. Perusahaan Pengelola Aset (Persero) 1,000 16 PT. Permodalan Nasional Madani (Persero) 1,000 17 PT. Asuransi Kredit Indonesia (Persero) 500 18 Perum Jaminan Kredit Indonesia 500 19 PT. Bahana Pembinaan Usaha Indonesia 250 20
Manufacturing
PT. Penataran Angkatan Laut Indonesia (Persero) 1,500 21 PT. Dok & Perkapalan Kodja Bahari (Persero) 900 22 PT. Pindad (Persero) 700 23 PT. Dirgantara Indonesia (Persero) 400 24 PT. Garam (Persero) 300 25 PT. Dok & Perkapalan Surabaya (Persero) 200 26 PT. Industri Kapal Indonesia (Persero) 200 27 Mining PT. Aneka Tambang (Persero) Tbk 3,495 28 Power PT. Perusahaan Listrik Negara (Persero) 5,000 29
Transportation and Logistics
PT. Pelabuhan Indonesia IV(Persero) 2,000 30 PT. Angkasa Pura II (Persero) 2,000 31 PT. Kereta Api Indonesia (Persero) 2,000 32 PT. ASDP Indonesia Ferry (Persero) 1,000 33 PT. Pelayaran Nasional Indonesia (Persero) 500 34 PT. Djakarta Lloyd (Persero) 350 35
Wholesale and Retail Perum Bulog 3,000
36 PT. Perusahaan Perdagangan Indonesia (Persero) 250 Total 41,414
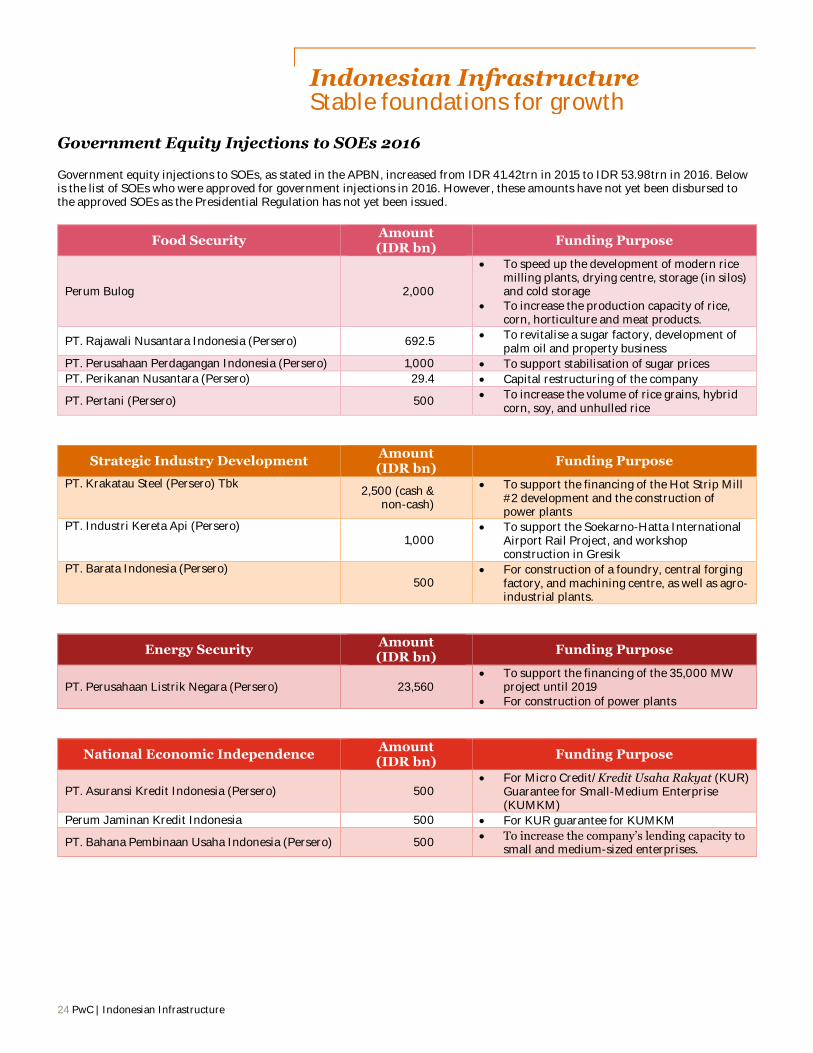
24 PwC | Indonesian Infrastructure
Indonesian Infrastructure Stable foundations for growth
Government Equity Injections to SOEs 2016
Government equity injections to SOEs, as stated in the APBN, increased from IDR 41.42trn in 2015 to IDR 53.98trn in 2016. Below is the list of SOEs who were approved for government injections in 2016. However, these amounts have not yet been disbursed to the approved SOEs as the Presidential Regulation has not yet been issued.
Food Security Amount (IDR bn)
Funding Purpose
Perum Bulog 2,000
To speed up the development of modern rice milling plants, drying centre, storage (in silos) and cold storage
To increase the production capacity of rice, corn, horticulture and meat products.
PT. Rajawali Nusantara Indonesia (Persero) 692.5 To revitalise a sugar factory, development of
palm oil and property business
PT. Perusahaan Perdagangan Indonesia (Persero) 1,000 To support stabilisation of sugar prices
PT. Perikanan Nusantara (Persero) 29.4 Capital restructuring of the company
PT. Pertani (Persero) 500 To increase the volume of rice grains, hybrid
corn, soy, and unhulled rice
Strategic Industry Development Amount (IDR bn)
Funding Purpose
PT. Krakatau Steel (Persero) Tbk 2,500 (cash &
non-cash)
To support the financing of the Hot Strip Mill #2 development and the construction of power plants
PT. Industri Kereta Api (Persero) 1,000
To support the Soekarno-Hatta International Airport Rail Project, and workshop construction in Gresik
PT. Barata Indonesia (Persero) 500
For construction of a foundry, central forging factory, and machining centre, as well as agro-industrial plants.
Energy Security Amount (IDR bn)
Funding Purpose
PT. Perusahaan Listrik Negara (Persero) 23,560 To support the financing of the 35,000 MW
project until 2019 For construction of power plants
National Economic Independence Amount (IDR bn)
Funding Purpose
PT. Asuransi Kredit Indonesia (Persero) 500 For Micro Credit/Kredit Usaha Rakyat (KUR)
Guarantee for Small-Medium Enterprise (KUMKM)
Perum Jaminan Kredit Indonesia 500 For KUR guarantee for KUMKM
PT. Bahana Pembinaan Usaha Indonesia (Persero) 500 To increase the company’s lending capacity to
small and medium-sized enterprises.
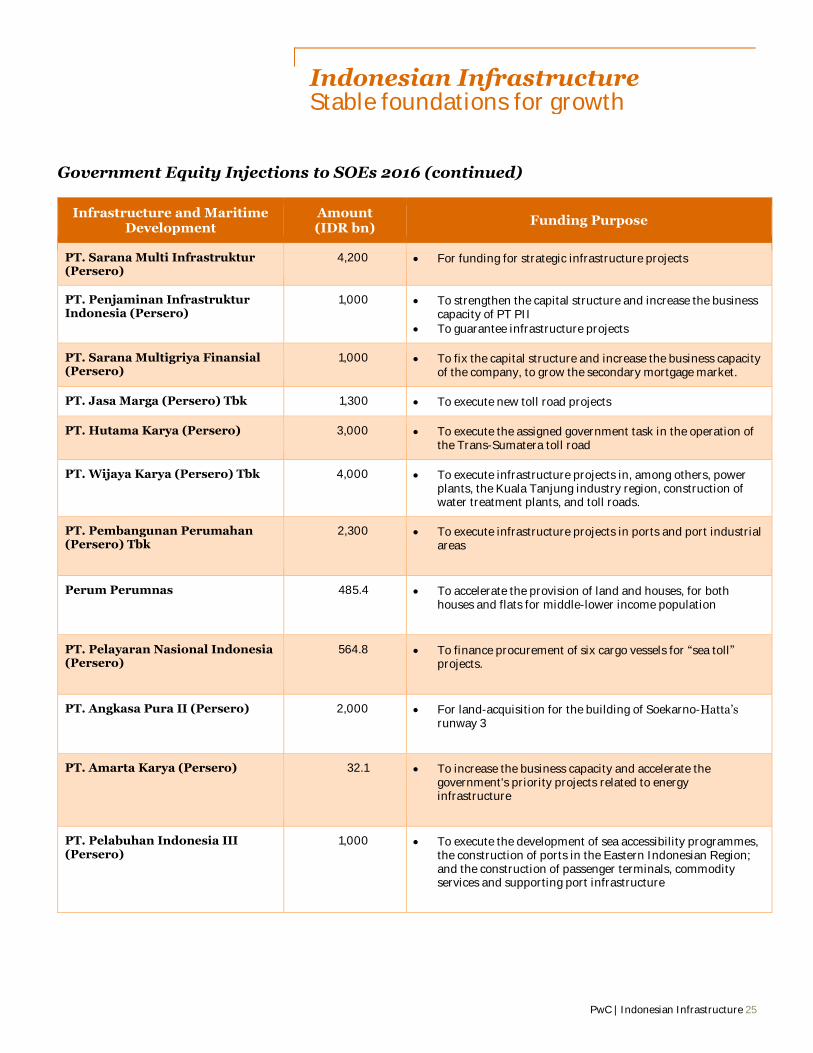
PwC | Indonesian Infrastructure 25
Indonesian Infrastructure Stable foundations for growth
Government Equity Injections to SOEs 2016 (continued)
Infrastructure and Maritime Development
Amount (IDR bn)
Funding Purpose
PT. Sarana Multi Infrastruktur (Persero)
4,200 For funding for strategic infrastructure projects
PT. Penjaminan Infrastruktur Indonesia (Persero)
1,000 To strengthen the capital structure and increase the business capacity of PT PII
To guarantee infrastructure projects
PT. Sarana Multigriya Finansial (Persero)
1,000 To fix the capital structure and increase the business capacity of the company, to grow the secondary mortgage market.
PT. Jasa Marga (Persero) Tbk 1,300 To execute new toll road projects
PT. Hutama Karya (Persero) 3,000 To execute the assigned government task in the operation of the Trans-Sumatera toll road
PT. Wijaya Karya (Persero) Tbk 4,000 To execute infrastructure projects in, among others, power plants, the Kuala Tanjung industry region, construction of water treatment plants, and toll roads.
PT. Pembangunan Perumahan (Persero) Tbk
2,300 To execute infrastructure projects in ports and port industrial areas
Perum Perumnas 485.4 To accelerate the provision of land and houses, for both houses and flats for middle-lower income population
PT. Pelayaran Nasional Indonesia (Persero)
564.8 To finance procurement of six cargo vessels for “sea toll” projects.
PT. Angkasa Pura II (Persero) 2,000 For land-acquisition for the building of Soekarno-Hatta’s runway 3
PT. Amarta Karya (Persero) 32.1 To increase the business capacity and accelerate the government's priority projects related to energy infrastructure
PT. Pelabuhan Indonesia III (Persero)
1,000 To execute the development of sea accessibility programmes, the construction of ports in the Eastern Indonesian Region; and the construction of passenger terminals, commodity services and supporting port infrastructure
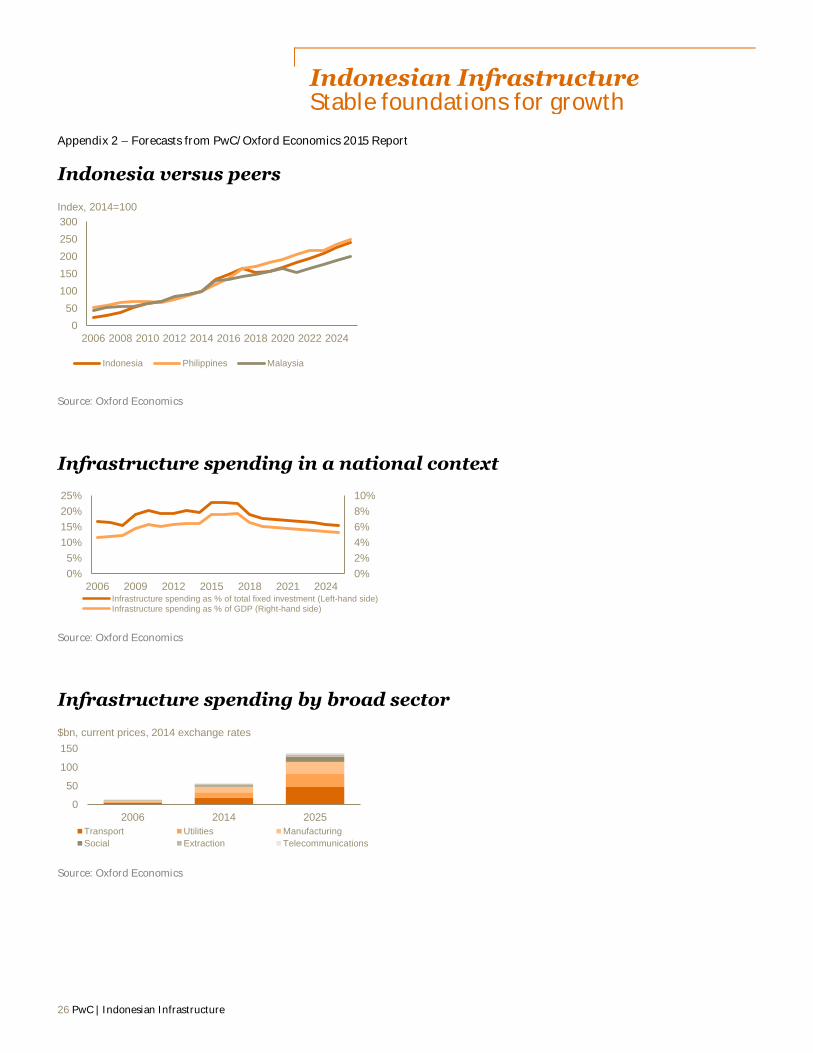
26 PwC | Indonesian Infrastructure
Indonesian Infrastructure Stable foundations for growth
Appendix 2 – Forecasts from PwC/Oxford Economics 2015 Report
Indonesia versus peers
Source: Oxford Economics
Infrastructure spending in a national context
Source: Oxford Economics
Infrastructure spending by broad sector
Source: Oxford Economics
0
50
100
150
200
250
300
2006 2008 2010 2012 2014 2016 2018 2020 2022 2024
Indonesia Philippines Malaysia
Index, 2014=100
0%
2%
4%
6%
8%
10%
0%
5%
10%
15%
20%
25%
2006 2009 2012 2015 2018 2021 2024Infrastructure spending as % of total fixed investment (Left-hand side)Infrastructure spending as % of GDP (Right-hand side)
0
50
100
150
2006 2014 2025
Transport Utilities Manufacturing
Social Extraction Telecommunications
$bn, current prices, 2014 exchange rates

Contributors
To have a deeper conversationabout this subject, pleasecontact:
Julian Smith Rizal SatarAgung WiryawanTim BoothmanPwC IndonesiaCapital projects & infrastructure
Graeme HarrisonOxford Economics
Julian SmithAdviser, Indonesia Capital Projects & Infrastructure Tel: +62 21 521 2901 ext 90966
Richard AbadieGlobal Leader, Capital Projects & InfrastructureTel: +44(0) 20 7213 3225
Methodology note: In developing this analysis, Oxford Economics used data sets to provide consistent, reliable, and repeatable measures of projected capital project and infrastructure spending globally as well as by country. Historical spending data is drawn from government and multinational organisation statistical sources. Projections are based on proprietary economic models developed by Oxford Economics at the country and sector levels. The analysis, completed over the first half of 2015, incorporates all available information at that time. For more information on the methodological basis for these projections, please see the 2014 Global Report available at http://www.pwc.com/gx/en/capital-projects-infrastructure/publications/cpi-outlook/index.jhtml
The results for this country report have been estimated using the following underlying data sources: World Health Organisation, UNESCO, World Bank, Annual Capital Expenditures Survey, Association of American Ports, Edison Electrical Institute, Office of Highway Policy Information, Federal Highways Authority, Department of Transportation, National Clearinghouse of Educational Facilities, Department of Education, Oxford Economics.

Contacts
Sacha Winzenried+62 21 5212901 [email protected]
Shunsuke Wariishi+62 21 5212901 [email protected]
Marina Tusin+62 21 5212901 ext.75567 [email protected]
Julian Smith+62 21 5212901 ext.90966 [email protected]
Rizal Satar+62 21 5212901 [email protected]
Adi Pratikto+62 21 5212901 [email protected]
Agung Wiryawan+62 21 5212901 [email protected]
Advisor, Infrastructure and Transportation
Energy Utilities and Mining
Japan Business Desk
Korea Business Desk
China Business Desk
Thea Caminada+62 21 5212901 [email protected]
Financial Effectiveness
Consulting Services
People & Change
Elizabeth Goodbody+62 21 5212901 [email protected]
Forensic & Security Services
Pieter Van de Mheen+62 21 5212901 [email protected]
Operations
Investment Services
Advisory ServicesCapital projects and infrastructure
Jumadi Anggana+62 21 5212901 ext. [email protected]
Yanto Kamarudin+62 21 5212901 [email protected]
Marcel Irawan+62 21 5212901 ext. [email protected]
Suyanti Halim+62 21 5212901 [email protected]
Hendra Lie+62 21 5212901 [email protected]
Tax Services
Assurance ServicesTransportation & other infrastructure
Power & Utilities
Power & Utilities
Transportation & other infrastructure
PwC IndonesiaThe PwC network is the world’s largest professional network of services firms. Drawing on the knowledge and skills of more than 208,000 people in 157 countries, PwC firms build relationships by providing services based on quality and integrity.
PwC Indonesia comprises KAP Tanudiredja, Wibisana, Rintis & Rekan, PT Prima Wahana Caraka, PT PricewaterhouseCoopers Indonesia Advisory and PT PricewaterhouseCoopers Consulting Indonesia each of which is a separate legal entity and all of which together constitute the Indonesian member firm of the PwC global network, which is collectively referred to as PwC Indonesia.
PwC Indonesia has been operating in Indonesia since 1971 as a member firm of PricewaterhouseCoopers International Limited. We have over 1,800 professional employees in Jakarta who are trained in providing various assurance, tax and advisory services to Indonesian and international companies, state owned companies, and non-profit organisations. Our employees are bilingual and have in-depth knowledge of the local business environment.
Taehun Jung+62 21 5212901 ext.90449 [email protected]
Toto Harsono+62 21 5212901 ext.91205 [email protected]
TechnologyPeni Rahayu+62 21 5212901 [email protected]
Program & Project ManagementElvia Afkar+62 21 5212901 [email protected]
Lenita Tobing+62 21 5212901 [email protected]
Strategy&
Mohammad Chowdhury +62 21 5212901 [email protected]
Telecom, Media & Technology


This content is for general information purposes only, and should not be used as a substitute for consultation with professional advisors.
© 2016 PwC. All rights reserved. PwC refers to the PwC network and/or one or more of its member firms, each of which is a separate legal entity. Please see http://www.pwc.com/structure for further details.