indonesia - grain and feed, annual report
TRANSCRIPT

THIS REPORT CONTAINS ASSESSMENTS OF COMMODITY AND TRADE ISSUES MADE BY
USDA STAFF AND NOT NECESSARILY STATEMENTS OF OFFICIAL U.S. GOVERNMENT
POLICY
Date:
GAIN Report Number:
Approved By:
Prepared By:
Report Highlights:
Post expects marketing year (MY) 2014/15 Indonesian wheat imports to increase by 4.2 percent to 7.7
million metric tons (MMT), compared to 7.392 MMT in MY 2013/14. Post also revised its MY
2014/15 Indonesian corn import upwards to 3.5 MMT, despite an expected increase in Indonesian corn
production. Increased corn import estimates are based on expected feed production increases in
calendar year (CY) 2015. Post estimates that MY 2014/15 Indonesian rice imports will increase
marginally to 1.25 MT compared to MY 2013/14 of 1.225 MMT, based on expected higher production
due to Indonesia’s self-sufficiency policy.
Thom Wright, Sugiarti Meylinah
Ali Abdi
Indonesia Grain and Feed Annual Report 2015
Grain and Feed Annual
Indonesia
ID1512
4/1/2015
Required Report - public distribution

SECTION I. SITUATION AND OUTLOOK
Food sovereignty is one of Indonesia’s new administration priorities. The Government of Indonesia
(GOI) has identified rice, corn and soybean as priority crops for self-sufficiency within the next three
years, with rice self-sufficiency as the top objective.
The policy direction to achieve food sovereignty, as formulated by Indonesian Ministry of National Plan
Development is:
1. Improve food security by strengthening domestic rice production capacity through:
a) The completion of a sustainable land security policy. This policy will prevent further land
conversion to non-agricultural uses, expand agricultural production area by one million
hectares, and expand or revitalize Indonesia’s irrigation system.
b) Revitalize extension and seed systems to 1,000 seed sovereign villages and 1,000 organic
farming villages.
c) The establishment of banks for agriculture, small and medium enterprise (SME), and
cooperatives.
2. Increase the public’s access to food through:
a) The construction of warehousing and post-harvest facilities.
b) Suppressing illegal imports.
c) Strengthening food reserves and stabilize food prices.
3. Improve the quality of food consumption and public nutrition by:
a) Increasing protein consumption such as eggs, fish, meat.
b) Increasing consumption of local non-rice food.
4. Mitigate disruptions to food sovereignty through the use of climate change-adaptive seed, the
development of climate studies school, and the creation of agricultural insurance programs.
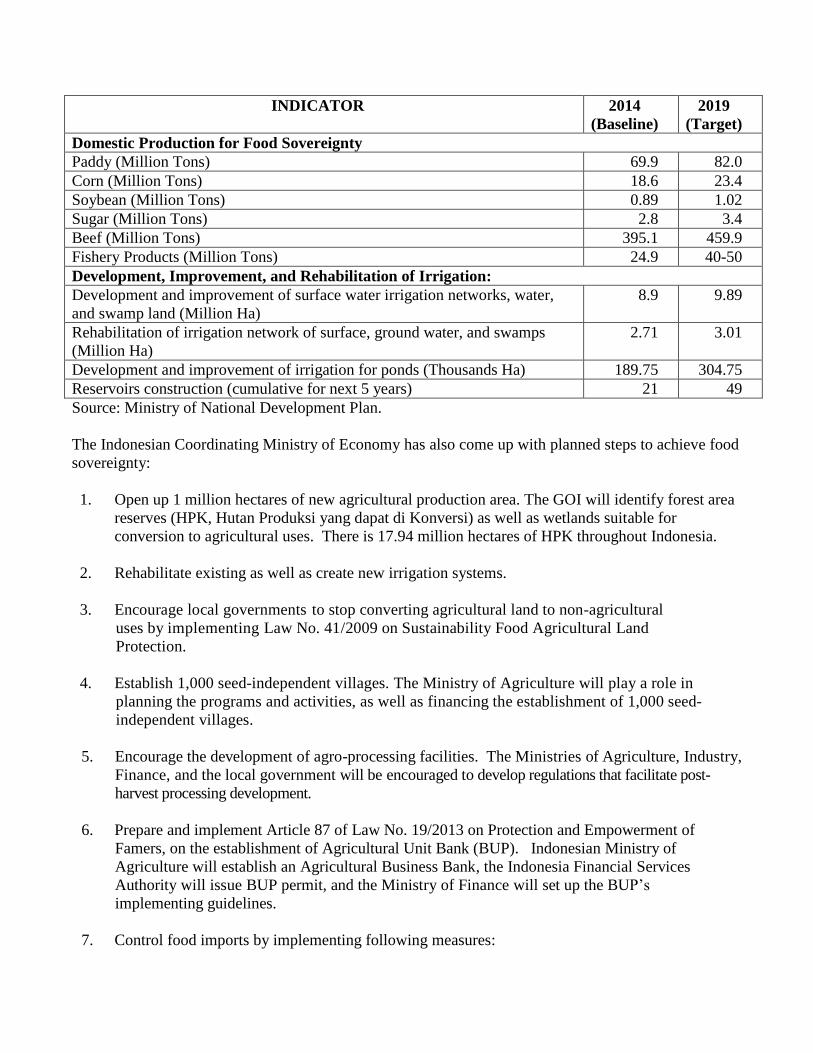
Table 1. Indonesian Food Sovereignty Goals:
INDICATOR 2014
(Baseline)
2019
(Target)
Domestic Production for Food Sovereignty
Paddy (Million Tons) 69.9 82.0
Corn (Million Tons) 18.6 23.4
Soybean (Million Tons) 0.89 1.02
Sugar (Million Tons) 2.8 3.4
Beef (Million Tons) 395.1 459.9
Fishery Products (Million Tons) 24.9 40-50
Development, Improvement, and Rehabilitation of Irrigation:
Development and improvement of surface water irrigation networks, water,
and swamp land (Million Ha)
8.9 9.89
Rehabilitation of irrigation network of surface, ground water, and swamps
(Million Ha)
2.71 3.01
Development and improvement of irrigation for ponds (Thousands Ha) 189.75 304.75
Reservoirs construction (cumulative for next 5 years) 21 49
Source: Ministry of National Development Plan.
The Indonesian Coordinating Ministry of Economy has also come up with planned steps to achieve food
sovereignty:
1. Open up 1 million hectares of new agricultural production area. The GOI will identify forest area
reserves (HPK, Hutan Produksi yang dapat di Konversi) as well as wetlands suitable for
conversion to agricultural uses. There is 17.94 million hectares of HPK throughout Indonesia.
2. Rehabilitate existing as well as create new irrigation systems.
3. Encourage local governments to stop converting agricultural land to non-agricultural
uses by implementing Law No. 41/2009 on Sustainability Food Agricultural Land
Protection.
4. Establish 1,000 seed-independent villages. The Ministry of Agriculture will play a role in
planning the programs and activities, as well as financing the establishment of 1,000 seed-
independent villages.
5. Encourage the development of agro-processing facilities. The Ministries of Agriculture, Industry,
Finance, and the local government will be encouraged to develop regulations that facilitate post-
harvest processing development.
6. Prepare and implement Article 87 of Law No. 19/2013 on Protection and Empowerment of
Famers, on the establishment of Agricultural Unit Bank (BUP). Indonesian Ministry of
Agriculture will establish an Agricultural Business Bank, the Indonesia Financial Services
Authority will issue BUP permit, and the Ministry of Finance will set up the BUP’s
implementing guidelines.
7. Control food imports by implementing following measures:

Determine the types of staple foods/basic commodities and essential goods required, as well
as appropriate quantities, as mandated by Law No. 18/2012 on Food and Law No. 7/2014 on
Trade.
Harmonize legislation related to food imports through a review of import policies established
in Law No. 13/2010 on Horticulture, Law No. 7/2014 on Trade, Law No. 39/2014 on Plantations,
and Law No. 41/2014 on the Amendment to Law No. 18/2009 on Livestock and Animal Health.
Strengthen National Food Reserves (government, local government, and villages’ food
reserves) by improving the role of BULOG and village-owned enterprises.
Prevent hoarding and speculation through new regulations on warehousing.
Indonesia requires improved irrigation systems in order to achieve higher agricultural production.
Indonesia is divided into 90 River Area Units (Satuan Wilayah Sungai, SWS) consisting of 5,000 river
basin areas (Daerah Aliran Sungai, DAS). Water Resources Law No. 7/2004 states that the primary
objective for Indonesia’s water conservation policies is to ensure enough water for agriculture. The GOI
and provincial governments are responsible for primary and secondary irrigation development, while
farmer groups are responsible for tertiary irrigation development and improvement. According to the
Indonesian Ministry of Public Works (MPW), approximately 84 percent of Indonesian rice area was
irrigated, while the remaining 16 percent was rain fed.
The following table shows water levels at major Indonesian reservoirs as of February 15, 2015:
Table 2. Indonesia: Major Water Reservoir Status, February 15, 2015.
No
Name of Water
Reservoir
Elevation and Volume Drought Alert
Elev. (m)
Condi-tion
Plan Monitored
Elev. Devi
a-
Vol. Deviati
on Monitore
d

Elev. Vol. Elev. Vol. tion
Status
(m) (Mill. m
3) (m)
(Mill. m
3) (m)
(Mill. m
3)
1 2 5 6 7 8 9 10 11 12 13
2 Jatiluhur 98.53 678.37 95.09 655.22 -3.44 -23.15 87.50 03/12/20
14 Deficit
3 Cirata 210.6
6 203.52 208.8
1 149.44 -1.85 -54.08 206.00 03/12/20
14 Deficit
4 Saguling 633.0
8 159.29 630.6
2 115.36 -2.46 -43.93 623.00 03/12/20
14 Deficit
5 Kedungombo
77.60 299.50 78.45 308.46 0.85 8.96 241.00
29/12/2014
Normal
6 Wonogiri 136.0
0 357.16
136.23
364.78 0.23 7.62 128.00
15/02/2015
Normal
7 Sempor 53.40 6.89 69.75 32.69
16.35 25.80 168.30 16/02/20
15 Norm
al
8 Wadaslintang
165.00
199.78 181.2
1 349.20
16.21 149.42 314.06 16/02/20
15 Norm
al
9 Sermo 128.6
6 8.95
136.06
17.81 7.40 8.86 122.12
16/02/2015
Normal
10 Sutami 259.0
0 42.13 258.7
4 40.93 -0.26 -1.20 246.00 10/01/20
15 Deficit
11 Lahor 259.2
0 3.90 258.5
9 3.64 -0.61 -0.26 253.00 10/01/20
15 Deficit
12 Selorejo 611.6
8 11.86 619.0
2 26.98 7.34 15.12 598.00 10/01/20
15 Norm
al
13 Bening 99.49 2.32 101.8
1 4.90 2.32 2.58 96.40 10/01/20
15 Norm
al
14 Wonorejo 161.5
0 35.94 165.1
0 44.59 3.60 8.65 141.00 10/01/20
15 Norm
al
15 Keuliling 45.80 18.36 45.78 18.31
-0.02 -0.05 38.50 31/01/20
15 Deficit
16 Bili-bili 91.14
178.16 99.34 256.88
8.20 78.72 80.91 15/02/20
15 Norm
al
17 Batutegi 274.0
0 687.77 273.8
4 684.43
-0.16 -3.34 243.93
31/12/2014 Deficit
Source: Ministry of Public Works December 31, 2013.
The Indonesian Meteorology, Climatology, and Geophysics Agency (Badan Meteorologi, Klimatologi,
dan Geofisika, BMKG) reported that in January 2015 the surface temperature of Indonesian seas was
warmer, with insignificant additional evaporation in northern Java. From February to June 2015, BMKG
forecasts that sea surface temperatures will be normal to warm with significant additional evaporation on
Java and surrounding areas. BMKG will refer to the following guidelines for evaluating sea surface
temperatures and forecasting possible El Nino/La Nina occurrences.
Table 3. El Nino/La Nina Forecast Guidelines Based on Southern Oscillation Index (SOI)
SOI Value (Tahiti Island and Darwin) Island) Events That May Occur
Below -10 for 6 months Strong El Nino
-5 to -10 for 6 months Moderate to Weak El Nino

-5 to +5 for 6 months Normal
+5 to +10 for 6 months Moderate to Weak La Nina
Above +10 for 6 months Strong La Nina
Source: BMKG
BMKG obtained the following results on the recent southern oscillation index:
Table 4. Recent Southern Oscillation Index Status
Source: BMKG
BMKG forecasts that Indonesia will experience a weak El Nino from March through June 2015. A weak
El Nino also occurred in January 2015. The occurrence of a weak El Nino in November 2014 delayed
the onset of the 2014 rainy season to December, pushing back the start of the MY 2014/15 paddy crop to
early December 2014. Normally, the rainy season lasts from October to April, while the dry season takes
up the remaining months. The Indonesian 2015 rainy season is still ongoing, with sufficient rainfall.
EXECUTIVE SUMMARY
Wheat
Post estimates that total Indonesian wheat imports will grow by 4.2 percent from 7.329 MMT in MY
2013/14 to 7.7 MMT in MY 2014/15. Imports are expected to continue growing to 8.1 MMT in MY
2015/16, in line with higher demand from the domestic wheat flour-based food industry. Post expects
that U.S. origin wheat exports to Indonesia will decrease to 600,000 MT in MY 2014/15 due to stronger
competition with traditional suppliers such as Australia and Canada.
Corn
Post estimates that MY 2014/15 Indonesian corn production will increase to 9.4 MMT, compared to 9.1
MMT in MY 2013/14. The increase is due to more area planted with hybrid corn seed, as well as
expansion in the place of soybean area. Production is expected to increase to 9.6 MMT in MY 2015/16.
Despite the increase in production, MY 2014/15 Indonesia corn imports are estimated to be stable at 3.5
Date Tahiti Darwin Daily 30-day Avg. SOI 90-day Avg. SOI
13 Jan 2015 1011.44 1005.90 4.39 -5.75 -7.46
14 Jan 2015 1011.75 1006.55 2.78 -5.51 -7.27
15 Jan 2015 1012.35 1005.95 8.44 -5.29 -7.05
16 Jan 2015 1011.56 1006.45 236 -5.29 0.93
17 Jan 2015 1010.03 1007.55 -1003 -5.72 0.97
18 Jan 2015 1006.90 1008.60 -2972 28 -7.12
19 Jan2015 1005.36 1010.05 -4380 -7.20 -7.33
20 Jan 2015 1007.21 1011.30 -40.98 -8.04 -7.51
21 Jan 2015 1007.54 1011.10 -3848 -8.65 -7.67

MMT. In line with increased production, MY 2015/16 Indonesian corn imports are forecast to decline
to 3 MMT.
Rice
MY 2014/15 first crop delays will push back the MY 2014/15 third crop harvest to MY 2015/16.
Considering the potential loss, Post estimates MY 2014/15 Indonesian paddy harvested area down to
12.080 million hectares. On the other hand, Post estimates that MY 2014/15 Indonesian rice production
will remain stable at 36.3 MMT due to higher expected yields. Increasingly strict import policies will
slow MY 2014/15 Indonesian rice imports to 1.25 MMT, a marginal increase. Imports are expected to
decline to 1.1 MMT in MY 2015/16.
WHEAT
Trade
During the 1998 Indonesian monetary crisis, only four Indonesian flour mills were operating. Today
Indonesia is home to 29 flour mills with a total installed capacity of 10.3 MMT/year, currently operating
at 60 – 70 percent capacity. This is lower than 2012, when estimates indicated that mills were operating
at 75 percent capacity. The decline is attributable to a highly competitive market and strong supply.
Flour production costs have increased as Indonesian electricity and labor rates have risen, while the
Dollar/Rupiah exchange rate has fallen from Rp. 11,591/$1 in July 2014 to Rp. 13,191/$1 in March
2015. This has been somewhat offset by abundant wheat supplies in Australia, the United States, and
Europe. Therefore, the Indonesian Ministry of Trade’s Market Information Center reports that the price
of Segi Tiga Biru flour has been relatively stable. (Retail Rp. 8,200 ($631/MT) – Rp. 8,300/kg
($638/MT) and factory gate Rp. 5,832/kg ($449/MT) from July 2014 to March 2015).
Based on the aforementioned factors, Post estimates that Indonesia’s MY 2014/15 wheat imports will
increase to 7.7 MMT, compared to 7.392 MMT in MY 2013/14. Higher demand for wheat flour-based
food and growing mills will drive a further increase of wheat imports which is forecast to reach 8.1
MMT in MY 2015/16. Australia held the largest market share for wheat (53 percent) in MY 2013/14.
This was followed by United States (16 percent), and the Canada (16 percent). Australia’s majority
market share is due to the noodle industry’s preference for Australian standard white wheat, price, and
Australia’s close proximity. With strong Australia supplies expected to continue to MY 2014/15, U.S.
market share in MY 2014/15 will likely to decline to approximately 7.8 percent. U.S. wheat import
market share is expected to increase to 8.6 percent in MY 2015/16, in line with increasing imports from
Indonesian flour mills.
Indonesia’s wheat flour import quota, which limits imports of wheat flour, expired on December 4,
2014. Nevertheless, industry reports that the depreciating Rupiah has resulted in higher freight rates,
discouraging wheat flour imports from Sri Lanka, India, or Turkey. Domestic flour continues to
dominate the market with a 96.4 percent market share. Based on Global Trade Atlas data for MY
2013/14 Indonesian wheat flour imports, Turkey maintained the largest market share (43 percent),
followed closely by India (23 percent), Sri Lanka (16 percent), Malaysia (7 percent) and Ukraine (6
percent). In MY 2013/14, Indonesia imported a total of 225,392 MT of flour, (308,336 MT of wheat

equivalent). This represents a decline from MY 2013/14 wheat flour imports of 256,420 MT (350,783
MT of wheat equivalent).
With the expiration of the wheat flour import quota, the Indonesian Flour Mills Association (APTINDO)
urgently requested the GOI to implement an anti-dumping duty. APTINDO has submitted anti-dumping
petitions to the Indonesian Anti-Dumping Commission in March 2014. If their petition is approved,
Indonesia is expected to impose an anti-subsidy or anti-dumping duty on imports of wheat flour. The
current import duty for imports of wheat flour is 5 percent. One consequence of this action is
Indonesia’s feed sector, which consumes approximately 165,000 MT of imported feed grade wheat flour
annually. Industry sources report that the feed sector continues to prefer to use domestically produced
feed-grade wheat flour.
Consumption
Approximately 66 percent of Indonesian flour mill customers are small and medium sized wheat-food
producers. These include small scale wet noodle makers, street food vendors, low end bread and bakery
businesses, and traditional Indonesian cake makers. Instant noodle manufacturers, middle and upper end
bakeries, and cookie and biscuit manufacturers take the other 34 percent of the market. APTINDO
reported that approximately 200,000 small and medium scale enterprises, employing two million
workers, are operational in Indonesia.
In MY 2013/14, Indonesia’s annual per capita wheat flour consumption reached 19 kg per capita per
year. Relatively stable macro-economic conditions have allowed middle and upper-middle income
consumers to diversify their diets to include more western-style foods like bread and pasta. Rather than
eating rice three daily meals, many Indonesians have switched to eating bread or noodles for breakfast.
Restaurants are also driving demand for wheat-based food products. Contrary to the depressed growth
of small and medium scale bakeries, the number of high-end bakeries is growing, mainly in major cities
including Jakarta, Surabaya, Medan, and Bandung. Instant noodle prices are currently cheaper than rice,
and many more lower and middle income consumers substitute instant noodles for breakfast or dinner.
As a result, the noodle industry continues to grow rapidly, consuming 70 percent of Indonesia’s wheat
flour. Bakery industry consumption follows with 20 percent of flour, while household and the
commercial biscuit producers each consume 10 percent, respectively. The Indonesian Statistics Agency
(BPS) in its 2013 National Economic Survey recorded that Indonesian wheat flour-based food
consumption has increasing by one percent per annum since 2009. Given these factors, Post increased
the MY 2014/15 Indonesian wheat consumption estimate by approximately 4.2 percent from 7.1 MMT
to 7.4 MMT. It is forecast to continue increase to 7.6 MMT in MY 2015/16.
CORN
Production
Despite forecasts of a weak El Nino in November, favorable weather prevailed in 2014. Farmers in
upland areas were able to plant corn during the second cropping season, while a third corn crop was
harvested on Java’s irrigated lowland areas. Farmers report that most of the corn planted in upland areas
was harvested by late February and early March 2014. Indonesia’s first corn season normally takes
place from November to February (49 percent). The second season takes place from March to June (37
percent), while the third runs from July to September (14 percent). No significant pest and disease
incidents were reported during the last two corn crop cycles of MY 2013/14.
MY 2014/15 corn harvested area is estimated to increase at the expense of soybean area. Farmers are
less interested in growing soybean due to lower yield and margins compared to corn. Furthermore, in an
effort to increase corn production, the Indonesian Ministry of Agriculture is cooperating with Indonesian
Ministry of Forestry and Environment to allow farmers to grow secondary crops and sugarcane on 1
million hectares of targeted forestry area. A pilot project on 30,000 hectares of forestry land will be
carried out in Central Java. Therefore, Post raises the MY 2014/15 corn harvested area estimate to 3.14
million hectares, compared to the previous estimate of 3.12 million hectares.
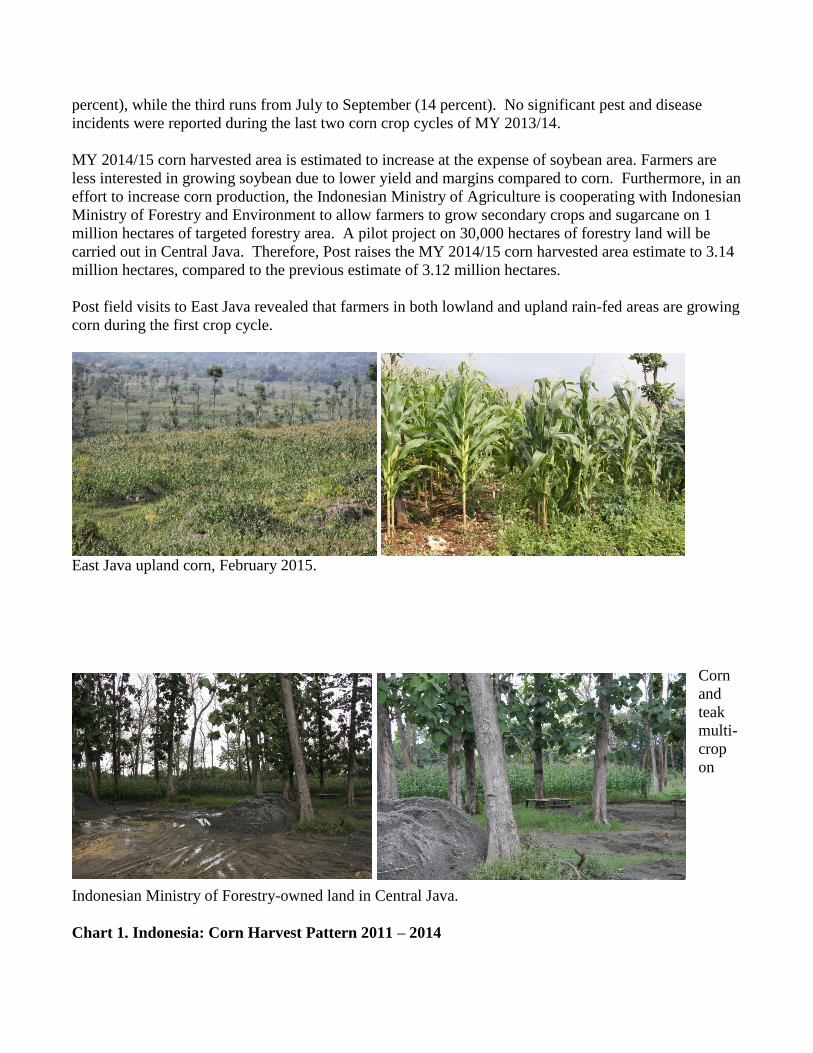
Post field visits to East Java revealed that farmers in both lowland and upland rain-fed areas are growing
corn during the first crop cycle.
East Java upland corn, February 2015.
Corn
and
teak
multi-
crop
on
Indonesian Ministry of Forestry-owned land in Central Java.
Chart 1. Indonesia: Corn Harvest Pattern 2011 – 2014
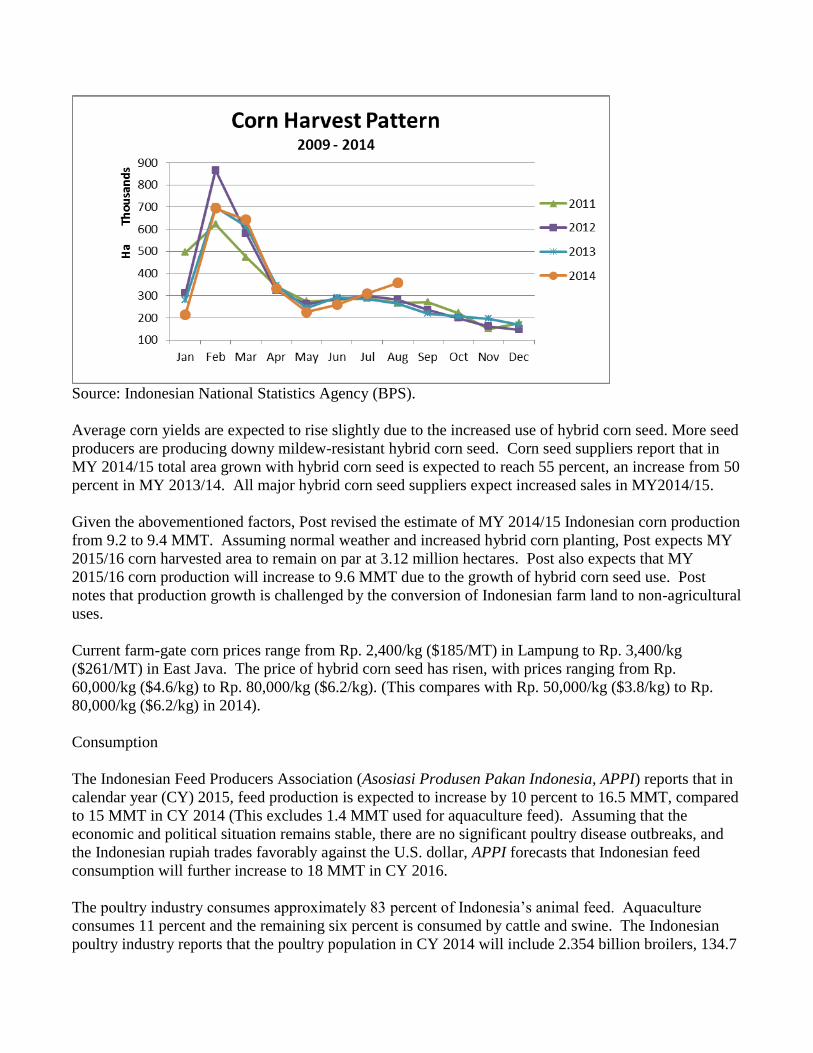
Source: Indonesian National Statistics Agency (BPS).
Average corn yields are expected to rise slightly due to the increased use of hybrid corn seed. More seed
producers are producing downy mildew-resistant hybrid corn seed. Corn seed suppliers report that in
MY 2014/15 total area grown with hybrid corn seed is expected to reach 55 percent, an increase from 50
percent in MY 2013/14. All major hybrid corn seed suppliers expect increased sales in MY2014/15.
Given the abovementioned factors, Post revised the estimate of MY 2014/15 Indonesian corn production
from 9.2 to 9.4 MMT. Assuming normal weather and increased hybrid corn planting, Post expects MY
2015/16 corn harvested area to remain on par at 3.12 million hectares. Post also expects that MY
2015/16 corn production will increase to 9.6 MMT due to the growth of hybrid corn seed use. Post
notes that production growth is challenged by the conversion of Indonesian farm land to non-agricultural
uses.
Current farm-gate corn prices range from Rp. 2,400/kg ($185/MT) in Lampung to Rp. 3,400/kg
($261/MT) in East Java. The price of hybrid corn seed has risen, with prices ranging from Rp.
60,000/kg ($4.6/kg) to Rp. 80,000/kg ($6.2/kg). (This compares with Rp. 50,000/kg ($3.8/kg) to Rp.
80,000/kg ($6.2/kg) in 2014).
Consumption
The Indonesian Feed Producers Association (Asosiasi Produsen Pakan Indonesia, APPI) reports that in
calendar year (CY) 2015, feed production is expected to increase by 10 percent to 16.5 MMT, compared
to 15 MMT in CY 2014 (This excludes 1.4 MMT used for aquaculture feed). Assuming that the
economic and political situation remains stable, there are no significant poultry disease outbreaks, and
the Indonesian rupiah trades favorably against the U.S. dollar, APPI forecasts that Indonesian feed
consumption will further increase to 18 MMT in CY 2016.
The poultry industry consumes approximately 83 percent of Indonesia’s animal feed. Aquaculture
consumes 11 percent and the remaining six percent is consumed by cattle and swine. The Indonesian
poultry industry reports that the poultry population in CY 2014 will include 2.354 billion broilers, 134.7

million layers, 21.755 million breeders, and 94.3 million male layers (raised for meat). Demand for
aquaculture feed in CY 2015 is estimated to increase by 13 percent due to an increase in demand for
shrimp in the international market. Expansion by feed mills continues to take place. Five new feed
mills started operation in CY 2014, and existing major feed mills continue to expand operations. As a
result, installed capacity of Indonesian feed mills is expected to reach 20 MMT. Millers report that
Indonesian mills are running at 70 – 80 percent capacity.
Table 5. Indonesia: Sources of Primary Feed Ingredients
No. Feed Ingredient
Sources
Local Import
1. Corn 90-95 5-10
2. Fish Meal 5-10 90-95
3. MBM 0 100
4. Soybean Meal 0 100
5. Rapeseed Meal 0 100
6. Corn Gluten Meal 0 100
7. Feed Additive 0 100
8. Rice Bran 100 0
9. Copra Meal 100 0
10. Palm Kernel Meal 100 0
11. CPO 100 0 Source: Indonesian Feed Producers Association (APPI)
APPI reports that on average, livestock feed is composed of corn (50 percent), soybean meal (15-20
percent), corn gluten meal (3 percent), CPO (2 percent), fish meal (5 percent), rice bran (15 percent),
wheat pollard (8 percent), and premix (0.6 percent). Indonesian feed millers are heavily reliant on
imported feed ingredients. Factors inhibiting feed millers from sourcing ingredients locally include low
protein content, high raw fiber content, rancidity, limited and inconsistent corn supplies for commercial
scale feed millers, and storage challenges. Given these challenges and Indonesia’s expanding livestock
sector, feed millers report inelastic demand for imported corn.
Considering the above factors, Post increased the MY2014/15 corn feed consumption estimate to 8
MMT compared to the previous estimate of 7.6 MMT. This is forecast to increase further to 8.6 MMT
in MY 2015/16. To the contrary, BPS reports in the Indonesian National Economic Survey that
Indonesian human corn consumption is decreasing by 6.33 percent per annum. Therefore, Post
estimates that MY 2014/15 Indonesia corn consumption for human food will decline to 4.2 MMT
compared to the previous estimate of 4.4 MMT. Corn consumption is forecast to continue declining to
4.1 MMT in MY 2015/16 as consumers substitute rice and wheat-based food products.
Trade
Corn constitutes about 80 percent of Indonesian feed energy sources. Despite growing domestic
production, challenges persist due to inconsistent seasonal supplies and poor post-harvest management
that result in high moisture content and high aflatoxin levels. These factors, combined with growing
feed mill capacity, are driving import demand. Post revises MY 2014/15 Indonesian corn import

estimates to 3.5 MMT, an increase of 900,000 MT over the previous estimate. Prospects for better corn
production in MY 2015/16 and larger carryover stocks from MY 2014/15 will push MY 2015/16
Indonesian corn imports down to 3 MMT. According to the Global Trade Atlas, MY 2013/14
Indonesian corn imports originated in Brazil (48 percent), India (33 percent), Argentina (15 percent),
and the United States (3 percent).
Indonesia imported 326,000 MT of distiller’s dried grain solubles (DDGS) in MY 2013/14, a 47 percent
increase over 223,000 MT in MY 2012/13. The United States is Indonesia’s largest DDGS supplier,
with a 98 percent market share. In 2013/14, Indonesia imported 200,000 MT of corn gluten meal
(CGM), a decline of 29 percent compared to 282,000 MT in MY 2012/13. Frequent promotional
activities and technical assistance provided by the U.S. Grains Council, in conjunction with other U.S.
promotional activities, contributed to increased knowledge about the value of using DDGS by
Indonesian feed mills.
With increasing feed production capacity and higher demand from the meat and poultry sectors, APPI
reports that the feed industry will need to import more corn in MY 2014/15 than in MY2013/14.
However, MOA maintains an unofficial import quota for corn. In order to import corn, a feed miller
must obtain an import recommendation from MOA. MOA only issues import recommendations for
corn imports based on the difference between estimated domestic corn production and estimated feed
demand. MOA’s production estimate for CY 2014 is 19.13 MMT.
Prices
In March 2015, corn farm gate prices ranged from Rp. 2,400/kg ($185/MT) to Rp. 3,400/kg ($261/MT)
compared to Rp. 2,600/kg ($200/MT) to Rp. 3,600/kg ($277/MT) in February 2015. (Note corn prices
FOB Gulf basis ranged approximately $170 to_$180/MT in March 2015.) Prices are decreasing as
supplies arrive from the current harvest period. With tighter competition from growing feed mills
industry, APPI reported that prices of broiler feed in January 2015 declined to Rp. 5,500/kg ($423/MT)
compared to Rp. 6,000/kg ($461/MT) in 2014.
RICE, MILLED
Production
The first crop of paddy for MY 2014/15 in major production areas is delayed, in line with BMKG
reports that the onset of the 2014 rainy season was delayed until December 2015. Typically, irrigated
farms are planted to paddy during the first crop cycle (October – February), followed by paddy on the
second crop cycle (March to June), and ended by growing paddy or secondary crops such as corn,
mungbean, soybean, peanut, or sweet potato during the third crop cycle (July – October). However, in
MY 2014/15, most farmers on Java started the first crop cycle in mid-December 2014 due to water
shortages (late rainfall). The delayed first crop is expected to push back the harvest of MY 2014/15

third crops, especially on irrigated low land areas. Furthermore, BMKG reported that the sea surface
temperature during January and February 2015 ranged from normal to warm. This implies that rainfall
intensity will not be as high as in the early 2014, when the northern coastal areas of Java experienced
flooding. Therefore, Post revises the MY 2014/15 Indonesian rice harvested areas to 12.08 million
hectares compared to the previous estimate of 12.16 million hectares. With carry-over from the MY
2014/15 third crop, as well as assuming favorable weather and no significant pest and disease incidents,
Post forecast that MY 2015/16 Indonesian paddy harvested areas will rebound to 12.16 million hectares.
Overall MY 2014/15 yields are estimated to remain higher than MY 2013/14 due to the growing use of
high yielding varieties such as Ciherang, Sinta Nur, Inpari, Memberamo, and Mekonga. Other factors
aiding yield increases include an absence of flooding and no reports of major pest and disease outbreaks.
More and more farmers are adopting the paddy planting technology called “Jajar Legowo”. The Jajar
Legowo cropping system plants paddy with a pattern of several rows interspersed with an empty row.
Plants that should be planted in an empty row are inserted in row crops. Initially, Jajar Legowo is
applied to areas with many pests and diseases. In blank rows farmers can make shallow trench. The
trenches can be used collect snails which are harmful to paddy. Later on, the cropping pattern evolves,
providing higher yields as a result of increasing populations and optimization of growing space for
paddy. This cropping system also provides more air and sunshine circulation. In addition, efforts to
control weeds and fertilization can be done more easily. Farmers using the technology can achieve a
potential increase of 10 – 15 percent in yield.
As of February 2015, there were a few small and sporadic paddy harvests ongoing on Java. The first
main harvest period is expected to take place between late March 2015 and April 2015. Irrigated land
has started the first paddy crop planting, while upland areas of Java are being planted to corn. The
second harvest is expected to occur in late August 2015.
Jajar Legowo and harvest on Java.
Chart 2. Indonesia: Rice Harvest Pattern 2011 - 2014

Source: BPS
In efforts to achieve food self-sufficiency targets, The Ministry of Agriculture has appointed PT. Sang
Hyang Seri and PT. Pertani, two state owned companies, to provide high yielding variety seed to be
distributed at subsidized rates to farmers.
Table 6. Indonesia: of Subsidized Seed Allocation and Maximum Retail Price
(Harga Eceran Tertinggi, HET), 2015
No. Seed Subsidized Allocation HET
Volume (Kg) Total Area (Rp. Kg)
1. Inbred Paddy 98,500,000 3,940,000 3,050
2. Hybrid Paddy 1,500,000 100,0000 5,700
3. Hybrid Corn 1,500,000 100,000 16,300
4. Soybeans 15,000,000 300,000 5,200
Total 116,500,000 4,440,000
Source: Ministry of Agriculture, 2015.
The Ministry of Agriculture is taking additional steps to ensure the success of rice self-sufficiency
policies. MOA has requested assistance from Indonesian national army to monitor the distribution of
subsidized fertilizer, help farmers repair tertiary irrigation canals, and to control pest and disease
incidents that may occur.
Despite lower harvested areas, Post’s MY 2014/15 Indonesian paddy production estimate is expected to
reach 57.165 MMT based on growing demand for high-yielding seed varieties, land conversion to non-

agricultural uses, and assuming normal weather. Post also expects MY 2015/16 paddy production to
increase to 57.717 MMT based on additional carry over from MY 2014/15 third crops.
Trade
The Indonesian National Logistics Agency (BULOG) has set its procurement target at 3.2 MMT of
milled rice equivalent for MY 2014/15. This is higher compared to the 3 MMT target set in MY
2013/14. As of December 2014, BULOG realized 2.5 MMT of the procurement target of MY 2013/14,
with an ending stock of 1.79 MMT, which includes approximately 250,000 tons of government rice
reserve. However, in the middle of March 2015, BULOG revised its MY 2014/15 procurement target
from 3.2 to 2.5 MMT. This decision is a follow up to the GOI decision to increase government
purchasing price (Harga Pembelian Pemerintah, HPP) for paddy and rice as stated in Presidential
Instruction No. 5/2015 stipulated on March 17, 2015. The average increase of the HPP, which is set at
an average of 10 -12 percent from the previous HPP, is considered lower than BULOG’s expectation of
a 15 percent average increase of HPP.
BULOG can only buy paddy or rice from farmers when the market price is lower or equal to the GOI’s
official purchasing price (Harga Pembelian Pemerintah, HPP). According to presidential instructions,
BULOG can buy paddy or rice that meets the following criteria and using the following HPP:
Table 7. Indonesia: Government Purchasing Price for Paddy and Rice 2012-Present
Inpres 2012 Inpres 2015
Quality Requirement
Wet
Paddy
Dry
Paddy Rice
Wet
Paddy
Dry
Paddy Rice
Moisture Content
Ma
x 25% 14% 14% 25% 14% 14%
Empty Husks/Dirt
Ma
x 10% 3% - 10% 3% -
Broken
Ma
x - - 20% - - 20%
Price at farmer's level Rp. 3,300 - - Rp. 3,700 - -
Price at mill's level Rp. 3,350 Rp. 4,150 - Rp. 3,750 Rp. 4,600 -
Price at Bulog
warehouse - Rp. 4,200
Rp.
6,600 - Rp. 4,650
Rp.
7,300
BULOG normally meets 60 percent of its procurement target during the first main harvest period. With
the delay in the MY 2014/15 first harvest, BULOG has only begun domestic procurement. As of March
31, 2015 BULOG procurements totaled 30,000 MT, far below 320,000 MT procured during the same
period of last year.
In the past, the GOI instructed BULOG to maintain a minimum secure stock level of 2 MMT by the end
of the year. With the current HPP, BULOG may find difficulty in meeting its procurement target as the
delayed harvest, combined with inflation, will push paddy prices above the HPP. June is usually the

most important month for BULOG domestic procurement objectives. Assuming that BULOG will be
able to reach the procurement target from domestic farmers, the GOI will still need to consider imports
to maintain BULOG’s stock at their prescribed levels.
Indonesian regulations restrict imports of rice one month prior to, during, and two months after the main
harvest period. Indonesian regulations only permit BULOG, the Indonesian state trading company, to
import medium quality rice while private companies can import specialty rice (jasmine rice, basmati
rice, sushi rice, rice for diabetics and rice seed, for example). Indonesian rice prices are considered the
highest in the international market.
Chart 3. Indonesia: Rice Price Comparisons
Source: Cipinang wholesale rice market, The Rice Trader, processed by FAS Jakarta.
Post expects that MY 2014/15 imports will increase to 1.25 MMT from to 1.225 MMT in MY 2013/14.
Medium grade rice is expected to make up 400,000 MT, with the remainder as specialty rice imports.

Post also expects that Indonesia may impose additional import restrictions in MY 2015/16, leading to a
lower import forecast of 1.1 MMT. Post notes that the GOI’s rice self-sufficiency aspirations have
resulted in import restrictions on rice, including specialty rice. The Ministry of Agriculture has not
issued any import recommendations for japonica rice since the fourth quarter of 2014, claiming that
certain local varieties can be substituted for restaurant grade japonica rice. The Ministry of Agriculture
continues to issue import recommendations for other specialty rice varieties.
Consumption
In MY 2014/15 BULOG will allocate 2.795 MMT of rice for the Raskin program to 15,530,897 poor
families. Each family will receive 15 kg of rice/month for 12 months at the price of Rp. 1,600/kg. As of
February 2015, BULOG distributed a total of 210,204 kg of rice under the Raskin program.
2013 Indonesia National Economic Survey (Susenas) data showed an average decline in rice per capita
consumption of 1.62 percent per annum. The decline in rice consumption is due to some switching
(especially at those middle income class) to wheat flour-based foods such as instant noodle and bread.
The price of a pack of instant noodle currently is about Rp. 2,000/pack ($0.15/pack) and can be eaten
without any side dishes, compared to the price of rice of Rp. 10,580 – 11,400/kg ($814 - $877/MT).
Based on population growth and other data, Post revised MY 2014/15 Indonesian rice consumption to
38.6 MMT from the previous estimate of 39.2 MMT. Post expects Indonesian rice consumption to
increase to 38.65 MMT in MY 2015/16, in line with population growth.
Stocks
Post revises MY 2014/15 Indonesian rice ending stocks to 4.451 MMT, slightly higher than the previous
estimate of 4.101 MMT, based on consumption revisions. Furthermore, Post forecasts MY 2015/16
Indonesian rice ending stocks to 3.551 MMT, based on lower imports and higher consumption.
Prices
Due to the delayed harvest, the current price of wet paddy and rice are above the HPP. Current farm
gate prices of wet paddy in Java range from Rp. 3,600/kg ($277/MT) to 4,500/kg ($346/MT) compared
with Rp. 2,900/kg ($223/MT) to Rp. 4,300/kg ($331/MT) in the same period of MY2013/14. The
average price of medium quality rice at Cipinang wholesale market also decreased from Rp. 10,800/kg
($831/MT) in March 1, 2015 to Rp. 9,200/kg ($708/MT) in March 30, 2015. Average daily rice supplies
to the Cipinang rice wholesale market in Jakarta increased to 3,876 MT in March 2015 from 2,006 MT
in February 2015, as harvesting in major production areas takes off.
Policy
In an effort to achieve the MY 2014/15 paddy production target of 73.4 MMT, the GOI set the
maximum retail price of subsidized fertilizer on 27 November 2014. These prices apply only to small
holder farmers possessing no more than 2 hectares of land for 2015.
Urea : Rp. 1,800/kg
SP-36 : Rp. 2,000/kg
ZA : Rp. 1,400/kg
NPK : Rp. 2,300/kg
Organic fertilizer : Rp. 500/kg
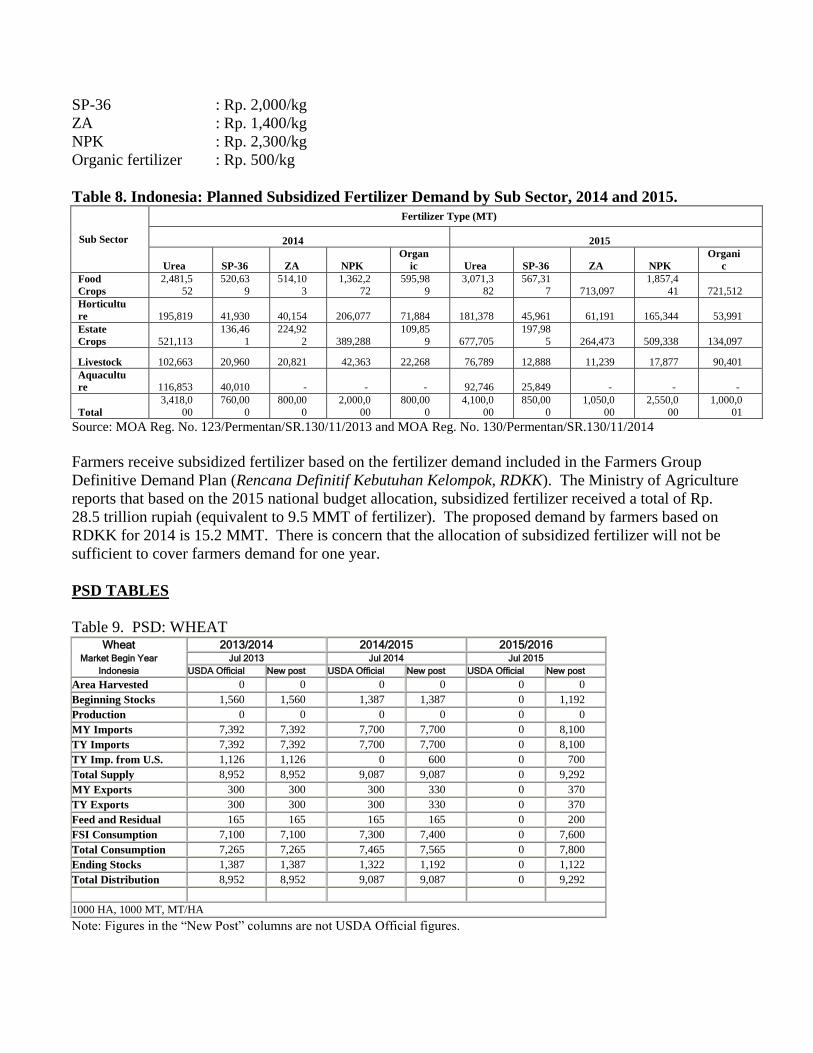
Table 8. Indonesia: Planned Subsidized Fertilizer Demand by Sub Sector, 2014 and 2015.
Sub Sector
Fertilizer Type (MT)
2014 2015
Urea SP-36 ZA NPK
Organ
ic Urea SP-36 ZA NPK
Organi
c
Food
Crops
2,481,5
52
520,63
9
514,10
3
1,362,2
72
595,98
9
3,071,3
82
567,31
7 713,097
1,857,4
41 721,512
Horticultu
re 195,819 41,930 40,154 206,077 71,884 181,378 45,961 61,191 165,344 53,991
Estate
Crops 521,113
136,46
1
224,92
2 389,288
109,85
9 677,705
197,98
5 264,473 509,338 134,097
Livestock 102,663 20,960 20,821 42,363 22,268 76,789 12,888 11,239 17,877 90,401
Aquacultu
re 116,853 40,010 - - - 92,746 25,849 - - -
Total
3,418,0
00
760,00
0
800,00
0
2,000,0
00
800,00
0
4,100,0
00
850,00
0
1,050,0
00
2,550,0
00
1,000,0
01
Source: MOA Reg. No. 123/Permentan/SR.130/11/2013 and MOA Reg. No. 130/Permentan/SR.130/11/2014
Farmers receive subsidized fertilizer based on the fertilizer demand included in the Farmers Group
Definitive Demand Plan (Rencana Definitif Kebutuhan Kelompok, RDKK). The Ministry of Agriculture
reports that based on the 2015 national budget allocation, subsidized fertilizer received a total of Rp.
28.5 trillion rupiah (equivalent to 9.5 MMT of fertilizer). The proposed demand by farmers based on
RDKK for 2014 is 15.2 MMT. There is concern that the allocation of subsidized fertilizer will not be
sufficient to cover farmers demand for one year.
PSD TABLES
Table 9. PSD: WHEAT Wheat 2013/2014 2014/2015 2015/2016
Market Begin Year Jul 2013 Jul 2014 Jul 2015
Indonesia USDA Official New post USDA Official New post USDA Official New post
Area Harvested 0 0 0 0 0 0
Beginning Stocks 1,560 1,560 1,387 1,387 0 1,192
Production 0 0 0 0 0 0
MY Imports 7,392 7,392 7,700 7,700 0 8,100
TY Imports 7,392 7,392 7,700 7,700 0 8,100
TY Imp. from U.S. 1,126 1,126 0 600 0 700
Total Supply 8,952 8,952 9,087 9,087 0 9,292
MY Exports 300 300 300 330 0 370
TY Exports 300 300 300 330 0 370
Feed and Residual 165 165 165 165 0 200
FSI Consumption 7,100 7,100 7,300 7,400 0 7,600
Total Consumption 7,265 7,265 7,465 7,565 0 7,800
Ending Stocks 1,387 1,387 1,322 1,192 0 1,122
Total Distribution 8,952 8,952 9,087 9,087 0 9,292
1000 HA, 1000 MT, MT/HA
Note: Figures in the “New Post” columns are not USDA Official figures.

Table 10. PSD: CORN Corn 2013/2014 2014/2015 2015/2016
Market Begin Year Oct 2013 Oct 2014 Oct 2015
Indonesia USDA Official New post USDA Official New post USDA Official New post
Area Harvested 3,120 3,120 3,120 3,140 0 3,140
Beginning Stocks 1,040 1,040 1,715 1,715 0 2,395
Production 9,100 9,100 9,200 9,400 0 9,600
MY Imports 3,500 3,500 2,600 3,500 0 3,000
TY Imports 3,500 3,500 2,600 3,500 0 3,000
TY Imp. from U.S. 126 126 0 10 0 0
Total Supply 13,640 13,640 13,515 14,615 0 14,995
MY Exports 25 25 25 20 0 20
TY Exports 25 25 25 20 0 20
Feed and Residual 7,400 7,400 7,600 8,000 0 8,600
FSI Consumption 4,500 4,500 4,400 4,200 0 4,100
Total Consumption 11,900 11,900 12,000 12,200 0 12,700
Ending Stocks 1,715 1,715 1,490 2,395 0 2,275
Total Distribution 13,640 13,640 13,515 14,615 0 14,995
1000 HA, 1000 MT, MT/HA
Note: Figures in the “New Post” columns are not USDA Official figures.
Table 11. PSD: RICE, MILLED Rice, Milled 2013/2014 2014/2015 2015/2016
Market Begin Year Jan 2013 Jan 2014 Jan 2015
Indonesia USDA Official New post USDA Official New post USDA Official New post
Area Harvested 12,100 12,100 12,160 12,080 0 12,160
Beginning Stocks 6,476 6,476 5,501 5,501 0 4,451
Milled Production 36,300 36,300 36,500 36,300 0 36,650
Rough Production 57,165 57,165 57,480 57,165 0 57,717
Milling Rate (.9999) 6,350 6,350 6,350 6,350 0 6,350
MY Imports 1,225 1,225 1,300 1,250 0 1,100
TY Imports 1,225 1,225 1,300 1,250 0 1,100
TY Imp. from U.S. 0 0 0 0 0 0
Total Supply 44,001 44,001 43,301 43,051 0 42,201
MY Exports 0 0 0 0 0 0
TY Exports 0 0 0 0 0 0
Consumption and Residual 38,500 38,500 39,200 38,600 0 38,650
Ending Stocks 5,501 5,501 4,101 4,451 0 3,551
Total Distribution 44,001 44,001 43,301 43,051 0 42,201
1000 HA, 1000 MT, MT/HA
Note: Figures in the “New Post” columns are not USDA Official figures.
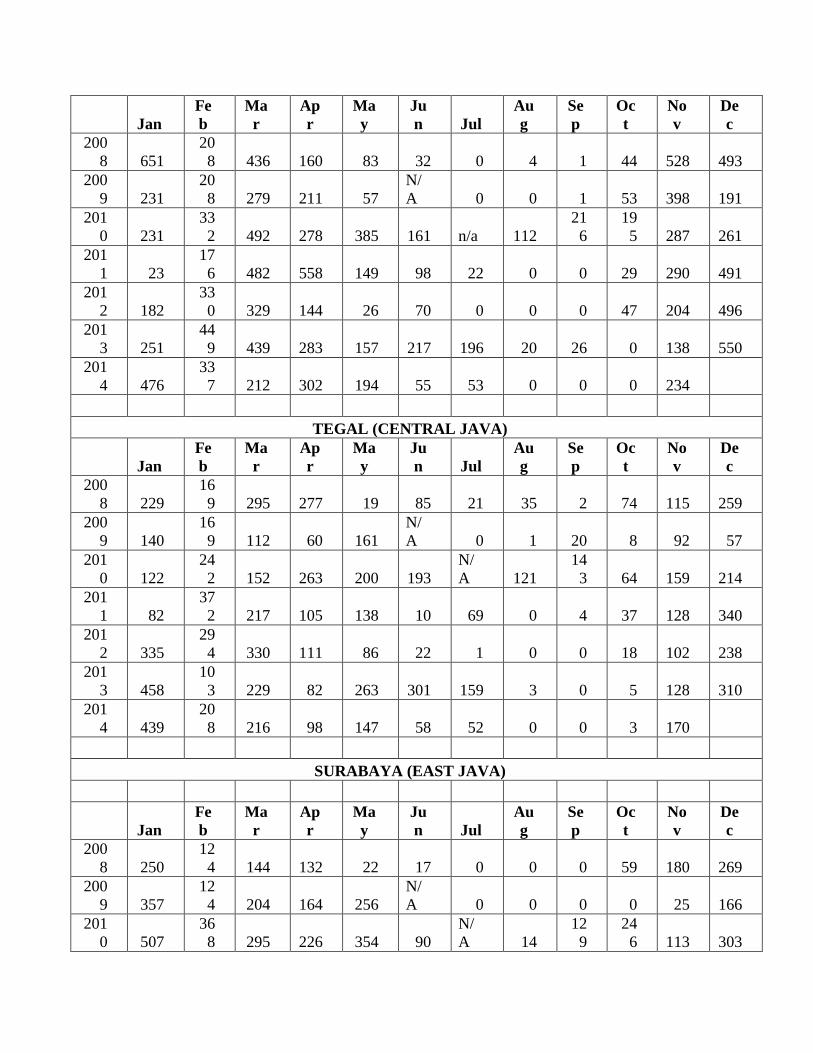
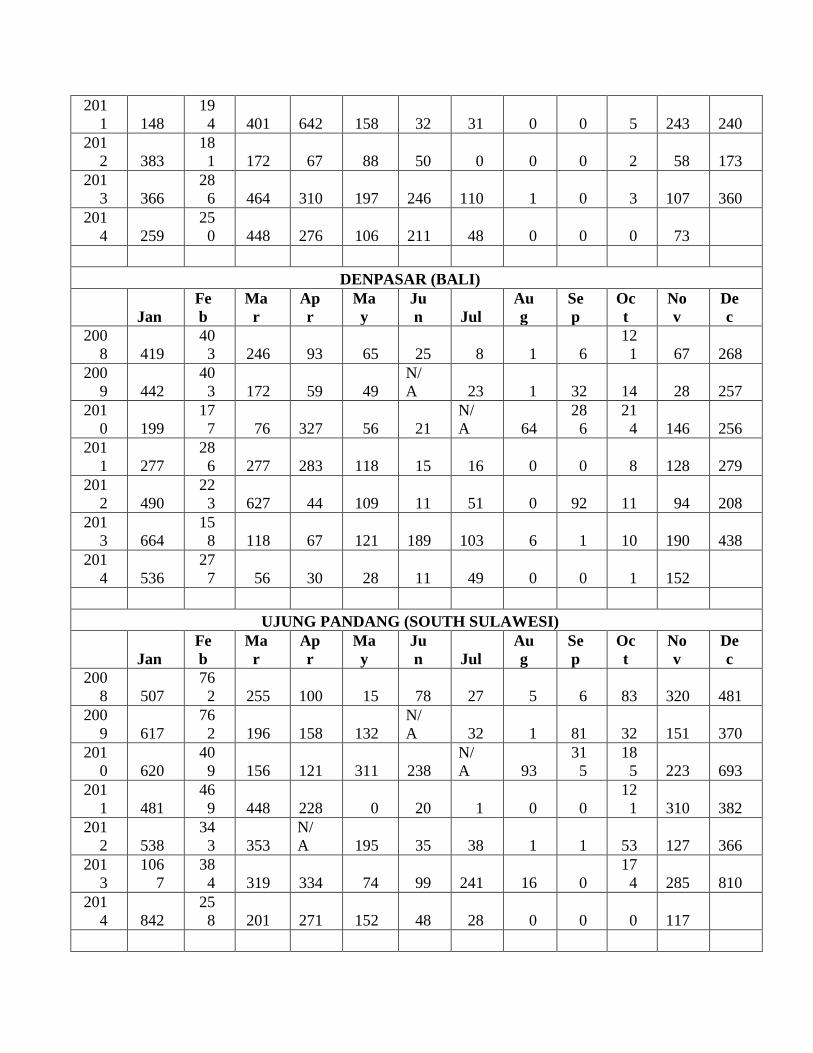
Table 12. RAINFALL DATA
Rainfall Pattern at Selected Station in Rice/Corn Producing Areas
(in millimeters, except where stated)
JATIWANGI (WEST JAVA)
Jan
Fe
b
Ma
r
Ap
r
Ma
y
Ju
n Jul
Au
g
Se
p
Oc
t
No
v
De
c
200
8 651
20
8 436 160 83 32 0 4 1 44 528 493
200
9 231
20
8 279 211 57
N/
A 0 0 1 53 398 191
201
0 231
33
2 492 278 385 161 n/a 112
21
6
19
5 287 261
201
1 23
17
6 482 558 149 98 22 0 0 29 290 491
201
2 182
33
0 329 144 26 70 0 0 0 47 204 496
201
3 251
44
9 439 283 157 217 196 20 26 0 138 550
201
4 476
33
7 212 302 194 55 53 0 0 0 234
TEGAL (CENTRAL JAVA)
Jan
Fe
b
Ma
r
Ap
r
Ma
y
Ju
n Jul
Au
g
Se
p
Oc
t
No
v
De
c
200
8 229
16
9 295 277 19 85 21 35 2 74 115 259
200
9 140
16
9 112 60 161
N/
A 0 1 20 8 92 57
201
0 122
24
2 152 263 200 193
N/
A 121
14
3 64 159 214
201
1 82
37
2 217 105 138 10 69 0 4 37 128 340
201
2 335
29
4 330 111 86 22 1 0 0 18 102 238
201
3 458
10
3 229 82 263 301 159 3 0 5 128 310
201
4 439
20
8 216 98 147 58 52 0 0 3 170
SURABAYA (EAST JAVA)
Jan
Fe
b
Ma
r
Ap
r
Ma
y
Ju
n Jul
Au
g
Se
p
Oc
t
No
v
De
c
200
8 250
12
4 144 132 22 17 0 0 0 59 180 269
200
9 357
12
4 204 164 256
N/
A 0 0 0 0 25 166
201
0 507
36
8 295 226 354 90
N/
A 14
12
9
24
6 113 303
201
1 148
19
4 401 642 158 32 31 0 0 5 243 240
201
2 383
18
1 172 67 88 50 0 0 0 2 58 173
201
3 366
28
6 464 310 197 246 110 1 0 3 107 360
201
4 259
25
0 448 276 106 211 48 0 0 0 73
DENPASAR (BALI)
Jan
Fe
b
Ma
r
Ap
r
Ma
y
Ju
n Jul
Au
g
Se
p
Oc
t
No
v
De
c
200
8 419
40
3 246 93 65 25 8 1 6
12
1 67 268
200
9 442
40
3 172 59 49
N/
A 23 1 32 14 28 257
201
0 199
17
7 76 327 56 21
N/
A 64
28
6
21
4 146 256
201
1 277
28
6 277 283 118 15 16 0 0 8 128 279
201
2 490
22
3 627 44 109 11 51 0 92 11 94 208
201
3 664
15
8 118 67 121 189 103 6 1 10 190 438
201
4 536
27
7 56 30 28 11 49 0 0 1 152
UJUNG PANDANG (SOUTH SULAWESI)
Jan
Fe
b
Ma
r
Ap
r
Ma
y
Ju
n Jul
Au
g
Se
p
Oc
t
No
v
De
c
200
8 507
76
2 255 100 15 78 27 5 6 83 320 481
200
9 617
76
2 196 158 132
N/
A 32 1 81 32 151 370
201
0 620
40
9 156 121 311 238
N/
A 93
31
5
18
5 223 693
201
1 481
46
9 448 228 0 20 1 0 0
12
1 310 382
201
2 538
34
3 353
N/
A 195 35 38 1 1 53 127 366
201
3
106
7
38
4 319 334 74 99 241 16 0
17
4 285 810
201
4 842
25
8 201 271 152 48 28 0 0 0 117
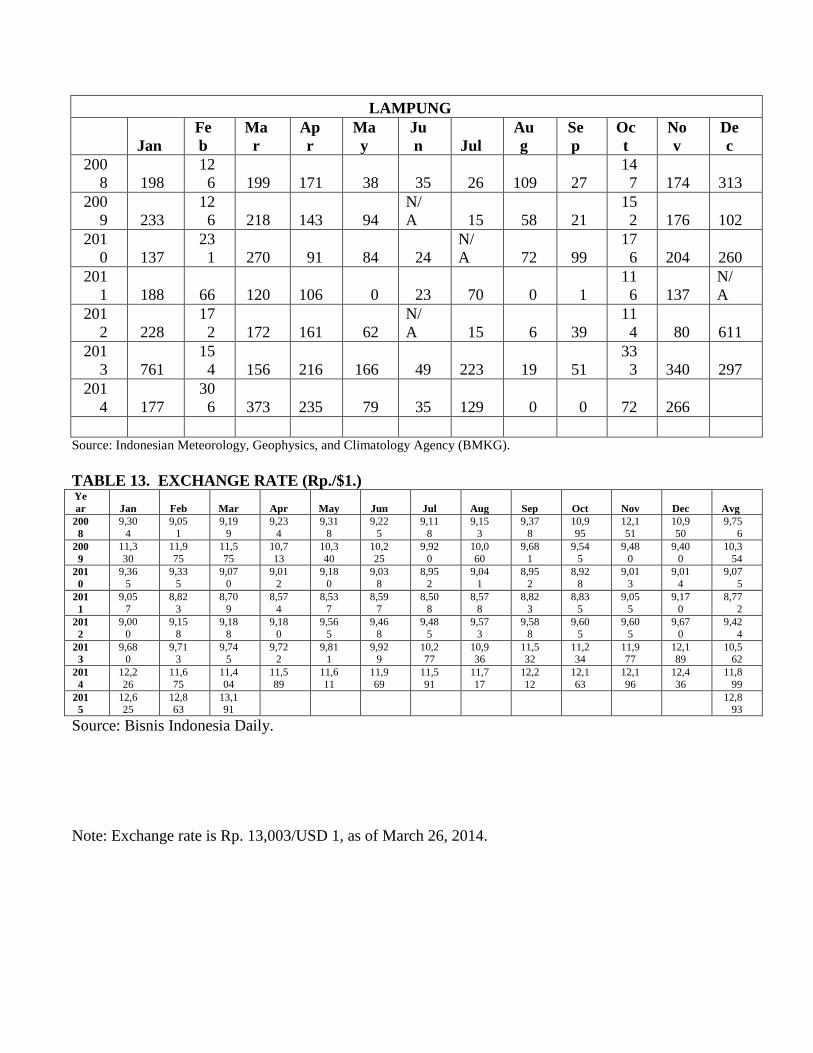
LAMPUNG
Jan
Fe
b
Ma
r
Ap
r
Ma
y
Ju
n Jul
Au
g
Se
p
Oc
t
No
v
De
c
200
8 198
12
6 199 171 38 35 26 109 27
14
7 174 313
200
9 233
12
6 218 143 94
N/
A 15 58 21
15
2 176 102
201
0 137
23
1 270 91 84 24
N/
A 72 99
17
6 204 260
201
1 188 66 120 106 0 23 70 0 1
11
6 137
N/
A
201
2 228
17
2 172 161 62
N/
A 15 6 39
11
4 80 611
201
3 761
15
4 156 216 166 49 223 19 51
33
3 340 297
201
4 177
30
6 373 235 79 35 129 0 0 72 266
Source: Indonesian Meteorology, Geophysics, and Climatology Agency (BMKG).
TABLE 13. EXCHANGE RATE (Rp./$1.) Ye
ar Jan Feb Mar Apr May Jun Jul Aug Sep Oct Nov Dec Avg
200
8
9,30
4
9,05
1
9,19
9
9,23
4
9,31
8
9,22
5
9,11
8
9,15
3
9,37
8
10,9
95
12,1
51
10,9
50
9,75
6
200
9
11,3
30
11,9
75
11,5
75
10,7
13
10,3
40
10,2
25
9,92
0
10,0
60
9,68
1
9,54
5
9,48
0
9,40
0
10,3
54
201
0
9,36
5
9,33
5
9,07
0
9,01
2
9,18
0
9,03
8
8,95
2
9,04
1
8,95
2
8,92
8
9,01
3
9,01
4
9,07
5
201
1
9,05
7
8,82
3
8,70
9
8,57
4
8,53
7
8,59
7
8,50
8
8,57
8
8,82
3
8,83
5
9,05
5
9,17
0
8,77
2
201
2
9,00
0
9,15
8
9,18
8
9,18
0
9,56
5
9,46
8
9,48
5
9,57
3
9,58
8
9,60
5
9,60
5
9,67
0
9,42
4
201
3
9,680
9,713
9,745
9,722
9,811
9,929
10,277
10,936
11,532
11,234
11,977
12,189
10,562
201
4
12,2
26
11,6
75
11,4
04
11,5
89
11,6
11
11,9
69
11,5
91
11,7
17
12,2
12
12,1
63
12,1
96
12,4
36
11,8
99
201
5
12,625
12,863
13,191
12,893
Source: Bisnis Indonesia Daily.
Note: Exchange rate is Rp. 13,003/USD 1, as of March 26, 2014.
