indonesia cement 14 january 2018 - indopremier.com for sumatera (5.2%) and ex-java/sumatera (6.4%)...
TRANSCRIPT

Refer to Important disclosures on the last of this report
Source: Bloomberg
2019 - Year of recouped price clout
� Domestic cement volume growth to stay modest (+4.9% yoy) in 2019.
� Mounting first-tier retail presence as second-tier operation lurches.
� Better supply control by first-tier players shall levitate their ASPs.
� We choose SMGR as our top pick but keep our SELL rating on SMBR.
Modest volume growth trend is to continue in 2019. We forecast cement sales
volume to grow 4.9% to 73mt in 2019 (2018: 4.6%) as populist fiscal policies during
election year may slow launch of new infrastructure projects. This, in fact, is reflected
on 2019 infra-budget of Rp421tn that paints a nuanced growth (+2.5% yoy).
Nevertheless, we also noted that populist policy could lever people’s purchasing power
in the form of higher disposable income that caters positive catalyst for cement bag
consumption are frequently used for renovation, especially in rural area and KPPIP
indicated 94 (out of 187) infrastructure project will keep rolling this year most of which
are decentralized outside Java. We thus forecast higher cement sales growth in 2019
for Sumatera (5.2%) and Ex-Java/Sumatera (6.4%) vs. 5% and 6%, respectively, in
2018, and flat Java volume growth of 4.1% (2018: 4%) to account for persistent
market saturation.
Industry should see less rivalry. We expect higher volume market share (84% vs.
2018: 81%) of first-tier players (Indocement, Semen Holcim, and Indonesia) in the
wake of both impaired retail presence of second-tier manufacturers, with their debt
burden problems (including Chinese players, such as Anhui Conch), and scale operating
in a well saturated market (most of them located in Java). This is evident from sales-
to-installed capacity metric of these second-tier manufacturers which had decreased to
33% in 2018 (vs. industry and first-tier at 60% and 74%, respectively) and we forecast
a lower second-tier utilization rate in the range of 30% going forward.
Industry consolidation spurs improved pricing power. We forecast national
installed capacity at 113mt in 2019 (+4.7% yoy) due to supply addition from Semen
Kupang (1.5mt) and Anhui Conch (3.6mt). These new mills will raise capacity share of
second-tier players (2018: 33% vs. 2015: 19%) though we are skeptical on their
capability to effectively run these new facilities, if not left dormant in operation. On the
other hand, We argue that national supply growth will be better managed by first-tier
players (with 67% of capacity share), especially SMGR that markedly holds 43% (up
from 31%) of capacity share post SMCB merger. Apropos of that, we expect better
pricing power for first-tier players, with SMGR leading in pricing power, as corollary of
both industry consolidation and less competition intensity. Moreover, we noted Eastern
Indonesia (Sulawesi, Maluku, and Papua) is actually on 5mt supply deficit and this
region holds 16% of market share and some region, like Borneo, C. Java, and
Sumatera, have benign overcapacity with considerable total market share of 41%.
Stock picks. Price recovery is the main theme for cement industry this year in which
our sensitivity analysis concludes the price to be the critical factor that drives
profitability. In particular, we like SMGR due to its capability of flexibly adjusting their
ASP on region-by-region basis due to extensive presence and the merger should further
empower company’s scale and scope. Moreover, SMGR current EV/ton of $154 implies
19% and 26% to average Indonesian and Global cement peers.
Stock Ticker Rating Price TP
19F P/E
20F P/E
19F P/B
20F P/B
19F ROA
19F ROE
(Rp) (Rp) (x) (x) (x) (x) (%) (%)
Semen Indonesia
SMGR Buy 11,575 14,000 22.0 16.4 0.8 0.8 3.6 9.1
Indocement INTP Hold 18,000 17,400 46.3 35.6 2.4 2.2 5.2 6.3
Semen Baturaja
SMBR Sell 1,715 400 175.1 187.9 4.6 4.6 2.0 2.7
Source: Bloomberg, IndoPremier Note: Share prices as of closing 14-January-2019
Indonesia Cement
14 January 2018
Sector Update
Sector Index Performance (JAKBIND)
3M 6M 12M
Absolute (%) 16.6 11.9 27.9
Relative to JCI (%) 6.5 5.3 28.4
52whigh/low (Rp) 886/681
Willy Goutama
PT Indo Premier Sekuritas
+62 21 5793 1168
70
80
90
100
110
120
130
140
150
12-Jan 12-Apr 12-Jul 12-Oct 12-Jan
JCI JAKBIND
Equity |
Indonesia
| C
em
ent

Cement Sector Update
2 Refer to Important disclosures on the last of this report
Fig. 1: Imbalance of Demand & Supply is to narrow... Fig. 2: … as second-tier ‘s utilization swoops
Source : ASI, CEIC, Indo Premier Source : ASI, CEIC, Indo Premier
Fig. 3: First-tier’s capacity share dominates nation-wide Fig. 4: First-tier domination contains overcapacity issue
Source : ASI, Companies, Indo Premier Source : ASI, CEIC, Indo Premier
Fig. 5: Plus, first-tier product presence should gradually up Fig. 6: Semen Indonesia looks attractive valuation-wise
Source : Companies, Indo Premier Source : Bloomberg, Indo Premier
-5%
10%
25%
40%
55%
70%
85%
100%
0
20
40
60
80
100
120
140
2008 2009 2010 2011 2012 2013 2014 2015 2016 2017 2018F2019F2020F2021F
Total Cement Demand (mt)
Total Industry Excess Capacity (mt)
Demand to Installed Capacity (%)- RHS
0%
10%
20%
30%
40%
50%
60%
70%
80%
90%
100%
0%
10%
20%
30%
40%
50%
60%
70%
80%
90%
100%
First-tier Players (mt) Second-Tier Players (mt)
First-tier Sales to Installed Capacity (%) - RHS Second-tier Sales to Installed Capacity S(%) - RHS
0%
20%
40%
60%
80%
100%
Sumatera
Sulawesi
BorneoW. Java
E. Java
Pre-merged SMGR INTP Post-merged SMGR First-tier Players
0%
10%
20%
30%
40%
50%
60%
(10,0)
-
10,0
20,0
30,0
40,0
50,0
60,0
70,0
80,0
90,0
W. Java C. Java E. Java Java Sumatera Borneo Eastern
Indonesia
Demand (mt) Excess Capacity (mt) Market Share (%)- RHS
44% 45%43%
41% 41%
44% 44%42% 43% 44%
40% 40% 41% 42%
32%30% 31% 32% 32%
30% 30%
27% 26% 25% 26% 26% 26% 26%
14% 14% 14%16% 16% 15% 15% 14%
12%15% 15% 15% 15% 15%
3% 3% 3% 3% 2% 2% 2% 2% 3% 3% 3% 3% 3% 3%
0%
5%
10%
15%
20%
25%
30%
35%
40%
45%
50%
SMGR INTP SMCB SMBR
-
100
200
300
400
500
600
700

Cement Sector Update
3 Refer to Important disclosures on the last of this report
Macroeconomics Overview
Solid pace in infrastructure and property should sustain cement volume growth
Indonesia economic profile continued to exhibit a steady increase (10-yr real GDP growth at 5.5%).
We also witnessed an ascending portion of investment to total GDP (fig. 7) from 25% in 2007 to
33% in 2017, supported by an upbeat in real investment (10-yr CAGR at 6.6%) that outpaces real
GDP growth (10-yr CAGR at 5.5%) which results to higher real investment-to-GDP ratio (2017: 33%
vs. 2007: 29%). This progress has been indispensable to current government main theme of
promoting an extensive infrastructure projects spanning from Western to Eastern Indonesia.
The infrastructure spending contains on state budget (fig. 9) had seen a gigantic growth (5-yr CAGR
FY12-17 at 22%) post Jokowi administration took place whose figure nearly tripled from Rp146tn in
2012 to Rp401tn in 2017 of which it has been recently allocated across ministries, rather than being
centralized in the Ministry of Public Work and Transportation (fig. 10).
The following chart (fig. 11) presents type of construction had been done in the past 10 years that
consists of building, civil, and specialized (dams. power generations, etc.) constructions. As a whole,
total gross construction output advanced reasonably well at 10-yr historical CAGR of 16% which was
well above the compounded growth of nominal GDP at 10% for the pertaining period (2010-2017).
The civil construction had been the main growth contributor for total gross construction output that
increased at 7-yr historical CAGR of 16.4%, followed by the building and specialized construction of
15.4% and 14%, respectively.
Fig. 7: Steady Economic Growth with an Ascending Investment Fig. 8: Real Investment-to-GDP ticks up over time
Source : CEIC, Ministry of Finance, Indo Premier Source : CEIC, Ministry of Finance, Indo Premier
Fig. 9: Total Infrastructure Budget and Its Share as of GDP Fig. 10: Infrastructure Budget Allocation across Ministries
Source : CEIC, DJPBN, Ministry of Finance, Indo Premier Source : CEIC, Indo Premier
64% 61% 59% 56% 55% 56% 57% 57% 57% 58% 57%
8%8% 10%
9% 9% 9% 10% 9% 10% 10% 9%
25% 28% 31%33% 33%
35% 34% 35% 34%34%
33%
0%
1%
2%
3%
4%
5%
6%
7%
0%
10%
20%
30%
40%
50%
60%
70%
80%
90%
100%
2007 2008 2009 2010 2011 2012 2013 2014 2015 2016 2017
Private Consumption Government Spending Investment GDP Growth (%)- RHS
0%
5%
10%
15%
20%
25%
30%
35%
-
2.000
4.000
6.000
8.000
10.000
12.000
2000 2001 2002 2003 2004 2005 2006 2007 2008 2009 2010 2011 2012 2013 2014 2015 2016 2017
Real GDP (2010=100, Rptn) Real Investment (2010=100, Rptn)
Real Investment-to-GDP (RHS)
1,6%
1,4%1,3%
1,5%
1,7% 1,6%1,5%
2,2%
2,6%
3,0%2,8%
2,6%
0,0%
0,5%
1,0%
1,5%
2,0%
2,5%
3,0%
3,5%
-
50
100
150
200
250
300
350
400
450
2008 2009 2010 2011 2012 2013 2014 2015 2016 2017 2018 2019
Total Infrastructure Budget (RHS, Rptn)
Infrastructure Budget (% of Total Nominal GDP)
0%
10%
20%
30%
40%
50%
60%
70%
80%
90%
100%
2008 2009 2010 2011 2012 2013 2014 2015 2016 2017 2018 2019
Ministry of Public Work Budget Ministry of Transportation Budget
Other Ministries' Infrastructure Budget

Cement Sector Update
4 Refer to Important disclosures on the last of this report
As of 2017, the building, civil, and specialized construction output booked at Rp256tn, Rp478tn, and
Rp136tn which brought a total construction output of Rp871tn (+11% yoy), accounting for 6.41% of
total nominal GDP (2008: 2.06%). The distribution of gross construction output by region (fig. 12)
depicts the focus area of a realized infrastructure budget allocation. The figure shows a growing
trend in construction output proportion in Java from 49% in 2008 to 66% in 2017 which we think
could sustain the cement demand growth in an already saturated market. While, the Sumatera and
Ex- Java and Sumatera regions saw a decreasing trend in construction output proportion to both
17% (from 21% and 30% in 2008), consecutively.
Despite a decreasing construction output proportion in Sumatera and Ex-Java/Sumatera region, we
can see the proportion of construction output to each regional GDP (fig. 13) was actually increasing
for Sumatera, Borneo, and Sulawesi which means that the construction activities start to give more
contribution to their regional economy activities. Rapid and massive scale of infrastructure projects
had also rendered an increase in the construction input purchase which can be seen on the trend of
material spending as of total fiscal spending (fig. 14) that nearly tripled as well from 6% in 2008 to
15% in 2017 as the material spending (7-yr CAGR at 17%) outgrew the capital spending (7-yr
CAGR at 10%). It thus conveys an idea of increasing use of cement as one of the major material
input for constructions.
While the infrastructure expansion has taken a consequence of a heightened debt-to-GDP ratio (to
23% in 9M18 (from 15% in 2010), we think that this level is still relatively low compared to
countries with similar country risk (fig. 16) whose median debt-to-GDP ratio is 37.8% in 2017, but
raise the concern on the debt maturity management as the short-term portion is noticeably
increasing (fig. 15). Nevertheless, we believe this is a right step as the long-run effects of
infrastructure should outweigh the cost of short-run financial leverage.
Fig. 11: Gross Construction Output by Type (in Rptn) Fig. 12: Distribution of Gross Construction Output by Region
Source : CEIC, Indo Premier Source : CEIC, Indo Premier
Fig. 13 : Construction Output (% of regional GDP, 4-q MA) Fig. 14 : Capital and Material spending (% of fiscal spending)
Source : CEIC, Indo Premier Source : CEIC, Indo Premier
-
100
200
300
400
500
600
2008 2009 2010 2011 2012 2013 2014 2015 2016 2017
Building Construction Civil Construction Specialized Construction
21% 19% 18% 19% 19% 19% 19% 17% 17% 17%
49% 53%64% 62% 63% 63% 63% 66% 66% 66%
30% 28%17% 19% 19% 18% 18% 17% 17% 17%
0%
10%
20%
30%
40%
50%
60%
70%
80%
90%
100%
2008 2009 2010 2011 2012 2013 2014 2015 2016 2017
Sumatera Java Ex- Java and Sumatera
1,0%
1,5%
2,0%
2,5%
3,0%
3,5%
3M
11
6M
11
9M
11
20
11
3M
12
6M
12
9M
12
20
12
3M
13
6M
13
9M
13
20
13
3M
14
6M
14
9M
14
20
14
3M
15
6M
15
9M
15
20
15
3M
16
6M
16
9M
16
20
16
3M
17
6M
17
9M
17
20
17
3M
18
6M
18
9M
18
Sumatera W. Java C. Java E. Java Borneo Sulawesi
0%
2%
4%
6%
8%
10%
12%
14%
16%
2008 2009 2010 2011 2012 2013 2014 2015 2016 2017
Material Spending Capital Spending

Cement Sector Update
5 Refer to Important disclosures on the last of this report
Going forward, we stay positive on the infrastructure outlook as Committee for Acceleration of
Priority Infrastructure Delivery (KPPIP) indicated that 66 projects will be completed in 2019 along
with the additional 187 infrastructure projects of which 93 projects and 1 special program (the
construction of 35GW electric generator) are under construction and have started the operation and
the other 94 projects and 1 airplane industry program are on its construction stage. Out of these
projects, KPPIP had selected 37 priority projects with the total investment value of $182bn with
most projects take place in Java and Sumatera that account for 24% of total priority project
investment value and 20% of total priority project number, consecutively. While, more than half of
total priority projects’ investment value (56%) are allocated to Ex-Java/Sumatera region on which
we can expect the positive growth catalysts for cement consumption in the middle and eastern part
of Indonesia on foreseeable future. Our infrastructure and property analyst, Joey Faustian, forecasts
the new contract and order book of our infrastructure coverage (ADHI, PTPP, WIKA, and WSKT) to
deliver a subdued growth at 3-yr CAGR 17-20F of 10% and 15%, consecutively (vs. 5-yr CAGR of
23% and 31%) as the effect of high base from the preceding period.
On the other hand, property sector which is the backbone of overall national cement growth had
painted a dynamic picture over the last 7 years as the nominal property output as of total regional
GDP (fig. 19) suggests Java region which comprises of West Java, Central Java, and East Java
flattens on its ratio of property output to regional GDP whose amounts are 1%, 2%, and 1%,
respectively. This flattening trend was driven by nominal construction GDP growth (7-yr CAGR at
15%) that outpaced real estate GDP growth (7-yr CAGR at 12%). The construction growth was also
slightly above Java nominal GDP (7-yr CAGR at 13%). Sulawesi region posted a slight decrease to
2.92% in 9M18 (from 3.03% in 2010). Conversely, Sumatera and Borneo had seen an increasing
trend over its property output to regional GDP recording at 2.67% and 1.52%, (2010: 2.33% and
1.32%), respectively. This trend was supported by both of construction and real estate growth that
outgrew its respective nominal GDP growth in both Sumatera (7-yr CAGR at 16%, 15%, and 13%,
consecutively) and Borneo (7-yr CAGR at 13%, 16%, and 11%, consecutively).
Fig. 15 : Indonesia Public Debt Profile Fig. 16 : Debt-to-GDP of BBB-rated (Fitch) Emerging Countries
Source : CEIC, Indo Premier Source : Bloomberg, Fitch Ratings, Indo Premier
Fig. 17: New Contract (in Rptn) Forecast of Our Coverage Fig. 18: Order Book (in Rptn) Forecast of Our Coverage
Source : Companies, Indo Premier Source : Companies, Indo Premier
0%
5%
10%
15%
20%
25%
30%
0%
20%
40%
60%
80%
100%
120%
Short-term Portion (%) Long-term Portion (%) Debt-to-GDP
0
10
20
30
40
50
60
70
80
Debt-to-GDP (%) Median (%)
43%
21%
10%
30%
26%
68%
-8%
18%
8% 6%
-20%
-10%
0%
10%
20%
30%
40%
50%
60%
70%
80%
0
50
100
150
200
250
2011 2012 2013 2014 2015 2016 2017 2018F 2019F 2020F
New Contract growth
50%
36%
18%25%
31%
58%
24%
17%15%
13%
0
0,1
0,2
0,3
0,4
0,5
0,6
0,7
0
100
200
300
400
500
600
2011 2012 2013 2014 2015 2016 2017 2018F 2019F 2020F
(Rp Tn) Orderbook growth

Cement Sector Update
6 Refer to Important disclosures on the last of this report
Another useful indicator for observing the trend in property sector development is to see the real
property indicator which is represented by the number of houses built by regional basis (fig. 20) that
showed a 7-yr historical CAGR of 7% from 10 thousand houses in 2010 to 17 thousand houses in
2017. On regional basis, this real measure portrays opposite picture to the gross property output
measure on respective regional GDP where the real measurement suggests that Java region
delivered strong 7-yr historical compounded growth of 9.6%, Sumatera region growth was half of
Java region growth at 4.8%, and Ex-Java/Sumatera region growth lagged behind at 2.1% compared
to national growth. This trend is confirmed by the regional distribution of houses built by region (fig.
21) where Java proportion skyrocketed to 61% in 2017 (2010: 52%), both Sumatera and Ex-
Java/Sumatera proportion was declining to 13% and 26% (2010: 18% and 30%), respectively.
Then, these two nominal and real term measure that are consecutively represented by the gross
property output and number of houses built can be used to imply other interesting trends. Java and
ex-Java nominal property measurement (nominal real estate GDP) were recorded at 7-yr CAGR of
12% and 15%, respectively. Meanwhile, real measurement (number of houses built) were booked at
7-yr CAGR of 9.6% and 3.8%). Given these two measurements, we can conclude that Java property
price increase is slower than ex-Java region and this finding is confirmed by the residential property
price index for 18 major cities (fig. 22) where small cities category, mostly located in ex-Java
region, was gradually up relative to large and medium cities category for the last 27 quarters. Thus,
we could plausibly infer that the building material input (including cement) on ex-Java market is
systematically higher than Java market due to less cement product presence outside the Java region
(fig. 37).
Fig. 19: Gross Property Output (% of regional GDP, 4-q MA) Fig. 20: Number of Houses Built by Region (in thousand unit)
Source : CEIC, Indo Premier Source : CEIC, Indo Premier
Fig. 21: Distribution of Houses Built by Region (%) Fig. 22: Residential Property Price Indices for 18 Major Cities
Source : CEIC, Indo Premier Source : CEIC, Indo Premier
1,0%
1,5%
2,0%
2,5%
3,0%
3,5%
3M
11
6M
11
9M
11
20
11
3M
12
6M
12
9M
12
20
12
3M
13
6M
13
9M
13
20
13
3M
14
6M
14
9M
14
20
14
3M
15
6M
15
9M
15
20
15
3M
16
6M
16
9M
16
20
16
3M
17
6M
17
9M
17
20
17
3M
18
6M
18
9M
18
Sumatera W. Java C. Java E. Java Borneo Sulawesi
2 3 3 2 1 2 3
54
2
53 5
3
78
1010
1
2
33
4
4
5
22
-
2
4
6
8
10
12
14
16
18
2009 2010 2011 2012 2013 2014 2015 2016 2017
Sumatera Java Ex- Java and Sumatera
-
50
100
150
200
250
300
1Q
12
2Q
12
3Q
12
20
12
1Q
13
2Q
13
3Q
13
20
13
1Q
14
2Q
14
3Q
14
20
14
1Q
15
2Q
15
3Q
15
20
15
1Q
16
2Q
16
3Q
16
20
16
1Q
17
2Q
17
3Q
17
20
17
1Q
18
2Q
18
3Q
18
Small Cities Medium Cities Large Cities

Cement Sector Update
7 Refer to Important disclosures on the last of this report
Both infrastructure and property industry showed a solid pace as indicated by growing proportion of
gross construction and property value to the nominal GDP (fig. 23), though it recently slowed due to
the delayed infrastructure and property investment as populist policy usually ensues in political
years (2018 regional head elections and 2019 presidential election) as it can be seen on the
flattened growth on infrastructure budget in upcoming period as indicated by the earmarked state
infrastructure budget of Rp421bn in 2019 (+2.5% yoy). We, however, expect some recoveries going
forward for both infrastructure and property sector. On the other hand, we also see that nation-wide
construction growth (7-yr CAGR of 19%) had progressed in the faster pace than property (7-yr
CAGR of 16.3%) as suggested by the gross output measure. This dynamic has affected the cement
sales composition of bag and bulk for the last couple of years (fig. 24) as the volume growth of bulk
cement (7-yr CAGR of 14%) outstripped the bag cement (7-yr CAGR of 6%) that causes an increase
in bulk proportion to 27% in 9M18 (2010: 16%).
Despite of the growing proportion in bulk volume, we believe the bag volume growth will be
sustained at this rate, if not recovered upward. We also argue that bagged cement sales stems from
the residential houses built on rural areas, most of which are for house renovation. The statistics on
home purchasing plan (fig. 25) that was surveyed by Indonesia Statistical Bureau (BPS) confirms
our view in which most of houses are self-built across regions. Additionally, we think that self-built
home includes the home improvement and renovation. The self-built proportion is particularly high
for the region outside Java on which we can see that Borneo, Sumatera, and Sulawesi scored the
highest figure for self-built category. This also confirms our aforementioned finding on residential
property price (fig. 22) indices about the surging property price trend in small-cities that should
mostly include rural areas.
Fig. 25: Survey on the way home ownership is acquired (BPS, 2016)
Source : BPS, Indo Premier
Region Cities Rural Cities Rural Cities Rural Cities Rural
Sumatera 8.7% 0.6% 13.2% 5.1% 65.1% 81.3% 13.1% 13.0%
G. Jakarta 5.6% - 23.1% - 40.9% - 30.4% -
Java ex G. Jakarta 7.4% 0.3% 10.9% 2.5% 58.4% 75.9% 23.3% 21.4%
Bali, NTT, and NTB 5.3% 0.2% 3.6% 3.0% 72.0% 80.5% 19.2% 16.2%
Borneo 8.6% 0.5% 12.6% 3.2% 68.8% 86.1% 10.0% 10.2%
Sulawesi 8.0% 0.4% 6.8% 5.4% 74.1% 83.2% 11.1% 10.9%
Papua and Maluku 3.5% 0.1% 7.1% 1.9% 78.0% 80.5% 11.3% 17.5%
Indonesia 7.5% 0.4% 11.6% 3.6% 59.8% 78.2% 21.2% 17.8%
Developer Non-developer Self-built Other (Bequest, Grant, etc)
Fig. 23: Construction & Property (% GDP and % yoy, 4-q MA) Fig. 24: Cement Bag and Bulk Share and Its Growth (%)
Source : CEIC, Indo Premier Source : ASI, CEIC, Indo Premier
0%
5%
10%
15%
20%
25%
0%
2%
4%
6%
8%
10%
12%
14%
16%
18%
3M
11
6M
11
9M
11
20
11
3M
12
6M
12
9M
12
20
12
3M
13
6M
13
9M
13
20
13
3M
14
6M
14
9M
14
20
14
3M
15
6M
15
9M
15
20
15
3M
16
6M
16
9M
16
20
16
3M
17
6M
17
9M
17
20
17
3M
18
6M
18
9M
18
Gross Construction Output Gross Real Estate Output
Construction Output Growth (% yoy) - RHS Real Estate Output Growth (% yoy) - RHS
17% 16% 16% 16% 19% 20% 21% 22% 24% 25% 25% 27%
-15%
-5%
5%
15%
25%
35%
45%
0%
10%
20%
30%
40%
50%
60%
70%
80%
90%
100%
2007 2008 2009 2010 2011 2012 2013 2014 2015 2016 2017 9M18
Bag Bulk
Bag Sales Growth (% yoy) Bulk Sales Growth (% yoy)
Cement Sector Update
8 Refer to Important disclosures on the last of this report
Industrial Overview
The industry should see better profitability profile in the wake of improved pricing power and better supply control
We believe this year should be the tipping point for Indonesian cement industry toward recovery
spurred by the industry consolidation and less competition intensity. The industry consolidation
renders the first-tier players (Indocement, Semen Holcim, and Semen Indonesia) to exert significant
influence over the national supply growth with their considerable capacity share (67% of total
national installed capacity) equipped by better coordination as Semen Holcim and Indonesia are now
under one entity.
The price recovery will emanate from the blurry operational sustainability of second-tier players,
especially for Chinese players which are beleaguered with low utilization (below 40%), debt
burdens, and the end of tax holiday period which we think the second-tier will not conduct a price
predatory strategy going forward given their woeful financial performance. We believe the industry
should see better pricing environment going forward.
On the other hand, we see this year to be the inflection point for cement volume growth with
expected growth recoveries in 2020 onwards, though we expect this year with the same growth as
exhibited in 2018 due to political year that typically follows by flat cement growth as populist policy
and a delayed in both of infrastructure and property investment ensue on political year.
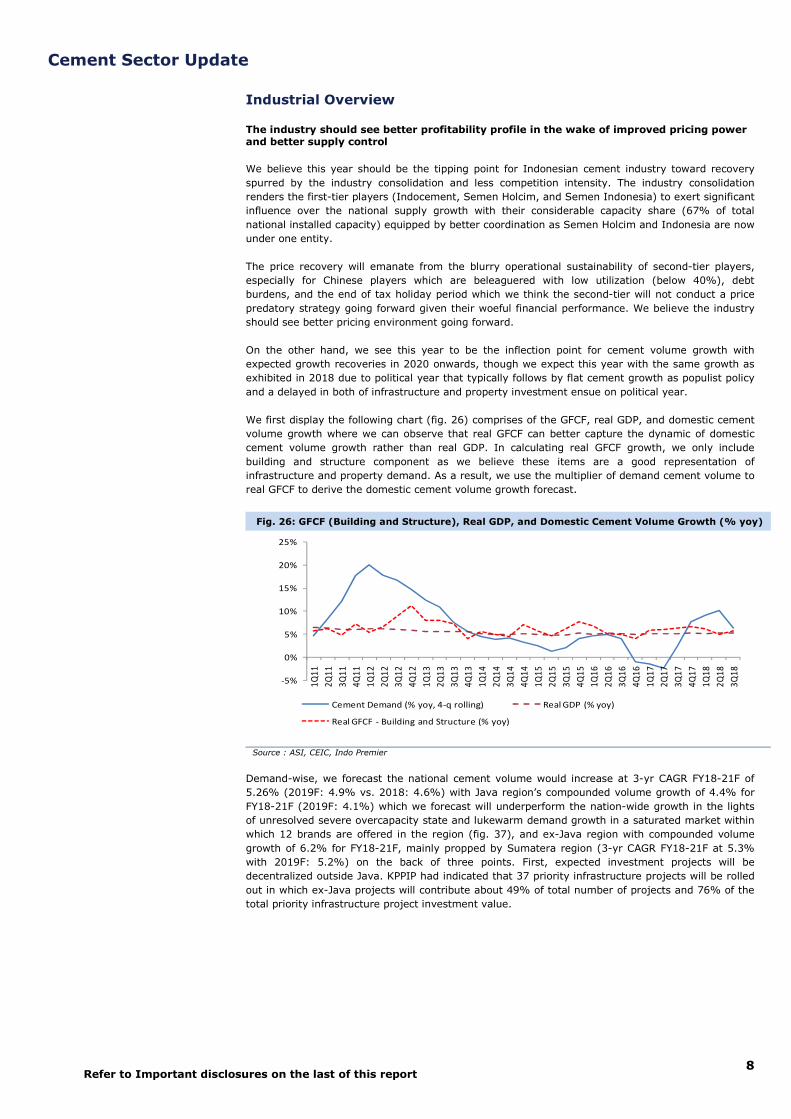
We first display the following chart (fig. 26) comprises of the GFCF, real GDP, and domestic cement
volume growth where we can observe that real GFCF can better capture the dynamic of domestic
cement volume growth rather than real GDP. In calculating real GFCF growth, we only include
building and structure component as we believe these items are a good representation of
infrastructure and property demand. As a result, we use the multiplier of demand cement volume to
real GFCF to derive the domestic cement volume growth forecast.
Fig. 26: GFCF (Building and Structure), Real GDP, and Domestic Cement Volume Growth (% yoy)
Source : ASI, CEIC, Indo Premier
Demand-wise, we forecast the national cement volume would increase at 3-yr CAGR FY18-21F of
5.26% (2019F: 4.9% vs. 2018: 4.6%) with Java region’s compounded volume growth of 4.4% for
FY18-21F (2019F: 4.1%) which we forecast will underperform the nation-wide growth in the lights
of unresolved severe overcapacity state and lukewarm demand growth in a saturated market within
which 12 brands are offered in the region (fig. 37), and ex-Java region with compounded volume
growth of 6.2% for FY18-21F, mainly propped by Sumatera region (3-yr CAGR FY18-21F at 5.3%
with 2019F: 5.2%) on the back of three points. First, expected investment projects will be
decentralized outside Java. KPPIP had indicated that 37 priority infrastructure projects will be rolled
out in which ex-Java projects will contribute about 49% of total number of projects and 76% of the
total priority infrastructure project investment value.
-5%
0%
5%
10%
15%
20%
25%
1Q
11
2Q
11
3Q
11
4Q
11
1Q
12
2Q
12
3Q
12
4Q
12
1Q
13
2Q
13
3Q
13
4Q
13
1Q
14
2Q
14
3Q
14
4Q
14
1Q
15
2Q
15
3Q
15
4Q
15
1Q
16
2Q
16
3Q
16
4Q
16
1Q
17
2Q
17
3Q
17
4Q
17
1Q
18
2Q
18
3Q
18
Cement Demand (% yoy, 4-q rolling) Real GDP (% yoy)
Real GFCF - Building and Structure (% yoy)

Cement Sector Update
9 Refer to Important disclosures on the last of this report
Second, we view Sumatera region as a potential growth engine as it demonstrates a relatively solid
growth indicated by a less growth volatility compared to other regions (fig. 28) and historically holds
more than a fifth of domestic market share which is nearly equivalent to the combined market share
of Ex-Java/Sumatera region (fig. 30). Third, solid property growth is expected following the populist
policy in 2019 as it increases the purchasing power through higher disposable income which could
then serve as a positive catalyst for cement bag consumption as it is mostly used for house
renovation or self-built houses in many rural areas, and expected property investment recoveries in
2020 onwards.
Supply-wise, we come with the growth forecast (fig. 31) of 2.7% CAGR FY18-21F as this will come
from the realized capacity expansion done by several second-tier players though we are skeptical on
their capability to effectively utilize their new capacity due to lack of scale to explore other markets.
We thus account this by narrowing down the industry excess capacity to 35mt in 2021F (2018:
37.7mt) and an improved sales-to-installed capacity ratio (fig. 32) to 74% (2018: 71%) as triggered
by recoveries in first-tier sales volume compounded growth of 6% in FY18-21F and flattish second-
tier sales volume compounded growth of 0.7% in FY18-21F.
In sum, the prospect of reduced demand and supply imbalances should help driving price recovery
going ahead. We believe the first-tier players are in the better position to capitalize this momentum
due to their extensive product, mills presence, and better costs structure compared to second-tier
players. We believe industry profitability profile should improve going ahead.
Fig. 27: Domestic Cement Volume-to-Real GFCF Multiplier (x) Fig. 28: Historical and Forecasted Cement Volume Growth
Source : ASI, CEIC, Indo Premier Source : ASI, CEIC, Indo Premier
Fig. 29: Quarterly Cement Demand Growth (% yoy, 4-q rolling) Fig. 30: Historical and Forecasted Volume Distribution
Source : ASI, CEIC, Indo Premier Source : ASI, CEIC, Indo Premier
(0,7)
(0,2)
0,3
0,8
1,3
1,8
2,3
2,8
2011 2012 2013 2014 2015 2016 2017 2018F 2019F 2020F 2021F
Java Sumatera Ex- Java and Sumatera
-5%
0%
5%
10%
15%
20%
2009 2010 2011 2012 2013 2014 2015 2016 2017 2018F 2019F 2020F 2021F
Java Sumatera Ex- Java and Sumatera
-10%
-5%
0%
5%
10%
15%
20%
25%
Java Sumatera Ex- Java and Sumatera
56% 55% 54% 55% 55% 56% 56% 56% 54% 56% 56% 56% 55% 55%
23% 23% 24% 23% 22% 21% 21% 21% 22% 21% 21% 22% 22% 22%
21% 22% 22% 22% 23% 23% 23% 23% 24% 22% 22% 23% 23% 24%
0%
20%
40%
60%
80%
100%
2008 2009 2010 2011 2012 2013 2014 2015 2016 2017 2018F 2019F 2020F 2021F
Java Sumatera Ex- Java and Sumatera

Cement Sector Update
10 Refer to Important disclosures on the last of this report
Regional Analysis
Java region: a saturated market whose growth is haunted by both malignant overcapacity and tepid demand
Java market has long been the closely watched region to see the overall picture of how cement
industry in Indonesia fares as this region exerts significant influence in driving the overall demand
and supply growth of Indonesian cement industry. As suggested by the total Java sales volume (in
fig. 33), we can see that Java market share consistently tops 54% though attached with volatility in
its movement. This makes the region to be a home market for some well-established first-tier
cement players (Indocement, Semen Holcim, and Semen Indonesia) as well as the market
destination for new entrants which were recently dominated by Chinese-based companies. Many of
these companies are situated in West Java region because this sub-region holds considerable market
share in Java at 47% in 2017 though its share had declined from 51% in 2009.
The reason of declining West Java market share cannot be separated with the issue of excess
capacity (fig. 35) that still persists. As of 2017, West Java alone registered a 31mt in excess
capacity that accounts for 69% of total domestic excess capacity of 45.3mt. This sub-region is
beleaguered with two main issues brought by second-tier Chinese players (Juishin, Sun Fook,
Haohan, and Anhui cement). First, an over aggressive expansion by second-tier Chinese players (3-
yr CAGR FY15-18 of 41% vs. industry at 10%) spread across from Merak to Sukabumi. Though,
Indocement owns substantial capacity share of 55% as of total West Java installed capacity. The
second-tier Chinese players also grab 31% of capacity share which makes their products to have a
relatively equal presence.
Fig. 31: Indonesian Cement Supply Growth Outlook Fig. 32: Excess Capacity and Sales-to-Installed Capacity (%)
Source : ASI, CEIC, Indo Premier Source : ASI, CEIC, Indo Premier
Fig. 33: Java Volume (mt) and Its Market Share (%) Fig. 34: Java Demand Composition (%)
Source : ASI, CEIC, Indo Premier Source : ASI, CEIC, Indo Premier
-10%
0%
10%
20%
30%
40%
50%
-
20
40
60
80
100
120
140
Total Installed Capacity Growth (% yoy)
-5%
10%
25%
40%
55%
70%
85%
100%
0
20
40
60
80
100
120
140
2008 2009 2010 2011 2012 2013 2014 2015 2016 2017 2018F 2019F 2020F 2021FTotal Sales Volume (mt)
Total Industry Excess Capacity (mt)
Sales to Installed Capacity (%)- RHS
53.5%
54.0%
54.5%
55.0%
55.5%
56.0%
56.5%
57.0%
-
5
10
15
20
25
30
35
40
45
50
Java Sales Volume (mt) Market Share (%) - RHS
51% 52% 55% 54% 53% 53% 52% 49% 47%
24% 23% 23% 23% 24% 23% 24%26% 27%
25% 25% 23% 23% 23% 24% 24% 25% 25%
0%
10%
20%
30%
40%
50%
60%
70%
80%
90%
100%
2009 2010 2011 2012 2013 2014 2015 2016 2017
W. Java C. Java E. Java

Cement Sector Update
11 Refer to Important disclosures on the last of this report
Second, second-tier Chinese players implemented a predatory pricing strategy to seize market
share. In fact, Indocement launched its fighting brand (Rajawali) in October 2016 to combat with
pricing issue. These two issues obviously bring disruption into the industry as it is depicted on
quarterly volume performance (fig. 36) in which West Java exhibits the most volatile volume growth
over time.
The other sub regions, Central and Eastern Java, share the same excess capacity issue as in West
Java, albeit with a benign excess. These two sub regions also comprises of domestic first-tier and
second-tier players (fig. 37) on which we think domestic second-tier players have a different pricing
strategy vis-à-vis the second-tier Chinese players. Domestic second-tier players tend to be a price
taker and their pricing mostly dictates the first-tier players. Even though, the price competition does
happen between first-tier and second-tier, it is contained in a specific location and does not intend
to initiate a price war which inflicts the profitability.
As a result, the volume growth volatility in Central and Eastern Java are slightly better than West
Java. We can also observe that Central Java delivered best volume growth with less volatility post
2015 as it carries the least excess capacity figure in Java region (W. Java: 31mt, C.Java: 6.4mt, and
E.Java:10.6mt) with less second-tier player presence as indicated by their capacity share at 26% as
of total Central Java installed capacity. While, second-tier players in Eastern Java possesses 36% of
capacity share.
Fig. 37: Map of Major Indonesia Cement Manufacturers
Source : Companies, Indo Premier
Fig. 35: Demand, Excess Capacity, and Market Share of Java Fig. 36: Quarterly Java Volume Growth (% yoy, 4-q rolling)
Source : ASI, CEIC, Indo Premier Source : ASI, CEIC, Indo Premier
13.7%
13.8%
13.9%
14.0%
14.1%
14.2%
14.3%
14.4%
14.5%
14.6%
0
5
10
15
20
25
30
35
40
45
W. Java C. Java E. Java
Demand (mt) Excess Capacity (mt) Market Share (%)- RHS
-11%
-6%
-1%
4%
9%
14%
19%
24%
29%
W. Java C. Java E. Java

Cement Sector Update
12 Refer to Important disclosures on the last of this report
Going forward, we forecast Java cement volume to grow at a compounded rate of 4.4% in FY18-21F
(2019F: 4.1%) to 44mt in FY21F (from 39mt in FY18) on the back of a postponed infrastructure and
property project in FY19F as it is an usual case for the period that precedes the political years as
suggested in the quarterly Java volume data (fig. 36) in which the year of previous presidential
election took place in 2015 was followed with a decline in cement volume trend. Nevertheless, we
expect growth normalization in FY20F-FY21F in the lights of resuming infrastructure projects. KPPIP
had indicated that 93 infrastructure projects plus 2 special programs will be laid out. Moreover,
under infrastructure project priority lists, Java was awarded by 19 priority projects which account for
51% of the total projects or 24% of total priority project investment value.
Ex-java region: markets with less player presence and benign demand and supply imbalances
Ex-Java region consists of Sumatera, Borneo, Bali, NT, Maluku, and Papua which we will henceforth
categorize as two main sub regions, Sumatera and Ex-Java/Sumatera (consists of Borneo, Sulawesi,
NT, Maluku, and Papua). The characteristic of growth in these two regions are distinctive as
suggested by their growth over the last 16 quarters (fig. 38). In our view, Sumatera shares the
same market traits with Java region as suggested by their economic growth characteristic which
represented by Java and Sumatera nominal GDP measurement that expanded at 7-yr historical
CAGR of 13% and 12.9%, consecutively. Sumatera has also provided a less volatile volume growth
relative to Java region in the light of less cement players’ presence (fig. 37) and some players have
established their market with strong foothold, for instance Semen Baturaja and Padang that
exclusively focus their operation in South Sumatera and Central Sumatera, respectively. Therefore,
the possibility of severe price war is less likely to happen.
On the other hand, Ex-Java/Sumatera region has a characteristic of a significant volatility in its
volume growth that tends to amplify the national cement volume growth (fig. 39). One of the
reasons for this growth characteristic is that this region includes Borneo (with 28% volume share of
total Ex-Java/Sumatera volume) that is a base for some coal mining players. Moreover, Eastern and
Southern Borneo are known to be the largest coal production contributor to the nation. Ex-
Java/Sumatera volume growth are thus fairly exposed to the movement of coal prices. We
superimpose 12-month moving average coal price with 4-q rolling Ex-Java/Sumatera (the moving
average and rolling treatment are to reduce the seasonality effect) on which we can observe that
the movement of cement volume can be partially explained by the Indonesian coal benchmark
movement in recent three quarters.
This region also has a benign demand and supply imbalances with Sumatera region recorded 7.9mt
over capacity (only 17% of total national excess capacity) and the eastern Indonesia (Maluku, Bali,
NT, and Papua) actually experiences a deficit in supply of 5mt (fig. 40). In particular, Sumatera
overcapacity case is similar to Central Java region where it consists of second-tier domestic players,
like Semen Baturaja (SOE) and Semen Bosowa.
These players do not have a tendency to initiate a price war among players. Specifically for
Sumatera region, we argue that market operation is clustered as for Semen Baturaja settles in
South Sumatera, Lafarge Holcim Indonesia in North Sumatera, and both of Semen Padang and
Bosowa place their operation in Central Sumatera.
Fig. 38: Quarterly Cement Demand Growth (% yoy, 4-q rolling) Fig. 39: Ex-Java & Sumatera Growth vs. Indo. Coal Benchmark
Source : ASI, CEIC, Indo Premier Source : ASI, CEIC, Indo Premier
-5%
0%
5%
10%
15%
20%
25%
Java Sumatera
Ex- Java and Sumatera Total Indonesia
-
20
40
60
80
100
120
140
-10%
-5%
0%
5%
10%
15%
20%
25%
Ex- Java and Sumatera Volume (% yoy, 4-q rolling)
Indonesian Coal Benchmark (US$/t, 12m-MA)

Cement Sector Update
13 Refer to Important disclosures on the last of this report
On the other hand, both Sumatera and Ex-Java/Sumatera have 44% volume share as of total
nation-wide volume (fig. 41). Going forward, we forecast Sumatera (fig. 42) and Ex-Java/Sumatera
(fig. 43) region will set a compounded growth of 5.36% (2019F: 5.2%) and 7.05% (2019F: 6.4%)
consecutively. This brings a total ex-Java volume of 36.6mt in 2021 (3-yr CAGR 18-21F of 6.2%) as
government also indicates that this region will be apportioned with 18 government infrastructure
priority project with the total investment value of $139bn (76% of total infrastructure priority
budget) and a populist policy will improve bag consumption as well through government’s social
subsidy programs. Then, this region is capable of fueling the domestic cement growth engine going
forward as we expect the room of capacity deficit will be filled by Semen Indonesia that has
extensive logistical network altogether with enough economics of scale to run such a vast market
operation.
Supply outlook: expected overcapacity alleviation should be the major impetus for an improved pricing power
We believe the recent industry consolidation led by the merger of Semen Indonesia and Lafarge
Holcim Indonesia should cater a positive catalyst to industry in the form of a better supply control
by first-tier players (Indocement, Semen Holcim, and Semen Indonesia) which have 67% of
capacity share as of 2017 (fig. 45). Moreover, we view that second-tier players lurch forward to
maintain their operations as the lack of economics of scale and scope despite their growing capacity
share (fig. 45) of 33% in 2017 (2010: 9%) on which we believe this should lever up the pricing
power of first-tier company as reasoned the following argument. Second-tier players have been
struggling to keep up with industry’s proper utilization rate as these players have a lack of
economics of scale and scope to run their business. The nature of our country geographic profile
that consists of many islands and thousands of islets poses a logistical challenge for delivering
products to their desired market target that makes the positioning of cement and clinker mills a
critical issue for Indonesian cement players.
Fig. 40: Demand, Excess Capacity, and Market Share of Ex-Java Fig. 41: Regional Demand, Excess Capacity, and Market Share
Source : ASI, CEIC, Indo Premier Source : ASI, CEIC, Indo Premier
Fig. 42: Sumatera Volume(mt) and Its Market Share Fig. 43: Ex- Java and Sumatera Volume (mt) and Market Share
Source : ASI, CEIC, Indo Premier Source : ASI, CEIC, Indo Premier
0%
5%
10%
15%
20%
25%
(5)
-
5
10
15
20
25
Sumatera Borneo Eastern Indonesia
Demand (mt) Excess Capacity (mt) Market Share (%)- RHS
0%
10%
20%
30%
40%
50%
60%
(5.0)
5.0
15.0
25.0
35.0
45.0
55.0
65.0
75.0
85.0
Java Sumatera Ex- Java and Sumatera
Demand (mt) Excess Capacity (mt) Market Share (%)- RHS
20.5%
21.0%
21.5%
22.0%
22.5%
23.0%
23.5%
24.0%
-
2
4
6
8
10
12
14
16
18
20
Sumatera Sales Volume (mt) Market Share (%) - RHS
20.5%
21.0%
21.5%
22.0%
22.5%
23.0%
23.5%
24.0%
-
5
10
15
20
25
Ex- Java and Sumatera Volume (mt) Market Share (%) - RHS

Cement Sector Update
14 Refer to Important disclosures on the last of this report
Furthermore, this problem is compounded with the product nature that is unable to last long that
raises the need of special inventory facility (storage silos in desired market targets). So, extensive
logistical (sea ports, logistical ships, etc.) and packaging facility are essential to maintain operational
efficiencies. The absence of these critical aspects makes it hard for second-tier (both Chinese- and
domestic-based) players to sustain their operational efficiency, let alone achieving profitability. It is
reflected on consistently a lower sales-to-installed capacity of second-tier players that decouples in
trend with first-tier players (fig. 46) compared to first-tier players (Indocement, Semen Holcim, and
Semen Indonesia). On average, the sales-to-installed capacity of second-tier players (at 64%) has
been 19% lower than first-tier players (at 83%) for the last seven years. This ratio
underperformance is particularly pronounced for second-tier Chinese players (fig. 47) whose
capacity is always below 60% as we think the strategy of invading West Java market is
inappropriate for players without proper scope and scale.
The harsh competition environment in Java had caused several second-tier cement players lurches
forward to maintain their operation, if not ceased their activity and went bankrupt. For instance,
Anhui Conch operations are on the brink of the ending of tax holiday period which adds pressure to
maintain their operations and profitability. Semen Bosowa and Gombong’s loan performances had
recently been declared non-performing at several banks at which they are now seeking a strategic
investor to help them sustaining the operation.
This development together with recently announced merger of Semen Indonesia and Lafarge Holcim
Indonesia are positive for the industry supply outlook as post-merged Semen Indonesia’s capacity
share (fig. 48) improves in Sumatera, West Java, Central Java, and East Java to 63%, 14%, 81%,
and 42%, respectively; compared to pre-merged capacity share of 56%, 0%, 64%, and 42%. Post-
merger Semen Indonesia’s aggregate capacity share also increases to 43% (from 31%).
Indocement, on the other hand, has an aggregate capacity share of 23% which comprises of West
Java and Borneo’s capacity share of 55% and 34%.
Fig. 44: Snapshot on Excess Capacity by Regions Fig. 45: First-tier and Second-tier Capacity Share (%)
Source : ASI, CEIC, Indo Premier Source : ASI, CEIC, Indo Premier
Fig. 46: Capacity Share with Sales-to-Installed Cap. (%) Fig. 47: Chinese Player Utilization Rate (Conch and Jui Shin)
Source : ASI, CEIC, Indo Premier Source : ASI, CEIC, Indo Premier
0%
10%
20%
30%
40%
50%
60%
(10.0)
-
10.0
20.0
30.0
40.0
50.0
60.0
70.0
80.0
90.0
W. Java C. Java E. Java Java Sumatera Borneo Eastern
Indonesia
Demand (mt) Excess Capacity (mt) Market Share (%)- RHS
0%
10%
20%
30%
40%
50%
60%
70%
80%
90%
100%
19
94
19
95
19
96
19
97
19
98
19
99
20
00
20
01
20
02
20
03
20
04
20
05
20
06
20
07
20
08
20
09
20
10
20
11
20
12
20
13
20
14
20
15
20
16
20
17
20
18
F
20
19
F
20
20
F
20
21
F
Share of First-tier Players (% total Installed Cap.) Share of Second-tier Players
0%
10%
20%
30%
40%
50%
60%
70%
80%
90%
100%
0%
10%
20%
30%
40%
50%
60%
70%
80%
90%
100%
First-tier Players (mt) Second-Tier Players (mt)
First-tier Sales to Installed Capacity (%) - RHS Second-tier Sales to Installed Capacity S(%) - RHS
-10%
0%
10%
20%
30%
40%
50%
60%
70%
-
0,5
1,0
1,5
2,0
2,5
3,0
3,5
4,0
4,5
Sales Volume (mt, 4-q rolling) Sales to Installed Capacity (%)

Cement Sector Update
15 Refer to Important disclosures on the last of this report
Fig. 48: Capacity Share of First-tier Players in Overcapacity Regions
Source : ASI, CEIC, Indo Premier
Fig. 49: Capacity Share of Second-tier Players in Overcapacity Regions
Source : ASI, CEIC, Indo Premier
First-tier capacity share for West Java, East Java and Sumatera (account for 89% of nation-wide
overcapacity) are then gauged at 69%, 81%, and 63%, respectively, post industry consolidation. In
addition, The first-tier players are now consisting of only two players (Indocement and Semen
Indonesia) that enable better coordination to control regional supply growth, if not on nation-wide
scale, as we also see that second-tier capacity share is only strong on several regions (fig. 49). We
believe an increased pricing power will be the by-product of both better supply control by first-tier
players and reduced second-tier players’ retail product presence as their operation topple over with
specific intra-company problems as main consequence of initiating a price wars with lack of scale
and scope.
0%
20%
40%
60%
80%
100%
Sumatera
Sulawesi
BorneoW. Java
E. Java
Pre-merged SMGR INTP Post-merged SMGR First-tier Players
0%
10%
20%
30%
40%
50%
60%
70%Sumatera
Sulawesi
Borneo
W. Java
E. Java
C. Java
Second-tier Players
Fig. 50: First-tier Sales-to-Installed Capacity Fig. 51: Second-tier Sales-to-Installed Capacity (%)
Source : ASI, CEIC, Indo Premier Source : ASI, CEIC, Indo Premier
0%
10%
20%
30%
40%
50%
60%
70%
80%
90%
100%
-
10
20
30
40
50
60
70
Sales Volume (mt) Excess Capacity (mt)
Sales-to-Installed Capacity (%) - RHS
0%
10%
20%
30%
40%
50%
60%
70%
80%
90%
100%
(3)
2
7
12
17
22
27
32
37
42
Sales Volume (mt) Excess Capacity (mt)
Sales-to-Installed Capacity (%) - RHS

Cement Sector Update
16 Refer to Important disclosures on the last of this report
Thus, we forecast a flat supply growth at 3-yr CAGR FY18-21F of 2.7% (2019: 113mt; +4.7% yoy)
to 116mt in 2021F (2017: 107mt) to account the industry development, with additional capacity of
1.5mt from Semen Kupang third facility and Anhui Conch additional Sepinang and Merak cement
mills of 3.6mt and 0.8mt, in FY19F and FY21F. Though, we question their capability to assume the
operation of these additional cement mills. We assumed no additional capacity for first-tier players
for the forecasted periods and also narrow down industry excess capacity to 38mt in 2021F (2017:
41mt) with the expected improvement for first-tier players and deterioration for second-tier players
in their excess capacity of 8mt (2017: 18mt) and 30mt (2017: 23mt), respectively.
Industry competition landscape: first-tier players are the winner from industry consolidation
We view Indonesian cement industry has an oligopoly-alike market structure because the industry
has the number of sellers that are originally few (prior to the incoming of Chinese players),
homogeneous product offered, high barrier entries, and some firms hold pricing power attribute.
This oligopoly market structure puts competitive advantage as an important aspect to consider. The
need of mapping the competition is increasing after second-tier Chinese players settled their
presence in the region with aggressive expansion and predatory pricing strategy.
We first exhibit the sales performance of first-tier (fig. 52) and second-tier players (fig. 53) where
we can see that first-tier players generally outperformed their 10-yr compounded growth and the
otherwise for second-tier players prior to 2014. The trend suddenly changed for the period of 2015-
2017 where second-tier players was able to score above 30% growth in 2015 and 2016 while first-
tier players’ sales growth plummeted well below their compounded growth in pertaining period.
This change in trend can be explained by both of a commencement of second-tier Chinese players
(Juishin and Anhui) and some of foreign-JV second tier player (Siam Cement and Semen
MerahPutih) in 2015 with combined additional capacity of 6.9mt (c.10% of total capacity of 70mt in
2014) and government price intervention in curtailing the cement retail price as much as Rp3,000
per sack for SOE cement companies.
These led significant industry disruptions that were aggravated by predatory pricing strategy by the
newcomers (especially second-tier Chinese players). This pricing strategy proved to be effective to
establish some market position which can be seen on the bag (fig. 54) and bulk (fig. 55) volume
proportion of first-tier and second-tier players where Chinese players gained a share on national bag
and bulk sales with the larger proportion in bag format as they apply the pricing strategy at retail
level to gain brand recognitions. This effectively spurred a growth creation, albeit proven to be
short-lived, unsustainable growth.
Fig. 52: First-tier Sales Performance Fig. 53: Second-tier Sales Performance
Source : ASI, CEIC, Indo Premier Source : ASI, CEIC, Indo Premier
-6%
-1%
4%
9%
14%
19%
0
10
20
30
40
50
60
70
80
First-tier Player (mt) Growth (%, 10-yr CAGR) Growth (% yoy)
-10%
0%
10%
20%
30%
40%
50%
60%
0
2
4
6
8
10
12
2007 2008 2009 2010 2011 2012 2013 2014 2015 2016 2017 2018F2019F2020F2021F
Second-Tier Player (mt) Growth (%, 10-yr CAGR) Growth (% yoy)

Cement Sector Update
17 Refer to Important disclosures on the last of this report
This unsustainable growth quality of second-tier players is attributable to several facts. We view
newcomers’ predatory pricing strategy is inappropriate for oligopoly market structure that rely on
economics of scope and scale to gain both market share and price power over the market. These
aspects are not owned by most of second-tier players. The scope relates to how well the business
can distribute the cost over the quantity produced that operates as a function of their mills (both
clinker and cement) capacity and location, logistical network and capability, as well as bargaining
power to suppliers. The mills location is particularly important as it defines their home market and
confines their market exploration. This aspect dictates the players’ product presence which is one of
the key success to maintain market share as we believe the customers is not only price-sensitive
but they also value the consistency in product presence at retail level as most people are still
purchasing cement in proximity to their residential area and it is confirmed by the survey by
Indonesian Statistical Bureau.
In conjunction with the way of home ownership is acquired (fig. 25), Indonesian Statistical Bureau
(BPS) also conducts another survey on the payment plan for the purchased home (fig. 58) where we
see that people build their home themselves and opted the cash payment across region, especially
in rural area. In our view, this implies that people are still purchasing the home material input
nearby their locality as this case is particularly relevant for rural area which we believe cement
players that has extensive presence across regions will be directly benefited.
Fig. 54: Bag Volume Share of First-tier and Second-tier Fig. 55: Bulk Volume Share of First-tier and Second-tier
Source : ASI, CEIC, Indo Premier Source : ASI, CEIC, Indo Premier
Fig. 56: First-tier Sales Proportion by Bag and Bulk Fig. 57: Second-tier Sales Proportion by Bag and Bulk
Source : ASI, CEIC, Indo Premier Source : ASI, CEIC, Indo Premier
94% 93% 92% 91% 91% 91% 92% 92% 89%83% 81% 80%
6% 7% 8% 9% 9% 9% 8% 8% 10% 13% 14% 13%
0%
10%
20%
30%
40%
50%
60%
70%
80%
90%
100%
2007 2008 2009 2010 2011 2012 2013 2014 2015 2016 2017 9M18
First-tier Second-tier Chinese Second-tier Ex-Chinese
94% 95% 94% 94% 94% 93% 92% 92%85%
80% 79% 81%
6% 5% 6% 6% 6% 7% 8% 8% 11%16% 15% 13%
0%
10%
20%
30%
40%
50%
60%
70%
80%
90%
100%
2007 2008 2009 2010 2011 2012 2013 2014 2015 2016 2017 9M18
First-tier Second-tier Chinese Second-tier Ex-Chinese
83% 84% 84% 83% 81% 80% 79% 78% 77% 76% 76% 73%
17% 16% 16% 17% 19% 20% 21% 22% 23% 24% 24% 27%
0%
10%
20%
30%
40%
50%
60%
70%
80%
90%
100%
2007 2008 2009 2010 2011 2012 2013 2014 2015 2016 2017 9M18
Bag Bulk
82%89% 87% 89% 86% 84%
79% 79%71% 72% 73% 74%
18%11% 13% 11% 14% 16%
21% 21%29% 28% 27% 26%
0%
10%
20%
30%
40%
50%
60%
70%
80%
90%
100%
2007 2008 2009 2010 2011 2012 2013 2014 2015 2016 2017 9M18
Bag Bulk

Cement Sector Update
18 Refer to Important disclosures on the last of this report
Fig. 58: Survey on Home Purchasing Plan (BPS, 2016)
Source : BPS, Indo Premier
We observed that most of second-tier players base their mills in Java region where their direct
competitors are the first-tier players that have an advantage of well-established brand recognition,
distribution channel, and have printed strong retail presence for a long time. To understand this, we
present the seaport and packing plant location of first-tier player to give a picture of how well their
distribution capabilities are (fig. 59).
Fig. 59 : Packing Plants and Sea Ports Facilities of First-tier Players
Source : Companies, Indo Premier
Second-tier players found a hardship to establish an extensive retail presence given their lack of
scale and scope together with weak distribution channel. We believe first-tier players are in the
great position to capture the advantage of post industry consolidation that further enhances their
product retail presence given the resulted synergy of Semen Indonesia and Lafarge Holcim
Indonesia’s extensive distribution networks.
Second-tier players also found it hard to pass through some of the costs to their product. This is
specifically a main challenge of second-tier Chinese players that see more pressures on profitability
as the result of their pricing strategy (even Holcim Indonesia only managed to book a break-even on
operating-level as of 9M18). We present the several cost ratio as of sales for cement listed
companies (most of them are first-tier players with Semen Baturaja as the only second-tier player)
to give a glance on their costs structure.
Region Cities Rural Cities Rural Cities Rural Cities Rural
Sumatera 57% 71% 29% 5% 11% 20% 3% 4%
Java ex G. Jakarta 62% 90% 32% 4% 5% 4% 1% 2%
Bali, NTT, and NTB 37% 63% 53% 11% 9% 24% 1% 2%
Borneo 55% 77% 30% 2% 12% 19% 3% 2%
Sulawesi 51% 82% 44% 1% 3% 13% 1% 3%
Papua and Maluku 72% 77% 15% 0% 9% 9% 3% 14%
Indonesia 59% 82% 34% 4% 6% 11% 2% 3%
Cash Mortgage Non-mortgage Installment Others

Cement Sector Update
19 Refer to Important disclosures on the last of this report
The two costs that serve as critical factor in shaping profitability are energy usage and logistical
costs as these costs altogether occupy about 30-40% of the sales, with the exception of Semen
Baturaja of 15% of sales as these company frequently engages in clinker purchase from other
parties (related or third-parties). As we can see on the energy costs trend (fig. 60), Indocement,
who has reasonably achieved proper scale and scope, carries highest energy costs proportion as of
sales over time compared to Semen Indonesia and Baturaja that are SOEs which have better
bargaining power to suppliers as the nation’s major energy input producers (coal, electricity, fuels,
and gas) is also SOEs.
Logistical cost is another important thing to watch (fig. 61) as we can see Indocement again has the
largest logistical costs as of its sales. This is partly due to the location of its mills (fig. 37) and
seaport location (fig. 59) that are heavily concentrated in Java region, but markets its product
across islands. While, Semen Baturaja is able to keep their logistical low despite having a
concentrated mills location (fig. 37), because Semen Baturaja places a focused operational location
exclusively in South Sumatera which does not entail transporting the products inter-islands.
We thus view second-tier players to encounter difficulties to stay afloat in business with such a low
mills utilizations (below 40% in 2017, depicted in fig. 46). Moreover, we deem second-tier Chinese
players to be under more pressure as we noted that Anhui Conch started its investment in 2011
granted with tax holiday for 7 years. It means Anhui will have to start paying taxes for running its
operation in this year. We believe the end of tax holiday period will soon come for the other Chinese
players. The combination of low utilization, leverage on the books, and the end of tax holiday period
should hamper the second-tier players to aggressively implement aggressive pricing and capacity
expansion. Thus, we expect some price recoveries and subdued supply growth for Indonesian
cement industry in foreseeable future in which we believe first-tier players will lead the price and
supply control post industry consolidation and readily monetize this momentum to improve their
profitability.
Company Positioning
Semen Indonesia will be our top pick this year and Semen Baturaja is our least preferred pick for those seeking an exposure in sector
The industry consolidation should enable selective recovery for Indonesia cement players. We think
this should give more benefit for the players who have the attributes of extensive production and
logistical facilities. We opt for Semen Indonesia as our top pick as we consider this company has the
aforementioned attributes. In the event of the merger with Semen Holcim, we should expect further
rising on scale and scope of Semen Indonesia. Semen Holcim, in turn, should also expect some
synergies with Semen Indonesia.
We also noted that the Holcim brand usage will be ceased in 2020 though we believe that
Indonesian customers are price sensitive rather than brand sensitive. As a result, the company who
can offer the product with lower price relative to the competitors and consistent in the retail
presence should win over the market which we think Semen Indonesia is able to do those things and
better prepared to capitalize on this industry consolidation momentum.
Fig. 60: Energy Costs as of Sales (%) Fig. 61: Logistical Costs as of Sales (%)
Source : Companies, Indo Premier Source : Companies, Indo Premier
0%
5%
10%
15%
20%
25%
30%
35%
SMGR INTP SMBR
0%
2%
4%
6%
8%
10%
12%
14%
16%
2009 2010 2011 2012 2013 2014 2015 2016 2017 2018F 2019F 2020F 2021F
SMGR SMCB INTP SMBR

Cement Sector Update
20 Refer to Important disclosures on the last of this report
We take into account the industry consolidation by placing higher volume share for Semen Indonesia
and flat volume share for Indocement, Semen Baturaja, and Semen Holcim. We reason that the
synergy created from the merger of Semen Holcim and Semen Indonesia will enable Semen
Indonesia to strengthen their product presence through joining the extensive logistical hub of both
companies. Specifically, Holcim owns a sea port facility in outermost of West Java (fig. 59) enables
both Semen Indonesia to cater its product (cement or clinker) to South Sumatera and a cement
mills facility in Naragong (fig. 37), West Java that should be used to further solidify Semen
Indonesia presence in Java, with the cautions on persistent and pervasive competition. We account
this by lowering Semen Indonesia’s volume share to approximate Indocement’s share as we assume
price recovery in the region that entails with a slight reduction in volume share.
We should expect an improvement in both Sumatera (fig. 64) and Ex-Java/Sumatera volume share
of Semen Indonesia (fig. 65). Semen Indonesia will be able to extend its presence in Northern
Sumatera by utilizing Holcim’s facility in Andalas for both domestic sales and foreign sales.
Meanwhile, other companies should see a gradual increase in the region over time. For the Ex-
Java/Sumatera region, the industry consolidation will result to a more efficient means to cater the
product outside Java to Borneo region through the joint used of both Semen Holcim and Indonesia
seaport and packing plant facilities (fig. 59).
We thus expect significant improvement in Ex-Java/Sumatera volume share for Semen Indonesia
and gradual increase for both Indocement and Semen Holcim in forecasted period. In sum, we view
the holistic-oriented marketeering players (Semen Holcim and Semen Indonesia) should be able to
hike its national volume share while clustered-oriented marketeering players (Indocement and
Semen Baturaja) should see a flat trend over its national volume share (fig. 66).
Fig. 62: Volume Share of Our Coverage Fig. 63: Java Volume Share of Our Coverage
Source : Companies, Indo Premier Source : ASI, Companies, Indo Premier
Fig. 64: Sumatera Volume Share of Our Coverage Fig. 65: Ex-Java & Sumatera Volume Share of Our Coverage
Source : ASI, Companies, Indo Premier Source :ASI, Companies, Indo Premier
44% 45%43%
41% 41%
44% 44%42% 43% 44%
40% 40% 41% 42%
32%30% 31% 32% 32%
30% 30%
27% 26% 25% 26% 26% 26% 26%
14% 14% 14%16% 16% 15% 15% 14%
12%15% 15% 15% 15% 15%
3% 3% 3% 3% 2% 2% 2% 2% 3% 3% 3% 3% 3% 3%
0%
5%
10%
15%
20%
25%
30%
35%
40%
45%
50%
SMGR INTP SMCB SMBR
0%
5%
10%
15%
20%
25%
30%
35%
40%
45%
2009 2010 2011 2012 2013 2014 2015 2016 2017 2018F 2019F 2020F 2021F
SMGR INTP SMCB SMBR
0%
5%
10%
15%
20%
25%
30%
35%
40%
45%
50%
2009 2010 2011 2012 2013 2014 2015 2016 2017 2018F 2019F 2020F 2021F
SMGR INTP SMCB SMBR
0%
10%
20%
30%
40%
50%
60%
70%
80%
2009 2010 2011 2012 2013 2014 2015 2016 2017 2018F 2019F 2020F 2021F
SMGR INTP SMCB SMBR
Cement Sector Update
Refer to Important disclosures on the last of this report
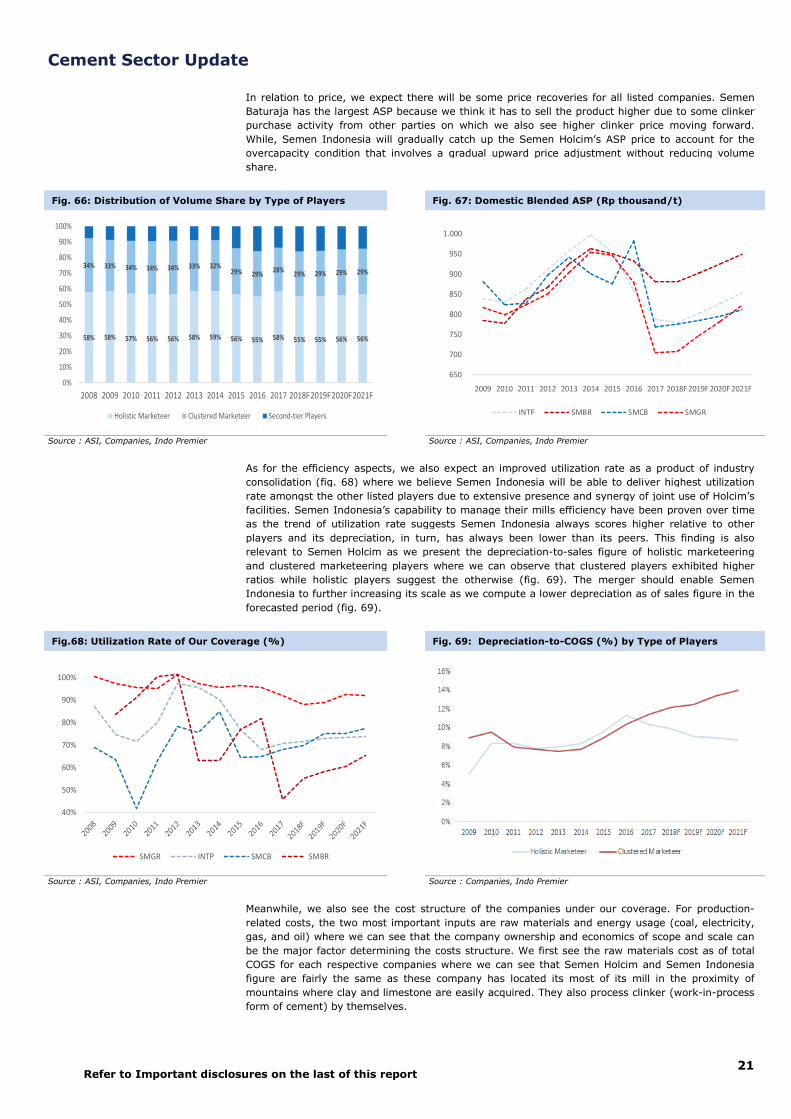
In relation to price, we expect there will be some price recoveries for all listed companies. Semen
Baturaja has the largest ASP because we think it has to sell the product higher due to some clinker
purchase activity from other parties on which we also se
While, Semen Indonesia will gradually catch up the Semen Holcim’s ASP price
overcapacity condition that involves a gradual upward price adjustment without reducing volume
share.
As for the efficiency aspects, we
consolidation (fig. 68
rate amongst the other listed players due to extensive presence and synergy of joint use of Holcim’s
facilities. Semen Indone
as the trend of utilization rate suggests Semen Indonesia always scores higher relative to other
players and its depreciation, in turn, has always been lower than its peers.
relevant to Semen Holcim as we present the depreciation
and clustered marketeering players where we can observe that clustered players exhibited higher
ratios while holistic player
Indonesia to further increasing its scale as we compute a lower depreciation as of sales figure in the
forecasted period
Meanwhile, we also see t
related costs, the two most important inputs are raw materials and energy usage (coal, electricity,
gas, and oil) where we can see that the company ownership and economics of scope and s
be the major factor determining the costs structure. We first see the raw materials cost as of total
COGS for each respective companies where we can see that Semen Holcim and Semen Indonesia
figure are fairly the same as these company has located
mountains where clay and limestone are easily acquired. They also process clinker (work
form of cement) by themselves.
Fig. 66: Distribution of Volume Share by Type of
Source : ASI, Companies, Indo Premier
Fig.68: Utilization Rate of Our Coverage (%)
Source : ASI, Companies, Indo Premier
58% 58% 57% 56% 56% 58% 59% 56% 55% 58%
34% 33% 34% 34% 34% 33% 32%29% 29%
28%
0%
10%
20%
30%
40%
50%
60%
70%
80%
90%
100%
2008 2009 2010 2011 2012 2013 2014 2015 2016 2017
Holistic Marketeer Clustered Marketeer Second-tier Players
40%
50%
60%
70%
80%
90%
100%
SMGR INTP SMCB
disclosures on the last of this report
In relation to price, we expect there will be some price recoveries for all listed companies. Semen
Baturaja has the largest ASP because we think it has to sell the product higher due to some clinker
purchase activity from other parties on which we also see higher clinker price moving forward.
While, Semen Indonesia will gradually catch up the Semen Holcim’s ASP price
overcapacity condition that involves a gradual upward price adjustment without reducing volume
As for the efficiency aspects, we also expect an improved utilization
nsolidation (fig. 68) where we believe Semen Indonesia will be able to deliver highest utilization
rate amongst the other listed players due to extensive presence and synergy of joint use of Holcim’s
facilities. Semen Indonesia’s capability to manage their mills efficiency have been proven over time
as the trend of utilization rate suggests Semen Indonesia always scores higher relative to other
players and its depreciation, in turn, has always been lower than its peers.
relevant to Semen Holcim as we present the depreciation-to-sales figure of holistic marketeering
and clustered marketeering players where we can observe that clustered players exhibited higher
ratios while holistic players suggest the otherwise (fig. 69).
Indonesia to further increasing its scale as we compute a lower depreciation as of sales figure in the
forecasted period (fig. 69).
Meanwhile, we also see the cost structure of the companies under our coverage. For production
related costs, the two most important inputs are raw materials and energy usage (coal, electricity,
gas, and oil) where we can see that the company ownership and economics of scope and s
be the major factor determining the costs structure. We first see the raw materials cost as of total
COGS for each respective companies where we can see that Semen Holcim and Semen Indonesia
figure are fairly the same as these company has located its most of its mill in the proximity of
mountains where clay and limestone are easily acquired. They also process clinker (work
form of cement) by themselves.
ype of Players Fig. 67: Domestic Blended ASP (Rp thousand/t)
Source : ASI, Companies, Indo Premier
Fig. 69: Depreciation-to-COGS
Source : Companies, Indo Premier
55% 55% 56% 56%
29% 29% 29% 29%
2017 2018F2019F2020F2021F
Second-tier Players
650
700
750
800
850
900
950
1.000
2009 2010 2011 2012 2013
INTP SMBR
SMBR
21
In relation to price, we expect there will be some price recoveries for all listed companies. Semen
Baturaja has the largest ASP because we think it has to sell the product higher due to some clinker
e higher clinker price moving forward.
While, Semen Indonesia will gradually catch up the Semen Holcim’s ASP price to account for the
overcapacity condition that involves a gradual upward price adjustment without reducing volume
also expect an improved utilization rate as a product of industry
) where we believe Semen Indonesia will be able to deliver highest utilization
rate amongst the other listed players due to extensive presence and synergy of joint use of Holcim’s
sia’s capability to manage their mills efficiency have been proven over time
as the trend of utilization rate suggests Semen Indonesia always scores higher relative to other
players and its depreciation, in turn, has always been lower than its peers. This finding is also
sales figure of holistic marketeering
and clustered marketeering players where we can observe that clustered players exhibited higher
). The merger should enable Semen
Indonesia to further increasing its scale as we compute a lower depreciation as of sales figure in the
he cost structure of the companies under our coverage. For production-
related costs, the two most important inputs are raw materials and energy usage (coal, electricity,
gas, and oil) where we can see that the company ownership and economics of scope and scale can
be the major factor determining the costs structure. We first see the raw materials cost as of total
COGS for each respective companies where we can see that Semen Holcim and Semen Indonesia
its most of its mill in the proximity of
mountains where clay and limestone are easily acquired. They also process clinker (work-in-process
lended ASP (Rp thousand/t)
ASI, Companies, Indo Premier
COGS (%) by Type of Players
2013 2014 2015 2016 2017 2018F 2019F 2020F 2021F
SMBR SMCB SMGR

Cement Sector Update
22 Refer to Important disclosures on the last of this report
Indocement figure is not directly comparable to peers as it includes production-related logistical
costs (for catering the raw materials to clinker/cement mills). On the other hand, Semen Baturaja
has considerably higher raw materials as of total COGS over time. This has to do with lack of scope
and scale to produce their own clinker as they frequently engage in the clinker purchase from other
parties which results to higher raw materials cost.
The second cost aspect is energy costs. This is particularly important for the cement manufacturer
to manage because it accounts for 10%-25% of total sales (fig. 60). The energy is also the major
production costs for cement players as it can be seen on the energy costs-to-total COGS (fig. 72)
where it institutes about 40-45% of total COGS, with the exception of Semen Baturaja as they
purchase clinker from other parties that lowers the energy costs. In the production of cement, coal
is required to process the raw materials into a clinker and coal makes up 50% of total energy costs,
in average. Then, electricity is induced in the process of converting clinker into cement. Electricity
alone contributes about 30-40% of total energy costs. We can see that Indocement’s energy costs
to total COGS is consistently higher than Semen Indonesia as we think Semen Indonesia as SOE
company has better bargaining power to energy suppliers as most of coal, gas, and electricity
companies are generally SOEs.
We then present two main profitability measure to summarize the company production and
operating efficiency in running the business. As suggested by both profitability margins, all players
had seen a downtrend in margin between 2012-2016 as the results of government interventions,
the industry’s price war by second-tier Chinese players, and slowing property demand.
Fig. 70: Depreciation Expense as of Sales (%) Fig. 71: Raw Materials as of Total COGS (%)
Source : Companies, Indo Premier Source : Companies, Indo Premier
Fig. 72: Energy Costs as of Total COGS (%) Fig. 73: Indo. Coal (HBA) and Oil Price (WTI) Benchmarks
Source : Companies, Indo Premier Source : Bloomberg, Indo Premier
0%
2%
4%
6%
8%
10%
12%
14%
2009 2010 2011 2012 2013 2014 2015 2016 2017 2018F 2019F 2020F 2021F
SMGR SMCB INTP SMBR
0%
5%
10%
15%
20%
25%
30%
35%
40%
45%
50%
2009 2010 2011 2012 2013 2014 2015 2016 2017 2018F 2019F 2020F 2021F
SMGR SMCB INTP SMBR
0%
5%
10%
15%
20%
25%
30%
35%
40%
45%
50%
2009 2010 2011 2012 2013 2014 2015 2016 2017 2018F 2019F 2020F 2021F
SMGR INTP SMBR
-
50
100
150
200
250
300
Jan
-09
Jul-
09
Jan
-10
Jul-
10
Jan
-11
Jul-
11
Jan
-12
Jul-
12
Jan
-13
Jul-
13
Jan
-14
Jul-
14
Jan
-15
Jul-
15
Jan
-16
Jul-
16
Jan
-17
Jul-
17
Jan
-18
Jul-
18
Indo Coal Benchmark WTI Oil Benchmark

Cement Sector Update
23 Refer to Important disclosures on the last of this report
Going forward, we forecast a recovery in gross profit margin for all listed companies (fig. 74) within
which we gauge higher gross profit margin relative to other players as triggered by the merger of
Semen Holcim and intra-company strategy reorientation of treating the operation of its three
subsidiaries under the command of Semen Indonesia as parent company. While, we put lower gross
margin for Semen Baturaja to account for lower bargaining power to supplier for clinker purchase.
For EBITDA margin, we also apply lower logistical costs for Semen Indonesia and Holcim to account
for the merger synergy and we also expect Semen Indonesia to reach higher EBITDA margin
compared to its peers (fig. 75). Industry-wide, we also expect recoveries on ROAA (fig. 76) and
ROAE (fig. 77) measure of all listed companies as the result of improved utilization (fig. 68) and
profitability.
To conclude, we think Semen Indonesia (combined with Semen Holcim) will be imbued with better
pricing power and the fact that Semen Indonesia is state-owned enterprise should translate to high
bargaining power to suppliers. Indocement should also better pricing environment though a slight
impaired pricing power due to our view of Semen Indonesia’s market share increase. On the other
hand, this year theme for Semen Baturaja will be the clustered player with limited potential. We pick
Semen Indonesia as our top pick for the sector and Semen Baturaja as our least preferred stock
with such demanding valuation.
Peer Valuations
We use several relative valuation metrics to give a glance about company and peers valuations.
First, we exhibit the forward-based P/E and EV/EBITDA as we view that the current consensus figure
has not taken into account the industry consolidation. Generally, all Indonesian cement players are
traded above its 7-year mean of forward P/E and EV/EBITDA as market positively responded the
consolidation. Company-wise, SMGR is undervalued relative to its peers, INTP and SMCB. The
forward P/E (fig. 78) and EV/EBITDA (fig. 79) of SMGR are 25.4x and 11.2x, respectively. While,
forward P/E (fig. 80) and EV/EBITDA (fig. 81) of INTP are 46.2x and 23.7x, respectively. We view
the rich valuation of INTP stems from the fact that company carries no debt on its books and the
consolidation makes it possible for INTP to increase its ASP concurrent with SMGR, though to a
limited extent as INTP’s home market is still overshadowed by severe overcapacity.
Fig. 74: Gross Profit Margin (%) Fig. 75: EBITDA Margin (%)
Source : Companies, Indo Premier Source : Companies, Indo Premier
Fig. 76: ROAA (%) Fig. 77: ROAE (%)
Source : Companies, Indo Premier Source : Companies, Indo Premier
20%
25%
30%
35%
40%
45%
50%
2009 2010 2011 2012 2013 2014 2015 2016 2017 2018F 2019F 2020F 2021F
INTP SMBR SMCB SMGR
10%
15%
20%
25%
30%
35%
40%
45%
2009 2010 2011 2012 2013 2014 2015 2016 2017 2018F 2019F 2020F 2021F
INTP SMBR SMCB SMGR
-2%
3%
8%
13%
18%
23%
28%
33%
2009 2010 2011 2012 2013 2014 2015 2016 2017 2018F 2019F 2020F 2021F
INTP SMBR SMGR
0%
10%
20%
30%
40%
50%
2009 2010 2011 2012 2013 2014 2015 2016 2017 2018F 2019F 2020F 2021F
INTP SMBR SMGR

Cement Sector Update
24 Refer to Important disclosures on the last of this report
On the other hand, we think SMBR’s valuation is way ahead of its fundamental, making the forward
EV/EBITDA (fig. 82) comparison inappropriate. We therefore present another metric, EV to total
installed cement capacity which we think can serve fairer basis for comparison in which we can see
that Semen Baturaja’s overvaluation can be seen as it trades above global averages on EV/ton basis
(fig. 83). Indocement, Semen Holcim, and Semen Indonesia’s EV/ton are still below global average
which suggests a room for upside potential.
Fig. 78: Forward P/E Band of SMGR Fig. 79: Forward EV/EBITDA Band of SMGR
Source : Bloomberg, Indo Premier Source : Bloomberg, Indo Premier
Fig. 80: Forward P/E Band of INTP Fig. 81: Forward EV/EBITDA Band of INTP
Source : Bloomberg, Indo Premier Source : Bloomberg, Indo Premier
Fig. 82: Forward EV/EBITDA Band of SMBR Fig. 83: Global vs. Indonesian Cement EV/ton Metric
Source : Bloomberg, Indo Premier Source : Bloomberg, Companies, Indo Premier
-
5
10
15
20
25
30
35
Jan-10 Jan-11 Jan-12 Jan-13 Jan-14 Jan-15 Jan-16 Jan-17 Jan-18
-2 std. -1 std. Mean +1 std. +2 std.
6
7
8
9
10
11
12
13
14
15
Jan-10 Jan-11 Jan-12 Jan-13 Jan-14 Jan-15 Jan-16 Jan-17 Jan-18
-2 std. -1 std. Mean +1 std. +2 std.
-
5
10
15
20
25
30
35
40
Jan-10 Jan-11 Jan-12 Jan-13 Jan-14 Jan-15 Jan-16 Jan-17 Jan-18
-2 std. -1 std. Mean +1 std. +2 std.
-
20
40
60
80
100
120
1/3/2014 1/3/2015 1/3/2016 1/3/2017 1/3/2018
Mean +1 std. +2 std.
-
100
200
300
400
500
600
700

Cement Sector Update
25 Refer to Important disclosures on the last of this report
Sensitivity Analysis
We also exhibit the sensitivity analysis for Indonesian cement listed players. We put four variables in
sensitivity test (fig. 84, 85, and 86), namely domestic blended ASP, domestic sales volume, energy,
and logistical costs, as we think these variables are a critical factor for driving profitability. We
herein can further observe the virtue of having a vast market with proper economics of scope and
scale and the vice of having a clustered market with lack of scope and scale. As we see, the effect
on decreasing domestic blended ASP is particularly pronounced for SMBR with -21% reduction in net
profit with the blended domestic ASP decrease of -1% (vs. SMGR: -7% and INTP: -10%) as the
Baturaja market is well clustered in South Sumatera.
While, clustered operation renders a less sensitive movement in net profit with an increase of
logistical costs. SMGR, INTP, and SMBR have respectively a net profit reduction of 1.6%, 1.4%, and
1.1%, following the 1% increase in logistical costs. We can see SMBR has a lower impact of net
profit reduction (50bps relative to SMGR) in the event of inflated logistical costs. The sensitivity
analysis on energy costs emphasize the importance of scale as we can see SMGR has a lowest net
profit reduction of 2.4% relative to INTP (3.4%) and SMBR (3.7%), following the 1% increase in
energy costs. Extensive presence and operation of SMGR makes the production costs scalable to its
unit produced, thus lessening the impact of energy costs increase.
Fig. 84: Earnings Sensitivity Analysis for Semen Indonesia
Impact on
Semen Indonesia (Consolidated-basis with Holcim) 2019F Net Profit
Revenue Driver
- Blended Domestic ASP -1% -7.0%
- Domestic Sales Volume -1% -0.1%
Cost Driver
- Energy Costs +1% -2.4%
- Logistical Costs +1% -1.6%
Source: IndoPremier estimates
Fig. 85: Earnings Sensitivity Analysis for Indocement
Impact on
Indocement 2019F Net Profit
Revenue Driver
- Blended Domestic ASP -1% -10.6%
- Domestic Sales Volume -1% -0.9%
Cost Driver
- Energy Costs +1% -3.4%
- Logistical Costs +1% -1.4%
Source: IndoPremier estimates
Fig. 86: Earnings Sensitivity Analysis for Semen Baturaja
Impact on
Semen Baturaja 2019F Net Profit
Revenue Driver
- Blended Domestic ASP -1% -21.0%
- Domestic Sales Volume -1% -8.3%
Cost Driver
- Energy Costs +1% -3.7%
- Logistical Costs +1% -1.1%
Source: IndoPremier estimates

Cement Sector Update
26 Refer to Important disclosures on the last of this report
Stock Data
Target price (Rp) Rp14,000
Prior TP (Rp) Rp11,500
Shareprice (Rp) Rp11,575
Upside/downside (%) +21.0
Sharesoutstanding (m) 5,932
Marketcap. (US$ m) 4,887
Free float (%) 49.0
Avg. 6m dailyT/O (US$ m) 4.3
Price Performance
3M 6M 12M
Absolute (%) 30.1 59.7 9.5
Relative to JCI (%) 20.0 53.1 10.0
52w high/low (Rp) 12,225/6,500
Major Shareholders
Government 51.0%
Estimate Change; Vs. Consensus
2019F 2020F
Latest EPS (Rp) 526 705
Vs. Prior EPS (%) 11.4 38.8
Vs. Consensus (%) 14.1 23.6
Source: Bloomberg
Augmented price power levers earnings
� Upsurge in retail presence and ASP is a by-product of merger.
� Improved bargaining power to supplier results to higher GPM.
� The synergy spotted in production, operating, and finance costs.
� We maintain BUY, albeit with higher TP of Rp14,000 (from Rp11,500)
Holcim merger results to an enhanced retail presence and blended ASP. Latest
merger of Semen Holcim (SMCB) and Indonesia (SMGR) inevitably acts as a precursor
of industry consolidation coupled with the looming prospect of second-tier players
operation. We believe the merger puts Semen Indonesia in a great benefit of well
improved product presence as reflected in soaring capacity share in C. Java, E. Java,
and Sumatera of 42%, 81%, and 63% (vs. 19%/ 64%/56%), respectively, which
further augments retail presence of SMGR and SMCB product. We account Holcim sales
volume by hiking domestic volume assumption to 40.5mt (SMGR: 29.5mt and SMCB”
11mt) in 2019 (+31% yoy) with a combined market share of 55% (SMGR: 40% and
SMCB: 15%). We also an upward adjustment of SMGR’s ASP (+6% yoy) in 2019 as we
witness a 8% price disparity between SMCB and SMGR in 2017.
New procurement strategy and Holcim brand cessation improves GPM. As of
this year, SMGR reorients its procurement activity in which whole subsidiaries’
procurement (especially energy, raw materials, and work-in-process) is focused on the
parent company instead of doing procurement on company-by-company basis. This
should add up SMGR’s bargaining power to suppliers as the increase in purchase
volume enables them to get a lower price from suppliers that have a close affinity with
SMGR as most of major energy input producers (coal and electricity account for 25% as
of sales) are SOEs. Moreover, the ceased use of Holcim brand in 2020 should also
improve gross profit (5% of Holcim sales) and we thus came with higher gross profit
margin of 31%/32% in FY19F/20F (vs. Consensus: 29%/30%), respectively.
Merger synergy operates in costs efficiency. Holcim owns 4 mills and 5 seaports of
which one of mills is located in W. Java and three of seaports situated in C. Java; SMGR
has not owned any mill and seaports in the aforementioned areas. This might spur
several efficiencies. We expect logistical costs efficiency in production and operating
levels, for instance SMGR is no longer transporting its product from Rembang to its W.
Java packaging plant to serve the related area instead they can utilize Holcim’s
Naragong facility (5.6mt). In turn, SMCB is also benefited by seeing higher utilization
rate. SMCB also carries lower loan rate (avg. 80bps) relative to SMGR (10.3%). We
also account this synergy by lowering the cost of financing for SMGR. In sum, we
forecast higher EBITDA margin of 21%/22% in FY19F/20F (consensus: 19%/20%),
respectively.
Maintain a BUY call with TP of Rp14,000. We changed our FY19F net profit forecast
from Rp2.8tn to Rp3.1tn (+43% yoy) to account the SMCB merger synergies. We also
noted that SMGR’s EV/ton of $154 still reflects 19% to its peers and thus maintain a
BUY call with higher TP of 14,000 which implies FY19F P/E and EV/EBITDA of 26.5x and
24x, respectively.
Semen Indonesia (SMGR IJ)
BUY (Unchanged)
Year to 31 Dec 2017 2018F 2019F 2020F 2021F
Revenue (RpBn) 27,814 39,030 43,559 46,829 49,895
EBITDA (RpBn) 4,851 6,540 9,229 10,469 11,628
EBITDA Growth (%) (27.6) 34.8 41.1 13.4 11.1
Net Profit (RpBn) 2,014 2,139 3,123 4,182 4,913
EPS (Rp) 339 361 526 705 828
EPS Growth (%) (55.5) 6.2 46.0 33.9 17.5
Net Gearing (%) 18.5 110.0 87.4 23.1 42.1
PER (x) 34.1 32.1 22.0 16.4 14.0
PBV (x) 1.4 0.8 0.8 0.8 0.8
Dividend Yield (%) 2.6 1.4 2.0 2.7 3.2
EV/EBITDA (x) 15.5 22.2 21.2 20.3 18.9
Source: SMGR, IndoPremier Share Price Closing as of 14-January-2019
Equity |
Indonesia
| C
em
ent
60
70
80
90
100
110
120
Jan-1
8
Feb-1
8
Feb-1
8
Mar-
18
Apr-
18
Apr-
18
May-1
8
Jun-1
8
Jun-1
8
Jul-
18
Aug
-18
Aug
-18
Sep-1
8
Oct-
18
Nov-1
8
Nov-1
8
Dec-1
8
Jan-1
9
SMGR-Rebase JCI Index-Rebase

SMGR IJ Company Update
27 Refer to Important disclosures on the last of this report
Fig. 1: SMGR and SMCB Domestic Volume and Utilization Rate Fig. 2: SMCB’s blended ASP has slight premium to SMGR
Source: SMGR, IndoPremier Source: SMGR, IndoPremier
Fig. 3: Selling Logistical Costs as of Sales (%) Fig. 4: Profitability Ratios
Source: SMGR, IndoPremier Source: SMGR, IndoPremier
Fig. 5: Java Volume Share (%) Fig. 6: Sumatera Volume Share (%)
Source: SMGR, IndoPremier Source: SMGR, IndoPremier
0%
20%
40%
60%
80%
100%
-
5
10
15
20
25
30
35
SMGR Volume (mt) SMCB Volume (mt)
SMGR Utilization Rate (%) - RHS SMCB Utilization Rate (%) - RHS
650
700
750
800
850
900
950
1.000
SMGR SMCB
4%
5%
6%
7%
8%
9%
10%
SMGR SMCB
0%
5%
10%
15%
20%
25%
30%
35%
40%
45%
50%
GPM EBITDA Margin NPM
15%
20%
25%
30%
35%
40%
45%
SMGR SMCB
0%5%
10%15%20%25%30%35%40%45%50%
SMGR SMCB

SMGR IJ Company Update
28 Refer to Important disclosures on the last of this report
Year To 31 Dec (RpBn) 2017 2018F 2019F 2020F 2021F
Income Statement (Consolidated with SMCB)
Net Revenue 27,814 39,030 43,559 46,829 49,895
Cost of Sales (19,854) (28,372) (30,124) (31,781) (33,532)
Gross Profit 7,960 10,658 13,435 15,048 16,363
SG&A Expenses (4,834) (6,195) (6,313) (6,725) (7,179)
Operating Profit 3,126 4,462 7,122 8,324 9,184
Net Interest (588) (1,290) (2,527) (2,178) (1,930)
Forex Gain (Loss) - - - - -
Others-Net 218 199 259 272 286
Pre-Tax Income 2,747 3,362 4,843 6,405 7,526
Income Tax (704) (672) (969) (1,217) (1,430)
Minorities (29) (551) (752) (1,007) (1,183)
Net Income 2,014 2,139 3,123 4,182 4,913
Balance Sheet (Consolidated with SMCB)
Cash & Equivalent 3,675 1,801 4,430 6,207 4,287 Receivable 4,995 6,950 7,757 8,468 9,022 Inventory 3,686 5,503 4,952 4,789 5,053 Other Current Assets 1,446 2,420 2,551 2,695 2,850
Total Current Assets 13,802 16,223 19,689 21,979 21,212 Fixed Assets - Net 35,523 49,417 47,310 46,165 43,720 Goodwill 1,270 18,563 18,563 18,563 18,563
Non Current Assets 1,369 1,657 1,657 1,657 1,657 Total Assets 48,964 85,860 85,860 88,363 85,152 ST Loans 1,193 3,101 4,480 3,650 7,000 Payable 4,927 6,996 7,428 7,836 8,268 Other Payables 322 339 346 276 295
Current Portion of LT Loans 727 2,800 2,872 20,149 4,510 Total Current Liab. 8,804 15,454 17,525 34,510 22,890
Long Term Loans 8,099 34,730 31,106 11,481 15,676 Other LT Liab. 1,622 2,932 2,932 2,932 2,932
Total Liabilities 18,524 53,115 51,562 48,923 41,498 Equity 2,153 5,102 5,102 5,102 5,102 Retained Earnings 26,733 27,063 29,223 32,000 35,032 Minority Interest 29 580 1,331 2,338 3,520
Total SHE + Minority Int. 30,439 32,745 35,657 39,440 43,654 Total Liabilities & Equity 48,964 85,860 87,219 88,363 85,152
Source: SMCB, SMGR, IndoPremier

SMGR IJ Company Update
29 Refer to Important disclosures on the last of this report
Year To 31 Dec (RpBn) 2017 2018F 2019F 2020F 2021F
Income Statement (SMGR Stand Alone)
Net Revenue 27,814 28,593 32,629 35,297 37,758
Cost of Sales (19,854) (20,744) (22,124) (23,357) (24,812)
Gross Profit 7,960 7,849 10,505 11,940 12,946
SG&A Expenses (4,834) (4,560) (4,692) (4,954) (5,360)
Operating Profit 3,126 3,289 5,813 6,986 7,586
Net Interest (588) (697) (1,894) (1,695) (1,267)
Forex Gain (Loss) - - - - -
Others-Net 218 199 259 272 286
Pre-Tax Income 2,747 2,792 4,178 5,563 6,604
Income Tax (704) (715) (1,070) (1,425) (1,692)
Minorities (29) (551) (752) (1,007) (1,183)
Net Income 2,014 1,526 2,356 3,132 3,730
Source: SMGR, IndoPremier
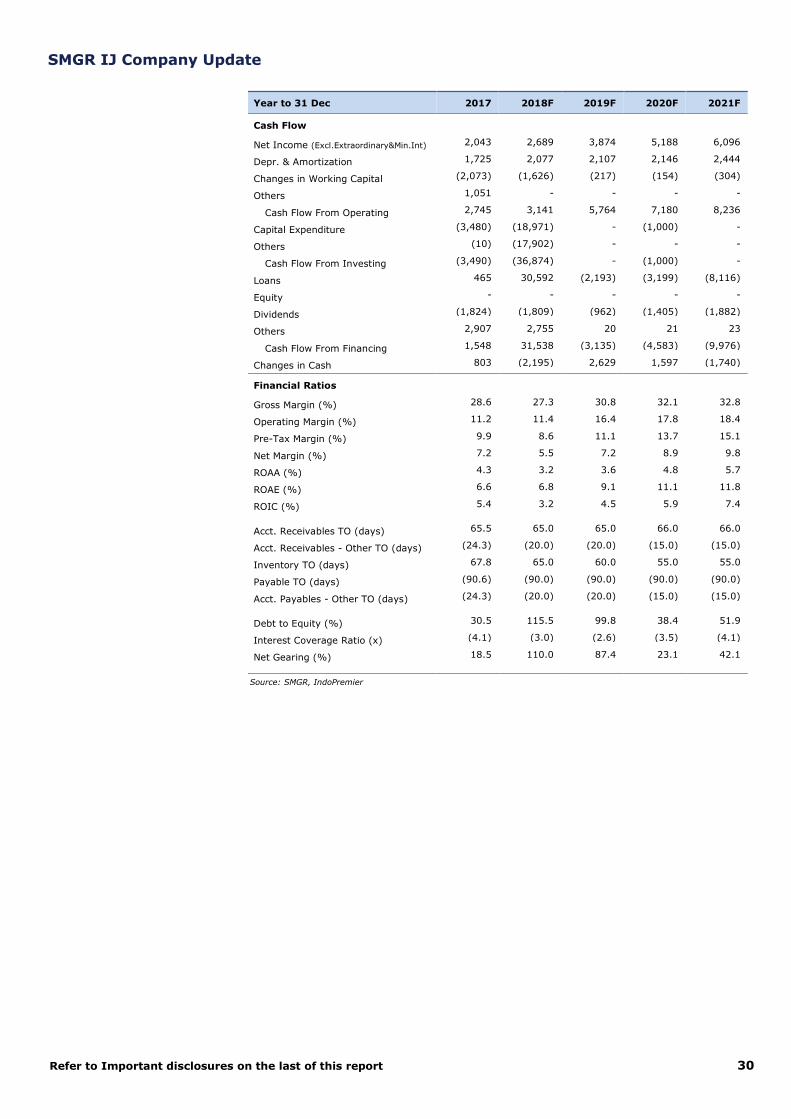
SMGR IJ Company Update
30 Refer to Important disclosures on the last of this report
Year to 31 Dec 2017 2018F 2019F 2020F 2021F
Cash Flow
Net Income (Excl.Extraordinary&Min.Int) 2,043 2,689 3,874 5,188 6,096 Depr. & Amortization 1,725 2,077 2,107 2,146 2,444 Changes in Working Capital (2,073) (1,626) (217) (154) (304)
Others 1,051 - - - - Cash Flow From Operating 2,745 3,141 5,764 7,180 8,236
Capital Expenditure (3,480) (18,971) - (1,000) - Others (10) (17,902) - - -
Cash Flow From Investing (3,490) (36,874) - (1,000) - Loans 465 30,592 (2,193) (3,199) (8,116) Equity - - - - - Dividends (1,824) (1,809) (962) (1,405) (1,882) Others 2,907 2,755 20 21 23
Cash Flow From Financing 1,548 31,538 (3,135) (4,583) (9,976) Changes in Cash 803 (2,195) 2,629 1,597 (1,740)
Financial Ratios
Gross Margin (%) 28.6 27.3 30.8 32.1 32.8
Operating Margin (%) 11.2 11.4 16.4 17.8 18.4 Pre-Tax Margin (%) 9.9 8.6 11.1 13.7 15.1
Net Margin (%) 7.2 5.5 7.2 8.9 9.8 ROAA (%) 4.3 3.2 3.6 4.8 5.7 ROAE (%) 6.6 6.8 9.1 11.1 11.8 ROIC (%) 5.4 3.2 4.5 5.9 7.4
Acct. Receivables TO (days) 65.5 65.0 65.0 66.0 66.0 Acct. Receivables - Other TO (days) (24.3) (20.0) (20.0) (15.0) (15.0)
Inventory TO (days) 67.8 65.0 60.0 55.0 55.0 Payable TO (days) (90.6) (90.0) (90.0) (90.0) (90.0) Acct. Payables - Other TO (days) (24.3) (20.0) (20.0) (15.0) (15.0)
Debt to Equity (%) 30.5 115.5 99.8 38.4 51.9 Interest Coverage Ratio (x) (4.1) (3.0) (2.6) (3.5) (4.1) Net Gearing (%) 18.5 110.0 87.4 23.1 42.1
Source: SMGR, IndoPremier

SMGR IJ Company Update
31 Refer to Important disclosures on the last of this report
Stock Data
Target price (Rp) Rp17,400
Prior TP (Rp) Rp18,500
Shareprice (Rp) Rp18,000
Upside/downside (%) -3.3
Sharesoutstanding (m) 3,681
Marketcap. (US$ m) 4,717
Free float (%) 36.0
Avg. 6m dailyT/O (US$ m) 2.2
Price Performance
3M 6M 12M
Absolute (%) 6.5 31.6 -20.7
Relative to JCI (%) -3.6 25.0 -20.2
52w high/low (Rp) 23,000/12,500
Major Shareholders
Birchwood Omnia Ltd. 51.0%
Mekar Perkasa 13.0%
Estimate Change; Vs. Consensus
2019F 2020F
Latest EPS (Rp) 389 505
Vs. Prior EPS (%) 68.8 101.8
Vs. Consensus (%) (2.9) 0.5
Source: Bloomberg
Player with subordinated price clout
� Hitchhiking a joint price recovery albeit with a subdued pace.
� Volume growth concern in saturated home market with overcapacity.
� Clean balance sheet with no leverage on its book.
� Lowering TP of Rp17,400 as price power impairs post SMGR merger.
Price recovery assumed with subdued pace. We believe Indocement’s (INTP) ASP
will be also benefited by the industry consolidation and assume subdued recovery
growth pace on INTP’s blended ASP of 3% for both 19F/20F relative to SMGR (6%/5%,
respectively) as we argue that SMGR will significantly hold a considerable Java’s volume
share (51% in 2019) post the merger with SMCB which leads to a significant
improvement in its pricing power, if not leading the price control.
Raises concern on volume growth quality. Indocement’s home market is in West
Java, a market that we think is well saturated given so many players existed. This
market saturation is further exacerbated with overcapacity issue (31mt out of 45mt
nation-wide capacity). These issues raise a concern over a volume growth quality in the
pertaining region as we believe volume share has to be flat or reduced if one wants to
hike the ASP in a saturated market with over capacity issue through our own and cross-
price elasticity calculation (fig. 89) in which we reveal INTP is above 1 means the
volume growth is highly sensitive toward its own and other price movements. As a
result, we apply less aggressive ASP growth assumption to balance our FY19F domestic
volume growth of 18.8mt (+5.8% yoy) with flattish Java and nation-wide volume share
of 33.6% (2018: 33.5%) and 25.8% (2018: 25.5%) in FY19F.
Debt-free balance sheet. We noted that INTP does not carry any long-term debt (vs.
pre-merged SMGR D/E: 0.31x, and SMBR: 0.27x) on its book. The absence of financial
expenses de-bottlenecks flows of operating profit down to net profit relative to both
SMGR and SMBR whose financial costs are about 24% and 50% of their EBIT. This
results to a higher FY19F NPM of 8.8% (prior forecast: 5.3%) vis-à-vis to both SMGR
and SMBR of 7.2% and 4.7%, respectively.
Maintain our HOLD call and lower our TP to Rp17,400. We like INTP balance sheet
quality on the absence of debts that hamper profitability flows. Nevertheless, we expect
an impaired INTP pricing power as the industry consolidation that boosts SMGR volume
share in Java region which is the home market for INTP and several mills overhaul that
could hamper some of its operational activities. We also assume higher risk-free rate of
8.5% (from 6%) to account for 10-yr government bond yield hike and thus results to a
lower TP of Rp17,400. Given the prospect, we also noted that the current forward
EV/EBITDA looks demanding which currently trades at 23.7x (above +1 std. of 7-yr
forward EV/EBITDA at 20x).
Indocement (INTP IJ)
HOLD (Unchanged)
Year to 31 Dec 2017 2018F 2019F 2020F 2021F
Revenue (Rpbn) 14,431 14,972 16,251 17,738 19,404
EBITDA (Rpbn) 3,106 2,214 2,790 3,445 3,845
EBITDA Growth (%) (32.6) (28.7) 26.0 23.5 11.6
Net Profit (Rpbn) 1,860 1,090 1,432 1,860 2,092
EPS (Rp) 505 296 389 505 568
EPS Growth (%) (51.9) (41.4) 31.3 29.9 12.4
Net Gearing (%) (33.7) (23.7) (23.3) (24.3) (25.8)
PER (x) 35.6 60.8 46.3 35.6 31.7
PBV (x) 2.3 2.5 2.4 2.2 2.1
Dividend Yield (%) 5.2 0.5 0.6 0.8 0.9
EV/EBITDA (x) 18.7 27.5 21.8 17.5 15.5
Source: INTP, IndoPremier Share Price Closing as of 14-January-2019
Equity |
Indonesia
| C
em
ent
50
60
70
80
90
100
110
Jan-1
8
Feb-1
8
Feb-1
8
Mar-
18
Apr-
18
Apr-
18
May-1
8
Jun-1
8
Jun-1
8
Jul-
18
Aug
-18
Aug
-18
Sep-1
8
Oct-
18
Nov-1
8
Nov-1
8
Dec-1
8
Jan-1
9
INTP-Rebase JCI Index-Rebase

INTP IJ Company Update
32 Refer to Important disclosures on the last of this report
Fig. 1: INTP Domestic Volume (mt) and Utilization Rate (%) Fig. 2: INTP ASP Dynamics
Source: INTP, IndoPremier Source: INTP, IndoPremier
Fig. 3: INTP’s cross and own price elasticities to SMGR/INTP Fig. 4: Java Volume Share (%)
Source: INTP, IndoPremier Source: INTP, IndoPremier
Fig. 5: Sumatera Volume Share (%) Fig. 6: INTP Profitability Measures
Source: INTP, IndoPremier Source: INTP, IndoPremier
0%
20%
40%
60%
80%
100%
120%
-
5
10
15
20
25
Domestic Sales Volume (mt) Utilization Rate (%) - RHS
750
800
850
900
950
1.000
(7,0)
(5,0)
(3,0)
(1,0)
1,0
3,0
5,0
7,0
9,0
1Q
14
2Q
14
3Q
14
4Q
14
1Q
15
2Q
15
3Q
15
4Q
15
1Q
16
2Q
16
3Q
16
4Q
16
1Q
17
2Q
17
3Q
17
4Q
17
1Q
18
2Q
18
3Q
18
SMGR - INTP Cross Elasticity SMCB - INTP Cross Elasticity
Own Price Elasticity
30%
32%
34%
36%
38%
40%
42%
44%
0%
2%
4%
6%
8%
10%
12%
14%
16%
18%
0%
5%
10%
15%
20%
25%
30%
35%
40%
45%
50%
GPM EBITDA Margin NPM

INTP IJ Company Update
33 Refer to Important disclosures on the last of this report
Year to 31 Dec 2017 2018F 2019F 2020F 2021F
Income Statement
Net Revenue 14,431 14,972 16,215 17.738 19,404
Cost of Sales (9,423) (10,709) (11,507) (12,291) (13,455)
Gross Profit 5,008 4,263 4,708 5,447 5,948
SG&A Expenses (3,080) (3,358) (3,332) (3,560) (3,820)
Operating Profit 1,928 905 1,376 1,887 2,128
Net Interest 402 454 342 353 391
Forex Gain (Loss) - - - - -
Others-Net (53) (30) 30 35 40
Pre-Tax Income 2,288 1,341 1,761 2,289 2,574
Income Tax (428) (251) (330) (428) (482)
Minorities - - - - -
Net Income 1,860 1,090 1,432 1,860 2,092
Balance Sheet
Cash & Equivalent 8,295 5267 5437 6017 6791 Receivable 2485 2578 2799 3110 3455 Inventory 1769 2010 2160 2307 2525 Other Current Assets 335 377 397 424 463
Total Current Assets 12883 10232 10793 11859 13234 Fixed Assets - Net 14979 15671 16257 16699 16982 Goodwill 107 107 107 107 107
Non Current Assets 894 894 894 894 894 Total Assets 28864 26904 28051 29559 31217 ST Loans - - - - - Payable 1549 1760 1734 1684 1659 Other Payables 658 690 666 683 691
Current Portion of LT Loans 88 88 88 88 88 Total Current Liab. 3479 3831 3835 3872 3954
Long Term Loans 20 - - - - Other LT Liab. 808 845 883 924 966
Total Liabilities 4307 4676 4718 4795 4920 Equity 4233 4233 4233 4233 4233 Retained Earnings 20323 17995 19099 20530 22064 Minority Interest - - - - -
Total SHE + Minority Int. 24557 22228 23333 24763 26297 Total Liabilities & Equity 28864 26904 28051 29559 31217
Source: INTP, IndoPremier

INTP IJ Company Update
34 Refer to Important disclosures on the last of this report
Year to 31 Dec 2017 2018F 2019F 2020F 2021F
Cash Flow
Net Income (Excl.Extraordinary&Min.Int) 1860 1090 1432 1860 2092 Depr. & Amortization 1178 1309 1414 1558 1717 Changes in Working Capital 436 (24) (387) (449) (520)
Others (692) - - - - Cash Flow From Operating 2782 2374 2459 2969 3289
Capital Expenditure (2,000) (2,000) (2,000) (2,000) (3,000) Others 17 38 40 42 45
Cash Flow From Investing (1,983) (1,962) (1,960) (1,958) (2,955) Loans (20) - - - - Equity - - - - -
Dividends (3,419) (327) (430) (558) (628) Others - - - - -
Cash Flow From Financing (3,439) (327) (430) (558) (628) Changes in Cash (3,028) 170 580 774 321
Financial Ratios
Gross Margin (%) 34.7 28.5 29.0 30.7 30.7
Operating Margin (%) 13.4 6.0 8.5 10.6 11.0 Pre-Tax Margin (%) 15.9 9.0 10.9 12.9 13.3
Net Margin (%) 12.9 7.3 8.8 10.5 10.8 ROAA (%) 6.3 3.9 5.2 6.5 6.9 ROAE (%) 7.3 4.7 6.3 7.7 8.2 ROIC (%) 9.5 6.1 7.3 9.0 9.5
Acct. Receivables TO (days) 62.8 62.8 63.0 64.0 65.0 Acct. Receivables - Other TO (days) - - - - -
Inventory TO (days) 68.5 68.5 68.5 68.5 68.5 Payable TO (days) (60.0) (60.0) (55.0) (50.0) (45.0) Acct. Payables - Other TO (days) (78.0) (75.0) (73.0) (70.0) (66.0)
Debt to Equity (%) 0.1 - - - -
Interest Coverage Ratio (x) 136.8 345.0 - - -
Net Gearing (%) 0.1 - - - -
Source: INTP, IndoPremier

Refer to Important disclosures on the last of this report
Stock Data
Target price (Rp) Rp400
Prior TP (Rp) Rp320
Shareprice (Rp) Rp1,680
Upside/downside (%) -76.2
Sharesoutstanding (m) 9,925
Marketcap. (US$ m) 1,187
Free float (%) 5.1
Avg. 6m dailyT/O (US$ m) 0.1
Price Performance
3M 6M 12M
Absolute (%) -24.0 -50.0 -46.3
Relative to JCI (%) -34.1 -56.6 -45.8
52w high/low (Rp) 4,250/1,650
Major Shareholders
Government of Indonesia 76,2%
Eastspring 1,0%
Estimate Change; Vs. Consensus
2019F 2020F
Latest EPS (Rp) 9.8 9.1
Vs. Prior EPS (%) 127.0 75.0
Vs. Consensus (%) 78.1 13.7
Source: Bloomberg
Clustered player with growth limitation
� Focused market haunts growth outperformance.
� Lack of scope and scale causes a low bargaining power to suppliers.
� Replete with pressure to grow its non-home market share.
� Reaffirmed our SELL call as valuation is way ahead of fundamental.
Focused market orientation is a double-edged sword. SMBR operational strategy
is pretty typical to INTP in the way they tend to reinforce the product presence in their
home market. The point differentiation between INTP and SMBR market structure is the
degree of competition in which we see less competitive environment as Sumatera is
resided by second-tier domestic player (Semen Bosowa) and Holcim Lafarge that tend
to follow SMGR (Semen Padang) as region’s price leader. We thus put the total volume
of 2.2mt whose growth (+5.9% yoy) will be slightly higher than Sumatera volume
growth (+5% yoy) and ASP increase of 2.5% in 2019. On the downside, SMBR focused
operation hampers growth as consolidation enable SMGR to expand further its presence
due to enhanced logistical capability, we account this development by applying lower 3-
yr CAGR FY18-21F growth of 5.2% (Sumatera 3-yr CAGR at 5.4%).
Bargaining power to suppliers is persistently low. We noted SMBR’s raw material
to COGS (c. 40%) is persistently higher than SMGR (c. 6%) and INTP (c. 20%) because
it includes the clinker purchase from other parties (Indocement and Semen Indonesia).
This clinker purchases has to do with lack of scope, relected by the lopsided proportion
of clinker (1.2mtpa) and cement installed capacity (3.85mtpa). Moreover, SMBR’s lack
of scale originates from total (production and selling) logistical cost (15% vs. SMGR at
14% of sales) issue due to the fact that it owns no seaport facility. In the light of
consolidation, we also believe the price increase will also apply to clinker products of
which SMBR’s deficient clinker production capacity will negatively affect its profitability.
We account SMBR’s lack of scale and scope by applying lower gross profit margin of
25%/24% (compared to its peers, SMGR and INTP at 31%/32% and 29%/31%) in
FY19F/FY20F, respectively.
Pressure inundates to hike non-home market share. We believe the benefit of
extending volume share outside its home market (S. Sumatera and Lampung) will
outweigh the cost of spiking logistical costs (+80% yoy) as the selling logistical now
occupies about 5% of sales that is nearly similar to SMGR (6%) despite its extensive
operation. This is the results of SMBR market expansion which now includes Jambi,
Bengkulu, and Bangka Belitung that booked a volume share 14%, 8%, and 5%,
respectively. Going forward, we expect SMBR market operation outside its home
market would be reduced, if not ceased, due to an expected mounting presence post
Holcim and Semen Indonesia merger that owns extensive logistical and production
capabilities.
Maintain SELL with TP of 400. Given both limited growth prospect and lack of scale
and scope, we think the stock price is way beyond its fundamentals. As EV/ton metrics
suggest that SMBR valuation ($317/ton) is well above Indonesian ($190/ton) and
average global peers.($210/ton).
Semen Baturaja (SMBR IJ)
SELL (Unchanged)
Year To 31 Dec 2017A 2018F 2019F 2020F 2021F
Revenue (RpBn) 1,552 1,872 2,031 2,168 2,347
EBITDA (RpBn) 337 364 401 416 453
EBITDA Growth (%) (18.1) 8.1 10.1 3.6 9.0
Net Profit(RpBn) 147 86 96 90 115
EPS (Rp) 15 9 10 9 12
EPS Growth (%) (43.4) (41.1) 11.5 (6.8) 27.8
Net Gearing (%) 13.2 15.1 10.2 5.7 0.9
PER (x) 115.0 195.2 175.1 187.9 147.1
PBV (x) 4.9 4.7 4.6 4.6 4.4
Dividend Yield (%) 0.2 0.1 0.1 0.1 0.1
EV/EBITDA (x) 50.7 47.8 43.0 41.1 37.3
Source: SMBR. IndoPremier Share Price Closing as of : 14-January-2019
Equity |
Indonesia
| C
em
ent
5060708090
100110120130140
Jan-1
8
Feb-1
8
Feb-1
8
Mar-
18
Apr-
18
Apr-
18
May-1
8
Jun-1
8
Jun-1
8
Jul-
18
Aug
-18
Aug
-18
Sep-1
8
Oct-
18
Nov-1
8
Nov-1
8
Dec-1
8
Jan-1
9
SMBR-Rebase JCI Index-Rebase

SMBR IJ Company Update
36 Refer to Important disclosures on the last of this report
Fig. 1: SMBR Domestic Volume (mt) and Utilization Rate (%) Fig. 2: SMBR ASP Dynamic
Source: SMBR. IndoPremier Source: SMBR. IndoPremier
Fig. 3: Raw Material as of Total COGS (%) Fig. 4: Selling Logistical Costs as of Sales (%)
Source: SMBR. IndoPremier Source: SMBR. IndoPremier
Fig. 5: SMBR Volume Share in Sumatera Region (%) Fig. 6: SMBR Profitability Measures
Source: SMBR. IndoPremier Source: SMBR. IndoPremier
0%
20%
40%
60%
80%
100%
120%
-
0,5
1,0
1,5
2,0
2,5
Domestic Sales Volume (mt) Utilization Rate (%)
750
800
850
900
950
1.000
0%
5%
10%
15%
20%
25%
30%
35%
40%
45%
50%
SMBR SMGR INTP
0%
2%
4%
6%
8%
10%
12%
14%
16%
SMBR SMGR INTP
10%
11%
11%
12%
12%
13%
13%
14%
14%
15%
0%
5%
10%
15%
20%
25%
30%
35%
40%
45%
50%
GPM EBITDA Margin NPM

SMBR IJ Company Update
37 Refer to Important disclosures on the last of this report
Year To 31 Dec (RpBn) 2017A 2018F 2019F 2020F 2021F
Income Statement
Net Revenue 1.552 1.872 2.031 2.168 2.348
Cost of Sales (1.079) (1.393) (1.510) (1.629) (1.761)
Gross Profit 473 479 521 539 587
SG&A Expenses (285) (289) (305) (319) (339)
Operating Profit 188 190 216 221 248
Net Interest 17 (75) (88) (101) (95)
Forex Gain (Loss) 0 0 0 0 0
Others-Net 4 0 0 0 0
Pre-Tax Income 209 115 128 120 153
Income Tax (62) (29) (32) (30) (38)
Minorities 0 0 0 0 0
Net Income 147 86 96 90 115
Balance Sheet
Cash & Equivalent 487 463 329 190 366 Receivable 408 462 501 535 579 Inventory 203 248 257 268 280 Other Current Assets 26 26 26 26 26
Total Current Assets 1.124 1.199 1.113 1.019 1.251 Fixed Assets - Net 3.844 3.736 3.622 3.503 3.378 Goodwill 0 0 0 0 0
Non Current Assets 92 92 92 92 92 Total Assets 5.060 5.028 4.827 4.614 4.721 ST Loans 0 1.000 700 400 400 Payable 232 0 310 312 314 Other Payables 436 126 137 149 161
Current Portion of LT Loans 0 0 0 0 0 Total Current Liab. 669 1.426 1.147 861 875
Long Term Loans 936 0 0 0 0 Other LT Liab. 43 46 48 51 54
Total Liabilities 1.647 1.472 1.196 912 929 Equity 2.195 2.195 2.195 2.195 2.195 Retained Earnings 1.217 1.360 1.436 1.506 1.596 Minority Interest 0 0 0 0 0
Total SHE + Minority Int. 3.413 3.556 3.631 3.702 3.792 Total Liabilities & Equity 5.060 5.028 4.827 4.614 4.721
Source: SMBR. IndoPremier

SMBR IJ Company Update
38 Refer to Important disclosures on the last of this report
Year to 31 Dec 2017A 2018F 2019F 2020F 2021F
Cash Flow
Net Income (Excl.Extraordinary&Min.Int) 147 86 96 90 115 Depr. & Amortization 149 174 185 195 205 Changes in Working Capital 124 (336) (34) (40)
(52)
Others 352 173 97 111 105 Cash Flow From Operating 773 98 344 356 356
Capital Expenditure (555) (66) (71) (76) (80) Others 18 20 17 11 12
Cash Flow From Investing (538) (46) (54) (64) (68) Loans 295 64 (300) (300) 0 Equity 178 0 0 0 0 Dividends (29) (17) (19) (18) (23) Others (293) (94) (104) (111) (106)
Cash Flow From Financing 150 (47) (424) (429) (129) Changes in Cash 385 5 (134) (138) 177
Financial Ratios
Gross Margin (%) 30.5 25.6 25.7 24.9 25.0
Operating Margin (%) 12.1 10.1 10.7 10.2 10.5 Pre-Tax Margin (%) 13.5 6.2 6.3 5.5 6.5
Net Margin (%) 9.5 4.6 4.7 4.1 4.9 ROAA (%) 3.1 1.7 2.0 1.9 2.5 ROAE (%) 4.5 2.5 2.7 2.4 3.1 ROIC (%) 4.1 2.2 2.6 2.4 3.1
Acct. Receivables TO (days) 73.0 84.7 86.5 87.2 86.6 Acct. Receivables - Other TO (days) 0.0 0.0 0.0 0.0 0.0
Inventory TO (days) 5.7 6.2 6.0 6.2 6.4 Payable TO (days) 65.3 69.8 73.8 69.8 64.9 Acct. Payables - Other TO (days) 47.2 36.5 0.0 0.0 0.0
Debt to Equity (%) 27.4 28.1 19.3 10.8 10.5 Interest Coverage Ratio (x) 0.0 0.5 0.5 0.5 0.4 Net Gearing (%) 13.2 15.1 10.2 5.7 0.9
Source: SMBR. IndoPremier

Head Office
PT INDO PREMIER SEKURITAS
Wisma GKBI 7/F Suite 718
Jl. Jend. Sudirman No.28
Jakarta 10210 - Indonesia
p +62.21.5793.1168
f +62.21.5793.1167
INVESTMENT RATINGS
BUY : Expected total return of 10% or more within a 12-month period HOLD : Expected total return between -10% and 10% within a 12-month period SELL : Expected total return of -10% or worse within a 12-month period ANALYSTS CERTIFICATION.
The views expressed in this research report accurately reflect the analyst;s personal views about any and all of the subject securities or issuers; and no part of the research analyst's compensation was, is, or will be, directly or indirectly, related to the specific recommendations or views expressed in the report. DISCLAIMERS
This reserch is based on information obtained from sources believed to be reliable, but we do not make any representation or warraty nor accept any responsibility or liability as to its accruracy, completeness or correctness. Opinions expressed are subject to change without notice. This document is prepared for general circulation. Any recommendations contained in this document does not have regard to the specific investment objectives, finacial situation and the particular needs of any specific addressee. This document is not and should not be construed as an offer or a solicitation of an offer to purchase or subscribe or sell any securities. PT. Indo Premier Sekuritas or its affiliates may seek or will seek investment banking or other business relationships with the companies in this report.