indoex aerosol: a comparison and summary of chemical
TRANSCRIPT

INDOEX aerosol: A comparison and summary of chemical,
microphysical, and optical properties observed from land, ship,
and aircraft
A. D. Clarke,1 S. Howell,1 P. K. Quinn,2 T. S. Bates,2 J. A. Ogren,3 E. Andrews,3
A. Jefferson,3 A. Massling,4 O. Mayol-Bracero,5 H. Maring,6 D. Savoie,6 and G. Cass7
Received 1 March 2001; revised 16 August 2001; accepted 30 August 2001; published 15 October 2002.
[1] The Indian Ocean Experiment (INDOEX) measurements on land, sea, and in the airwere designed to provide complementary assessment of chemical, physical, and opticalproperties of the haze aerosol over the Indian Ocean. Differences in platform requirementsand objectives resulted in diverse techniques, measurements, and analyses beingemployed. In order to best interpret the properties of the INDOEX aerosol, comparisons ofdata by platform, air mass origin, and light scattering intensity were undertaken. Theserevealed significant variability in platform averages of aerosol extensive properties (e.g.,mass, light scattering, and absorption) but less variability in intensive properties (e.g.,mass scattering efficiency, single scattering albedo, backscatter fraction, and Angstromexponent) and the ratios of constituents. In general, ratios of chemical species were foundto show greater variability than properties of the size distributions or aerosol opticalproperties. Even so, at higher haze concentrations with higher scattering values, variousdeterminations of the mass scattering efficiency (MSE) at 33% relative humidityconverged on values of about 3.8 ± 0.3 m2 g�1, providing a firm constraint upon thedescription and modeling of haze optical properties. MSE values trended lower with moredilute haze but became more variable in clean air or regions of low concentrations. Thiscross-platform comparison resolved a number of measurement differences but alsorevealed that regional characterization from different platforms results in differenceslinked to variability in time and space. This emphasizes the need to combine such effortswith coordinated satellite and modeling studies able to characterize large-scale regionalstructure and variability. These comparisons also indicate that ‘‘closure’’ betweenchemical, microphysical, and optical properties across platforms to better than about 20%will require significant improvements in techniques, calibration procedures, andcomparison efforts. INDEX TERMS: 0305 Atmospheric Composition and Structure: Aerosols and
particles (0345, 4801); 0345 Atmospheric Composition and Structure: Pollution—urban and regional (0305);
0394 Atmospheric Composition and Structure: Instruments and techniques; KEYWORDS: INDOEX, data
comparison, optical properties, chemistry, microphysics, size distributions
Citation: Clarke, A. D., et al., INDOEX aerosol: A comparison and summary of chemical, microphysical, and optical properties
observed from land, ship, and aircraft, J. Geophys. Res., 107(D19), 8033, doi:10.1029/2001JD000572, 2002.
1. Introduction
[2] A major goal of the Indian Ocean Experiment(INDOEX) was to identify the dominant aerosol constitu-ents advected over the Indian Ocean and to establish linksbetween their properties and related radiative effects. Ourintent was to provide a database of both natural andanthropogenic aerosol species and their contribution toregional aerosol radiative properties and related climateeffects. One objective was to reduce uncertainties in aerosolradiative forcing through ‘‘closure’’ experiments whereinseveral alternate measurements and approaches areemployed to establish a property. This ‘‘redundancy’’ pro-vides a means of testing measurements in order to identifythe sources and nature of the uncertainties involved.
JOURNAL OF GEOPHYSICAL RESEARCH, VOL. 107, NO. D19, 8033, doi:10.1029/2001JD000572, 2002
1Department of Oceanography, University of Hawaii, Honolulu,Hawaii, USA.
2Pacific Marine Environmental Laboratory, National Oceanic andAtmospheric Administration, Seattle, Washington, USA.
3Climate Monitoring and Diagnostics Laboratory, National Oceanic andAtmospheric Administration, Boulder, Colorado, USA.
4Institute for Tropospheric Research, Leipzig, Germany.5Department of Biogeochemistry, Max Planck Institute for Chemistry,
Mainz, Germany.6RSMAS/MAC, University of Miami, Miami, Florida, USA.7School of Earth and Atmospheric Sciences, Georgia Tech, Atlanta,
Georgia, USA.
Copyright 2002 by the American Geophysical Union.0148-0227/02/2001JD000572$09.00
INX2 32 - 1

INDOEX employed several platforms and diverse instru-mentation coordinated to meet these objectives overextended spatial and temporal scales [Ramanathan et al.,2001]. Because radiative effects depend upon relationshipsbetween aerosol size, composition and optical properties itwas important that different measurements be interpretedconsistently on a given platform and between platforms. Inspite of broad agreement among many of the observationsand data sets from the INDOEX intensive field phase (11February 1999–25 March 1999), some measurement differ-ences and uncertainties were evident. The intent of thispaper is to identify uncertainties and to provide a consensuson the INDOEX aerosol chemistry, optical properties andaerosol size distributions such that other researchers andmodelers have a common reference for fundamentalINDOEX in-situ observations.
2. Approach
2.1. Strategy
[3] A logical approach to ensure that instrument per-formance and measurement techniques were comparableduring INDOEX was to provide side-by-side comparisonof various platforms during the experiment. These plat-forms included the long-term site at Kashidhoo ClimateObservatory (KCO), the R/V Sagar Kanya (SK) [Jayara-man et al., 2001], the R/V Ronald H. Brown (RB) and theNCAR C-130 aircraft (C-130) [Ramanathan et al., 2001].Actual opportunities for side-by-side comparisons includeone C-130-RB flyby and several KCO flybys with the C-130 as well as some periods when the RB sampled nearKCO. These were less frequent than hoped due to logisticaldifficulties and because both instrument operation andenvironmental conditions were less consistent thanexpected. Also, in order to compare aircraft, ship andground-based data, only the low altitude legs from the C-130 flights are used. Even so, for a 10-min surface leg,comparison of C-130 data collected at speeds of 110 ms�1
to surface-based data requires data to be averaged over thesame air volume sampled by the C-130. For example, ifsurface winds are about 6 m s�1 then ship or ground datacorresponding to the 10 min of C-130 data is about 3 h (10min � 110/6). Even though the C-130 flew along the windaxis parallel to the surface platform for a 10 min sample legthe passage of air past the surface platform for the next 3 hseldom maintains the same speed or direction. Hence, inthe presence of aerosol gradients, the C-130 measurementsand surface measurements can be intrinsically differenteven for a 10 min sample, the shortest practical C-130sample leg. Furthermore, even under ideal circumstancesthe C-130 near-surface legs flown at 35 m altitudes maynot reflect surface values when a near surface gradientexists.[4] In view of the problematic nature of side-by-side
measurements between platforms, a strategy for moreextended comparison is employed here. A rapid and sensitivemeasurement of aerosol changes common to all platforms isthe aerosol scattering coefficient, (ssp). Light scatteringmeasurements (550 nm) at a constrained RH near 55% wereused to establish Low (ssp <25Mm�1), Medium (25Mm�1 <ssp <55 Mm�1) and High (ssp > 55 Mm�1) aerosol regimes.Data were partitioned into characteristic values/properties
observed for each of these L, M, and H ranges and stratifiedinto identifiable source regions when possible. This approachallowed comparison of similar data for similar plume proper-ties even when platforms were not colocated and increasedopportunities for cross platform comparisons of INDOEXaerosol characteristics.[5] Only near-surface flight legs of the C-130 are
included. For the size distributions, this was defined as legsbelow 100m, while chemical composition was compared forlegs up to 600m to increase the number of availablesamples. In the optics section the level legs below 1000 mwere used to compare C-130 measurements with surfaceplatforms. A Student t test showed that differences inaverage submicrometer optical properties were insignificantat the 95% confidence level whether the altitude was 1000m, 600 m or 35 m.[6] Although average concentrations and their variation
are presented here for each platform for these classifica-tions, the intent is not to focus on these extensive aerosolproperties, since they are expected to differ markedly withthe sampling time each platform spent exposed to eachregime. Rather, the intent is to group such data into thesethree optically stratified classifications to see if differencesexist in intensive properties such as the mass scatteringefficiency (MSE), single-scattering albedo (vo), BlackCarbon (BC) to Total Carbon (TC) ratio, etc. This analysisdepends on the assumptions that 1) each platform accumu-lated a representative range of values for each regime and 2)fundamental aerosol properties and characteristics weresimilar on all platforms within each of the L, M or Hcategories. Hence, differences in ratios evident betweenplatforms or measurement stratifications point to differencesin techniques or sampling or to invalid assumptions. Con-sistent trends in ratios among L, M, or H regimes fordifferent platforms or measurements could also indicate achange in intensive aerosol properties with increasingpollution concentrations.
2.2. Relative Humidity
[7] One issue important to all platforms and this assess-ment is the role of relative humidity (RH) on water uptakeby the aerosol [Tang and Munkelwitz, 1977]. Water uptakedepends on whether or not some of the particle mass isinsoluble or partially soluble which, in turn, depends onwhich chemical species are present. Condensed water is amajor aerosol constituent with a pronounced impact onparticle size, density, refractive index and scattering extinc-tion [Kochenruther et al., 1999]. It is not only important tothe goal of linking aerosol radiative forcing to the variousaerosol species but also because most aerosol measurementtechniques (e.g., size, mass, optical properties) requireunderstanding and accounting for RH effects.[8] Hence, both interpretation of measurements at instru-
ment RH and the extrapolation of measured properties toambient RH conditions introduce uncertainties that must beaccounted for. For example, various impactors used to sizesegregate aerosol prior to measurement (e.g., nephelometer,filter, or gravimetric mass) will have a size cut that willfluctuate with RH due to changes in particle size anddensity. Efforts to control impactor RH on the ground wereoften successful but were problematic or not practical forthe varied conditions aboard aircraft. Also, aerosol sizing
INX2 32 - 2 CLARKE ET AL.: INDOEX AEROSOL—A COMPARISON AND SUMMARY

instruments determine size classes by various methodsincluding diffusion, aerodynamic properties, and opticalproperties and these often involve assumptions about par-ticle shape, density, and refractive index all of which canchange with RH and often in very different ways. Evengravimetric mass will depend on the RH during weighing.Indications of some of these competing effects on INDOEXmeasurements are illustrated in Table 1. Here we indicatethe impact on a measurement as a result of an actual RHvalue being higher than that assumed to be correct for ameasurement. INDOEX planning called for conditioningRH to target values of 55% when possible (for impactors,nephelometry, etc.) and filter mass measurements at 33%.However, for the variable conditions aboard the C-130(pressure, ambient RH etc.) this was not always possibleand such adjustments are often necessary.[9] Two fundamental aerosol measurements made during
INDOEX provide valuable constraints on how these RHadjustments are implemented for optical and sizing meas-urements. The first is the change in scattering coefficientwith humidity, typically called f(RH). This is the ratio ofscattering at a given RH to that at some reference humidity(chosen here as 40%RH). The f(RH) for INDOEX wasmeasured at KCO by maintaining one nephelometer at 40%RH while gradually scanning the humidity within a secondnephelometer. For the near surface data compared here weassume the dominant dependency found at KCO applies(Figure 1) although variability of about ±15% around thisline is present in the full data set (J. A. Ogren, personalcommunication, 2001). The average relationship shown inFigure 1 has been used to adjust light scattering measured atone RH to light scattering at a different RH when necessary.This approach of scanning a range of RH used at KCO wastoo slow for f(RH) measurements on the C-130 and asimpler method was used where one nephelometer operatedat aircraft temperature while the second was controlled to atarget humidity near 85%. This provided a two-pointcharacterization of the plot shown in Figure 1.[10] The ratio of wet to dry aerosol diameters or the so-
called growth factor, D/Do, places another empirical con-straint on the effect of soluble/insoluble constituents onparticle growth behavior. The associated measurement of
D/Dref (where ‘‘ref’’ here is about 55%RH for this data) wasmeasured on the RB using a Tandem Differential MobilityAnalyzer (TDMA) technique (A. Massling et al., Hygro-scopic properties and solubility of different aerosol typesover the Indian Ocean, submitted to Journal of GeophysicalReasearch, 2001) and provides an empirical approach forscaling sizes measured at one RH to sizes at some other RH(Figure 2). Here we show the RB measured data for thelargest ‘‘dry’’ particle sizes characterized (250 nm geometricdiameter at less than 10%RH) by the TDMA. Since mostaerosol optical properties during INDOEX were dominatedby accumulation mode aerosol (see below), this is also themost appropriate TDMA size range to use for corrections forparticle growth related to their optical properties.[11] A second plot of D/Dref included in Figure 2 is taken
from the ACE2 measurements of Swietliki et al. [2000].Their data has been ‘‘normalized’’ to agreement with Mas-sling data at 55%RH. This was done because Swietlikigrowth was originally referenced to ‘‘dry’’ diameters at alow RH of about 13% while Massling data was referencedto about 5%RH for ‘‘dry’’ diameters. Normalizing data setsto 55%RH avoids apparent differences caused by uncertain
Table 1. Expected Influence of an Uncertainty in RH on Various Measurementsa
Property Measurement Sensitive To Effect of RHIncrease
Impact on Measurement
Gravimetric mass Mass at 30% RH Weighing RH Increase mass Overestimate massAnalytical mass
less then 1 mm Dp(impactor)
Ionic Mass Size cut Decrease cutsize Underestimate massOC Size cut ? ?TC Size cut ?
FSSP size dist.on wing (C-130)
Ambient forwardscatter
Ref. Index Decrease R.I. Size Decrease
PCASP size. dist. Integrated scatter Size Increase Dp Size IncreaseOn wing (C-130) Ref. Index Decrease Dp Size DecreaseDMA size dist. Aerosol mobility Measured RH Decrease Size IncreaseAPS size dist. Aerodynamic Drag
relative to referenceDensity Decrease Size DecreaseSize Increase Size Increase
OPC size dist. Optical Scatterrelative to reference
Ref. Index Decrease Size DecreaseSize Increase Size Increase
Light scattering Fixed RH, 1 mm cut Size cut Decrease Scatter DecreaseMeasured RH Increase Scatter Increase
Light absorption Filter transmission Size cut Decrease Absorption Decrease?Measured RH ?
aRH increase assumed.
Figure 1. Equation of curve fit to average f(RH) afunction of relative humidity measured by CMDL at KCOfor Dp <10 mm. Scatter in original data is about ±15%around this line (not shown).
CLARKE ET AL.: INDOEX AEROSOL—A COMPARISON AND SUMMARY INX2 32 - 3

growth behavior below 10% RH including the greateruncertainty associated with RH measurements at low RH.Also shown in Figure 2 is the calculated normalized growthfor a limited period of size-resolved chemical data taken atKCO that shows very similar inferred growth behavior forRH values above about 35% RH. The growth equationobtained by fitting these data provides a consistent way toadjust sizes at one RH (above 35% RH) to sizes expected atanother RH.[12] Specification of RH is also essential to interpreting
aerosol intensive parameters discussed toward the end of thispaper, such as the ratio of aerosol scattering to aerosol mass(the mass scattering efficiency or MSE). We will show thisimportant intensive parameter at RH = 33%. This was thelowest RH at which measurements were routinely made(gravimetric mass on the RB) and is selected here becausegravimetric mass change in response to RH was not meas-ured. In order to facilitate linking these data (e.g., MSE) tomeasurements at other conditions the functional depend-encies used to describe f(RH) and D/Dref have also beenincluded.[13] We note that while dry MSE might be more useful for
incorporating these data into chemical transport models orother applications that use dry mass as a variable, it wouldrequire extrapolation of both mass and scattering to RHconditions well below any measurements we made. Figure 2,which shows discrepancies between measured D/Dref andchemically estimated values at low RH, suggests that suchextrapolations are risky. However, if we had pursued suchextrapolation, the lower RH Massling TDMA data indicatethat D(33)/D(0) is 1.14, which translates into 1.48 times thedry volume or 1.22 times the mass for spherical particleswith dry density of 2.2 g cm�3. Similarly, the f(RH) curve fit(Figure 1) suggests that scattering at 33%RH exceeds dryscattering by 16%, but no data are available to confirm thatextrapolation. Both cases indicate significant water remain-ing at 33% compared to the dry state.
2.3. Comparison of Indoex Data Products
[14] Measurements can reflect differences in sample plat-forms, instrument, instrument operation/configuration, sam-
pling inlets, environmental conditions, sample periods,locations etc. In preparation for INDOEX, efforts weremade to make various measurements as comparable aspossible within the constraints common to most fieldstudies. Summaries of the sampling approach for each ofthe platforms can be found in Appendix A. Additionaldetailed discussions of the chemical, physical, and opticalproperties measured and specific issues related to samplingand instrumentation are also presented in Appendix B. Weencourage the reader who is concerned with these measure-ment issues to read these appendices as a reference for thediscussions that follow.
2.4. Chemical Properties
[15] The aerosol chemical species considered here andmeasured on the RB, the C-130, and at KCO are thoseimportant to aerosol radiative forcing. These include nonsea-salt (nss) SO4
2�, black carbon (BC), organic carbon (OC),total carbon (TC) which is the sum of BC andOC, and aerosolmass. Sea-salt is not considered because it was a minorcomponent in the submicrometer size range in the NHsamples and because submicrometer aerosol dominatedINDOEX optical properties (see size discussion below).Absolute concentrations of these species are compared asare ratios of the mass concentration of various species,scattering to mass, and absorption to BC. Only submicrom-eter aerosol (those with an aerodynamic diameter less than orequal to one micrometer) are included in these comparisons.[16] No side-by-side comparisons between platforms or
between KCO-UMiami and KCO-Caltech were possible dueto a lack of data on at least one platform during those timeperiods. Instead, comparisons of the chemical species (con-centrations and ratios) were made based on similarities insampling conditions for L, M, and H scattering categories(Table 2), trajectories to the platforms (from the Bay ofBengal (BoB) or the Arabian Sea (AS)) (Table 3), and, forthe RB and C-130, geographical regions (Northern Hemi-sphere, ITCZ, and Southern Hemisphere) (Table 4). Compar-isons for the low scattering category do not include caseswhere the RB or C-130 experienced trajectories from thenorthern or southern Indian Oceans in order to make thosedata more comparable to the KCO data. Figures 3a–3csummarizes the typical values for major components andproperties on each platform and under each L, M or Hcondition.2.4.1. Nss SO4
2���
[17] Mean nonsea-salt sulfate (nss SO42�) concentrations
from KCO-Caltech and the RB agreed within 26% for thelow and medium scattering regimes (Table 2; Figure 3a).KCO-UMiami and C-130 mean values were considerablylower and did not agree with each other or with the otherplatforms within 1 standard deviation. For the high scatter-ing category (Table 2; Figure 3a), the mean RB concen-tration was higher than the KCO-UMiami and C-130 valuesby 40% and higher than the KCO-Caltech values by 20%.However, due to the large variability in concentrations inthis category, all differences between platforms were within1 standard deviation of the means.[18] Separating the data according to trajectories reveals
that the large variability is due in part to air mass flow patternsto the sampling platforms. For trajectories from the AS, theRB mean nss SO4
2� concentration is lower than the KCO-
Figure 2. D/Dref a function of RH measured by DMPS onthe RB for both INDOEX (solid line) and ACE-2 (dashedline) experiments and estimated values derived fromCaltech KCO chemistry data (see text).
INX2 32 - 4 CLARKE ET AL.: INDOEX AEROSOL—A COMPARISON AND SUMMARY

Table 2. Mean Concentrations and Mass Ratios Obtained for KCO, RB, and C-130 Measurements for Submicrometer Chemical Species
for Harmony Categories ‘‘Low,’’ ‘‘Medium, and ‘‘High’’ Scatteringa
Species KCO-UMiami KCO-Caltechb C-130 RB
‘‘Low’’ Scattering (ssp� 25 Mm�1)Concentrations mg m�3 mg m�3 mg m�3
Nss SO42� N/A 2.3 ± 0.04 (1) 0.51 ± 0.30 (3) 1.7 ± 0.40 (8)
BC N/A 0.55 ± 0.03 (1) cnd - 0.5 (3) 0.17 ± 0.21 (2)OC N/A 0.61 ± 0.10 (1) cnd (3) 0.27 ± 0.20 (2)TC 1.2 ± 0.11 (1) cnd (3) 0.44 ± 0.01 (2)Total mass N/A 7.9 ± 0.50 (1) cnd (3) 3.9 ± 0.66 (4)
Mass ratiosBC/TC N/A 0.47 ± 0.05 (1) cnd (3) 0.39 ± 0.47 (2)BC/OC N/A 0.90 ± 0.14 (1) cnd (3) 1.4 ± 1.8 (2)BC/nss SO4
2� N/A 0.24 ± 0.01 (1) cnd (3) 0.07 ± 0.08 (2)OC/nss SO4
2� N/A 0.26 ± 0.04 (1) cnd (3) 0.17 ± 0.17 (2)Nss K+/BC N/A N/A cnd (3) 0.56 ± 0.24 (2)Nss SO4
2�/mass N/A 0.29 ± 0.02 (1) cnd (3) 0.39 ± 0.08 (3)
Scattering to mass ratios m2 g�1 m2 g�1 m2 g�1 m2 g�1
ssp (33%)/mass (33%)c N/A 3.7 (1) 4.1 ± 1.2 (7)ssp (33%)/mass (chem anal)d N/A cnd 5.2 ± 2.5 (7)sap/BC N/A 20 (1) 12 (1) 12 (1)
‘‘Medium’’ Scattering (25 < ssp� 55 Mm�1)Concentrations mg m�3 mg m�3 mg m�3
nss SO42� 3.2 ± 0.58 (4) 4.5 ± 0.04 (2) 2.2 ± 0.68 (4) 4.5 ± 0.78 (7)
BC 1.4 ± 0.04 (2) 0.8 ± 0.7 (4) 0.43 ± 0.18 (6)OC 1.0 ± 0.11 (2) 1.3 ± 1.2 (4) 0.42 ± 0.06 (6)TC 2.4 ± 0.12 (2) 2.1 ± 1.6 (4) 0.85 ± 0.22 (6)Total mass 11 ± 1.7 (4) 14 ± 0.68 (2) 7.1 ± 1.3 (3) 8.9 ± 2.6 (8)
Mass ratiosBC/TC 0.58 ± 0.03 (2) 0.40 ± 0.20 (4) 0.49 ± 0.10 (6)BC/OC 1.4 ± 0.16 (2) 0.90 ± 0.60 (4) 1.0 ± 0.39 (6)BC/nss SO4
2� 0.31 ± 0.01 (2) 0.36 ± 0.28 (3) 0.10 ± 0.03 (6)OC/nss SO4
2� 0.22 ± 0.02 (2) 0.90 ± 0.80 (3) 0.10 ± 0.02 (6)nss K+/BC 0.30 ± 0.30 (3) 0.74 ± 0.20 (6)nss SO4
2�/mass 0.30 ± 0.05 (4) 0.32 ± 0.015 (2) 0.35 ± 0.13 (3) 0.45 ± 0.04 (6)
Scattering to mass ratios m2 g�1 m2 g�1 m2 g�1 m2 g�1
ssp (33%)/mass (33%)c 3.4 ± 0.09 (2) 3.9 ± 0.51 (6)ssp (33%)/mass (chem anal)d 2.2 ± 0.57 4.7 ± 1.0 4.7 ± 0.36 (6)sap/BC 13 (1) 13 ± 8.9 (4) 17 ± 4.6 (6)
‘‘High’’ Scattering (55 Mm�1< ssp)Concentrations mg m�3 mg m�3 mg m�3
nss SO42� 6.4 ± 1.1 (12) 7.4 ± 0.09 (3) 6.2 ± 2.7 (12) 8.9 ± 3.9 (14)
BC 2.5 ± 0.07 (3) 2.5 ± 1.8 (12) 1.4 ± 0.48 (8)OC 2.1 ± 0.12 (3) 3.1 ± 2.2 (11) 0.95 ± 0.44 (8)TC 4.6 ± 0.14 (3) 5.5 ± 3.3 (11) 2.3 ± 0.66 (8)Total mass 19 ± 4.3 (11) 21 ± 0.49 (3) 14 ± 6.2 (9) 17 ± 3.5 (3)
Mass ratiosBC/TC 0.55 ± 0.02 (3) 0.50 ± 0.10 (11) 0.59 ± 0.12 (8)BC/OC 1.2 ± 0.07 (3) 1.1 ± 0.60 (11) 1.6 ± 0.64 (8)BC/nss SO4
2� 0.34 ± 0.01 (3) 0.46 ± 0.18 (13) 0.16 ± 0.04 (8)OC/nss SO4
2� 0.28 ± 0.02 (3) 0.50 ± 0.30 (9) 0.13 ± 0.11 (8)nss K+/BC 0.11 ± 0.03 (9) 0.37 ± 0.11 (8)nss SO4
2�/mass 0.30 ± 0.02 (12) 0.35 ± 0.03 (3) 0.41 ± 0.09 (10) 0.52 ± 0.11 (7)
Scattering to mass ratios m2 g�1 m2 g�1 m2 g�1 m2 g�1
ssp (33%)/mass (33%)c 3.5 ± 0.16 (3) 4.1 ± 0.23 (3)ssp (33%)/mass (chem anal)d 2.9 ± 0.8 (11) 5.8 ± 2.0 (9) 4.4 ± 0.08 (3)sap/BC 14 (1) 9.2 ± 2.8 (12) 10 ± 2 (8)
aN/A, no sample available; cnd, could not determine. Also shown are ±1 standard deviations. Number of samples collected are shown in parentheses.bMean and confidence interval.cBased on scattering coefficients adjusted to 33% RH and mass measured gravimetrically at 33% RH (RB) or 39% RH (KCO-Caltech).dBased on scattering coefficients adjusted to 33% RH and the sum of the chemically analyzed mass.
CLARKE ET AL.: INDOEX AEROSOL—A COMPARISON AND SUMMARY INX2 32 - 5

UMiami and the C-130 mean concentrations (Table 3). Incontrast, for trajectories from the BoB, the RB mean con-centration is higher than the KCO-UMiami and KCO-Cal-tech values by almost a factor of two and higher than the C-130 mean value by over a factor of 4 (Table 3). Samplingschedules of the various platforms may have contributed tothese differences. BoB trajectories were sampled by KCOand the C-130 between 12 February and 3 March and bythe RB between 4 March and 5 March and again on 29March. Even within the BoB trajectories sampled by oneplatform, however, there is considerable variability in thenss SO4
2� concentrations. The BoB category includedtrajectories from Calcutta, over southern India or Sri Lankato the Arabian Sea as well as trajectories from central Indiato the Arabian Sea. Non-sea salt SO4
2� concentrationsmeasured on the RB were up to a factor of three higherfor trajectories from Calcutta compared to trajectories fromcentral India (Figure 3a).[19] The differences evident in data sorted by scattering
regime or trajectory are averaged out when RB and C-130
samples are sorted by geographical region. The mean nssSO4
2� concentration for Northern Hemisphere samples col-lected on the RB is 25% higher than the C-130 NorthernHemisphere mean (Table 4) but lies within 1 standarddeviation of both mean concentrations. For all cases,whether sorted by scattering regime, trajectory, or geo-graphical region, the mean RB nss SO4
2� to mass ratio isabout 34% higher than mean values for the other platforms.RB mean values ranged from 0.39 to 0.52 while KCO andC-130 mean values ranged from 0.29 to 0.41. Only for theRB-C-130 comparison is the difference within 1 standarddeviation of the mean concentrations. In addition, BC to nssSO4 mean ratios are about a factor of two lower for the RBsamples than for the KCO and C-130 samples. The lowerRB ratios relative to the C-130 and KCO are a result oflower BC concentrations and intermittently higher nss SO4
2�
concentrations. At the same time, however, dry scattering tomass ratios for KCO-Caltech and the RB are consistentacross scattering and trajectory categories which suggeststhat the difference in nss SO4
2� concentrations is a result of
Table 3. Mean Concentrations and Mass Ratios for Submicrometer Chemical Species for all Trajectories Originating From the Bay of
Bengal and the Arabian Seaa
Species KCO-UMiami KCO-Caltechb C-130 RB
Bay of BengalConcentrations mg m�3 mg m�3 mg m�3
nss SO42� 5.8 ± 1.7 (11) 5.9 ± 0.04 (7) 2.4 ± 1.5 (4) 11 ± 3.0 (8)
BC 1.9 ± 0.05 (7) 1.9 ± 0.48 (4) 1.5 ± 0.53 (5)OC 1.6 ± 0.11 (7) 2.9 ± 2.1 (4) 0.75 ± 0.19 (5)TC 3.5 ± 0.13(7) 4.9 ± 2.6 (4) 2.3 ± 0.71 (5)Total mass 18 ± 5.6 (10) 17 (7) 8.8 ± 6.0 (2) 17 ± 3.8 (3)
Mass ratiosBC/TC 0.55 ± 0.03 (7) 0.43 ± 0.10 (4) 0.66 ± 0.04 (5)BC/OC 1.3 (7) 0.81 ± 0.33 (4) 2.0 ± 0.35 (5)BC/nss SO4
2� 0.32 ± 0.01 (7) 0.55 ± 0.17 (4) 0.14 ± 0.03 (5)OC/nss SO4
2� 0.26 (7) 0.43 ± 0.09 (2) 0.07 ± 0.01 (5)nss K+/BC 0.09 ± 0.03 (2) 0.43 ± 0.20 (5)nss SO4
2�/mass 0.32 ± 0.04 (10) 0.33 (7) 0.41 ± 0.04 (2) 0.55 ± 0.10 (5)
Scattering to mass ratios m2 g�1 m2 g�1 m2 g�1 m2 g�1
ssp (33%)/mass (33%)c 3.5 ± 0.15 (7) 3.8 ± 0.56 (3)ssp (33%)/mass (chem anal)d 3.1 ± 0.87 (10) 5.3 ± 1.2 (2) 4.5 ± 0.16 (3)sap/BC 16 (1) 7.2 ± 3.1 (4) 12 ± 3.9 (5)
Arabian SeaConcentrations mg m�3 mg m�3 mg m�3
nss SO42� 5.3 ± 2.6 (5) 4.7 ± 2.3 (11) 3.7 ± 1.8 (22)
BC 2.0 ± 1.6 (13) 0.55 ± 0.37 (11)OC 2.6 ± 2.1 (11) 0.62 ± 0.50 (11)TC 4.6 ± 3.6 (11) 1.2 ± 0.83 (11)Total mass 16 ± 6.3 (5) 13 ± 6.7 (9) 7.4 ± 3.3 (9)
Mass ratiosBC/TC 0.47 ± 0.15 (11) 0.47 ± 0.18 (11)BC/OC 1.0 ± 0.63 (10) 1.1 ± 0.69 (11)BC/nss SO4
2� 0.44 ± 0.21 (9) 0.12 ± 0.06 (11)OC/nss SO4
2� 0.67 ± 0.52 (9) 0.15 ± 0.10 (11)nss K+/BC 0.17 ± 0.19 (9) 0.58 ± 0.24 (11)nss SO4
2�/mass 0.32 ± 0.03 (5) 0.37 ± 0.10 (9) 0.43 ± 0.06 (11)
Scattering to mass ratios m2 g�1 m2 g�1 m2 g�1 m2 g�1
ssp (33%)/mass (33%)b 3.9 ± 0.50 (9)ssp (33%)/mass (chem anal)c 2.7 ± 0.38 (5) 5.6 ± 2.3 (9) 4.3 ± 0.70 (9)sap/BC 10 ± 5.5 (12) 16 ± 9.1 (9)
aAlso shown are ±1 standard deviations. Number of samples collected shown in parentheses.bMean and confidence interval.cBased on scattering coefficients adjusted to 33% RH and mass measured gravimetrically at 33% RH (RB) or 39% RH (KCO-Caltech).dBased on scattering coefficients adjusted to 33% RH and the sum of the chemically analyzed mass.
INX2 32 - 6 CLARKE ET AL.: INDOEX AEROSOL—A COMPARISON AND SUMMARY

natural variability in the sampled air masses rather than ananalytical effect, i.e., scattering per unit mass of aerosol wasconsistent but the chemical composition of the aerosolappears to have differed.2.4.2. Black Carbon[20] For all scattering regimes, mean BC concentrations
were higher for KCO and the C-130 than for the RB (Tables 2and 3; Figure 3a). Due to the high variability in the C-130concentrations, however, differences between the RB and C-130 were within 1 standard deviation of the C-130 means.Mean concentrations were comparable for KCO and the C-130 during Bay of Bengal (BoB) trajectories (Table 3) withthe RB concentrations averaging 30% lower. In addition,variability in the BC concentration within the BoB categorywas not as great as it was for nss SO4
2� (Figure 3a), at least forthe RB,. During AS trajectories, the C-130 mean OC con-centration was almost four times greater than the RB meanconcentration (Table 3). Due primarily to the AS difference,the C-130 Northern Hemisphere mean BC concentration wasa factor of 2.4 larger than the RBmean Northern Hemisphereconcentration. These differences (AS and NH) are within 1standard deviation of the C-130 means.[21] As for nss SO4
2�, the platform differences in the AScategory may have been a result of the C-130 and RBsampling schedules. The highest BC concentrations weremeasured by the C-130 between 18 February and 9 Marchand the RB did not sample AS trajectories until after 7March. In addition, the estimated concentration of BC isdependent on the method used to determine the OC/BC splitfrom the measured total carbon. A difference in analyticalapproaches could have contributed to the observed differ-ences in the RB, KCO, and C-130 concentrations. Suchanalytical effects are not indicated by the BC to TC andabsorption to BC ratios, however.[22] BC/TC ratios for all platforms were, for the most
part, consistent across scattering and trajectory categorieswith differences within 1 standard deviation of the means(Tables 2 and 3; Figure 3b). An exception was the BoBtrajectory category during which the RB mean was 20 and50% higher than the KCO-Caltech and C-130 mean values,respectively. Overall, C-130 mean values ranged from 0.40
to 0.52, KCO-Caltech values from 0.47 to 0.58, and RBvalues from 0.39 to 0.66. The mean Northern Hemisphereratios were 0.53 ± 0.17 and 0.50 ± 1.0 on the RB and C-130,respectively.[23] Mean absorption to BC ratios on the C-130 and RB
were within 1 standard deviation of the mean values (Tables2 and 3; Figure 3c) for all scattering and trajectory catego-ries. RB mean values ranged from 10 to 17 m2 g C�1 with aNorthern Hemisphere value of 13 ± 4.7 m2 g C�1 (Table 4).C-130 mean values ranged from 7 to 13 m2 g C�1 with aNorthern Hemisphere mean value of 9.5 ± 5.3 m2 g C�1.KCO-Caltech mean values were comparable to or higherthan those measured on the C-130 and RB.[24] Non-sea salt K+ to BC ratios were compared because
aerosol nss K+ is a by-product of biomass burning and hasbeen found to correlate well with BC concentrations inbiomass burning plumes [Cachier et al., 1995]. For exam-ple, a mean ratio of 0.52 ± 0.11 has been reported forbiomass burning aerosol in Brazil [Ferek et al., 1998]. Meanratios ranged from 0.09 to 0.30 on the C-130 with a meanNorthern Hemisphere value of 0.2 ± 0.2 (Tables 2, 3, and 4;Figure 3b). Mean ratios were higher on the RB ranging from0.37 to 0.74 with a Northern Hemisphere mean of 0.53 ±0.24. Differences between the C-130 and RB were notwithin 1 standard deviation of the means. Hence, RBmeasurements suggest an influence of biomass burningemissions on aerosol chemical composition over the IndianOcean that was not observed to the same extent by the C-130.2.4.3. Organic Carbon[25] For all scattering and trajectory categories mean OC
concentrations from the C-130 were a factor of 3 to 4 higherthan those from the RB and a factor of 1.3 to 1.8 higher thanthose from KCO-Caltech (Tables 2 and 3; Figure 3a).However, because of large variability in the C-130 valuesthe differences between the C-130 and KCO-Caltech valuesand the C-130 and RB values are within 1 standard devia-tion of the C-130 mean values. Differences between KCO-Caltech and the RB are not within 1 standard deviation ofthe means. In addition to the natural variability discussedabove, interplatform differences are most likely a result of
Table 4. Mean Concentrations and Mass Ratios for Submicrometer Chemical Species as a Function of Latitudea
Species RB (NH) C-130 (NH) RB (ITCZ) C-130 (ITCZ) RB (SH) C-130 (SH)
Concentrationsnss SO4
2� 6.0 ± 4.1 (29) 4.8 ± 1.9 (12) 1.6 (1) 1.9 (2) 0.75 ± 0.44 (20) 0.19 (1)BC 0.86 ± 0.62 (17) 2.1 ± 1.4 (15) cnd — 1.5 (2) 0.05 ± 0.06 (4) cndOC 0.66 ± 0.43 (17) 2.7 ± 2.1 (14) cnd — 1.2 (2) 0.05 ± 0.03 (4) cndTC 1.5 ± 0.94 (17) 4.8 ± 3.4 (14) cnd — 2.7 (2) 0.10 ± 0.09 (4) cndTotal mass 12 ± 5.8 (17) 13 ± 6.3 (11) 3.5 (1) 7.7 (1) 1.7 ± 1.0 (11) cnd
Mass ratiosBC/TC 0.53 ± 0.17 (17) 0.50 ± 0.10 (14) 0.55 (1) 0.31 ± 0.35 (4) cndBC/OC 1.4 ± 0.74 (17) 1.0 ± 0.6 (14) 1.2 (1) 0.80 ± 0.93 (4) cndBC/nss SO4
2� 0.12 ± 0.06 (17) 0.5 ± 0.2 (11)OC/nss SO4
2� 0.12 ± 0.10 (17) 0.60 ± 0.50 (11) 0.4 (1) 0.07 ± 0.06 (4) cndnss K+/BC 0.53 ± 0.24 (17) 0.2 ± 0.2 (11) 0.12 (1) 0.18 ± 0.21 (4) cndnss SO4
2�/mass 0.49 ± 0.13 (17) 0.40 ± 0.10 (11) 0.40 (1) 0.50 ± 0.25 (11) cndScattering to mass ratios
ssp (33%)/mass (33%)b 3.8 ± 0.49 (12) 4.7 ± 1.4 (5) cndssp (33%)/mass (chem anal)c 4.3 ± 0.60 (12) 5.5 ± 2.0 (8) 8.0 (1) 5.4 ± 1.5 (3)sap/BC 13 ± 4.7 (16) 9.5 ± 5.3 (15) 13 (1) 16 ± 3.4 (2) cnd
aHere, cnd, could not determine. Northern hemisphere (NH) includes all latitudes north of 1�S, ITCZ includes all latitudes between 1�S and 5�S, andSouthern Hemisphere (SH) includes all latitudes south of 5�S. Also shown are ±1 standard deviations. Number of samples collected shown in parentheses.
bBased on scattering coefficients adjusted to 33% RH and mass measured gravimetrically at 33% RH (RB) or 39% RH (KCO-Caltech).cBased on scattering coefficients adjusted to 33% RH and the sum of the chemically analyzed mass.
CLARKE ET AL.: INDOEX AEROSOL—A COMPARISON AND SUMMARY INX2 32 - 7

artifacts associated with sampling semivolatile species [Tur-pin et al., 2000].[26] KCO-Caltech OC to nss SO4
2� ratios were relativelyconstant for all scattering and trajectory categories withmean values ranging from 0.22 to 0.28 (Tables 2 and 3;Figure 3b). For all categories except the BoB trajectorycase, RB ratios were lower and ranged from 0.10 to 0.17. Alow mean value of 0.07 ± 0.01 was measured in air massescoming from the BoB and is a function of high nss SO4
2�
concentrations. The lower ratios observed on the RB are dueto lower OC and/or higher nss SO4
2� concentrations. C-130mean ratios were more variable and higher than both theKCO-Caltech and RB values ranging from 0.43 to 0.90.These relatively high ratios are a result of both higher OCand lower nss SO4
2� concentrations. Mean Northern Hemi-sphere values were 0.12 ± 0.10 and 0.60 ± 0.50 for the RBand C-130, respectively (Table 4).[27] Mean BC to OC ratios ranged from 0.9 to 1.4 over all
scattering and trajectory categories at KCO (Caltech), from0.81 to 1.1 on the C-130, and from 1.0 to 2.0 on the RB.Platform differences between the mean values for all cate-gories are within 1 standard deviation except for the
instances where trajectories were from the BoB. Thoughmeasured on different days, for this case, the mean C-130ratio was the lowest observed (0.81 ± 0.33) and the meanRB ratio was the highest observed (2.0 ± 0.35).2.4.4. Aerosol Mass[28] For the medium and high scattering regimes, submi-
crometer aerosol mass measured on the C-130 and RBagreed within 1 standard deviation of the mean concen-trations (Table 2; Figure 3a). For all scattering regimeswhere there were data, KCO-UMiami and KCO-Caltechmass concentrations were higher than the C-130 and RBvalues and were not within 1 standard deviation of themeans. In addition to natural variability, differences mayhave resulted from the use of nonstandardized methods forcollection and analysis. The impactor stages used to deter-mine the KCO-Caltech mass concentrations at ambient RHcollected a larger size fraction of the aerosol than did theother samplers (see Appendix B, Table A1). The Sierraimpactor used to determine the KCO-UMiami concentra-tions has a broader submicrometer size cut than the Berner-type impactor used on the RB or the MOUDI used by KCO-Caltech. Both of these factors (collection of a larger size
Figure 3a. Means and 1 standard deviation of chemical species measured on the various platforms forthe low, medium, and high scattering regimes. Also shown as crosses for RB High scattering regime arethe minimum and maximum concentrations measured on the RB during BoB trajectories.
INX2 32 - 8 CLARKE ET AL.: INDOEX AEROSOL—A COMPARISON AND SUMMARY

fraction of the aerosol and a broad size cut) would result in alarger mass concentration. Although the C-130 mass con-centrations agreed with the RB values within 1 standarddeviation of the means, they were lower than those deter-mined on all other platforms. The C-130 technique ofsumming the mass of the chemically analyzed species(and excluding water) rather than determining the massgravimetrically most likely contributed to this difference.In addition, the stacked filter units used on the C-130 had abroad size cut and wider variations in RH than the otherplatforms. As discussed below, however, interplatform con-sistency in scattering to mass ratios suggests that theseanalytical differences were not great.2.4.5. Scattering to Mass Ratios[29] Scattering to mass ratios were calculated from
scattering coefficients measured at 550 nm (STP- andangular-corrected as per Anderson and Ogren [1998])and simultaneously measured gravimetric mass concentra-tions. The reported ratios (Tables 2, 3, and 4; Figure 3c)include an adjustment of the scattering coefficient to 33%
RH. The adjustment was made by extrapolating the f(RH)curves measured at KCO (Figure 1) to 33% RH. For KCO,the KCO-CMDL scattering coefficients were used. RB massconcentrations determined by gravimetric analysis includethe amount of water associated with the aerosol on a filter at33 ± 3% RH. KCO-Caltech mass concentrations, which werealso determined by gravimetric analysis, include the amountof water associated with the aerosol on a filter at 39 ± 3%RH.The KCO-Caltech mass concentrations are not adjusted forchange in water mass between 39% and 33%RH. Judgingfrom the diameter change in Figure 2 and density calculatedfrom composition, the decrease in mass would be about3.5%, trivial compared with other sources of disagreement.Chemical mass on the C-130 does not include water or othernonanalyzed species [Mayol-Bracero et al., 2002].[30] KCO-Caltech and RB MSE ratios agreed within 8 to
17% for the categories where both platforms had scatteringand mass measurements (low, medium, and high scattering,and BoB trajectories) (Tables 2 and 3; Figure 3c). The use ofsamplers with sharp size cuts and gravimetric analysis to
Figure 3b. Means and 1 standard deviation of mass ratios of the chemical species measured on the variousplatforms for the low, medium, and high scattering regimes. Also shown as crosses for the RB Highscattering regime are the minimum and maximum ratios measured on the RB during BoB trajectories.
CLARKE ET AL.: INDOEX AEROSOL—A COMPARISON AND SUMMARY INX2 32 - 9

derive aerosol mass concentrations most likely contributed tothe high level of agreement between these two platforms.KCO-UMiami values agreed with those determined byKCO-Caltech within 20% for the high scattering and BoB trajec-tory categories. For the four categories that both the RB andC-130 had scattering and mass data (medium and highscattering regime, BoB and AS trajectories), the chemicallybased mean C-130 scattering to mass ratios were about 20 to40% higher than the gravimetric RB means. For the onecategory that both KCO-Caltech and the C-130 had scatteringand mass data (high scattering regime), the mean C-130 ratiowas about 70% higher than the KCO-Caltech mean. Theconsistently higher C-130 values are expected in part due tothe derivation of aerosol mass from a summation of thechemical species with no allowance for associated water (seereevaluation below). If the RB scattering to mass ratios arecalculated using the sum of the chemically analyzed mass(Tables 2, 3, and 4), then the C-130 ratios are 18 to 30%higher (instead of 20–40% higher).
2.5. Microphysical Properties
[31] Before adjusting size distributions (e.g., for 55% RH)to yield equivalent geometric sizes, as mentioned above,initial checks are made on general instrument performance.When two or more instruments are combined to establish adistribution reasonable agreement must exist in the overlapregion for the respective measurements. Because mostINDOEX aerosol are well aged there was a negligiblefraction of aerosol number at sizes below 20 nm such thatcondensation particle counter (CPC) number concentrationsencompass virtually all aerosol number and diffusion lossesshould also be small. Once appropriate size distributions are
established then integral number concentrations from theDMPS, DMA-APS, DMA-OPC etc. instrumentation can becompared to total number concentrations obtained fromCPC’s operated on respective platforms. Assuming thatinstruments are in optical alignment, the uncertainty in sizedistribution concentrations from single particle counters isgenerally limited by flow uncertainties (often about ±1–5%). Since the number concentrations for INDOEX aredominated by accumulation mode particles, inlet and trans-mission losses should be no more than a few percent,constraining the likely differences between size integralnumber and measured CN to less than 10%.[32] We start here with the only side-by-side comparison
of the C-130 and RB platforms carried out about 0830 GMTon 28 February 1999. These data were obtained on a 15 minnear surface C-130 flight along the wind and nearby theship. This corresponds to the air mass passing the RB overabout a 3 h period. Initial excellent agreement between CNdata aboard the C-130 and RB of about 1,200 cm�3 did notpersist for more than an hour after the C-130 left the area.This is believed to be due to a shift in wind direction at theRB that brought an air mass over the ship that was notsampled by the C-130. Hence, the RB data shown here arefor the earlier part of the 3 h period.[33] The key size-resolved characteristics for the RB flyby
are shown in Figure 4 and reveal the significance of thevarious moments of the size distribution and their links toaerosol properties. All four panels employ the linear dZ/dlogDp format such the area under each curve is proportionalto the parameter Z. Here Z is either number (N), area (A),volume (V) or light scattering (s) and the integral value foreach parameter is indicated in the plot. Here we use a verticalshaded bar near 0.75 mmgeometric diameter that correspondsapproximately to the 1 mm aerodynamic diameter used else-where in this paper and references made to submicrometeraerosol here will be based upon aerodynamic size.[34] The number distributions (Figure 4b) from the C-130
and the normalized RB distributions (see corrections,Appendix B) are quite similar with integral numbers of1215 cm�3 and 1125 cm�3 respectively and with a negli-gible contribution from particles larger than 0.7 mm. How-ever, the RB tends to be somewhat broader with higherconcentrations below 0.055 mm and above 0.35 mm but withlower values in between. When plotted as area distributionsthe indicated submicrometer integral values differ by lessthan 2% but the diameter of the peak in the C-130 is about0.32 mm and the RB data about 0.35 mm. However, thevolume and surface area distributions also show largerdifferences above 1 mm. Even after corrections for CAItransmission efficiency (see Appendix A.1.3) the RB datashows 3 times more aerosol volume than the C-130. Someof this difference may reflect sampling losses in the sampleline to the OPC or growth corrections for the APS. How-ever, near surface coarse particle gradients and differencesin sample times for the distributions may also contribute.[35] The C-130 included NCAR wing probe measure-
ments [Baumgardner et al., 1992] intended to supplementthe onboard sizing data for the larger particles, expected tobe poorly sampled with the Community Aerosol Inlet(CAI), and to characterize particles under ambient condi-tions. The wing probe data provided by NCAR from theFSSP and PCASP (ambient conditions) are also included in
Figure 3c. Means and 1 standard deviation of thescattering to mass and absorption to BC ratios measuredon the various platforms for the low, medium, and highscattering regimes.
INX2 32 - 10 CLARKE ET AL.: INDOEX AEROSOL—A COMPARISON AND SUMMARY

dN/d
log
D, c
m3 a) log(number)
10 4
10 2
100
102
104
C 130R/V Ron BrownC 130 Wing probes
dN/d
log
D, c
m
3 b) Number Nsubmicron
Ntotal
1215 12161125 1127
0
1000
2000
3000
dA/d
log
D, u
m2 c
m
3
c) Area Asubmicron
Atotal
151 157155 172
0
100
200
300
400
dV/d
log
D, u
m3 c
m
3
d) Volume Vsubmicron
Vtotal
7.3 9.4 8.3 14.8
0
5
10
15
20
25
dσsp
/dlo
g D
, Mm
1
Diameter, µm
e) Scattering at 550 nmrefractive index m = 1.505 0.046i
σsp,submicron
σsp,total
40 4249 55
10 2
10 1
100
101
0
50
100
150
Figure 4. C-130 - RB Flyby Size Intercomparison for geometric diameters at 55% RH. C-130 data asmeasured (about 6% below C-130 CPC number) and RB data scaled (increased by 27%) to matchintegral RB CPC number. Integral values for distributions of submicrometer and total aerosol shown onright of panels for C-130 (bold) and RB (normal).
CLARKE ET AL.: INDOEX AEROSOL—A COMPARISON AND SUMMARY INX2 32 - 11
Figures 4a–4d. We note that these were based upon arefractive index of about 1.4 and have not been corrected tothe lower RH of 55% used for the C-130 and RB data. Theseconsiderations should result in a reduction in size from thatshown here and yield even larger differences between wingprobe data and the other C-130 and RB distributions thanindicated here. PCASP data dominate the wing probe numberdistribution but the lower detection limit restricts it to above0.12 mm while severe undercounting is evident above about0.23 mm. The area distribution also reveals that the FSSP datalie well below the C-130 and RB measurements for submi-crometer sizes. Occasionally the wing probe data showedmore consistent results than evident here but we were unableto identify conditions when this improved behavior could bepredicted. Clearly, the wing probe data often provide unre-liable characterization of the particle sizes between 0.2 and1.0 mm that dominate the scattering extinction distributionduring INDOEX.[36] The volume distributions for the indicated FSSP data
for coarse particles are almost a factor of two below the C-130OPC data and a factor of 6 or so below RB data. These lowFSSP values could suggest that the much higher coarseparticle concentrations evident in the RB data during theflyby may not be present at the C-130 altitude. However, thisundercounting by the FSSP relative to the C-130 OPC wascommon for all cloud-free horizontal leg averages such thatthe quantitative interpretation of FSSP data under typicalnoncloudy conditions remains questionable. Hence, wingprobe data cannot confirm whether the apparent coarseparticle disparity between the C-130 and RB data duringthe flyby is real (e.g., a vertical or spatial gradient), instru-mental or a sampling difference. Even so, the scatteringdistributions and their indicated integral values (Figure 4e)show that these larger particles contribute only 4.7% and 11%to the scattering extinction for the C-130 andRB distributionsrespectively. This low relative contribution of coarse particlesis also representative of most other surface data duringINDOEX and C-130 data revealed this coarse componentto generally decrease with altitude. Hence, sampling limita-tions of the CAI and possible limitations in C-130 coarseparticle characterization compared to the RB should havelittle effect on the INDOEX optical characterization aboardthe C-130.2.5.1. Sample Regime Differences[37] Size data have been grouped into L, M and H
scattering regimes and different air mass regimes. However,the 23 low altitude legs on the C-130 often had only one ortwo legs that fell into one of these categories. Hence we willonly compare C-130 and RB sizing for three of thesegroupings that included distributions from 3 or more 15min C-130 flight legs with scattering values identified asAS-high, AS-medium and BoB high (Figures 5a and 5b).Because these measurements are not colocated the concen-trations for the C-130 and RB platforms will vary signifi-cantly. Also, there are fewer samples from the C-130 due toits shorter time available for sampling opportunities undereach condition. Even so, for each of these categories on theC-130 and RB, the size distributions and mean values isshown in Figures 5a and 5b along with the mean values forboth the number and volume distributions.[38] In each of these three cases measured on both the C-
130 and RB there is frequent evidence of a bimodal
accumulation mode number distribution that can be charac-terized with two lognormal distributions (not shown). Thesmaller and larger of these two components clearly fluctuateand may dominate the accumulation mode number. How-ever, the submicrometer volume distribution is alwaysdetermined by the larger of these modes and is describedwell by a single lognormal fit (see below).[39] Although these RB and C-130 groupings are from
different times and places certain features are common toboth platforms. For the AS-medium case the number distri-butions show the greatest variability. The single unusuallyhigh number concentration in the smaller mode evident onthe C-130was collected closest to India on ourmost northerlyexcursion. However, the corresponding mass volume distri-bution is close to the average indicating these enhancementsin the smaller mode may influence the cloud condensationnuclei (CCN) but contribute little aerosol mass or opticaleffect. All other C-130 distributions reflect the range ofbehavior also evident in the RB data. For the AS-high case(Figure 5) the distributions are similar to the AS-medium casebut both the RB and C-130 data show greater dominance andfluctuations in the smaller of the two components of thebimodal accumulation mode number. A narrowing of thenumber distribution is also evident for both RB and C-130AS-high data. The super-micrometer aerosol for the AS-highcase is similar to the medium case for each platform, againreflecting the fact that the magnitude and variation in meas-ured scattering is linked primarily to increases in accumu-lation mode volume. The BoB-high case in both RB and C-130 number distributions are more narrow and have rela-tively fewer coarse particles. The volume mean diameters onboth platforms are also shifted to slightly larger sizes andsuggesting a possible change in associated MSE values.
2.6. Optical Properties
[40] Comparisons of light scattering and light absorptionwere made for colocated measurements, e.g., including bothUMiami and NOAA/CMDL had instruments at KCO andthose periods when a mobile platform moved close toanother mobile platform or to a stationary platform, e.g.,C-130 flybys of KCO. The altitude of the flight segmentwas used to classify the segment as in or above the marineboundary layer (MBL) which was taken as 1 km. Flightsegments within the MBL were used in these comparisons.Additional interplatform comparisons were made for similarair mass regions and scattering ranges as described earlier.[41] Table 5 summarizes the interplatform comparisons of
intensive and extensive aerosol optical properties duringtimes when the platforms were colocated. For colocatedstationary platforms (e.g., KCO-UMiami and KCO-CMDL)measurements made over the same time period were com-pared. For mobile and stationary platforms (e.g., KCO-CMDL and C-130) platform speed and wind speed weretaken into consideration to ensure equivalent air masseswere compared. A C-130 10 min flyby was typicallycompared to 90 min on either side of the flyby. Duringslow or near stagnant wind speed conditions the time for theair mass to pass KCO was longer than 3 hours but wasreduced to 3 h to reduce problems associated with changesin wind direction and local contamination.[42] Generally the measurements agree within 30% but
absorption measurements (Dp <10 mm) made by NOAA-
INX2 32 - 12 CLARKE ET AL.: INDOEX AEROSOL—A COMPARISON AND SUMMARY
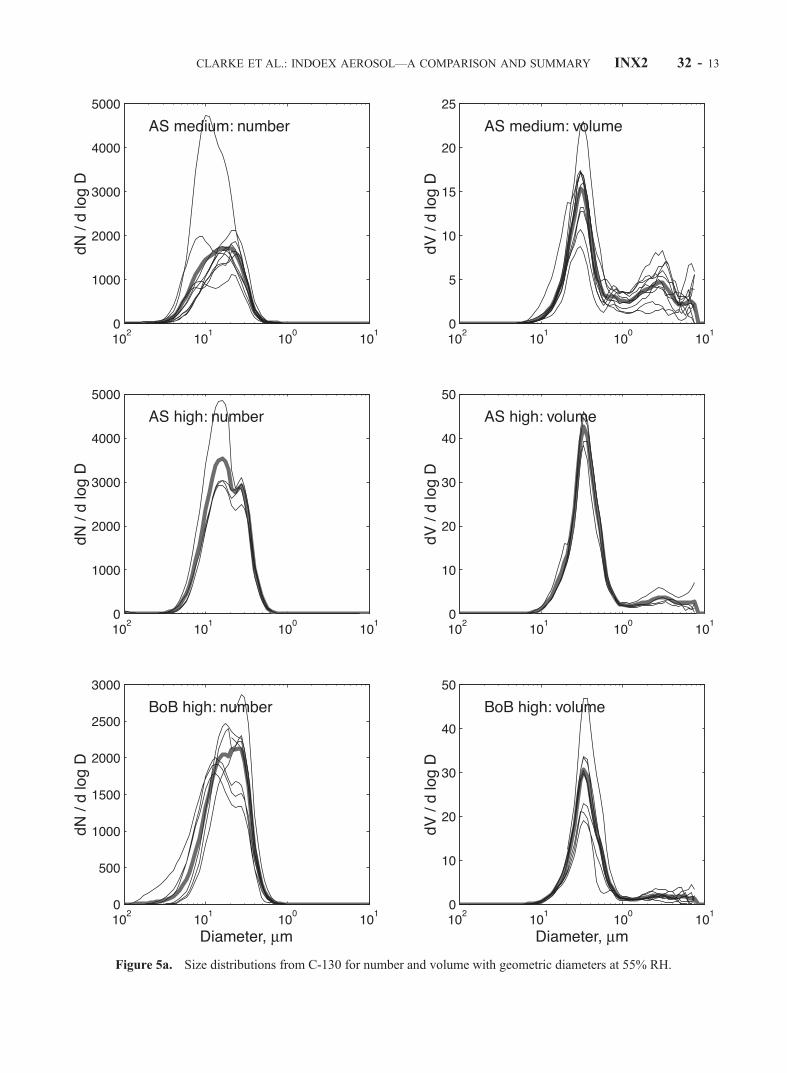
Figure 5a. Size distributions from C-130 for number and volume with geometric diameters at 55% RH.
CLARKE ET AL.: INDOEX AEROSOL—A COMPARISON AND SUMMARY INX2 32 - 13
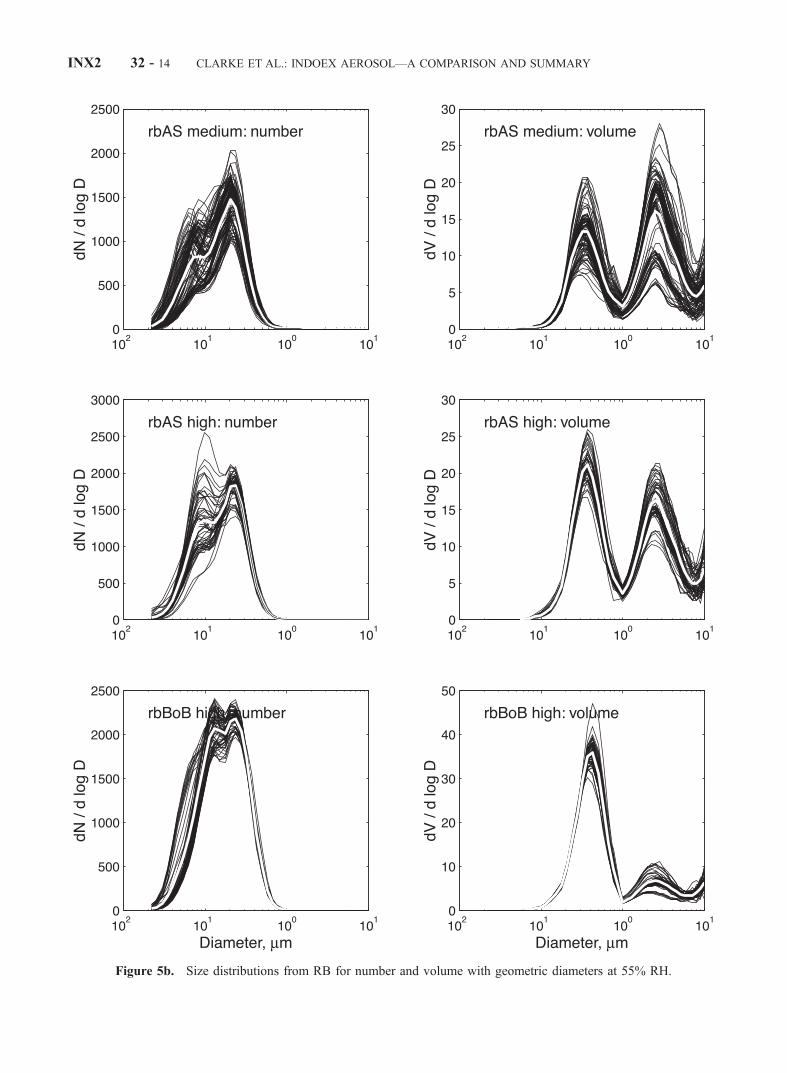
Figure 5b. Size distributions from RB for number and volume with geometric diameters at 55% RH.
INX2 32 - 14 CLARKE ET AL.: INDOEX AEROSOL—A COMPARISON AND SUMMARY

CMDL at KCO tend to be - higher (45%) than the colocatedmeasurements made by UMiami. It is unclear what this largedifference can be attributed to - typically side-by-side com-parisons of the PSAP instrument give results within 6%[Bond et al., 1999]. One known difference is the relativehumidity (RH) at which the two instruments made theirmeasurements. RH is known to affect the quality andnoisiness of the PSAP measurements (P. Sheridan, per-sonal communication, 2001). The humidity at the samplefilters in the PSAP was likely to be higher than thereported system humidities (40% KCO-CMDL, 55%UMiami) because the metal filter holder was exposed toair-conditioned room air.[43] Scatterplots (Figures 6a) of the UMiami and NOAA
absorption, scattering and single scattering albedo for dp<10 mm (UMiami did not measure submicrometer absorp-tion coefficients) show that there is good correlationbetween the two instruments, despite significant differencesin the measurement values. A comparison of the singlescattering albedo showed the two systems differed by aboutwithin 8%, with the KCO-CMDL measurements showinglower albedos in keeping with the higher KCO-CMDLabsorption coefficient and lower scattering measurement.Scattering coefficients measurements by the RB are signifi-cantly higher than either of the KCO-CMDL measurements,48% higher than CMDL and 64% higher than UMiami,although absorption measurements are within 10% andalbedo comparisons are within 12% of the KCO values.The C-130 flybys of KCO yielded higher scattering valuesthan either of the surface-based instruments at KCO, but the
absorption coefficient on the C-130 was 10% lower thanthat measured by CMDL at KCO.[44] Table 6 summarizes key intensive and extensive
measurements in the Northern Hemisphere marine boundarylayer for four platforms. Measurements made at the surface atKCO generally agree (within 15%) with measurements madein the marine boundary layer by the C-130. In contrast to theside-by side comparison of KCO measurements with the RB(Table 5), study-average extensive properties measured onthe RB tend to be lower than both the C-130 measurementsand KCO measurements. This may be because the RBtransects sampled more air transported from cleaner regions(e.g., the northern Indian Ocean) than sampled by the C-130in the MBL or KCO sampling stations.
[45] Table 7 summarizes measured submicrometer opticalproperties for the L, M and H scattering regimes. Measure-ments of extensive properties by CMDL and UMiami atKCO had coefficients of variation (standard deviation/mean) ranging from 0.15 to 0.32, while v had coefficientsof variation ranging from 0.025–0.05, a factor of 4–6smaller. While there are still large excursions in variousparameters, including vo, it is unclear how much can beattributed to platforms sampling different air masses duringthe L, M, H regime comparisons as opposed to differencesin sampling conditions (e.g., cut size, particle losses, etc.)The C-130 data show similar trends as the CMDL andUMiami measurements at KCO. Conversely, measurementsaboard the RB suggest that as the scattering coefficientdecreased the intensive properties of the aerosol alsochanged: the single scattering albedo increased consistentwith a less absorbing (less polluted) aerosol, while thesubmicrometer Angstrom exponent decreased from valuesnear 2.0 to about 1.4 and consistent with a larger (sea salt)aerosol [Delene and Ogren, 2001]. Aerosols with trajecto-ries from the northern Indian Ocean (NIO) and southernIndian Ocean (SIO) fell into the ‘‘low’’ scattering category.Aerosols with trajectories originating over the Arabian Sea(AS) or Bay of Bengal (BoB) tended to have ‘‘medium’’ or‘‘high’’ scattering characteristics, particularly if the air masspassed over India and/or Sri Lanka.[46] Table 8 includes measured optical parameters for
several platforms based on the starting point of air masstrajectories for the air sampled by the platforms. Thesecomparisons suggest that air masses passing over the eastside of India (i.e., over the Bay of Bengal) are more polluted(higher scattering and absorption coefficients, lower singlescattering albedo) than air masses traveling on the west sideof India (i.e., over the Arabian Sea). This result is consistentwith the observed concentrations of nss sulfate and BC fromthe two regions.[47] Table 9 groups aerosol optical properties as a function
of latitude, where latitude is grouped into 3 categories:Northern Hemisphere, ITCZ and Southern Hemisphere.There is good agreement between the C-130 and the RBfor the different regions, except for the absorption coeffi-cients measured in the Northern Hemisphere. As would beexpected, extensive properties decrease significantly alongthe north to south gradient and reflect the lower particulatepollution in the ITCZ and Southern Hemisphere. The singlescattering albedo and backscatter fraction increase in theSouthern Hemisphere, while the Angstrom exponentdecreases, corresponding to a less absorbing, larger aerosol.
Table 5. Ratio of Dp < 1 mmAerosol Light Scattering Coefficients
During Side-by-Side Comparisonsa
KCO-UMiami KCO-CMDL C-130 RB
Light Scattering CoefficientKCO-UMiami 1 1.20 1.40 1.64KCO-CMDL 1 1.17 1.48C-130 1 0.94RB 1
Light Absorption CoefficientKCO-UMiami 1 1.45b N/A 0.94a
KCO-CMDL 1 0.90 0.92C-130 1 0.78RB 1
Single Scattering AlbedoKCO-UMiami 1 0.92b N/A 1.00a
KCO-CMDL 1 1.06 1.09C-130 1 1.04RB 1
Angstrom Exponent (550/700-nm Wavelength Pair)KCO-UMiami 1 N/A N/A N/AKCO-CMDL 1 1.10 1.08C-130 1 0.85RB 1
Backscatter FractionKCO-UMiami 1 N/A N/A N/AKCO-CMDL 1 1.01 0.9C-130 1 1.22RB 1
aValues from the platform given in the column headers are used in thenumerator of all the ratios.
bFor Dp <10 mm.
CLARKE ET AL.: INDOEX AEROSOL—A COMPARISON AND SUMMARY INX2 32 - 15

The two platforms show the same trend for albedo (i.e., a 10%increase from the NH to the SH). As mentioned below, theC-130 optical measurements were consistently higher thanthe RB for most regions compared. Additionally, the twoplatforms definition of the SH are very different - the RBspent a long time in the SH and was much further south thanthe C-130. The C-130 on the other hand spent much of its SHtime in close proximity to the ITCZ and notmuch time in trulypristine SH air. This and the greater uncertainties associated
with low values of scattering and absorption coefficients inthe SH makes these intensive properties less robust.
3. Discussion
3.1. Interplatform Differences
3.1.1. Chemical Properties[48] Variations in concentrations of all chemical species
measured on the different platforms often exceeded 1 stand-
Figure 6. (a) Comparison of absorption coefficients (Dp <10 mm) measured at KCO by NOAA/CMDLand UMiami. (CMDL standard deviation = 8.8 Mm�1). (b) Comparison of scattering coefficients (Dp<10 mm) measured at KCO by NOAA/CMDL and UMiami. (CMDL standard deviation = 27.7 Mm�1).(c) Comparison of albedo measured at KCO by NOAA/CMDL and UMiami (Dp <10 mm). (CMDLstandard deviation = 0.04). Heavy grey line is relationship obtained for CMDLalbedo from slopes ofregression lines for Figures 6a and 6c when forced through zero �1.5 and 0.9 respectively). This yieldsexpression CMDLalbedo = [1 + (1.5/0.9)((UMalbedo)
�1 �1)]� 1.
INX2 32 - 16 CLARKE ET AL.: INDOEX AEROSOL—A COMPARISON AND SUMMARY

ard deviation of the mean concentrations within scatteringregimes, trajectory categories and geographical regions. Inaddition, interplatform comparisons often revealed consid-erable variability in the ratios of concentrations of chemicalspecies. With the exception of BC to TC and BC to OC,differences in mass ratios were often larger than 1 standarddeviation of the means. This result is due in part to thevariability in aerosol sources and transport pathways to theIndian Ocean coupled with airplane and ship tracks that didnot allow for sampling of the same air mass. For example,BoB trajectories, which made up the majority of the highscattering regime, were sampled first by KCO and the C-130 (between 12 February and 3 March) and then by the RB(on 4, 5, and 29 March). Adding to the variability inchemical concentrations within the BoB trajectory categorywas geographical broadness. The category encompassestrajectories that followed a path from Calcutta over southernIndia or Sri Lanka to the Arabian Sea as well as trajectoriesthat came from over central India to the Arabian Sea. Non-
sea salt SO42� concentrations measured on the RB were
observed to vary by a factor of 3 within the BoB categorydepending on the exact path of the trajectory across theIndian subcontinent to the ship. This suggests that morespecific tagging of aerosol properties in terms of potentialsource regions rather than general categories used here maybe necessary to elucidate differences.[49] For the carbonaceous aerosol components consid-
ered, BC and OC, interplatform differences may also haveresulted from nonstandardized sampling and analyticalmethods. Estimated concentrations of BC and OC dependon the measured concentration of total carbon and themethod used to determine the BC/OC split (see AppendixB). Although different methods result in comparable totalcarbon concentrations (within ±20%), estimated concentra-tions of BC and OC are more sensitive to the method used.In addition, estimated OC concentrations can be affected bypositive (adsorption of gas phase organics) and negative(volatilization of semivolatile particulate organics) samplingartifacts [Turpin et al., 2000]. One approach for evaluatingartifact-imposed differences in BC and OC concentrationsinvolves an interplatform comparison of the BC to TC andlight absorption to BC ratios. Consistency in these ratiosacross platforms suggests that artifact-imposed differenceswere not significant or were similar for all platforms.
Table 6. Ratios of Dp < 1 mm Extensive and Intensive Properties for Ground-Based and Aircraft Platforms in
the Northern Hemisphere in the Marine Boundary Layera
C-130/KCO-CMDL
C-130/KCO-UMiami
C-130/RB
RB/KCO-CMDL
RB/KCO-UMiami
ssp 1.01 1.24 1.51 0.41 0.51sap 0.86 N/A 2.12 0.67 0.82b
wo 1.05 N/A 0.93 1.12 1.03b
A (550/700) 1.05 N/A 1.12 0.94 N/AB 1.10 N/A 1.10 1.00 N/A
aAircraft measurements were made by, e.g., the C-130; altitude <1 km.bFor Dp < 10 mm.
Table 7. Values of Dp < 1 mm Extensive and Intensive Properties
for Harmony Categoriesa
KCO-CMDL KCO-UMiami RB C-130
sspHigh 78.5 ± 12.6 61.4 ± 15.2 77.8 ± 8.2 85.4 ± 22.97Medium 42.8 ± 9.0 26.9 ± 10.8 40.3 ± 14.0 43.9 ± 10.7Low (w/SIO) 20.5 ± 4.7 N/A 12.0 ± 5.6 19.7 ± 6.7
(13.3 ± 10.2)sap
High 21.8 ± 5.0 17.8 ± 4.9b 13.0 ± 1.6 20.6 ± 13.6Medium 11.9 ± 3.8 7.7 ± 3.1 5.8 ± 3.0 9.52 ± 9.9Low (w/SIO) 6.3 ± 1.9 N/A 1.1 ± 0.8 4.9 ± 10.3
(2.7 ± 9.8)wo
High 0.78 ± 0.02 0.86 ± 0.02b 0.86 ± 0.02 0.81 ± 0.12Medium 0.79 ± 0.04 0.88 ± 0.03b 0.88 ± 0.04 0.86 ± 0.36Low (w/SIO) 0.77 ± 0.03 N/A 0.94 ± 0.09 0.82 ± 0.09
(0.47 ± 1.28)A (550/700)
High 1.92 ± 0.08 N/A 2.01 ± 0.26 2.08 ± 0.29Medium 1.94 ± 0.08 1.83 ± 0.19 2.10 ± 0.45Low (w/SIO) 1.94 ± 0.06 1.39 ± 0.883 2.16 ± 1.14
(1.86 ± 3.00)B
High 0.10 ± 0.003 N/A 0.10 ± 0.004 0.10 ± 0.02Medium 0.11 ± 0.01 0.10 ± 0.006 0.12 ± 0.03Low (w/SIO) 0.11 ± 0.007 0.11 ± 0.024 0.12 ± 0.07
(0.14 ± 3.23)a‘‘High’’ scattering > 55 Mm�1; 25 Mm�1; < ‘‘medium’’ scattering <55
Mm�1; and ‘‘low’’ scattering <25 Mm�1.bFor Dp < 10 mm.
Table 8. Values of Dp < 1 mm Extensive and Intensive Properties
for Bay of Bengal and Arabian Sea Trajectoriesa
KCO-CMDL KCO-UMiami RB C-130
sspBoB 64.3 ± 25.3 59.5 ± 19.5 87.3 ± 5.0 65.0 ± 18.7AS 59.1 ± 21.5 41.5 ± 18.3 38.5 ± 4.5 51.8 ± 35.4
sapBoB 18.2 ± 7.6 16.7 ± 6.8b 15.7 ± 1.1 17.4 ± 11.5AS 14.7 ± 5.5 12.1 ± 5.7b 5.4 ± 0.9 12.4 ± 15.3
wo
BoB 0.77 ± 0.03 0.86 ± 0.02b 0.85 ± 0.02 0.75 ± 0.09AS 0.80 ± 0.02 0.88 ± 0.02b 0.89 ± 0.01 0.87 ± 0.05
A (550/700)BoB 1.9 ± 0.08 N/A 2.09 ± 0.25 2.08 ± 0.82AS 2.01 ± 0.03 1.75 ± 0.13 2.10 ± 0.54
BBoB 0.10 ± 0.006 N/A 0.09 ± 0.003 0.11 ± 0.05AS 0.11 ± 0.005 0.10 ± 0.003 0.11 ± 0.04aBoB, Bay of Bengal; AS, Arabian Sea.bFor Dp < 10 mm. KCO-CMDL measurements do not extend beyond
DOY 73.6 for Dp < 1 mm; KCO-UMiami measurements do not extendbeyond DOY 80.
CLARKE ET AL.: INDOEX AEROSOL—A COMPARISON AND SUMMARY INX2 32 - 17

[50] The uncertainty associated with collection and anal-ysis of nss SO4
2� typically is less than ±10% [Quinn et al.,2000] so analytical effects were not expected to be a largecontributor to interplatform differences in concentrations. Inaddition, differences in nss SO4
2� concentrations betweenthe RB and C-130 are not a result of the correction requiredto derive nss SO4
2� from total measured SO42�. The Na+
concentration used in the correction was similar for the twoplatforms and was about 2 orders of magnitude less than thenss SO4
2� concentration. The difference also does not appearto be due to a difference in size cuts. Higher nss SO4
2�
concentrations would result if the RB sampler were collect-ing particles larger than the C-130 sampler as more of theaccumulation mode would be collected. In this case moreNa+ also would be collected by the RB sampler. But, for allscattering categories, C-130 Na+ concentrations were higherthan those measured on the RB. NSS sulfate concentrationsin the coarse mode were negligible (at least on the RB)compared to sea salt. Also, coarse mode Na concentrationswere similar on the RB and C-130, not greater on the C-130.[51] Different collection and analysis methods were used
on each platform to determine the submicrometer aerosolmass concentration. In general, concentrations were highestfor KCO-UMiami which employed an impactor with abroad size cut and KCO-Caltech whose sampler includeda larger size fraction of the aerosol. Even though consis-tency in interplatform MSE ratios suggest analytical differ-ences were not great, the observed variability in speciesmass concentrations and MSE were often greater than 1standard deviation of the mean values. This result suggeststhat the aerosol measured by the different platforms hadsimilar scattering per unit mass but different aerosol chem-ical composition. We hypothesize that the measured chem-ical composition differed primarily due to the many aerosolsources and transport pathways over the Indian Ocean,dissimilar platform sampling schedules, and the broadnessof the categories the data was put into for comparison.3.1.2. Size Distributions[52] As mentioned earlier, the measured volume distribu-
tions encompass those sizes most effective optically in theINDOEX region and most of the optical effects are confinedto the submicrometer accumulation mode. In Figure 7 thelognormal fits (dashed line) to the average volume distri-butions (solid line) for the C-130 and RB are compared forthe AS-medium, AS-high, and BoB-high categories shownin Figure 5. The associated lognormal fit parameters to thevolume distribution are summarized in Table 10. Thecalculated scattering distributions based upon the measuredsize data and the lognormal fits are similarly shown in theright hand panels and reveal that the fits produce essentially
the same results as the measured distributions for theaerosol except for a small contribution by coarse aerosolthat is also well described by a separate lognormal fit.[53] The DMPS size distributions measured at KCO (W.
Cantrell et al., Comparisons of calculated and measuredCCN spectra at Kaashidoo Climate Observatory duringINDOEX, submitted to Journal of Geophysical Research,2000, hereinafter referred to as Cantrell et al., submittedmanuscript, 2000) had mass mean diameters and spreadssimilar to both C-130 and RB distributions shown in Figure 5but tended to vary more. The three C-130 flybys of KCO,where data were available to compare, all had volume meandiameters near 0.32 mm on the C-130 while KCO valuesvaried from 0.32 to 0.35 mm (not shown). Some of thisdifference is attributed to greater uncertainty in the KCOflow values and the operating RH (W. Cantrell, personalcommunication, 2000) but overall KCO sizes are consistentwith the RB and C-130 data above.[54] There is good agreement between the RB and C-130
size data and the main differences are a narrower distribu-tion and fewer relative counts in the 0.35–0.8 mm size rangefor the C-130 data compared to the RB. This may be due toseveral reasons. First, the C-130 OPC is sensitive to so-called Mie-oscillations in the scattering properties of theaerosol in this size range [Garvey and Pinnick, 1983] thatcan lead to undercounting of the particles in this range andshifting them to other sizes. Also, there are differences inthe approach used on the C-130 that employs assessment ofmeasured aerosol growth (Figure 2) and chemically basedrefractive indices to adjust the measured ‘‘dry’’ size distri-butions while the RB employs a chemical model for growth.There are also uncertainties in RH values that come intoplay and the ‘‘rescaling’’ of the RB DMA data, as discussedin the appendix.[55] In order to gauge the impact of uncertainties in key
parameters that affect measurement of the size-distributionand related aerosol optical effects we have evaluated theeffect on scattering extinction as we allowed these param-eters to vary. The measured C-130 size-distribution from theRB flyby is taken as the reference distribution and randomperturbations are made on sample flow rate, particle diam-eter, real and imaginary refractive index (as specified by RBmeasurements) and RH at the point of measurement. Thevariables, their variances, and the differential change in theresulting scattering are shown in Table 11. Scattering sizedistributions based on the combined OPC and DMA dis-tributions were calculated 2000 times with input variablesperturbed by normally distributed random amounts. Therealization of these random perturbations are shown inFigure 8 along with the reference RB distribution (heavy
Table 9. Values of Extensive and Intensive Properties for Submicrometer Aerosol in the Marine Boundary
Layer as a Function of Latitude for the C-130 and RB
RB NH C-130 NH RB ITCZ C-130 ITCZ RB SH C-130 SH
ssp 42.3 ± 26.7 63.27 ± 28.4 17.4 ± 6.2 20.7 ± 19.0 8.6 ± 5.6 6.41 ± 6.07sap 6.8 ± 5.3 14.82 ± 7.6 5.15 ± 4.2 5.08 ± 4.79 0.7 ± 0.4 1.54 ± 1.68wo 0.88 ± 0.04 0.82 ± 0.04 0.90 ± 0.05 0.82 ± 0.10 0.98 ± 0.03 0.90 ± 0.10A (550/700) 1.80 ± 0.40 2.04 ± 0.28 1.17 ± 0.34 1.98 ± 0.07 1.11 ± 0.64 1.87 ± 0.57B 0.10 ± 0.012 0.11 ± 0.01 0.10 ± 0.006 0.11 ± 0.02 0.11 ± 0.02 0.14 ± 0.04
INX2 32 - 18 CLARKE ET AL.: INDOEX AEROSOL—A COMPARISON AND SUMMARY

Figure 7. Measured and lognormal fit distributions for volume and scattering. Geometric diameter at55% RH?
CLARKE ET AL.: INDOEX AEROSOL—A COMPARISON AND SUMMARY INX2 32 - 19

line). A range of one standard deviation for these perturba-tions is indicated by the dashed line, reflecting a ±20% inintegral scattering. The frequency histogram of integralscattering values is also included as an insert and suggestsa tendency for more cases present with scattering above themost frequent value than below it. This is a consequence ofthe nonlinear dependency of scattering on particle size.[56] As a test of ‘‘local’’ closure, the regression of
measured and calculated light-scattering was done on boththe RB and C-130 platforms using a Mie scattering code.On the RB, the size distributions and nephelometer were atthe same humidity, so a size-dependent refractive indexcalculated from the aerosol composition during the RBflyby was used. A linear regression of 17 sampling periodsyielded a slope of 1.07, an intercept of 1.37 Mm�1, and acorrelation coefficient of 0.98. The lack of humidity controlon the aircraft made the calculations somewhat morecomplicated. The D/Dref relationship from Figure 2 wasused to adjust the OPC size distribution to the nephelometerhumidity. The same size-dependent refractive index wasused, but corrected for the difference in water mass betweenthe nephelometer RH and the 55% of the RB sampler.Fortunately, these corrections were small. Scattering calcu-lations for all 17 horizontal legs below 100 m where boththe OPC and nephelometer sampled enough of the leg to getmeaningful averages yielded a slope of 1.06, an intercept of�2.18 Mm�1, and a correlation coefficient of 0.98. Thesecan be compared to similar comparisons is extended to allINDOEX legs at all altitudes where we get correlationcoefficients of 0.93 for submicrometer aerosol and 0.87for total aerosol. Also, if we compare all calculated scatterfrom OPC sizes modeled at the same RH as the humidifiednephelometer for all legs we get correlation coefficients of0.84 for submicrometer aerosol and 0.81 for total aerosol.
Hence, agreement between OPC calculated scattering andmeasured values are good for both wet and dry nephelom-eter measurements throughout the INDOEX campaign butare best for the low altitude data (with generally higherconcentrations) compared here.[57] Herewe take size distributions from the C-130 andRB
at the time of the RB flyby and used them to calculatescattering coefficients that can be compared to values meas-ured in the C-130. Calculated and measured scattering for thethree nephelometer wavelengths for periods when the neph-elometer sampled both submicrometer (Da = 1.0 mm) and‘‘total’’ aerosol (Da <10 mm) are shown in Figure 9. Forsample legs in the marine boundary layer, unexpected heateroscillations in the nephelometer sampling line periodicallyvolatilized the incoming aerosol [Sheridan et al., 2002].Hence, comparisons are only possible during the highlightednephelometer measurement periods in Figure 9. Agreementis excellent for the C-130 calculated scattering for thesubmicrometer aerosol (ca. 0818 GMT) at all wavelengthswhile calculated values from RB size distributions are about10% higher. We believe this indicates that submicrometeraerosol on the C-130 are effectively sampled and measuredboth by the nephelometer and by the aerosol sizing instru-mentation such that local ‘‘closure’’ between measured andcalculated values is achieved. The somewhat higher calcu-lated RB scattering values are well within the range ofuncertainty (ca. 10%) in either the measurement or even thepossible natural aerosol variability in measurement region.[58] When sampling ‘‘total’’ aerosol (ca. 0828 GMT) the
C-130 calculated scattering values are about 10% lower thanmeasured while values calculated from RB sizes are some-what higher than measured C-130 values (Figure 9). Weexpect that this is may be a result of three possibilities. Thefirst is coarse particle sample line losses between the CAIinlet that are greater for the C-130 OPCmeasurement than forthe nephelometer resulting in poorer estimates of scatter for
Table 10. Lognormal Fits to Amplitude, Peak Diameter, and
Standard Deviation for C-130 and RB Volume Distributionsa
Amp1 Dp1 Std D1 Amp2 Dp2 Std D2
C-130AS medium 5.5 0.30 1.42 3.8 2.3 2.28AS high 15.2 0.34 1.43 3.3 2.9 2.28BoB high 9.7 0.34 1.39 3.1 1.1 4.89
RBAS medium 6.3 0.34 1.54 9.6 2.8 1.83AS high 9.5 0.36 1.51 10.3 2.7 1.88BoB high 15.1 0.40 1.48 5.7 3.4 2.44
aDiameter in mm.
Table 11. Effects of Size Distribution Error Modes on Calculated
Scattering
Variable Variance Scattering change RelativeImportance
Diameter 5% of diameter 20% 0.46Flow rate 3% of flow rate 3% 0.07Real refr. index 10% of diff.
from unity15% 0.35
Imag. refr. index 10% of value �0.4% 0.01RH at OPC 3% RH �5% 0.12
Figure 8. A Monte Carlo simulation of 2000 possiblevariations in the scattering distribution for the RB flyby forrandomized uncertainties in various input parameters (seetext). Dashed lines indicate one standard deviation about thereference distribution. Inset shows skewed frequencydistribution of scattering around median value.
INX2 32 - 20 CLARKE ET AL.: INDOEX AEROSOL—A COMPARISON AND SUMMARY

the larger OPC sizes. The flow path to the OPC is morecomplex due to the thermal analysis system and the inlet tothe OPC is not designed to transmit particle larger than 7mmeffectively while the nephelometer has large bore and shortertubing with little bends. The second is better sampling ofcoarse aerosol by the RB than by the C-130 as suggested bycoarse size differences in Figures 5a and 5b. A third could beoverestimates of growth corrections for the RB APS. Evenso, the differences in size distributions and associated opticalproperties for both RB and C-130 measurements during theflyby are small and within predicted uncertainties.3.1.3. Optical Properties[59] All platforms during INDOEX measured consider-
able variability in aerosol light scattering and absorption.Some of this variability may be attributed to meteorologicalinfluences (e.g., rain) but the greatest changes were asso-ciated with changes in the characteristics of the sourceregion of the aerosol. Even within the polluted NorthernHemisphere, there were times when light scattering fell intothe Low scattering category. Even so, aerosol intensive
properties were much less variable with greatest variationsevident along the north–south gradient. Moving fromNorthern Hemisphere to Southern Hemisphere there was afactor of 5 to 10 decrease in absorption and scattering thatcorresponded with a 10% increase in albedo. For compar-ison, the shift in trajectory regime from BoB to AS in theNorthern Hemisphere resulted in less than 5% increase inalbedo, while absorption and scattering decreased by lessthan a factor of 3. The Northern Hemisphere H and Lscattering regimes, which showed shifts in extensive proper-ties ranging from factors of 4 to 6, showed small differencesin albedo (�1%) except for the RB measurements. Thesesuggested a 9% differences in albedo for the RB’s moreextensive measurements in the L scattering regime.3.1.4. Consistency of Measurements[60] In spite of specific cases of good ‘‘local’’ closure
mentioned above, general comparisons among the C-130,KCO-UMiami and KCO-CMDL showed that the lightscattering and absorption coefficients measured by theseplatforms would differ by 30%. Extensive and intensive
Figure 9. Light scattering values measured (C-130) and calculated from size distributions during RBflyby. The first time period is for submicrometer aerosol and the second is for total aerosol. See colorversion of this figure at back of this issue.
CLARKE ET AL.: INDOEX AEROSOL—A COMPARISON AND SUMMARY INX2 32 - 21

aerosol optical properties measured by the C-130 and KCO-CMDL were in better agreement, typically within 15%, formost comparisons but larger than expected based uponestablished instrument performance.[61] KCO-UMiami measured lower scattering (20%) and
absorption (45%) values than the CMDL package at KCO,while scattering measured on the RB tended to be higherthan either of the KCO platforms for side-by-side compar-isons. This could be due to in part to a 20% difference in theamount of submicrometer scattering aerosol (calculatedfrom ssp(Dp <1mm)/ssp(Dp <10 mm) for these platforms:KCO-CMDL had a study average submicrometer fraction of0.66 while KCO-UMiami had a submicrometer fraction of0.51. The RB had a study average submicrometer fractionof 0.75 which could also explain the higher RB scatteringvalues. (Note: The submicrometer absorbing fraction of theaerosol measured by KCO-CMDL was 0.84.) Uncertainty insize cut may contribute to this discrepancy. However, usingthe Caltech data for density as a function of RH expectedgeometric cut-size diameters were determined to be 0.72 mmat RH = 40% and 0.75 mm at RH = 55% for the KCO, RBand C-130 impactors. Comparisons with possible scatteringdistributions in Figure 7 would suggest that this smalldifference is unlikely to be enough to explain the higherRB measurements unless the cut occurred at smaller sizesand/or was broader than expected. For example, to explainthe 20% difference in submicrometer scattering, weassumed the KCO-CMDL impactor operated as designed(size cut = 0.72 mm and RH = 40%) and used Figures 2 and7 to estimate operating conditions for the UMiami impactor.The UMiami impactor size cut would have to be 0.59 mmand the RH resulting in that size cut �70% in order toexplain this submicrometer scattering difference. Thesevalues are far from the designed system parameters that,while they do not eliminate RH-influenced size cut as afactor, they do suggest other factors contribute to theobserved differences.3.1.5. Consistency of Intensive Parameters[62] Intensive parameters (vo, b, a) were typically within
20% of each other in spite of the much larger differences forextensive parameters. This difference between the variabilityof intensive and extensive properties may be expected forsituations where mixing of clean and polluted air is the sourceof the variability. For example if two different air masses(clean air: ssp = 5 Mm�1, vo = 0.95; polluted air: ssp = 100Mm�1, vo = 0.80) were mixed the scattering coefficientcould vary by a factor of 20 as the mix varied from clean topolluted but the maximum variation in albedo would be lessthan 20%. Other processes that affect extensive propertiessuch as precipitation scavenging or particle losses in inlets,can change intensive properties only if they discriminateagainst particles with different size or composition.[63] We can hypothesize three possible explanations for
differences in measurements: (1) differences in the ambientaerosol; (2) differences in the sampled aerosol; (3) differ-ences in how the instruments work. Instrument uncertaintiescan only explain some of the differences in the side-by-sidecomparisons. Previous side-by-side comparisons of 2 neph-elometers have shown that when sampling the same air theyagree within 1% for submicrometer particles [Anderson andOgren, 1998]. Comparisons of 3 PSAPs in parallel haveshown that these instruments can agree within 4% when
measuring the same aerosol [Bond et al., 1999], althoughAnderson et al. [1999] noted that instrument noise in thePSAP can be significant and should be determined for eachinstrument individually. The analysis described in Table 4,shows that the uncertainty in light scattering measurementsfor a TSI nephelometer is 5.2 Mm�1 for submicrometerscattering measurements in the 50 Mm�1 range, equivalentto 10% uncertainty. This is not enough to explain whysubmicrometer scattering measured by CMDL at KCO was20% greater than the scattering measured by UMiami atKCO, or why the scattering measured on the RB was 48%greater than the scattering measured by CMDL at KCO. Wedo not have a definitive explanation for the differences,although it seems unlikely that the third hypothesis (differ-ences in how the instruments work) is entirely responsible.However, the other two hypotheses remain unresolved: (1)that the aerosols were actually different, due to spatial ortemporal variations; or (2) that sampling inlets and/or impac-tors had different size-dependent sampling efficiencies. Thefirst cannot account for the CMDL/UMIAMI differences atKCO while the second might play a role if size classificationis less certain than expected. Additionally, these intercom-parisons suggest that stratifications based on L, M, and Hscattering categories may obscure variability due to sourcesor aerosol character.
4. Summary of Indoex Aerosol Properties
4.1. Chemical Properties
[64] Although concentrations of chemical species variedbetween platforms, for the individual platforms all concen-trations of BC, OC, TC, nss SO4
2�, and submicrometeraerosol mass increased with a shift from the low to mediumto high scattering regime. For example, at KCO, on the C-130, and on the RB, nss SO4
2� mean concentrations in thehigh scattering regime were a factor of 3.2, 12, and 5.2higher, respectively, than mean concentrations in the lowscattering regime. In addition, for the two mobile platforms,mean concentrations of nss SO4
2� were a factor of 8 (RB) to25 (C-130) higher for the Northern Hemisphere (latitudesnorth of 1�S) than for the Southern Hemisphere (latitudessouth of 5�S). Measurements of BC, OC, TC, and aerosolmass on the RB followed the same trend with decreasingconcentrations as the ship moved from the Northern Hemi-sphere, to the ITCZ (latitudes between 1�S and 5�S), and tothe Southern Hemisphere.[65] When the Northern Hemisphere air masses are sep-
arated into trajectories coming from the AS and thosecoming from the BoB, trends observed by the C-130 andRB are quite different, however. The C-130 mean concen-trations of nss SO4
2� were higher in the AS than the BoB airmasses while BC, OC, and TC mean concentrations weresimilar. RB mean concentrations of nss SO4
2�, BC, OC, andTC were all higher in the BoB than the AS air masses.These differences reflect the variability in transport path-ways and resulting aerosol concentrations within the AS andBoB trajectory classifications and the different samplingschedules of the two platforms.[66] Unlike the absolute mass concentrations, within each
platform submicrometer mass ratios of the chemical species(BC to TC, OC to nss SO4
2�, and nss SO42� to aerosol mass)
were relatively consistent across scattering regimes. In
INX2 32 - 22 CLARKE ET AL.: INDOEX AEROSOL—A COMPARISON AND SUMMARY

addition, BC to TC ratios were similar for all platformsaveraging about 0.5. On all platforms, the BC to nss SO4
2�
mass ratio increased with a shift from the low to medium tohigh scattering regime indicating more BC relative to sulfatein the more polluted air masses. Mean ratios of nss K+ toBC were higher on the RB than on the C-130 for themedium and high scattering regimes. Based on theseobserved ratios, it appears that the RB detected a greateror more frequent influence of biomass burning emissions onthe aerosol chemical composition than the C-130. Meanscattering to mass ratios (at 33% RH) measured at KCO andon the RB were consistent between platforms and scatteringregimes ranging from 3.4 to 4.4 m2 g�1. Ratios based uponIC and carbon analysis from the C-130 were about 40%higher due largely to the use of the sum of chemicallyanalyzed mass instead of gravimetrically determined massfor the total mass concentration. Absorption to BC ratios aremore variable between platforms but still within 1 standarddeviation of the mean values. Mean ratios showed no trendwith scattering regime and ranged from 9.2 to 20 m2 g C�1
across all platforms and scattering regimes.
4.2. Microphysical Properties
[67] The size distribution of the INDOEX aerosol thatdominated mass and optical properties was submicrometeraccumulation mode aerosol. This was predominantly aninternal mixture [Ramanathan et al., 2001] of soot-likeaerosol mixed with the chemical species discussed above.The measured number distributions on the RB and C-130were quite variable with frequently a smaller and largernumber mode contributing to the accumulation mode (ca.50 nm to 700 nm). The volume distribution and opticalproperties were dominated by the larger and less variablecomponents (ca. 150 nm to 700 nm). Integrated sizedistributions on the C-130 agreed with total CPC measurednumber and revealed negligible concentrations below CPClower limit size detection. This supported the scaling ofnumber distributions on the RB to CPC total number, asfound necessary due to flow fluctuations in RB sizinginstruments. When the data from both platforms werestratified into regimes, aerosol submicrometer numberdistributions exhibited similar variations in each classifi-cation, suggesting that the measurements and variationsseen on both platforms were representative. Though morelimited and more variable, DMA size distributions alsomeasured at KCO near the time of C-130 flybys variedwithin the fluctuations shown here for the RB and C-130distributions.[68] At a typical measurement RH of 55% the accumu-
lation mode volume mean diameter was generally near 0.34mm and with a spread (sigma) of about 1.4. A separatecoarse mode component with a volume mean diameter ofabout 2.7 mm generally included sea-salt and at times dust orfly ash but usually had a small effect on light scattering.Even after correction for super-micrometer particle trans-mission efficiencies in the C-130 CAI inlet the coarseparticle concentrations appeared to be lower by a factor of3 or so compared to the RB. Although near surfacegradients in species such as sea-salt could not be ruledout, it is probable that coarse particle transmission lossesbetween the CAI and the C-130 sizing instruments areresponsible for much of this difference.
[69] Wing probe size distributions aboard the C-130 inthe noncloud environment often trended in number withonboard size distributions but usually failed to capture thepeak in the accumulation mode distributions and tended toundercount the internal probes for all size ranges. Coupledwith often erratic and unpredictable variability these wingprobe data were generally not suitable for determination ofaerosol optical properties.[70] A Monte-Carlo simulation of perturbations to the
calculated scattering caused by uncertainties in the sizedistribution at 55% RH was shown to have greatest sensi-tivity to characterization of diameter (45%) and the realrefractive index (35%). At this RH, sensitivity in calculatedscattering due to possible uncertainty in measured RH wasonly about 12% but this can be expected to become muchgreater at higher RH typical of boundary layer ambientconditions. Even so, the combined random errors possiblyaffecting the size distribution measurements showed that66% of the 2000 realizations for calculated scatteringdistributions fell within ±25% of the reference scatteringvalue. However, due to the nonlinear dependency of lightscattering on size the random fluctuations about the meancharacteristics tend to result in more frequent higher scatter-ing values than lower scattering values. This suggests thatrandom errors in measurements affecting size could tend toslightly overestimate derived scattering values in the mean.[71] Light scattering properties were very well described
by lognormal fits to the volume size distribution on both theC-130 and RB. In the high scattering events in the ArabianSea the lognormal fit parameters at 55% RH for volumeaccumulation mode diameter were 0.34 mm and 0.36 mmwith spreads (standard deviation) of 1.43 and 1.51 for C-130 and RB distributions respectively. This reflects thetendency to slightly smaller diameters and narrower peaksin the C-130 data. Both platforms suggest a slight increasein aerosol diameter with concentration.
4.3. Optics
[72] Considerable variability in all optical properties wasseen across the different comparisons. Surprisingly, theside-by-side comparisons were not significantly better thanthe scattering regime and air mass comparisons, despite theadded benefit of the platforms being colocated. For exam-ple, the RB measured scattering 48 and 64% higher thanKCO-CMDL and KCO-UMiami during side-by-side meas-urements, while scattering regime and trajectory compar-isons of scattering were within 50%. Differences in inlet andsampling conditions (e.g., RH, Dp) may have contributed toobserved differences in the side-by-side comparisons, whileadditional variability was introduced by the sampling ofdifferent air masses for scattering regime and trajectorycomparisons. Consistent with the chemistry measurements,there was less variability among intensive properties thanextensive properties.[73] Northern Hemisphere extensive properties during
polluted conditions (e.g., H scattering regime and BoBtrajectory) ranged from 60–85 Mm�1 for scattering andbetween 15–22 Mm�1 for absorption. Single scatteringalbedo values were between 0.77 and 0.86, while back-scatter fraction and Angstrom exponent were fairly invariantat 0.10 and 2.0 respectively. Southern Hemisphere valuesare available for the RB and C-130, although the statistics
CLARKE ET AL.: INDOEX AEROSOL—A COMPARISON AND SUMMARY INX2 32 - 23

for the C-130 are limited because it was not in the SH forlong. Further hampering the comparison is the consistentdifference mentioned above between the RB and C-130even for the more robust Northern Hemisphere measure-ments. Nonetheless, Southern Hemisphere extensive proper-ties tended to be 5 to 10 times less than values measured inthe NH, while single scattering albedo increased by about10% over values measured in the NH.
4.4. Comparison of Mass Scattering Coefficients
[74] The various measurements discussed previously pro-vide a general understanding of the characteristics anduncertainty present in an experiment of this kind. Certainvalues, particularly intensive properties, are a valuable toolfor modelers and others to employ. The mass scatteringextinction ratio (MSE or specific scattering extinction) isimportant because it provides a link between mass andoptical properties. However, as shown here, both mass andoptical properties can be derived from a variety of measure-ments. The extent to which values are seen to agree
provides an indication that ‘‘closure’’ is being achievedand that confidence can be placed in the values so derived.[75] In Figure 10 we have compared six approaches for
obtaining submicrometer MSE at 33% RH from the C-130and RB as a function of the measured scattering with thelow, medium and high ranges indicated. These includevarious definitions of MSE based upon mass and scatteringvalues corrected to 33% RH. The six definitions are:measured scattering to gravimetrically measured mass(RB), measured scattering to mass estimated from sizedistributions (RB and C-130), scattering to mass ratiosdetermined solely from size distributions (RB and C-130)and measured scattering to filter extracted chemically deter-mined mass (C-130) after correction for associated water at33%RH. Note that circled C-130 values are identified asoutliers in mass measurements [Mayol-Bracero et al.,2002]. In order to have one consistent definition of MSEin Figure 10, it was necessary to add an estimate of thewater mass expected at 33% RH to the mass determined bychemical analysis aboard the C-130. This was done as out-
Figure 10. MSE values as a function of scattering values for various measurements (see text). See colorversion of this figure at back of this issue.
INX2 32 - 24 CLARKE ET AL.: INDOEX AEROSOL—A COMPARISON AND SUMMARY

lined in the discussion of Figure 2 above by assuming that drydensity was 2.2 g/ml and that all additional volume as themeasured particles grow 14% in diameter is due to water.[76] Several features of the MSE values in this plot are
summarized here for the indicated L, M and H categories:[77] HIGH scattering category representative of the most
concentrated INDOEX haze plumes: (1) About 80% of allvalues fall between about 3.4 and 4.0 m2 g�1. (2) Valuesbased upon RB gravimetric mass are about 15% higher thancorresponding values based upon RB size distributions. (3)Values based upon measured scattering and size derivedmass are indistinguishable for both RB and C-130 and notsignificantly different from MSE values estimated from sizealone. This reveals the good agreement between measuredsize and scattering found independently on both platforms.[78] MEDIUM scattering category representative of mod-
erate INDOEX pollution events: (1) Values based on gravi-metric mass tend to have increased variability and remainmore elevated compared to other MSE measurements. (2)Values based uponmeasured scattering and size derived massremain similar but with increased variability (both RB and C-130) and not very different from values based exclusively onsize. There is also a tendency for all but gravimetric values todecrease as scattering values decrease.[79] LOW scattering category representative of diluted
continental and/or ‘‘clean’’ MBL air: (1) A general increasein variability in MSE for all measurements, as might beexpected for ratios of measurements at low concentrationswhere signal to noise is greater. (2) The tendency for severalgravimetric based MSE values on the RB to significantlyexceed bothMSE values based upon size suggests the greateruncertainty likely for gravimetric data obtained at lowerconcentrations. Variability is least for MSE values basedexclusively on size since numerator and denominator areobtained from the same instrument measurement. (3) Ten-dency for MSE data to be greater on RB than C-130. [Note:MSE values for C-130 collected for altitudes above 30 m (notshown) were consistently higher than the values shown hereand similar to average values for RB data in this category.][80] The tendency for values from all approaches to
converge under the high scattering regime where signal tonoise issues are less of an influence provides confidencethat the MSE for the INDOEX haze is well constrained.This suggests MSE values from each platform is represen-tative of the haze. The gradual decrease in MSE valuesongoing from high toward low scattering conditions evidentin most measurements is probably real since uncertainties insingle particle sizing instruments on both the RB and C-130are insensitive to concentration changes compared to gravi-metric or even nephelometer measurements. The greatervariability of MSE in Figure 10 as determined from chem-ical composition is unsurprising, as the mass is the sum ofseveral individual measurements, some of which are inevi-tably close to or below detection limits given the shortsampling times possible on the aircraft. However, somevariability is expected due to changes in aerosol propertiesand air mass types.
5. Conclusions
[81] Concentrations of chemical species measured on thedifferent platforms were highly variable within scattering
regimes, trajectory categories, and geographical regions.These interplatform differences often were greater than 1standard deviation of the mean concentrations for a partic-ular category. In addition, comparisons between platformsrevealed large variability in the mass ratios of chemicalspecies. With the exception of BC to TC and BC to OCratios, differences in mass ratios were larger than 1 standarddeviation of the mean values. Although analytical differ-ences may contribute to the observed variability, consistentinterplatform scattering to mass ratios and absorption tomass ratios imply that analytical differences were not great.We hypothesize, therefore, that these differences also reflectthe variability in aerosol sources and transport pathways tothe Indian Ocean coupled with airplane and ship tracks thatdid not allow for sampling of the same air masses. Making‘‘round robin’’ chemical intercomparisons of different anal-ysis techniques for the same sample and appropriate side-by-side platform comparisons should be a high priority infuture multiplatform experiments and would help to differ-entiate analytical variance from natural variance.[82] Although variations in size distributions were
marked on each platform and for each category discussedhere the ‘‘shape’’ of the distributions in terms of meanlognormal diameters and widths were found to be quiteconsistent for all platforms. The RB accumulation modealso tended to indicate a slightly larger volume meandiameter than measured on the C-130 that is probably aresult of Mie scattering effects in the C-130 OPC near 0.6mm. Even so, lognormal fits to the measured volume modeon both platforms provided excellent representation ofassociated light scattering and supports using this approachto modeling optical effects in terms of size and composi-tion. The RB flyby was the only case of ‘‘local closure’’ formeasured scattering and modeled values between the RBand C-130 platforms (based upon size and measuredchemistry) but showed very good agreement in derivedscattering extinction with differences less than 20%. How-ever, Monte Carlo simulations (2000 realizations) werecarried out for realistic random variations in scatteringdistributions derived from variations in sizing measurementparameters for this ‘‘flyby’’ distribution. These realizations(Figure 8) resulted in variability of one standard deviationrepresenting a ±25% variation in derived extinction. Theyalso revealed that the frequency of distribution about thereference scattering value was skewed from a normaldistribution. The most frequently occurring simulated valuewas about 3% less than the reference value. Also, the falloff in frequency of occurrence for larger scattering valueswas more gradual than for smaller scattering values (i.e.,unusually large realizations were more evident than unusu-ally small realizations).[83] Coarse particle volume measured with the APS was
generally higher on the RB than both OPC and wing probedata on the C-130 by a factor of 2 or so, even aftercorrecting OPC data for CAI sampling efficiency. Thismay be due to large particle losses in the longer and moreconvoluted sample lines to the OPC inside the aircraft and/or possible uncertainties in APS coarse particle behavior(see Appendix B). In view of the dominance of accumu-lation mode aerosol for INDOEX aerosol optical properties,these differences for RB and C-130 coarse particle contri-butions to extinction in were shown to have less than 8%
CLARKE ET AL.: INDOEX AEROSOL—A COMPARISON AND SUMMARY INX2 32 - 25

influence on near surface optical properties (see Figure 4)and even less for column average values due to generallymore rapid fall off in coarse particle aerosol with height.Wing probe data was found to be generally unreliable fordetermining accumulation mode optical characteristics butwas more consistent at larger sizes where, as discussed,contributions to overall optical properties were small.[84] Intensive and extensive aerosol optical properties
observed during INDOEX demonstrated several trendsacross platforms: (1) aerosol properties were representativeof clean air in the Southern Hemisphere and more pollutedair in the north hemisphere, while the ITCZ aerosol hadproperties between the two; (2) air mass trajectories fromthe Bay of Bengal tended to be more polluted than airfrom the Arabian Sea (3) categories of high, medium andlow scattering were also periods of high, medium and lowabsorption, although intensive properties across platformsdid not show a pattern consistent with differing contribu-tions of pollution aerosol for each category. Additionally,all platforms measured absorption coefficients in theNorthern Hemisphere higher than typically reported atUS rural continental sites, resulting in low albedo obser-vations (range 0.78 to 0.94) for the INDOEX study region.Despite consistent trends among platforms, quantitativecomparisons of extensive properties showed significantdifferences (up to 60%) even for colocated instruments(e.g., KCO-UMiami and RB) and up to a factor of two foridentical instrument packages (e.g., KCO-CMDL, C-130,RB) within L,M and H scattering regimes. Intensiveproperties generally agreed within 20% for all scenariosstudied.[85] We note that the best overall agreement was found
between the C-130 and KCO-CMDL measurements (withsimilar plumbing and RH conditioning) which typicallyagreed within 15% for both extensive and intensive proper-ties. Differences between identical instruments in slightlydifferent packages (e.g., RB and KCO-CMDL) during side-by-side comparisons are particularly disturbing. Knownmeasurement uncertainties cannot explain the observeddifferences in intensive and extensive properties. Hence, itseems likely that instruments were sampling different aero-sols due to temporal or spatial variations or that individualsampling variations resulted in different subsets of theatmospheric aerosol being measured. Also, stratificationbased solely on ranges of scattering coefficient (e.g., theL, M, H categories) exhibits variability in optical propertiesin each range that suggests differences in regional andaerosol characteristics.[86] Although the high correlations found between meas-
ured and modeled scattering on the RB and C-130 are goodexamples of ‘‘local closure’’ some of the differences justdiscussed in the ratios of chemical species and in opticalproperties evident between platforms are greater than onewould expect. In spite of this, the various determinations ofMSE ratios presented for the RB and C-130 under thehigher haze conditions (where measurements are mostrobust) and at 33% RH were shown to be about 3.8 ± 0.3m2 g�1. However, at lower concentrations MSE values aremore varied. This probably reflects a combination of thegreater measurement uncertainties at low concentrations andreal variations in aerosol properties. This low variability inMSE values both between techniques and in various loca-
tions is well within the range expected for possible 10%uncertainties in measured scattering coefficients and 20%possible uncertainties in modeled size distribution proper-ties discussed in the text. Also, since several of the uncer-tainties assumed (e.g., uncertainty in an RH sensor ormeasurement of particle diameter by a particular instrument)are often be systematic and not random this 20% uncertaintymay be an upper limit. However, we believe that withoutgreat effort to ensure sensor and measurement performanceon all platforms during experiments like INDOEX it will bedifficult to claim ‘‘closure’’ with an uncertainty much lessthan this. Even so, the data discussed here provides our bestunderstanding of the chemical, microphysical and opticalproperties of aerosol in the INDOEX region and providessignificant constraints upon the interpretation and modelingof aerosol properties for the region. At the same time, thevariability in the average aerosol intensive properties evi-dent on each platform and within the various categoriesdiscussed here points out the difficulty of describing ‘‘typ-ical’’ conditions for even a single intensive samplingcampaign. This underscores the long-term need to linkand extend such assessments to satellite observations thatcan provide measurements over the spatial and temporalscales needed to reliably interpret regional and globalimpacts.
Appendix A.
A.1. Platforms
[87] The intensive phase of INDOEX involved near sur-face measurements from five platforms that were usuallyactive in different regions at different times, often employeddifferent measurement approaches, different analytical tech-niques, different sample inlet configurations and differentsampling conditions. A brief description of sampling sys-tems on the various platforms provides a starting point forassessing potential differences that might impact a consis-tent description of the INDOEX aerosol. Since effectivecomparison of similar measurements on the Sagar Kanya[Jayaraman et al., 2001] was not carried out we will notdiscuss that data here.A.1.1. RB Sampling Approach[88] RB sample air was drawn through a 6m sample mast
with an entrance 18 m above sea level and forward of theship’s stack. To maintain nominally isokinetic flow andminimize the loss of super-micrometer particles, the inletwas manually rotated into the relative wind. Air entered theinlet through a 5cm diameter hole, passed through anexpansion cone, and then into the 20cm diameter samplingmast with a flow of 1 m3 min�1. The last 1.5 m of the mastwere heated to establish a reference RH for the sample air of55 ± 5%. This allows for constant size segregation andcomparable measurements in spite of variations in ambientRH. Individual 1.9 cm diameter stainless steel tubesextended into the heated portion of the mast and wereconnected to the aerosol instrumentation and impactors withgraphite-polyethylene conductive tubing or stainless steel(impactors) to prevent the electrostatic loss of particles. Airwas sampled only when the concentration of particlesgreater than 15 nm in diameter indicated the sample airwas free of local contamination (i.e., there were no rapidincreases in particle concentration), the relative wind speed
INX2 32 - 26 CLARKE ET AL.: INDOEX AEROSOL—A COMPARISON AND SUMMARY

was greater than 3 m s�1, and the relative wind was forwardof the beam.A.1.2. KCO Sampling Approach[89] Chemical, physical, and optical measurements were
made at the Kaashidhoo Climate Observatory (KCO) onKaashidhoo Island (4.96�N, 73.47�E) in the Republic ofMaldives. During the early field campaign (11 February to26 February 1999) aerosol samples were collected overconsecutive 48-hour periods by the California Institute ofTechnology (Caltech). Two filter samplers and four micro-orifice uniform deposit impactors (MOUDI, MSP Corp.,Model 100) were operated simultaneously on the roof of theobservatory’s laboratory building at an elevation of 3 mabove ground level. Samples were collected at ambienttemperature (typically 27–29�C) and RH (typically 80–87%) for 46 hours out of every 48 hours, starting at 6 pmlocal time every second day. The University of Miami(UMiami) collected daily samples for aerosol chemicalcomposition using a Sierra impactor operating at ambientRH located at the top of the tower on the roof of thelaboratory building over the entire field campaign.[90] Instruments located inside KCO employed the
UMiami designed stack and inlet [approx. 13 m asl] systemshared with several other investigators, including NOAA/CMDL. An omnidirectional inlet [Liu et al., 1983] wasmounted atop a 10 m tall, 13 cm ID vertical PVC pipe witha 200 l min�1 maximum laminar flow rate (tube Reynoldsnumber <2000). The intake pipe passed through the roofand connected to a 13 cm � 13 cm � 5 cm sidearm PVCpipe tee with a central 5 cm OD thin wall aluminum heatertube in order to keep the sample air warm and below about60%RH. This restricted the RH range to where humidity-induced particle growth was relatively small and also helpedto avoid water condensing inside the instrument systemsdue to the lower temperature in the air-conditioned KCO. Atthe bottom of the heater the flow split for sampling by thedifferent instruments and excess air maintained the 200 lmin�1 flow through the intake system. A flow of 2 l min�1
was taken out horizontally through a �1 cm stainless steeltube to the UMiami Particle/Soot Absorption Photometer(PSAP) and 10 l min�1 was drawn straight down into theUMiami impactors and nephelometer system. The UMiaminephelometer was also heated to maintain the humidityclose to 55%, although their PSAP was not heated. Particlesizing included a DMA system (Cantrell et al., submittedmanuscript, 2000) employing the same UMiami inlet sys-tem and a dry sheath flow but continuous RH measurementswere not recorded. Losses by turbulence, diffusion andinertia were calculated to be less than 5% for this inletsystem. Potential static charge losses were not calculated forthe large diameter PVC pipe but are expected to be small forsizes influencing optical properties.[91] The NOAA/CMDL aerosol system extracted 30 l
min�1 from the aerosol sampling stack through a 1.9 cmOD stainless steel sample tube inserted just down stream ofthe stack’s inlet heater. To reduce RH to �40%, CMDLfurther heated the air stream prior to sampling it in theirinstruments. Prior to entering the CMDL nephelometers andPSAP the air was directed through either a 1 or 10 mmimpactor to provide information about aerosol size. Flowwas switched between impactors every 6 min. For both theUMiami and KCO-CMDL systems, the measured nephel-
ometer scattering was adjusted to 55% based on CMDL’sf(RH) measurements if RH measured at the nephelometerdiffered from 55%.A.1.3. C-130 Sampling Approach[92] The near surface C-130 measurements were typically
10 to 20 min flight legs flown at about 35 m or higheraltitude, consistently higher than the other platforms. Typ-ical airspeed of 120 m s�1 resulted in between 70 and 140km of air being sampled on a 10–20 min leg. Most instru-ments sampled through the so-called community aerosolinlet (CAI) built by NCAR [Blomquist et al., 2001]. This 8m isokinetic probe extended beyond the nose of the C-130and was designed to gradually slow flow while sheddingsample tube boundary layer air in order to suppress turbu-lence and particle losses. The CAI was designed to providea single inlet source to multiple investigators but an evalua-tion of the CAI efficiency in the Community Aerosol InletEvaluation Experiment (CAINE-2) showed that the CAIworked well for submicrometer particles, but its efficiencydropped rapidly above that, with a 50% cut size in the 2–3mm range [Blomquist et al., 2001]. More recent and detailedinlet tests carried out as part of the PELTI inlet evaluationexperiment (July 2000) also revealed that the CAI had thegreatest particle losses of the 3 inlets tested and confirmedthe need for large corrections for particle sizes above 1 mm[Huebert et al., 2000]. Fortunately, on almost all legs flownon the C-130 during INDOEX the aerosol number, surfacearea, mass and associated light-scattering/absorption wasdominated by the submicrometer accumulation mode aero-sol. Exceptions were in clean regions dominated by sea saltand occasional cases with an elevated dust component.[93] Various inlet tubes left the CAI to instrument racks
near the front of the aircraft with sample line lengths thatvaried from about 1 m to 4 m. Low flow instrumentsemployed bypass flows to minimize particle sedimentation.Due to the rapid changes in altitude and both outside andcabin temperatures, RH was less readily controlled on theC-130 than on other platforms and most investigatorssimply monitored RH at key locations so corrections totarget humidities could be made later.
Appendix B.
B.1. Chemical Characteristics
B.1.1. Species Considered
B.1.1.1. Sample Collection[94] The methods of sample collection for determining
aerosol chemical composition are listed in Table A1 foreach platform. A Berner-type multijet cascade impactor wasused for sample collection on the RB and operated at 55 ±5% RH. For the collection of samples for ion and gravi-metric analysis, a jet plate with a 50% aerodynamic cut-offdiameter, D50,aero of 1.1 mm ±0.11 was used. Sampling timesranged from 4 to 6 h for ions and 12 h for mass. Samples forcarbon analysis were collected on an impactor stage withlower and upper D50,aero of 0.18 and 1.1 mm over times ofabout 12 to 24 h. Measurements at KCO described abovewere collected over a 24 h period by UMiami and 48hperiod for the KCO-Caltech samples. The impactor stageschosen for the comparison were those that most closelyapproximated a 1.0 mm size cut at 55% RH. Stacked filterunits with a D50,aero of approximately 1.3 mm were used on
CLARKE ET AL.: INDOEX AEROSOL—A COMPARISON AND SUMMARY INX2 32 - 27
the C-130. The stacked filter units were operated between60 and 87% RH. Only low altitude samples (<300 m) fromthe C-130 are considered for chemical comparisons.
B.1.1.2. Sample Analysis[95] RB samples were analyzed for SO4
2�, Na+, and K+
using ion chromatography [Quinn et al., 1998]. The nonseasalt correction for SO4
2� and K+ was based on Na+. TheKCO-UMiami samples were analyzed for SO4
2� using ionchromatography and Na+ using flame atomic absorption (D.Savoie, personal communication, 2000). KCO-Caltech sam-ples were analyzed for SO4
2� using ion chromatography[Mulik et al., 1976; Hughes et al., 1999]. The C-130samples were analyzed for SO4
2�, Na+, and K+ using ionchromatography [Gabriel et al., 2002]. Organic and ele-mental carbon from KCO, the RB, and the C-130 were alldetermined using variations of thermal desorption/evolvedgas analysis. As explained below, the analytical proceduresare quite different, possibly giving disparate results foridentical samples. In addition, sampling with quartz filtersis subject to both positive and negative artifacts [Huebertand Charlson, 2000].[96] OC and BC concentrations for samples collected on
the RB were determined by a thermal desorption methodusing a commercial system (5500 c-mat, Strohlein, Kaarst,Germany) [Neusuß et al., 2000, 2002]. The sample wasplaced in a quartz tube and heated to 500C under nitrogen toseparate organic and elemental carbon. The carbon com-pounds that evaporated under these conditions were referredto as volatile carbon (OC). In a second step, the sample washeated under oxygen to 650�C, where all carbon exceptcarbonate is oxidized. This carbon mass was referred to asnonvolatile carbon (BC). The accuracy of the total carbon,TC, concentration is ±20% not including artifact effects.Because there was no correction for charring of OC to BCduring the analysis, the BC concentrations represent anupper limit.[97] Samples collected at KCO by Caltech were analyzed
for elemental and organic carbon content using the thermal-optical carbon analysis method of Huntzicker et al. [1982]as modified by Birch and Cary [1996]. A commercialinstrument was used (Sunset Laboratory, OCEC analyzer,Portland, OR). The sample was placed in a quartz oven andheated to 870�C in a helium atmosphere to desorb organiccompounds. After the oven was cooled to 600�C, thetemperature was increased a second time in a helium/oxy-gen atmosphere to oxidize elemental carbon. Correction for
pyrolytic formation of elemental carbon during OC deter-mination was accomplished using the methodologydescribed in the paper by Kleeman et al. [1999]. The OC/BC split (and optical correction) was performed on simulta-neously sampled quartz filters and then applied to theMOUDI foil samples.[98] Another evolved gas analysis (EGA) method
[Mayol-Bracero et al., 2002] was used to determine theOC and BC concentrations in the C-130 samples. A portionof the filter was heated at 12.5�C min�1 in an oxygenatmosphere from 50�C to 600�C. A plot of the rate ofcarbon evolution versus temperature constitutes a thermo-gram. The area under the thermogram is equal to the totalcarbon content of the sample. As with the RB samples, theBC concentrations may represent an upper limit since therewas no correction for charring of OC to BC during theanalysis. This method is quantitative for TC within about10% with a reproducibility of 3 to 5% not including artifacteffects. Total aerosol mass was determined by gravimetricanalysis for the RB samples. Substrates were weighedbefore and after sample collection at 33 ± 3% RH [Quinnet al., 1998]. Gravimetric analysis at 39 ± 3% RH was usedto determine aerosol mass for the KCO-Caltech samples[Hughes et al., 1999]. Total mass for the C-130 samples wasdetermined by summing the concentrations of the chemi-cally analyzed species (ions, BC, and OC converted toparticulate matter using a factor of 1.5 mg particular organicmaterial (POM) mass per mg of C mass). Total mass for theKCO-UMiami samples is a sum of the ionic and ashconcentrations. Summing chemically analyzed species toestimate total aerosol mass may underdetermine the mass ifsignificant species on a mass-basis are not analyzed (includ-ing water). Other chemical species were not compared suchas iron (which was not analyzed on all platforms) and nitratewhich can suffer from sampling artifacts.
B.2. Microphysical Characteristics
[99] Ambient aerosol sizes measured during INDOEXrange from a few nanometers to hundreds of micrometers.However, the size range most likely to dominate aerosollight scattering and extinction in the atmosphere is generallyfrom about 0.1 to 10 mm diameter, Dp, and includes mostaerosol mass. Because the scattering per unit mass (or massscattering efficiency, MSE) is a strong function of size witha maximum around 0.5 mm (for wavelengths of 550 nm) it isessential to measure and model the size distribution accu-rately in order to provide a foundation for interpretingoptical effects in terms of constituent masses and to reduceuncertainties in ‘‘closure’’ experiments. Various techniquesused to size aerosol based upon different physical principlesare listed in Table 1. These include optical techniques basedupon scattered light such as a custom Laser Optical ParticleCounter (OPC), a forward Scattering Spectrometer Probe(FSSP-300) and a Passive Cavity Aerosol SpectrometerProbe (PCASP), all obtained from Particle MeasurementSystems, Boulder, CO. Mobility techniques based upondiffusion of charged aerosol in an electric field were usedin various Differential Mobility Analyzer (DMA) or Tan-dem Radial DMA systems. Other distributions wereobtained by impaction based upon the aerodynamic diam-eters resulting from inertial and drag forces acting on aparticle (MOUDI) and also scanning electron microscopy
Table A1. Samplers Used for Collecting Aerosol for Chemical
Analysis
Platform Sampler D50,aer0, mm %RH Comments
KCO-UMiami SierraImpactor
1.25 Ambienta D50,aero � 1.1 mmat 55% RHb
KCO-Caltech MOUDI 1.8 Ambienta D50,aero � 1.6 mmat 55% RHb
C-130 Stacked FilterUnit
1.3 60–87 D50,aero � 1.1 to1.3 mmat 55% RHb
RB BernerImpactor
1.1 55 ± 5
a80 to 87% RH.bD50,aero conversion based on densities and hygroscpic growth calculated
from mean KCO-Caltech composition.
INX2 32 - 28 CLARKE ET AL.: INDOEX AEROSOL—A COMPARISON AND SUMMARY

(SEM) based upon the projected area of a particle collectedon a substrate (not discussed here).B.2.1. KCO Aerosol Size Distributionsand Concentrations[100] Size distributions were measured at KCO over
limited periods and included aerodynamic size cuts withrelatively large bins afforded by a MOUDI [Marple et al.,1991] and sizing from a DMA (20 < Dp <530 nm; Cantrellet al., submitted manuscript, 2000). Four 10-stage MOUDIswere simultaneously operated to measure 46h average fineparticulate mass concentration and chemical composition asa function of particle size. We note that the near ambient RH(80–87%) used for this system is much higher than mostother INDOEX sample systems so that chemical speciespresent in soluble aerosol will be collected in larger sizebins than other samplers. Unfortunately, comparable sam-pling instrumentation was not operating during limited side-by-side comparisons and will not be directly compared here.B.2.2. RB Aerosol Size Distributionsand Concentrations[101] Total particle number concentrations were measured
with TSI 3010 (10 nm < Dp < 3000 nm) and TSI 3025 (3nm < Dp < 3000 nm) condensation particle counters (CPCs)operated directly off one of the 1.9 cm sampling tubes. Onetube supplied air to a differential mobility particle sizer(DMPS) located inside the humidity-controlled box at thebase of the mast. The DMPS (Heuke-type, medium length)was connected to a TSI 3010 particle counter with anaerosol flow rate of 0.5 L min�1 and a sheath airflow rateof 5 L min�1 humidified to 55% RH. Data were collected in27 size bins with midpoints ranging from 22 to 900 nmdiameter. Another tube supplied air to an identical DMPSthat measured under ‘‘dry’’ conditions (RH < 10%). TheDMPS data were filtered to eliminate periods of calibrationand instrument malfunction and periods of ship contami-nation (based on relative wind and high and rapid changesin CN counts). The filtered mobility distributions were thenconverted to number-size distributions using the inversionroutine of Stratman and Wiedensohler [1997]. The datawere corrected for diffusional losses [Covert et al., 1997]and size dependent counting efficiencies [Wiedensohler etal., 1997] based on earlier calibration exercises.[102] The accuracy of both the particle sizing and the
number of particles in each size bin depends on the stabilityof the flow rates [Bates et al., 2002]. Three of the fourDMPS flows (CPC, Sheath and Excess) were controlledindependently in these three systems. Drift in the CPC,sheath, and excess flows was generally less than one percentduring the cruise (mean 0.63 ± 0.55%) which translates intoa particle sizing error of about 1 percent. However, arelative drift of 1% in the sheath to excess flow implies a10% change in inlet flow and thus a 10% change in thenumber concentration. A change in the inlet flow alsochanges the transfer function of the DMAwhich compoundsthis error, e.g., for this case the combined error is on theorder of 15%. During INDOEX, the average integrated RB-DMPS number concentration operated at 55% RH averaged6.5 ± 7.1% lower than the total number measured by theCPC (TSI 3010). The integrated number concentration fromthe DMPS system operated at 10% RH averaged 19 ± 9.3%lower than the total number measured by the CPC. Tocorrect for the number concentration error, the DMPS data
reported here have been normalized using the 30 minaverage ratio of the total CPC number concentration tothe integrated DMPS number concentration. (Note: theDMPS data collected at 55% RH have been used in thispaper for the regional average size distributions).[103] Unfortunately, this instrument was not working
during the C-130 flyby which necessitated using the‘‘dry’’ DMPS data collected at 10% RH for comparisonwith the C-130 size distribution data.) During the C-130flyby (discussed above) the integrated number concentra-tion from this DMPS system operated at 10% RH and was27% lower than the total number measured by the CPC. TheDMPS size-distribution data used in the flyby comparisonwere therefore uniformly increased by this factor. The datawere then converted from 10% RH to 55% RH using thedensities and associated water masses calculated with athermodynamic equilibrium model (AeRho) using themeasured chemical data [Quinn et al., 2000] for comparisonto the C-130 data. (Note: the C-130 data used in thecomparison were adjusted to 55% RH from measuredDMA RH using the growth curves shown in Figure 2).[104] Another tube supplied an Aerodynamic Particle
Sizer (APS-TSI 3320) in the humidity-controlled box atthe base of the mast. The APS measured the number sizedistribution between 0.6 and 9.6 mm aerodynamic diameter.Based on comparisons between gravimetrically determinedmass at 33% RH and mass derived from the APS, it wasassumed that heating in the APS dried the coarse modeaerosol to below its efflorescence point. Therefore, the APSdata shown here were converted from aerodynamic diame-ters at a measurement RH (assumed below the efflorescencepoint of sea salt) to geometric diameters at 55% RH usingcalculated densities and the water masses associated withthe inorganic ions at 33 and 55% RH. The densities andassociated water masses were calculated with AeRho usingthe measured chemical data [Quinn et al., 2000]. However,we recognize that sea-salt mixed with other aerosol speciesmay result in efflorescence behavior that differs from puresea-salt.B.2.3. C-130 Aerosol Size Distributionsand Concentrations[105] Size distributions aboard the C-130 were obtained
through a combination of DMA and OPC inside the aircraftand FSSP and PCASP probes exposed to ambient condi-tions on the wing. Both Radial DMA [Zhang et al., 1995]and OPC measurements included upstream controlled heat-ers that were used to assess aerosol volatility at 150 and380�C [Clarke, 1991; Clarke et al., 1999]. The DMA wasoperated with dessicated (RH <10%) sheath airflow of 5 Lmin�1 and a sample flow of 0.7 L min�1 with the lattershowing 1 to 5% variation during 7 mission calibrations.RH was measured at the exit of the instrument and wasgenerally around 20% for the near surface data presentedhere. Sheath air was recirculated with a sealed pump systemthat ensured sheath and excess flows were identical and thatsample flow and detector flows were identical. In order topermit rapid scan times for the DMA (about 90 s) necessaryfor aircraft sampling, the upper size limit was set to 0.20mm. This also allowed overlap with the OPC that sized from0.15 to 7 mm. OPC and DMA distributions were combinedabout the common point of 0.2 mm where agreement inconcentration was generally within the 5–10% combined
CLARKE ET AL.: INDOEX AEROSOL—A COMPARISON AND SUMMARY INX2 32 - 29

flow uncertainty evident from flow calibrations. A 1 mmimpactor upstream of the DMAwas used to eliminate largeraerosol.[106] In order to minimize size fluctuations due to humid-
ity changes the OPC was operated with a sample flowdiluted with equal parts of dry air to result in an instrumentRH of generally 30–40% at low altitudes. Size dependentcorrections to OPC data also had to be made due to losses ofsuper-micrometer aerosol in the community aerosol inlet(CAI) mounted on the C-130. This had negligible impact onaerosol total number but results from the PELTI experiment[Huebert et al., 2000] showed about a factor of 2 or moreunderestimate of particles larger than about 3 mm. Asecondary dependence was also found on CAI lossesdepending upon whether particles were ‘‘wet’’ or ‘‘dry.’’Additional losses, particularly for large particles, are alsoexpected within the tubing leading to the OPC. These losseshave not been well characterized so no corrections can bemade. In addition to onboard aerosol measurements the C-130 also included the wing-mounted Forward ScatteringSpectrometer Probes (FSSP) and Passive Cavity AerosolSpectrometer Probe (PCASP). These were intended toprovide measurements of ambient aerosol size and tocapture sizes larger than those expected to be aspirated into the C-130. These probes offer the advantage of samplingparticles in-situ but have limitations due to uncertainties inrefractive index and aspects of instrument operation.[107] CPCs (TSI 3760 and 3025) were also operated at
cabin temperatures and at 380�C to measure total andrefractory aerosol number. In this way total number inte-grated over thermally resolved DMA/OPC size distributionscould be compared to measured number as a test of dataconsistency. The low altitude C-130 measurements foundthe 3010 and 3025 concentrations differed by much lessthan the combined absolute flow uncertainty of about 7%and therefore are indicative of few particles present below15 nm. Routine in-flight filter tests were used to confirmproper zero counts in all instruments and CPCs were testedon the ground for flow and count performance. Comparisonof integral DMA/OPC data with 3010 data typically differedby less than 15% but was generally lower on the averagesuggesting some small particle losses in the DMA system.Unlike the RB data, the C-130 DMA/OPC data did not haveto be rescaled here to agree with CPC counts.B.2.4. Sizing Uncertainty Issues[108] In order to interpret measurements in terms of
geometric physical size, as is generally needed for modelapplications, all of these approaches involve some assess-ment or assumption of aerosol properties such as refractiveindex, density, water uptake, shape etc. As a result, not onlymeasurement uncertainties (e.g., flow rates, inlet efficien-cies, etc.) influence sizes and concentrations but alsouncertainties in these aerosol properties. Hence, appropriategeometric size distributions are obtained from measureddata only after corrections (D/Do growth versus RH, den-sity, refractive index) consistent with the other chemical andoptical measurements made during INDOEX.[109] Aerosol growth in response to increasing RH is
largely determined by the role of hygroscopic materials suchas deliquescent salts (e.g., ammonium sulfate) [Tang andMunkelwitz, 1977]. Knowledge of the hygroscopic constit-uents can be used with ‘‘mixing rules’’ for molar composi-
tion to predict aerosol growth in response to increasing RH[Stelson, 1990]. Alternatively, empirical growth curves canbe established for aerosol size classes by measuring the sizedependent growth such as those carried out duringINDOEX aboard the RB (Figure 2). With this information,size distributions measured at a given instrumental RH wereadjusted for another RH, for comparison to data from otherinstruments or other conditions (e.g., ambient).
B.3. Optical Characteristics
[110] The aerosol optical properties considered here arethe ones most important to aerosol forcing of climate: lightscattering coefficient (ssp), light absorption coefficient(sap), single-scattering albedo (wo), hemispheric backscatterfraction (b) and the Angstrom exponent (a). Most or all ofthese were measured on the major platforms participating inINDOEX. Some platforms included additional parameters,such as the fractions of light scattering and absorptionattributable to submicrometer particles (Rsp, Rap), thedependence of aerosol light scattering on relative humidity(f(RH)), and the wavelength-dependence of aerosol lightscattering (e.g., the Angstrom exponent a(l1, l2) =(log(ssp,1/ssp,2)/log(s2/s1). Aerosol light scattering coeffi-cient was measured with a multiwavelength instrumentequipped with a backscatter shutter (Model 3563, TSI,Inc., St. Paul, Minnesota) or single-wavelength instrument(Model M902, Radiance Research, Seattle, Washington).The TSI nephelometer operates at wavelengths of 450, 550,and 700 nm, over an angular range of 7–170 degrees (totalscatter) and 90–170 degrees (hemispheric backscatter). TheRadiance nephelometer operates at a wavelength of 530 nm,over an angular range of 9–168 degrees. Both nephelom-eters were corrected for truncation effects over the appro-priate angular range. Aerosol light absorption coefficientwas measured with a continuous light absorption photo-meter (Model PSAP, Radiance Research, Seattle, Washing-ton). All results were corrected using the scheme reportedby Bond et al. [1999] for sample area, flowrate, and non-idealities in the manufacturer’s calibration based on acalibration of the instrument at 550 nm. Hence, all absorp-tion data are reported at 550 nm.[111] Aerosol extensive (dependent upon the aerosol
concentration, e.g., sap, ssp) and intensive (independent ofthe amount of aerosol present, e.g., vo, b, a) opticalproperties measured by the various platforms deployedduring INDOEX were compared for various cases. In orderto perform the interplatform comparisons, the measurementswere adjusted so that both platforms were on the samerelative basis: RH, wavelength, and standard temperature(20C) and pressure. RH adjustments were made based onfitting the power law equation: f(RH) = a(1�(RH/100))�b toKCO humidigraph measurements (Figure 1). Wavelengthadjustments were made assuming the submicrometer Ang-strom exponent was constant over the wavelength range ofinterest (e.g., a(l1, l2) = a(l2, l3)). The Angstrom exponentis typically used as an indicator of the presence (or absence)of super-micrometer particles [Reid et al., 1998]. For thesemeasurements where the aerosol is predominantly in thesubmicrometer fraction there is little difference between suband total Angstrom exponent. However, even when thesuper-micrometer fraction is significant, shifts in the sub-
INX2 32 - 30 CLARKE ET AL.: INDOEX AEROSOL—A COMPARISON AND SUMMARY

micrometer Angstrom exponent can provide qualitativeinformation about shifts in the aerosol size distribution,although the relationship between aerosol size and submi-crometer Angstrom exponent is not as strong as it is whensuper-micrometer particles are included. Unless noted oth-erwise, measurements were adjusted to 55% relative humid-ity and 550 nm wavelength and the aerodynamic Dp <1 mm[Dp <0.75 mm geometric diameter] was used as the size cut.No relative humidity adjustments were attempted for lightabsorption measurements.B.3.1. Instrument Uncertainties: Nephelometer[112] Calculation of the measurements uncertainty of each
nephelometer followed the protocol of Anderson et al.[1999]. The measurement uncertainty associated with theTSI 3563 nephelometer was calculated from five knownsources and is expressed as a linear combination of thefollowing terms.
ds2total ¼ ds2noise þ ds2drift þ ds2cal þ ds2trunc þ ds2stp
Here dsp designates the uncertainty in sp associated with theparameter, p. These arise from (1) noise in the filtered airscattering coefficient, (2) drift in the calibration, (3)uncertainty in the instrument calibration to Rayleighscattering of dry air and CO2, (4) the truncation of nearforward scattered light, and (5) uncertainty in instrumentpressure and temperature in conversion of data to STP. Theassociated uncertainties for each parameter for 1-minaverages are listed in Table A2 with varying magnitude ofthe scattering coefficient.[113] Uncertainty associated with differences in the aero-
sol inlets and tubing is expected to be insignificant forsubmicrometer aerosol. Losses within the nephelometeritself have been found to be negligible for submicrometerparticles and 5–10% for super micrometer particles [Ander-son and Ogren, 1998]. The variation in particle size withrelative humidity and hence the particle transmissionthrough a submicrometer impactor operating upstream ofthe nephelometer will vary with the particle type. Forrelative humidities below 50% we estimate this uncertaintyto be less than 5% based on Berner impactor efficiencycurves and estimates of the scattering size distribution. Inaddition to RH, flowrate affects the 50% aerodynamic cutoff diameter of the impactor. Running the Berner typeimpactors at a flow 10% lower than 30 lpm yields a 5%change in cut size. Typically flows for all 4 systems werewithin 1–2% of expected flow rate.[114] For low scattering values instrument noise is the
prevalent source of uncertainty while for higher scatteringcoefficients both noise and instrument truncation uncertain-
ties dominate. Uncertainty for low signal values can begreatly reduced by increasing the signal averaging time. Fora 10-min averaging time the uncertainty associated withnoise for a ssp of 1 Mm�1 is 0.40 Mm�1. For the RadianceResearch nephelometer used by UMiami the overall uncer-tainty for submicrometer scattering was calculated to be 8%at 50 Mm�1 equivalent to an uncertainty of 4 Mm�1. Thisvalue was calculated considering noise, calibration uncer-tainties [e.g., calibration gas impurities, STP correction),angular nonidealities (e.g., truncation), adjustment to 550nm wavelength and adjustment to 55% RH (H. Maring,personal communication, 2000).B.3.2. Instrument Uncertainties: PSAP[115] Uncertainties in the PSAP have been described by
Bond et al. [1999] and the appropriate corrections have beenapplied to PSAP measurements made at INDOEX. Correc-tions have been made for spot size, flow rate, interpretationof scattering as absorption and instrument response toabsorption. Bond et al. also found instrumental variabilityto be 6% of the measured absorption, hence for the averageabsorption coefficient measured at INDOEX instrumentalvariability is 1 Mm�1. Instrument noise (i.e., detection limit- a signal/noise ratio of unity), determined by measuringparticle-free air, is 0.1 Mm�1 for hourly averaged data and0.9 Mm�1 for minute averaged data. Absorption coeffi-cients measured during INDOEX were much higher thanthe detection limit.
[116] Acknowledgments. This research was funded in part by theNational Science Foundation [ATM-9612891 and the NASA GlobalAerosol Climatology Project NAG-5-8118 (A.D.C., S.H.); ATM-ATM-9612888 J.A.O., E.A., and A.J.] and the Aerosol Program of the NOAAClimate and Global Change Program and the NASA Global AerosolClimatology Project (P.K.Q. and T.S.B.). We would also like to thank thefollowing people for contributing their data to this effort: M. O. Andreae, J.Prospero, D. Baumgardner, A. Wiedensholer, A. Novak, D. Covert, L.Hughes, R. Gabriel, T. Kirchstetter, C. Neusub, T. Novakov, A. Jayaraman,G. Shaw, and W. Cantrell. SOEST contribution 6022.
ReferencesAnderson, T. L., and J. A. Ogren, Determining aerosol radiative propertiesusing the TSI 3563 integrating nephelometer, Aerosol Sci. Technol., 29,57–69, 1998.
Anderson, T. L., D. S. Covert, J. D. Wheeler, J. M. Harris, K. D. Perry, B.E. Trost, D. J. Jaffe, and J. A. Ogren, Aerosol back scatter fraction andsingle scattering albedo: Measured values and uncertainties at a coastalstation in the Pacific Northwest, J. Geophys. Res., 104, 26,793–26,807,1999.
Bates, T. S., D. J. Coffman, D. S. Covert, and P. K. Quinn, Regional marineboundary layer aerosol size distributions in the Indian, Atlantic and Pa-cific Oceans: A comparison of INDOEX measurements with ACE-1,ACE-2, and aerosol99, J. Geophys. Res. , 107 , doi:10.1029/2001JD001174, in press, 2002.
Baumgardner, D., J. E. Dye, R. G. Knollenberg, and B. W. Gandrud,Interpretation of measurements made by the FSSP-300X during the Air-borne Arctic Stratospheric Expedition, J. Geophys. Res., 97, 8035–8046,1992.
Birch, M. E., and R. A. Cary, Elemental carbon-based method for monitor-ing occupational exposures to particulate diesel exhaust, Aerosol Sci.Technol., 25, 221–241, 1996.
Blomquist, B. W., B. J. Huebert, S. G. Howell, M. Litchy, C. H. Twohy, A.Schanot, D. Baumgardner, B. Lafleur, R. Seebaugh, and M. L. Laucks,An evaluation of the community aerosol inlet for the NCAR C-130research aircraft, J. Atmos. Oceanic Technol., 18, 1387–1397, 2001.
Bond, T. C., T. L. Anderson, and D. Campbell, Calibration and intercom-parison of filter-based measurements of visible light absorption by aero-sols, Aerosol Sci. Technol., 30, 582–600, 1999.
Cachier, H., C. Liousse, P. Buat-Menard, and A. Gaudichet, Particulatecontent of savanna fire emissions, J. Atmos. Chem., 22, 123–148, 1995.
Clarke, A. D., ‘‘A thermo-optic technique for in-situ analysis of size-re-
Table A2. Estimated Uncertainties in sspa
Bsp Noise Drift Calibration Truncation Stp Total
1 1.25 0.44 0.08 0.02 0.003 1.3310 1.56 0.80 0.75 0.22 0.03 1.9220 1.84 1.20 1.50 0.44 0.07 2.7050 2.50 2.40 3.75 1.10 0.17 5.23100 3.32 4.40 7.51 2.20 0.34 9.58
aAt 550 nm for 1 min averaging time and submicrometer particles (inMm�1).
CLARKE ET AL.: INDOEX AEROSOL—A COMPARISON AND SUMMARY INX2 32 - 31

solved aerosol physicochemistry’’, Atmos. Environ. Part A, 25(3/4),635–644, 1991.
Clarke, A. D., F. Eisele, V. N. Kapustin, K. Moore, R. Tanner, L. Mauldin,M. Litchy, B. Lienert, M. A. Carroll, and G. Albercook, Nucleation in theequatorial free troposphere: Favorable environments during PEM-Tro-pics, J. Geophys. Res., 104, 5735–5744, 1999.
Covert, D. S., J. L. Gras, A. Weidensohler, and F. Stratmann, Comparisonof directly measured CCN with CCN modeled from the number-sizedistribution in the marine boundary layer during ACE-1 at Cape Grim,Tasmania, J. Geophys. Res., 103, 16,597–16,608, 1998.
Delene, J., and A. Ogren, Variability of aerosol optical properties at fourNorth American surface monitoring sites, J. Atmos. Sci., in press, 2001.
Ferek, R. J., J. S. Reid, P. V. Hobbs, D. R. Blake, and C. Liousse, Emissionfactors of hydrocarbons, halocarbons, trace gases, and particles frombiomass burning in Brazil, J. Geophys. Res., 103, 32,107–32,118, 1998.
Gabriel, R., O. L. Mayol-Bracero, and M. O. Andreae, Chemical character-ization of submicron aerosol particles collected over the Indian Ocean, J.Geophys. Res., 107, doi:10.1029/2000JD000034, in press, 2002.
Garvey, D. M., and R. G. Pinnick, Response characteristics of particlemeasurement systems active scattering aerosol spectrometer probe(ASASP-X), Aerosol Sci. Technol., 2, 477–488, 1983.
Huebert, B. J., and R. J. Charlson, Uncertainties in data on organic aerosols,Tellus, Ser. B, 52, 1249–1255, 2000.
Huebert, B. J., D. Covert, A. Clarke, S. Howell, J. Anderson, and C.Wilson, Airborne performance tests of a new low-turbulence inlet (LTI)for aerosols, presented at Am. Assoc. for Aerosol Res. Meeting, Cincin-natti, Ohio, 2000.
Hughes, L., The size and composition distribution of atmospheric particlesin southern California, Environ. Sci. Technol., 33, 3506–3515, 1999.
Huntzicker, J. J., R. L. Johnson, J. J. Shah, and R. A. Cary, ParticulateCarbon, Atmospheric Life Cycle, edited by G. T. Wolff and R. L. Kli-misch, pp. 79–88, Plenum, New York, 1982.
Jayaraman, A., S. K. Satheesh, A. P. Mitra, and V. Ramanathan, Latitudegradient in aerosol properties across the Inter Tropical ConvergenceZone: Results from the joint Indo-US study onboard Sagar Kanya, Curr.Sci., 80, 128–137, 2001.
Kleeman, M. J., J. J. Schauer, and G. R. Cass, Size and composition distribu-tion of fine particulate matter emitted from wood burning, meat charbroil-ing, and cigarettes, Environ. Sci. Technol., 33, 3516–3523, 1999.
Kotchenruther, R. A., P. V. Hobbs, and D. A. Hegg, Humidification factorsfor atmospheric aerosols off the mid-Atlantic coast of the United States,J. Geophys. Res., 104, 2239–2252, 1999.
Liu, B. Y. H., D. Y. H. Pui, X. Q. Wang, and C. W. Lewis, Sampling ofcarbon fiber aerosols, Aerosol Sci. Technol., 2, 499–511, 1983.
Marple, V. A., K. L. Rubow, and S. M. Behm, A micro-orifice uniformdeposit impactor (MOUDI): Description, calibration and use, 14(4),434–446, 1991.
Masonis, S. J., K. Franke, A. Ansmann, D. Mueller, D. Althausen, J. A.Ogren, A. Jefferson, and P. J. Sheridan, An intercomparison of aerosollight extinction and 180� backscatter as derived using in situ instrumentsand Raman lidar during the INDOEX field campaign, J. Geophys. Res.,107, doi:10.1029/2000JD000035, in press, 2002.
Mayol-Bracero, O. L., R. Gabriel, M. O. Andreae, T. W. Kirchstetter, T.Novakov, J. A. Ogren, P. J. Sheridan, and D. Streets, Carbonaceousaerosols over the Indian Ocean during INDOEX: Chemical characteriza-tion, optical properties, and probable sources, J. Geophys. Res., 107,doi:10.1029/2000JD000039, in press, 2002.
Mulik, J., R. Puckett, D. Williams, and E. Sawicki, Ion chromatographicanalysis of sulfate and nitrate in ambient aerosols, Anal. Lett., 9, 653–663, 1976.
Neusuß, C., D. Weise, W. Birmili, H. Wex, A. Wiedensohler, and D. S.Covert, Size-segregated chemical, gravimetric and number distribution-
derived mass closure of the aerosol in Sagres, Portugal during ACE-2,Tellus, 52, 169–184, 2000.
Neusuß, C., T. Gnauk, A. Plewka, H. Herrmann, and P. K. Quinn, Carbo-naceous aerosol over the Indian Ocean: OC/EC fractions and selectedspecifications from size-segregated onboard samples, J. Geophys. Res.,107, doi:10.1029/2001JD000327, in press, 2002.
Quinn, P. K., and D. J. Coffman, Local closure during ACE 1: Aerosol massconcentration and scattering and backscattering coefficients, J. Geophys.Res., 103, 16,575–16,596, 1998.
Quinn, P. K., D. J. Coffman, V. N. Kapustin, T. S. Bates, and D. S. Covert,Aerosol optical properties in the marine boundary layer during ACE 1and the underlying chemical and physical aerosol properties, J. Geophys.Res., 103, 16,547–16,563, 1998.
Quinn, P. K., et al., Surface submicron aerosol chemical composition: Whatfraction is not sulfate?, J. Geophys. Res., 105, 6785–6806, 2000.
Ramanathan, V., et al., The Indian Ocean Experiment: An integrated assess-ment of the climate forcing and effects of the great Indo-Asian haze, J.Geophys. Res., 106(22), doi:10.1029/2001JD900133, 2001.
Reid, J. S., P. V. Hobbs, R. J. Ferek, D. R. Blake, J. V. Martins, M. R.Dunlap, and C. Liousse, Physical, chemical and optical properties ofregional hazes dominated by smoke in Brazil, J. Geophys. Res., 103,32,059–32,080, 1998.
Savoie, D. L, R. Arimoto, W. C. Keene, J. M. Prospero, R. A. Duce, and J.N. Galloway, Marine biogenic and anthropogenic contributions to non-sea-salt sulfate in the marine boundary layer over the North AtlanticOcean, J. Geophys. Res., 107, 4356, doi:10.1029/2001JD000970, 2002.
Sheridan, P. J., A. Jefferson, and J. A. Ogren, Spatial variability of aerosolradiative properties over the Indian Ocean during INDOEX, J. Geophys.Res., 107, doi:10.1029/2000JD000166, in press, 2002.
Stelson, A. W., Urban aerosol refractive index prediction by partial molarfraction approach, Environ. Sci. Technol., 1676–1680, 1990.
Stratman, F., and A. Wiedensohler, A new data inversion algorithm forDMPS measurements, J. Aerosol Sci., 27, 339–340, 1997.
Swietlicki, E., et al., Hygroscopic properties of aerosol particles in thenortheastern Atlantic during ACE-2, Tellus, Ser. B, 2, 201–227, 2000.
Tang, I. N., and H. R. Munkelwitz, Aerosol growth studies, III, Ammoniumbisulfate aerosol in a moist atmosphere, J. Aerosol. Sci., 8, 321–330, 1977.
Turpin, B. J., P. Saxena, and E. Andrews, Measuring and simulating parti-culate organics in the atmosphere: Problems and prospects, Atmos. En-viron., 34, 2983–3013, 2000.
Weidensohler, A., et al., Intercomparison study of size dependent countingefficiency of 26 condensation particle counters, Aerosol Sci. Technol., 27,224–242, 1997.
Zhang, S. H., Y. Akutsu, L. M. Russell, R. C. Flagan, and J. H. Seinfeld,Radial differential mobility analyzer, Aerosol. Sci. Technol., 23, 357–371, 1995.
�����������E. Andrews, A. Jefferson, and J. A. Ogren, Climate Monitoring and
Diagnostics Laboratory, National Oceanic and Atmospheric Administra-tion, Boulder, CO, USA.G. Cass, School of Earth and Atmospheric Sciences, Georgia Tech,
Atlanta, GA, USA.A. D. Clarke and S. Howell, University of Hawaii, Honolulu, HI 96822,
USA. ([email protected])H. Maring and D. Savoie, RSMAS/MAC, University of Miami, Miami,
FL, USA.A. Massling, Institute for Tropospheric Research, Leipzig, Germany.O. Mayol-Bracero, Max Planck Institute for Chemistry, Mainz, Germany.P. K. Quinn and T. S. Bates, Pacific Marine Environmental Laboratory,
National Oceanic and Atmospheric Administration, Seattle, WA, USA.
INX2 32 - 32 CLARKE ET AL.: INDOEX AEROSOL—A COMPARISON AND SUMMARY

Figure 9. Light scattering values measured (C-130) and calculated from size distributions during RBflyby. The first time period is for submicrometer aerosol and the second is for total aerosol.
CLARKE ET AL.: INDOEX AEROSOL—A COMPARISON AND SUMMARY
INX2 32 - 21
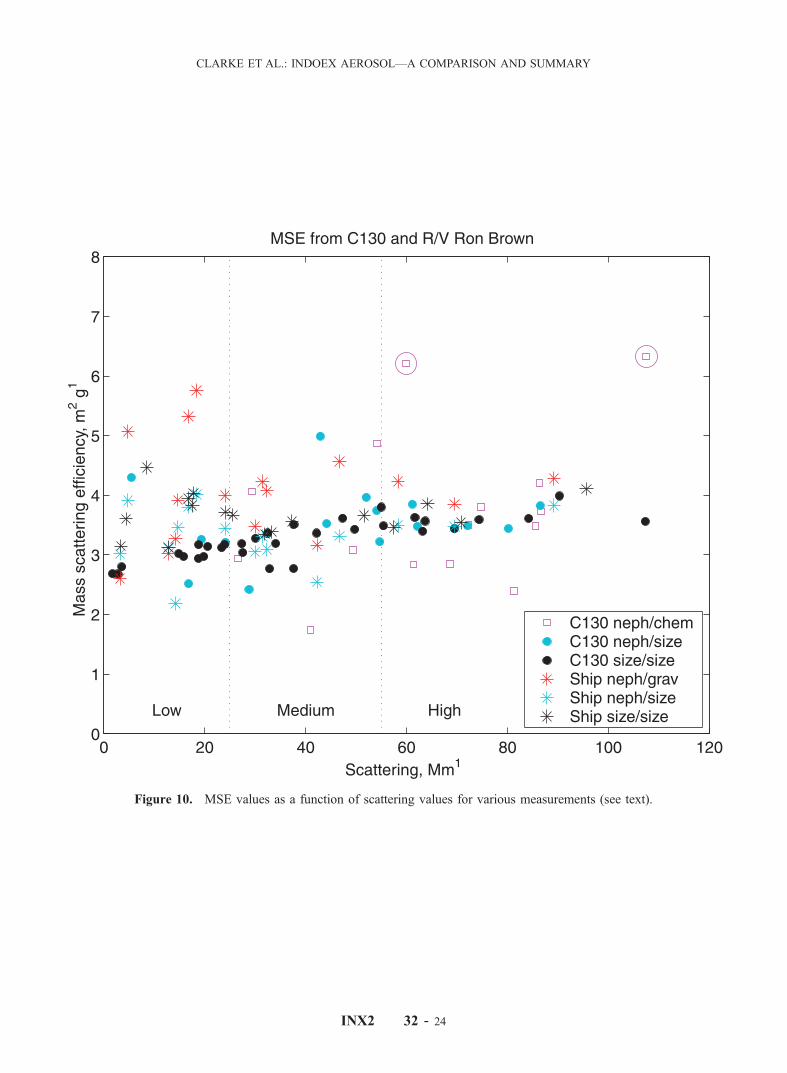
Figure 10. MSE values as a function of scattering values for various measurements (see text).
CLARKE ET AL.: INDOEX AEROSOL—A COMPARISON AND SUMMARY
INX2 32 - 24