individual differences in the perception of similarity and difference
TRANSCRIPT

Cognition 108 (2008) 781–795
Contents lists available at ScienceDirect
Cognition
journal homepage: www.elsevier .com/locate /COGNIT
Individual differences in the perception of similarity and difference
Sabrina Simmons, Zachary Estes *
Department of Psychology, University of Warwick, Coventry CV4 7AL, UK
a r t i c l e i n f o
Article history:Received 9 February 2007Revised 4 May 2008Accepted 12 July 2008
Keywords:Dual process modelIndividual differencesNon-inversionPerceived differencePerceived similarityThematic relations
0010-0277/$ - see front matter � 2008 Elsevier B.Vdoi:10.1016/j.cognition.2008.07.003
* Corresponding author.E-mail address: [email protected] (Z. Estes)
a b s t r a c t
Thematically related concepts like coffee and milk are judged to be more similar than the-matically unrelated concepts like coffee and lemonade. We investigated whether thematicrelations exert a small effect that occurs consistently across participants (i.e., a generalizedmodel), or a large effect that occurs inconsistently across participants (i.e., an individual-ized model). We also examined whether difference judgments mirrored similarity orwhether these judgments were, in fact, non-inverse. Five studies demonstrated the neces-sity of an individualized model for both perceived similarity and difference, and addition-ally provided evidence that thematic relations affect similarity more than difference.Results suggest that models of similarity and difference must be attuned to large and con-sistent individual variability in the weighting of thematic relations.
� 2008 Elsevier B.V. All rights reserved.
1. Introduction
Similarity and difference are fundamental to cognition.They determine, in large part, the recognition of familiarobjects and the categorization of novel objects, and theydrive inferences about an object’s features and its pre-dicted behavior in a novel context. Essentially, similarityand difference have been implicated in nearly every cogni-tive process from perceptual classification to economicdecision-making. Given that similarity and differenceinfluence so many other cognitive processes, then, it is cru-cial to determine what factors influence the perceptions ofsimilarity and difference themselves.
Some potentially important factors remain underspeci-fied in contemporary models of similarity and difference.For example, perceived similarity and difference may exhi-bit large individual differences (Simmons & Estes, submit-ted for publication), but current models fail to account forthis presumed variability. Moreover, the relationship be-tween similarity and difference appears to be surprisinglycomplex (Medin, Goldstone, & Gentner, 1990), and currentmodels do not adequately explain this relationship. Below
. All rights reserved.
.
we report five studies that investigate directly these cur-rently unresolved issues. We first review the major modelsof semantic similarity, with particular emphasis on thedual process model (Bassok & Medin, 1997; Estes, 2003;Simmons & Estes, submitted for publication; Wisniewski& Bassok, 1999), and then we summarize the literatureon the relationship between similarity and difference.
1.1. Models of similarity
In general, similarity can be described in terms of threetypes of information: features, structural relations, and the-matic relations. Of these, features make the most intuitivecontribution – the more features that two things have incommon, the more similar they are. This intuition is formal-ized in the contrast model (Tversky, 1977), which construesthe similarity of two concepts as a function of their commonfeatures weighed against their distinctive features. Similar-ity increases as the number of commonalities increases orthe number of differences decreases. For example, a bluebirdand a crow are perceived to be similar because their manycommon features (beaks, wings, etc.) outweigh their fewdistinctive features (size, color, etc). And if the bluebird wereto grow black feathers, then its similarity to a crow would in-crease still further (Gati & Tversky, 1984).

782 S. Simmons, Z. Estes / Cognition 108 (2008) 781–795
However, features alone are not sufficient for determin-ing similarity. To understand why, consider the followingexample from Medin, Goldstone, and Gentner (1993):‘‘Person 1 has on a black and white striped shirt and redand green checkered pants, and Person 2 has on a blackand white checkered shirt and red and green striped pants”(p. 260). How similar are Person 1 and Person 2? Both wearone striped item and one checkered item, and each wearsone black and white item and one red and green item. Soby a simple feature matching model such as the contrastmodel, these two people are wearing maximally similarcostumes. Such a model fails to capture the relationshipbetween the pattern and the coloring of each garment.
The structural alignment model (Gentner & Markman,1994, 1997; Markman & Gentner, 1993a, 1993b) providesa solution to this problem. According to this model, one’sconcepts are structured representations that encode fea-tures as well as the relationships among features (i.e.,structural relations). Judging similarity involves bringingtwo representations into alignment, so as to maximizeconceptual overlap. Returning to the above example, therepresentations must be aligned so that one shirt is com-pared directly to the other shirt, and likewise for the pants.This process highlights the similarity between their con-ceptual structure (i.e., both are wearing shirts and pants),and it draws attention to differences related to this struc-ture (i.e., the two shirts have different patterns, as do thepants). Thus, structural relations are a necessary andimportant component of any model of similarity.
Thematic relations also have a significant, albeit smal-ler, influence on perceived similarity (see Simmons & Estes,submitted for publication). The critical contrast betweenstructural relations and thematic relations is that whereasstructural relations occur within a single stimulus, the-matic relations occur between stimuli. To illustrate, a flow-er is connected to its stem in the same way that an eraser isattached to a pencil, thereby constituting a similarity ofstructural relations. But flowers and pencils are not the-matically related. In contrast, flowers and bees are themat-ically related, but share few if any structural relations. Anextensive body of research indicates that structural rela-tions guide the comparison process, which in turn largelydetermines the perception of similarity and difference(for review see Gentner & Markman, 1997). Of greaterinterest for the present purposes, however, is a growingbody of evidence suggesting that thematic relations alsoinfluence perceived similarity and difference.
Indeed, the importance of thematic relations to similar-ity judgments has been demonstrated across a variety ofstimuli and tasks. Bassok and Medin (1997) found thatwhen judging the similarity of two sentences containingthe same nouns (e.g., The carpenter fixed the chair and Thecarpenter sat on the chair), participants justified their rat-ings by integrating the sentences into a common scenario(e.g., ‘‘[T]he carpenter sat on the chair to see whether hefixed it well”). Thus, participants justified similarity notby comparing structural relations (e.g., both sentencesare about carpenters), but by inventing a novel thematicrelation to link the actions in each sentence. The most di-rect evidence for a thematic influence on similarity is thefinding that thematically related concepts are judged to
be more similar than thematically unrelated concepts.For example, Wisniewski and Bassok (1999) demonstratedthat participants rated apple pie and ice cream as more sim-ilar than apple pie and jello, presumably because of the the-matic link between apple pie and ice cream (i.e., the twooften are eaten together). Estes (2003) had one group ofparticipants simply rate the similarity of concept pairssuch as pancake and spatula, whereas another group of par-ticipants thematically integrated the concepts prior to rat-ing their similarity. The same two concepts were judgedmore similar by participants who had integrated themthan by participants who had not. More recently, Jonesand Love (2007) explicitly stated a relation between twoconcepts (e.g., The collie herds the sheep) before solicitingratings of their similarity. Their results corroborated theobservation that a thematic relation between two conceptsincreases the perceived similarity of those concepts.
The structural alignment model fails to explain thisinfluence of thematic relations on perceived similarityand difference. For example, from the perspective of align-ment theory, assessing the similarity of apple pie and icecream requires aligning the two representations to appre-hend commonalties (both are desserts, both are sweet)and differences related to conceptual overlap (ice creamis colder than apple pie). Structural alignment accountsfor the relations between the features of a single stimulus,but it often underestimates perceived similarity because itfails to account for the relation between two stimuli. Infact, Gentner and Brem (1999; see also Gentner & Gunn,2001) reject thematic relations as a legitimate source ofsimilarity. In their view, similarity is synonymous withcomparison (i.e., structural alignment); therefore, anyother process that influences a similarity task (e.g., the-matic integration) is considered illegitimate.
Importantly, thematic relations cannot be representedas commonalities of the form ‘‘Both X and Y participatein scenario Z”. Gentner and Gunn (2001) presented pairsof concepts and instructed participants to list either the-matic relations between the items or commonalities. Theyfound that the two tasks had different effects on the subse-quent processing of those stimuli: whereas listing thematicrelations inhibited the detection of differences betweenconcepts, listing commonalities facilitated the detectionof differences. Critically, if a thematic relation betweentwo concepts was merely a commonality between them,then listing thematic relations and listing commonalitiesshould have elicited similar effects. Thus, thematic rela-tions are not represented as common features and cannotbe accounted for by a single process model (see also Sim-mons & Estes, submitted for publication).
The dual process model (Bassok & Medin, 1997; Estes,2003; Wisniewski & Bassok, 1999) accommodates theinfluence of thematic relations simply by allowing bothcomparison (i.e., structural alignment) and integration toaffect similarity. According to the model, the relative influ-ences of the comparison and integration processes will de-pend on the relationship between the items: comparison ismore heavily weighted for structurally alignable items (i.e.,those with similar conceptual structure), whereas integra-tion is more heavily weighted for thematically relateditems. Furthermore, the relative dominance of a given pro-
S. Simmons, Z. Estes / Cognition 108 (2008) 781–795 783
cess can also be mediated by the task itself: structuralalignment should dominate similarity judgments, and the-matic integration should dominate relational judgments.Thus, the dual process model predicts that stimulus andtask factors interact to determine which processing mech-anism (i.e., alignment or integration) will dominate judg-ment. A further question of interest – which will serve asthe focus of the present investigation – is whether the rel-ative dominance of these distinct processing mechanismsalso varies systematically across participants.
1.2. Individual differences in similarity
The dual process model tacitly assumes a generalizedeffect of thematic relations on judgments of similarity.That is, most or all participants are predicted to rate itemslike milk and coffee to be slightly more similar than pairslike milk and lemonade, because the former pair is themat-ically related but the latter pair is not. By this standard ver-sion of the dual process model, which we will refer to as ageneralized model, each participant exhibits a thematic ef-fect. As an alternative, we note that the small thematic ef-fect observed in prior tasks might instead be attributableto substantial individual differences in the perception ofsimilarity. By an individualized model, some participants as-sign milk and coffee a much higher similarity rating thanmilk and lemonade, while other participants assign thetwo pairs roughly equal ratings. Put differently, theremay be a large thematic effect for a subset of participantsonly, with little or no thematic effect for other participants.The relatively small thematic effect observed in prior stud-ies may result from averaging across these two groups ofparticipants.
If the generalized model is correct, then certainly muchremains to be specified in the dual process model (e.g.,how thematic integration occurs), but the basic modeldelineated by Wisniewski and Bassok (1999) would pro-vide a sound framework for further development. In con-trast, if the individualized model were correct, thenmodels of similarity would require more substantial revi-sion. In particular, models of similarity may require theaddition of an individual parameter, and in fact, thisparameter may ultimately prove more important thaneither the stimulus parameter or the task parameter. Thepurpose of the present investigation, therefore, was to dis-criminate between the generalized and individualized ver-sions of the dual process model.
Preliminary evidence from research on categorizationsupports the individualized model. A traditional assump-tion about category learning is that adults form taxonomic(comparison-based) rather than thematic (integration-based) categories. Lin and Murphy (2001; see also Murphy,2001) found across several studies that many participantsconsistently categorized a base concept (camel) with ataxonomically related alternative (antelope) rather thanwith a thematically related alternative (desert). But a sub-stantial number of other participants consistently catego-rized the base concepts with the thematically relatedalternative instead. To the extent that categorization isbased on similarity, it is likely that comparable individualdifferences will be observed in similarity judgments as
well. Indeed, we have found elsewhere that some partici-pants exhibit a systematic dissociation of similarity andcategorization judgments, while other participants exhibitno such dissociation (Hampton, Estes, & Simmons, 2007).Thus, research on categorization suggests that differentindividuals may perceive similarity in very different ways.
Some prior research on similarity indicates that individ-ual differences in similarity are associated with thematicintegration. Gentner and Brem (1999) describe a screeningtask in which 702 participants were presented triadsconsisting of a base, a taxonomic alternative, and a the-matic alternative (cf. Lin & Murphy, 2001). Participantswere instructed to choose the alternative that was mostsimilar to the base. Of Gentner and Brem’s sample, 41%of participants exhibited no systematic preference foreither alternative (i.e., taxonomic or thematic). However,48% consistently chose the taxonomic alternative, while11% consistently chose the thematic alternative (see alsoSimmons & Estes, submitted for publication, described be-low). This study indicates systematic individual differencesin the perception of similarity.
1.3. Non-inversion of similarity and difference
The simplest model of similarity and difference wouldhold that these factors are complementary, or inverse. Thatis, as similarity increases, difference decreases to the sameextent. For instance, if cats and dogs have a similarity rat-ing of 6 on a 1-to-7 scale, then they ought to have a differ-ence rating of 2. However, in certain cases perceivedsimilarity is not inversely related to perceived difference.Medin et al. (1990) demonstrated a non-inversion betweensimilarity and difference using configurations of geometricshapes in a triad task. For a given target item (e.g., a blacksquare above a white circle) one response option matchedin relation information but mismatched in attribute infor-mation (e.g., a white square above a white circle), whereasthe other matched in attribute information but mis-matched in relation information (e.g., a black square nextto a white circle). When asked to pick the alternative thatwas more similar to the target, participants usually chosethe relation match. However, participants also usuallychose the relation match when the task was to pick thealternative that was more different from the target. Thatis, participants chose the same items as both more similarand more different. Estes and Hasson (2004) found a sim-ilar pattern of results. In their experiment, participantspreferred the relation match in the similarity condition,but showed no preference in difference. Bassok and Medin(1997) demonstrated non-inversion in a sentence compar-ison task. Participants judged a base sentence (The carpen-ter fixed the chair) as more similar to a relational match(The electrician fixed the radio) than to an attribute match(The carpenter sat in the chair). But once again, participantsdemonstrated no preference in difference judgments. Ineach of these studies, the non-inversion was attributableto a greater relative weighting of structural relations insimilarity than in difference.
Simmons and Estes (submitted for publication) testedwhether thematic relations might also induce a non-inversion of similarity and difference. We solicited from

784 S. Simmons, Z. Estes / Cognition 108 (2008) 781–795
participants both similarity ratings and difference ratings(between-participants) for the same pairs of thematicallyrelated and unrelated concepts. Results corroborated theinfluence of thematic relations on perceived similarity(Wisniewski & Bassok, 1999). But more importantly, thisthematic effect was significantly attenuated in differenceratings, thereby producing a non-inversion. In Experiment1, for instance, thematic relatedness accounted for 54% ofthe variance in similarity ratings, but only 34% of the var-iance in difference ratings. In another experiment weexplicitly instructed participants to base their ratings onfeatures alone, and participants generally were able to dis-count thematic relations from their ratings. This exclusionof thematic relations substantially reduced the non-inver-sion. In a final experiment we administered a similaritytriad task (cf. Gentner & Brem, 1999; Lin & Murphy,2001) prior to the similarity or difference rating task. Con-sistent with previous studies, the triad task revealed sub-stantial individual variability in perceived similarity.More interesting, though, was the finding that participants’preference for thematic alternatives in the triad task betterpredicted their subsequent similarity ratings than their dif-ference ratings. So, again thematic relations were more clo-sely associated with perceived similarity than withperceived difference. Even more strikingly, participantswho preferred thematic choices exhibited a non-inversionof similarity and difference, whereas participants who pre-ferred taxonomic choices did not exhibit the non-inver-sion. These experiments provide initial evidence thatthematic relations are more heavily weighted in similarityjudgments than in difference judgments, and that this ef-fect is observed only in a subset of participants.
In summary, although the generalized dual processmodel (e.g., Wisniewski & Bassok, 1999) currently offersthe only account of thematic relations, more recent evi-dence appears to support an individualized model instead.Below we report a series of studies that examine in greaterdetail the presumed individual variability of perceivedsimilarity and difference.
2. Experiment 1a
The purpose of Experiment 1a was to provide an initialtest of the generalized and individualized models. Theexperiment also tested whether a preference for thematicchoices is related to the non-inversion of similarity and dif-ference, as suggested by Simmons and Estes (submitted forpublication). Using the triad choice task (Gentner & Brem,1999; Markman & Hutchinson, 1984; see also Lin & Mur-phy, 2001), participants chose whether a taxonomic alter-native or a thematic alternative was more similar to (ormore different from) a base stimulus. For instance, the basestimulus bee was presented with alternative choices fly andhoney, and participants chose the alternative that waseither more similar to or more different from the base (be-tween-participants). The generalized model (Bassok &Medin, 1997; Estes, 2003; Wisniewski & Bassok, 1999) as-sumes between-participant agreement. That is, the propor-tion of thematic choices should be relatively constantacross participants. Alternatively, the individualized model
assumes that the dominance of comparison or integrationis largely determined by the individual. Thus, the individu-alized model predicts between-participant disagreement;many thematic respondents and many taxonomic respon-dents should be observed. Finally, if thematic relations aremore relevant to similarity than to difference, as suggestedby the results of Simmons and Estes (submitted for publi-cation), then thematic choices should be more common insimilarity than in difference judgments.
2.1. Method
2.1.1. ParticipantsParticipants in all experiments were undergraduates at
the University of Georgia, all were native English speakers,and all received course credit for participation. In Experi-ment 1a, 68 participants were randomly assigned to a sim-ilarity condition (n = 35) or a difference condition (n = 33).
2.1.2. Materials and procedureThirty triads were sampled from Lin and Murphy (2001,
Table 1, items 1–30). Each triad consisted of a base (pencil),a thematically related option (eraser), and a taxonomicallyrelated option (pen). On each trial the base appeared in thecenter of a computer display, above the response options,which appeared left and right of center on the same line. Par-ticipants in the similarity condition were instructed to ‘‘Pickthe response option that is most similar to [base]” by press-ing the h1i or the h2i key. The difference condition was iden-tical except that participants were instructed to choose theoption ‘‘most different from” the base. Assignment of taxo-nomic and thematic options to the left and right positionswas counterbalanced across two lists. Each participantjudged all 30 triads, which appeared in random order.
2.2. Results
Agreement was tested across participants (Lin & Mur-phy, 2001), whereas non-inversion was tested across items(Medin et al., 1990). These analyses are reported separatelybelow.
2.2.1. AgreementFor each participant we calculated the proportion of tri-
als on which the thematic option was chosen (thematicproportion). Participants were classified into three groupson the basis of binomial probability. Given 30 triads, anyparticipant whose thematic proportion was between .31and .69 (inclusive) exhibited no significant preference foreither taxonomic or thematic options. These participantsconstituted a ‘‘Mixed” response group. Participants whoexhibited a significant preference for taxonomic options(i.e., thematic proportion <.31, binomial p < .05) weredubbed the ‘‘Taxonomic” group, and those who signifi-cantly preferred the thematic option (i.e., thematic propor-tion >.69, binomial p < .05) constituted a ‘‘Thematic” group.
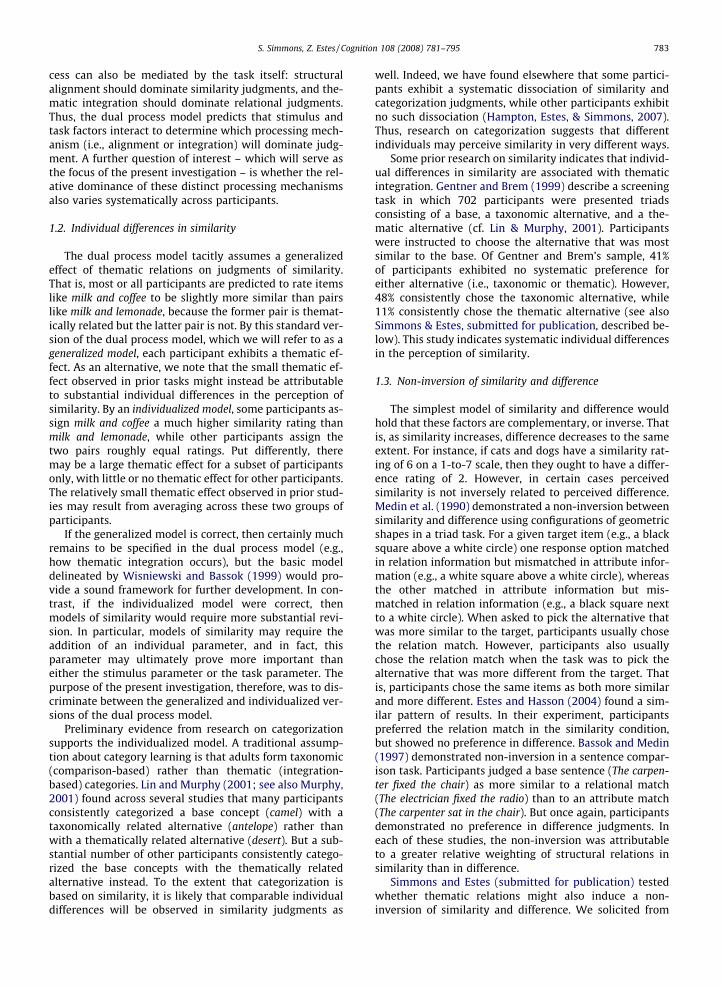
Table 1 and Fig. 1 illustrate the distribution of partici-pants among these groups. Participants tended to exhibita clear preference for either taxonomic or thematicchoices; only 23% and 21% of participants in the similarityand difference conditions (respectively) chose the taxo-
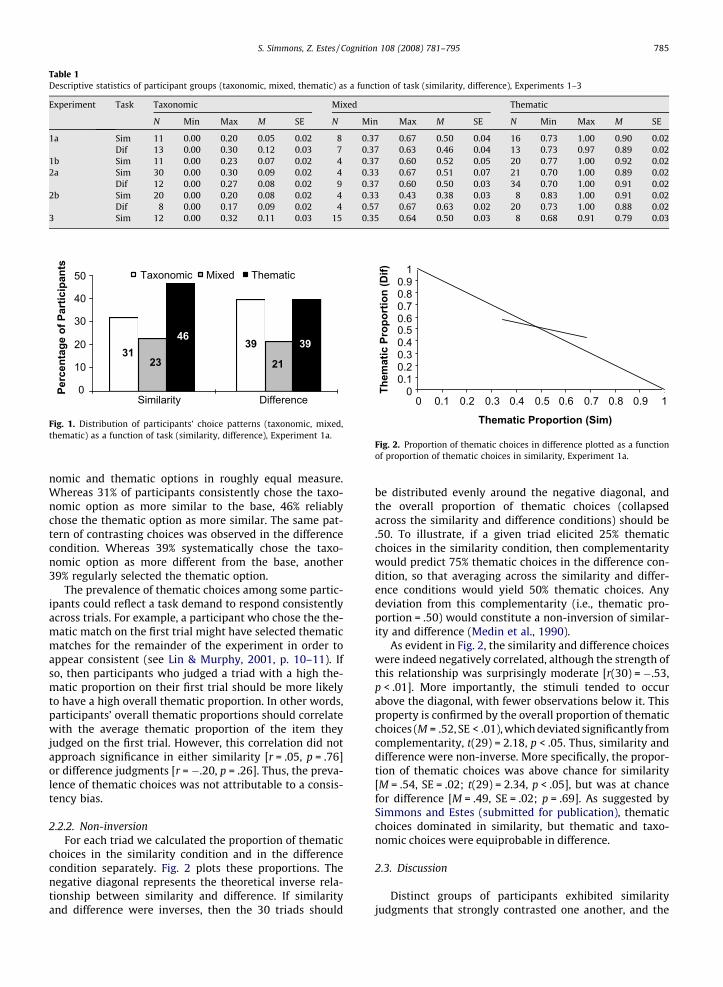
Table 1Descriptive statistics of participant groups (taxonomic, mixed, thematic) as a function of task (similarity, difference), Experiments 1–3
Experiment Task Taxonomic Mixed Thematic
N Min Max M SE N Min Max M SE N Min Max M SE
1a Sim 11 0.00 0.20 0.05 0.02 8 0.37 0.67 0.50 0.04 16 0.73 1.00 0.90 0.02Dif 13 0.00 0.30 0.12 0.03 7 0.37 0.63 0.46 0.04 13 0.73 0.97 0.89 0.02
1b Sim 11 0.00 0.23 0.07 0.02 4 0.37 0.60 0.52 0.05 20 0.77 1.00 0.92 0.022a Sim 30 0.00 0.30 0.09 0.02 4 0.33 0.67 0.51 0.07 21 0.70 1.00 0.89 0.02
Dif 12 0.00 0.27 0.08 0.02 9 0.37 0.60 0.50 0.03 34 0.70 1.00 0.91 0.022b Sim 20 0.00 0.20 0.08 0.02 4 0.33 0.43 0.38 0.03 8 0.83 1.00 0.91 0.02
Dif 8 0.00 0.17 0.09 0.02 4 0.57 0.67 0.63 0.02 20 0.73 1.00 0.88 0.023 Sim 12 0.00 0.32 0.11 0.03 15 0.35 0.64 0.50 0.03 8 0.68 0.91 0.79 0.03
3139
23 21
4639
0
10
20
30
40
50
Similarity Difference
Perc
enta
ge o
f Par
ticip
ants
Taxonomic Mixed Thematic
Fig. 1. Distribution of participants’ choice patterns (taxonomic, mixed,thematic) as a function of task (similarity, difference), Experiment 1a.
00.10.20.30.40.50.60.70.80.9
1
0 0.1 0.2 0.3 0.4 0.5 0.6 0.7 0.8 0.9 1
Thematic Proportion (Sim)
Them
atic
Pro
port
ion
(Dif)
Fig. 2. Proportion of thematic choices in difference plotted as a functionof proportion of thematic choices in similarity, Experiment 1a.
S. Simmons, Z. Estes / Cognition 108 (2008) 781–795 785
nomic and thematic options in roughly equal measure.Whereas 31% of participants consistently chose the taxo-nomic option as more similar to the base, 46% reliablychose the thematic option as more similar. The same pat-tern of contrasting choices was observed in the differencecondition. Whereas 39% systematically chose the taxo-nomic option as more different from the base, another39% regularly selected the thematic option.
The prevalence of thematic choices among some partic-ipants could reflect a task demand to respond consistentlyacross trials. For example, a participant who chose the the-matic match on the first trial might have selected thematicmatches for the remainder of the experiment in order toappear consistent (see Lin & Murphy, 2001, p. 10–11). Ifso, then participants who judged a triad with a high the-matic proportion on their first trial should be more likelyto have a high overall thematic proportion. In other words,participants’ overall thematic proportions should correlatewith the average thematic proportion of the item theyjudged on the first trial. However, this correlation did notapproach significance in either similarity [r = .05, p = .76]or difference judgments [r = �.20, p = .26]. Thus, the preva-lence of thematic choices was not attributable to a consis-tency bias.
2.2.2. Non-inversionFor each triad we calculated the proportion of thematic
choices in the similarity condition and in the differencecondition separately. Fig. 2 plots these proportions. Thenegative diagonal represents the theoretical inverse rela-tionship between similarity and difference. If similarityand difference were inverses, then the 30 triads should
be distributed evenly around the negative diagonal, andthe overall proportion of thematic choices (collapsedacross the similarity and difference conditions) should be.50. To illustrate, if a given triad elicited 25% thematicchoices in the similarity condition, then complementaritywould predict 75% thematic choices in the difference con-dition, so that averaging across the similarity and differ-ence conditions would yield 50% thematic choices. Anydeviation from this complementarity (i.e., thematic pro-portion = .50) would constitute a non-inversion of similar-ity and difference (Medin et al., 1990).
As evident in Fig. 2, the similarity and difference choiceswere indeed negatively correlated, although the strength ofthis relationship was surprisingly moderate [r(30) = �.53,p < .01]. More importantly, the stimuli tended to occurabove the diagonal, with fewer observations below it. Thisproperty is confirmed by the overall proportion of thematicchoices (M = .52, SE < .01), which deviated significantly fromcomplementarity, t(29) = 2.18, p < .05. Thus, similarity anddifference were non-inverse. More specifically, the propor-tion of thematic choices was above chance for similarity[M = .54, SE = .02; t(29) = 2.34, p < .05], but was at chancefor difference [M = .49, SE = .02; p = .69]. As suggested bySimmons and Estes (submitted for publication), thematicchoices dominated in similarity, but thematic and taxo-nomic choices were equiprobable in difference.
2.3. Discussion
Distinct groups of participants exhibited similarityjudgments that strongly contrasted one another, and the

786 S. Simmons, Z. Estes / Cognition 108 (2008) 781–795
same occurred for difference judgments as well. These re-sults cannot be explained by the contrast model (Navarro &Lee, 2004; Tversky, 1977) or by structural alignment (e.g.,Gentner & Markman, 1997). If similarity and differencewere based on comparison only, then thematic choicesshould occur rarely (if ever). Thus, these models fail to ex-plain the prevalence – indeed, the dominance – of thematicchoices. The generalized model, which includes both com-parison and thematic integration (Bassok & Medin, 1997;Estes, 2003; Wisniewski & Bassok, 1999), provides only apartial explanation. Although this model can account fora consistent amount of thematic responding across partic-ipants, it does not explain the systematic individual differ-ences in similarity judgments. Only the individualizedmodel can explain these results. For some participants(i.e., the taxonomic group in similarity and the thematicgroup in difference), similarity and difference do appearto favor feature comparison. But for others (i.e., the the-matic group in similarity and the taxonomic group in dif-ference), thematic relatedness is clearly more central tosimilarity and difference. And yet a third group (i.e., mixed)appear to weight the feature comparison and thematicintegration processes more equally. Notably, however, thismixed responding was relatively rare. So evidently, simi-larity and difference both entail dual processes of compar-ison and integration, but the relative weightings of thesetwo factors vary dramatically across participants.
Furthermore, between-participant disagreement pro-duced a non-inversion of similarity and difference. Thatis, thematic choices were more common than taxonomicchoices in the similarity condition but thematic and taxo-nomic choices were equiprobable in the difference condi-tion. So the thematic dominance in similarity was notcomplemented by a taxonomic dominance in difference,and hence a non-inversion of similarity and difference oc-curred (see Fig. 2).
One could argue that the non-inversion was simply theproduct of variability across samples (e.g., we happened tosample more thematic participants in the similarity condi-tion). We believe that this is unlikely. Previous demonstra-tions of non-inversion also manipulated judgmentbetween-participants (Bassok & Medin, 1997; Estes & Has-son, 2004; Medin et al., 1990; Simmons & Estes, submittedfor publication), and in each of those experiments, rela-tional matches tended to be selected as both more similarto and more different from a base concept. If the effectwere attributable to random sampling error, then someof these studies would be expected to exhibit the oppositeeffect – that is, a tendency to select attribute matches asboth more similar and more different. Nonetheless, thissampling explanation of non-inversion is investigatedmore directly in Experiment 2.
3. Experiment 1b
The previous experiment demonstrated between-par-ticipant disagreement in similarity and difference judg-ments. However, similarity judgments are highlysensitive to a variety of task factors (Barsalou, 1982; Beck,1966; Gentner & Brem, 1999), including the precise word-
ing of the similarity question (e.g., Goldstone, 1994). Inparticular, Jones and Love (2007) found that participantsare less likely to respond thematically when asked abouthow like items are, rather than how similar they are. There-fore, in order to test whether the prevalence of thematicresponding might have resulted from a misconstrual ofthe term ‘‘similarity”, in this study we asked participantsto choose the alternative that was more ‘‘like” the base. Ifthe occurrence of thematic responding were contingenton this minor wording manipulation, it would underminethe supposition that thematic responding reflects a deeperconceptual preference. In contrast, between-participantdisagreement under this condition would demonstratethe robustness of individual differences in the perceptionof similarity.
3.1. Method
Thirty-five undergraduates participated. The procedurewas identical to the similarity condition in Experiment1a, except that for each item the word ‘‘like” was substi-tuted for ‘‘similar to”.
3.2. Results
Despite substituting ‘‘like” for ‘‘similar to”, between-participant disagreement persisted (see Table 1). Nearly athird (31%) of participants were classified as taxonomic,while a full 57% of participants were classified as thematic.Only 12% fell into the mixed category. As in Experiment 1a,the preference for thematic matches was above chance[M = .60, SE = .01; t(29) = 8.71, p < .001]. In fact, this distri-bution of participants among the three response groupswas statistically indistinguishable from the distributionin the similarity condition of Experiment 1a (left half ofFig. 1) [v2(2) = 1.78, p = .41]. In other words, ‘‘similar to”and ‘‘like” elicited analogous patterns of responding.
3.3. Discussion
It is apparent from these results that the same between-participant disagreement obtained even though the taskwas designed to discourage thematic responses (Jones &Love, 2007). This suggests a deeper conceptual basis fordisagreement that cannot be dismissed as a misinterpreta-tion of ‘‘similarity”. Participants appear to have strikinglydifferent beliefs about the nature of similarity. To someparticipants common features are more important, whileto others the relations between concepts are the most crit-ical. Results therefore necessitate an individualized modelof perceived similarity.
4. Experiment 2a
The presence of individual differences in similarity anddifference judgments provides an important theoreticalconstraint on models of similarity. Moreover, those modelsare constrained further by the non-inversion of similarityand difference. All prior demonstrations of non-inversion(including Experiment 1a) have elicited similarity and dif-

55
277 11
38
62
010203040506070
Similarity DifferencePerc
enta
ge o
f Par
ticip
ants Taxonomic Mixed Thematic
Fig. 3. Distribution of participants’ choice patterns (taxonomic, mixed,thematic) as a function of task (similarity, difference), Experiment 2a.
S. Simmons, Z. Estes / Cognition 108 (2008) 781–795 787
ference judgments between-participants, so it is unclearwhether individual participants exhibit non-inversion orwhether it occurs only at the group level. In other words,do participants simply always select the same type of op-tion (thematic or taxonomic) regardless of the task (simi-larity or difference), or do individual participants treatsimilarity and difference judgments as inverses? Perhapseliciting both similarity and difference judgments of thesame items from the same participants would reveal acomplementary relationship between the measures, there-by eliminating non-inversion. Presumably, if a participantjudges pencil as more similar to eraser than to pen, thatsame participant would judge pencil as more different frompen than from eraser. If this is the case, then individualdifferences are relatively stable across judgments; a the-matic participant in similarity should become a taxonomicparticipant in difference, and vice versa. To test this possi-bility, Experiment 2a was an exact replication of Experi-ment 1a, except that similarity and difference judgmentswere collected within-participants in two different phasesof the experiment. If the same individuals were reliably tochoose a given option as both more similar to and moredifferent from its base, that would provide strong evidenceof non-inversion. Furthermore, if the non-inversion isattributable to a greater reliance on thematic integrationthan on feature comparison, thematic participants shouldbe more likely than taxonomic participants to exhibitnon-inversion.
4.1. Method
Fifty-five undergraduates participated. The materialsand procedure were identical to Experiment 1a, exceptthat each participant judged both the similarity and thedifference of all 30 triads. At the beginning of the session,participants were randomly assigned to complete eitherthe similarity judgments or the difference judgments. Par-ticipants then completed several unrelated tasks (e.g., amediated priming experiment), and after approximately20–30 min they completed the other judgments. Thus thesimilarity and difference judgments were blocked, coun-terbalanced, and separated by approximately 20 min.
4.2. Results
4.2.1. AgreementParticipants were classified into response groups
according to the criteria established in Experiment 1. Totest for effects of presentation order (similarity first or dif-ference first) we conducted a 2 (order) by 2 (judgment)ANOVA on thematic proportions with participants random.Because neither the main effect of order [F(1,53) = .54,p = .47] nor the order by judgment interaction [F(1,53) =3.53, p = .07] was significant, we collapsed across presenta-tion order for the remaining analyses.
As in Experiment 1a, the distribution of participants’thematic proportions indicated between-participant dis-agreement in similarity and difference judgments (seeTable 1 and Fig. 3). In the similarity condition, over halfof participants (55%) chose the taxonomic option most ofthe time, while over a third (38%) chose the thematic
option for most trials. Only 7% of participants had thematicproportions in the middle interval, indicating that mostpeople demonstrated a preference for one or the other typeof option. In the difference condition, 27% of participantstended to choose the taxonomic option, while 62% pre-ferred the thematic option. The percentage of participantshaving thematic proportions in the middle interval wasagain relatively low (11%), indicating that few people choseboth option-types equally often. Thus, the present experi-ment replicated the between-participant disagreement insimilarity and difference that was originally observed inthe preceding experiment.
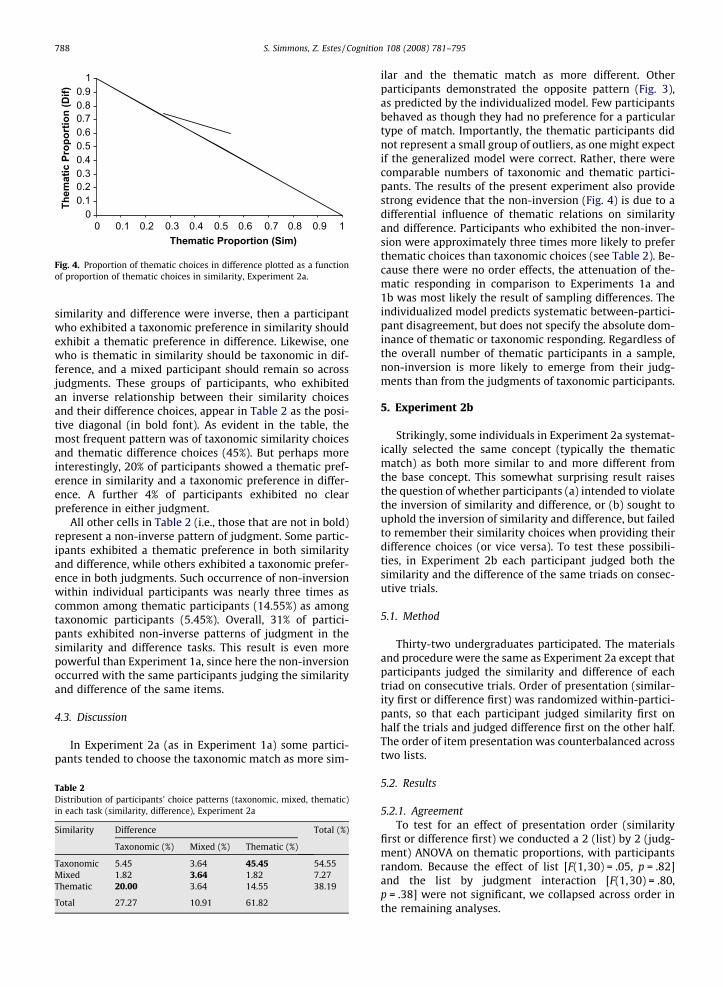
4.2.2. Non-inversionThe proportions of thematic choices in the similarity and
difference conditions are plotted in Fig. 4. Recall that if sim-ilarity and difference judgments were complementary,then the items should be distributed about the negativediagonal, and the overall proportion of thematic choicesshould be .50. As in Experiment 1a, similarity and differ-ence were indeed negatively correlated [r(30) = �.63,p < .001], but the majority of items were distributed abovethe negative diagonal. Thus, the overall proportion of the-matic choices (M = .54, SE < .01) was significantly greaterthan .50 [t(29) = 8.70, p < .001]. This result indicates thatsimilarity and difference judgments were non-inverseagain. In Experiment 1a the thematic option was preferredin similarity judgments (M = .54, SE = .02), but the differ-ence judgments exhibited no reliable preference (M = .49,SE = .02). Here in Experiment 2a both similarity and differ-ence judgments exhibited a reliable preference: whereasthe taxonomic option was preferred in similarity [M = .43,SE = .01, t(29) = �5.80, p < .001], the thematic optiondominated in difference [M = .66, SE = .01, t(29) = 15.34,p < .001].
Across participants, the same option was selected asboth more similar and more different on 33% of trials.The vast majority of these individual cases of non-inver-sion occurred with thematic options: the thematic alterna-tive was chosen as both more similar and more different on24% of trials, while the taxonomic alternative was chosenin both judgments only 9% of the time. This finding ex-plains why the overall thematic proportion was greaterthan .50 (see above).
Table 2 presents the distribution of participants amongthe three response group in each of the judgment tasks. If
00.10.20.30.40.50.60.70.80.9
1
0 0.1 0.2 0.3 0.4 0.5 0.6 0.7 0.8 0.9 1Thematic Proportion (Sim)
Them
atic
Pro
port
ion
(Dif)
Fig. 4. Proportion of thematic choices in difference plotted as a functionof proportion of thematic choices in similarity, Experiment 2a.
788 S. Simmons, Z. Estes / Cognition 108 (2008) 781–795
similarity and difference were inverse, then a participantwho exhibited a taxonomic preference in similarity shouldexhibit a thematic preference in difference. Likewise, onewho is thematic in similarity should be taxonomic in dif-ference, and a mixed participant should remain so acrossjudgments. These groups of participants, who exhibitedan inverse relationship between their similarity choicesand their difference choices, appear in Table 2 as the posi-tive diagonal (in bold font). As evident in the table, themost frequent pattern was of taxonomic similarity choicesand thematic difference choices (45%). But perhaps moreinterestingly, 20% of participants showed a thematic pref-erence in similarity and a taxonomic preference in differ-ence. A further 4% of participants exhibited no clearpreference in either judgment.
All other cells in Table 2 (i.e., those that are not in bold)represent a non-inverse pattern of judgment. Some partic-ipants exhibited a thematic preference in both similarityand difference, while others exhibited a taxonomic prefer-ence in both judgments. Such occurrence of non-inversionwithin individual participants was nearly three times ascommon among thematic participants (14.55%) as amongtaxonomic participants (5.45%). Overall, 31% of partici-pants exhibited non-inverse patterns of judgment in thesimilarity and difference tasks. This result is even morepowerful than Experiment 1a, since here the non-inversionoccurred with the same participants judging the similarityand difference of the same items.
4.3. Discussion
In Experiment 2a (as in Experiment 1a) some partici-pants tended to choose the taxonomic match as more sim-
Table 2Distribution of participants’ choice patterns (taxonomic, mixed, thematic)in each task (similarity, difference), Experiment 2a
Similarity Difference Total (%)
Taxonomic (%) Mixed (%) Thematic (%)
Taxonomic 5.45 3.64 45.45 54.55Mixed 1.82 3.64 1.82 7.27Thematic 20.00 3.64 14.55 38.19
Total 27.27 10.91 61.82
ilar and the thematic match as more different. Otherparticipants demonstrated the opposite pattern (Fig. 3),as predicted by the individualized model. Few participantsbehaved as though they had no preference for a particulartype of match. Importantly, the thematic participants didnot represent a small group of outliers, as one might expectif the generalized model were correct. Rather, there werecomparable numbers of taxonomic and thematic partici-pants. The results of the present experiment also providestrong evidence that the non-inversion (Fig. 4) is due to adifferential influence of thematic relations on similarityand difference. Participants who exhibited the non-inver-sion were approximately three times more likely to preferthematic choices than taxonomic choices (see Table 2). Be-cause there were no order effects, the attenuation of the-matic responding in comparison to Experiments 1a and1b was most likely the result of sampling differences. Theindividualized model predicts systematic between-partici-pant disagreement, but does not specify the absolute dom-inance of thematic or taxonomic responding. Regardless ofthe overall number of thematic participants in a sample,non-inversion is more likely to emerge from their judg-ments than from the judgments of taxonomic participants.
5. Experiment 2b
Strikingly, some individuals in Experiment 2a systemat-ically selected the same concept (typically the thematicmatch) as both more similar to and more different fromthe base concept. This somewhat surprising result raisesthe question of whether participants (a) intended to violatethe inversion of similarity and difference, or (b) sought touphold the inversion of similarity and difference, but failedto remember their similarity choices when providing theirdifference choices (or vice versa). To test these possibili-ties, in Experiment 2b each participant judged both thesimilarity and the difference of the same triads on consec-utive trials.
5.1. Method
Thirty-two undergraduates participated. The materialsand procedure were the same as Experiment 2a except thatparticipants judged the similarity and difference of eachtriad on consecutive trials. Order of presentation (similar-ity first or difference first) was randomized within-partici-pants, so that each participant judged similarity first onhalf the trials and judged difference first on the other half.The order of item presentation was counterbalanced acrosstwo lists.
5.2. Results
5.2.1. AgreementTo test for an effect of presentation order (similarity
first or difference first) we conducted a 2 (list) by 2 (judg-ment) ANOVA on thematic proportions, with participantsrandom. Because the effect of list [F(1,30) = .05, p = .82]and the list by judgment interaction [F(1,30) = .80,p = .38] were not significant, we collapsed across order inthe remaining analyses.
00.10.20.30.40.50.60.70.80.9
1
0 0.1 0.2 0.3 0.4 0.5 0.6 0.7 0.8 0.9 1Thematic Proportion (Sim)
Them
atic
Pro
port
ion
(Dif)
Fig. 6. Proportion of thematic choices in difference plotted as a functionof proportion of thematic choices in similarity, Experiment 2b.
Table 3Distribution of participants’ choice patterns (taxonomic, mixed, thematic)in each task (similarity, difference), Experiment 2b
Similarity Difference Total (%)
Taxonomic (%) Mixed (%) Thematic (%)
Taxonomic 0.00 0.00 62.00 62.00Mixed 0.00 13.00 0.00 13.00Thematic 25.00 0.00 0.00 25.00
Total 25.00 13.00 62.00
S. Simmons, Z. Estes / Cognition 108 (2008) 781–795 789
Despite judging similarity and difference on consecu-tive trials, participants continued to disagree in theirchoices (see Table 1 and Fig. 5). Over half (62%) of partici-pants reliably selected the taxonomic match in similarity(taxonomic participants) and a quarter (25%) almost al-ways chose the thematic match (thematic participants).Only 13% of the participants had no clear preference foreither match (mixed participants). The pattern was themirror image in difference, where most participants se-lected the thematic match (62%) and a substantial minorityselected the taxonomic match (25%). Once again, few par-ticipants (13%) exhibited no preference. As in the previousexperiments, the distribution of similarity and differencejudgments was characterized by between-participantdisagreement.
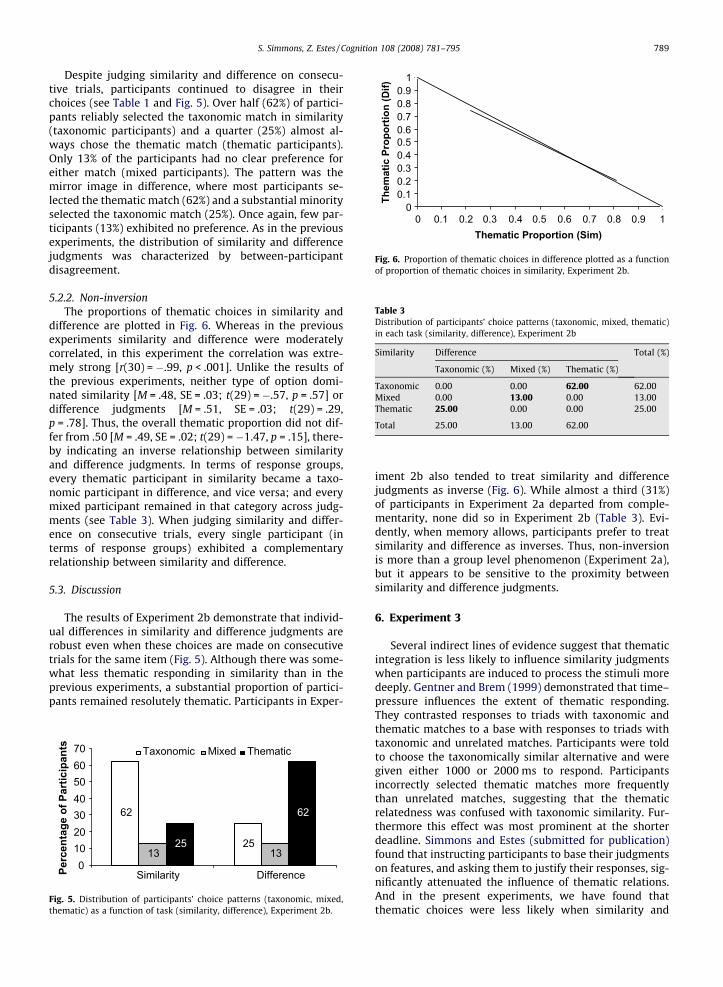
5.2.2. Non-inversionThe proportions of thematic choices in similarity and
difference are plotted in Fig. 6. Whereas in the previousexperiments similarity and difference were moderatelycorrelated, in this experiment the correlation was extre-mely strong [r(30) = �.99, p < .001]. Unlike the results ofthe previous experiments, neither type of option domi-nated similarity [M = .48, SE = .03; t(29) = �.57, p = .57] ordifference judgments [M = .51, SE = .03; t(29) = .29,p = .78]. Thus, the overall thematic proportion did not dif-fer from .50 [M = .49, SE = .02; t(29) = �1.47, p = .15], there-by indicating an inverse relationship between similarityand difference judgments. In terms of response groups,every thematic participant in similarity became a taxo-nomic participant in difference, and vice versa; and everymixed participant remained in that category across judg-ments (see Table 3). When judging similarity and differ-ence on consecutive trials, every single participant (interms of response groups) exhibited a complementaryrelationship between similarity and difference.
5.3. Discussion
The results of Experiment 2b demonstrate that individ-ual differences in similarity and difference judgments arerobust even when these choices are made on consecutivetrials for the same item (Fig. 5). Although there was some-what less thematic responding in similarity than in theprevious experiments, a substantial proportion of partici-pants remained resolutely thematic. Participants in Exper-
62
2513 13
25
62
010203040506070
Similarity DifferencePerc
enta
ge o
f Par
ticip
ants Taxonomic Mixed Thematic
Fig. 5. Distribution of participants’ choice patterns (taxonomic, mixed,thematic) as a function of task (similarity, difference), Experiment 2b.
iment 2b also tended to treat similarity and differencejudgments as inverse (Fig. 6). While almost a third (31%)of participants in Experiment 2a departed from comple-mentarity, none did so in Experiment 2b (Table 3). Evi-dently, when memory allows, participants prefer to treatsimilarity and difference as inverses. Thus, non-inversionis more than a group level phenomenon (Experiment 2a),but it appears to be sensitive to the proximity betweensimilarity and difference judgments.
6. Experiment 3
Several indirect lines of evidence suggest that thematicintegration is less likely to influence similarity judgmentswhen participants are induced to process the stimuli moredeeply. Gentner and Brem (1999) demonstrated that time–pressure influences the extent of thematic responding.They contrasted responses to triads with taxonomic andthematic matches to a base with responses to triads withtaxonomic and unrelated matches. Participants were toldto choose the taxonomically similar alternative and weregiven either 1000 or 2000 ms to respond. Participantsincorrectly selected thematic matches more frequentlythan unrelated matches, suggesting that the thematicrelatedness was confused with taxonomic similarity. Fur-thermore this effect was most prominent at the shorterdeadline. Simmons and Estes (submitted for publication)found that instructing participants to base their judgmentson features, and asking them to justify their responses, sig-nificantly attenuated the influence of thematic relations.And in the present experiments, we have found thatthematic choices were less likely when similarity and

790 S. Simmons, Z. Estes / Cognition 108 (2008) 781–795
difference judgments were directly contrasted on consecu-tive trials (Experiment 2b) than when the judgmentsoccurred at different times (Experiment 2a). Given thesefindings, one could infer that thematic participants simplyare not very thoughtful; when induced to invest morethought into their judgments, thematic responding decrea-ses. This inference is consistent with Gentner and Brem’s(1999) suggestion that the thematic influence on similarityarises from inadvertently combining the outputs of com-parison and integration.
The primary purpose of Experiment 3 was to test thishypothesis that thematic respondents are perhaps lessthoughtful than their taxonomic peers. To investigate thispossibility, we assessed participants’ need for cognition(henceforth ‘‘NFC”), which is ‘‘the tendency for an individ-ual to engage in and enjoy thinking” (Cacioppo & Petty,1982, p. 116). Given that individuals who are high in NFCtend to process information deeply (Lassiter, Briggs, &Slaw, 1991; Levin, Huneke, & Jasper, 2000), the hypothesisis that those same individuals should be less likely to makethematic judgments. Individuals low in NFC, in contrast,should be more likely to make thematic judgments. Thus,NFC should correlate negatively with thematic responding.
Alternatively, the thematic responding in the previousexperiments could reflect participants’ genuine belief thatthematic relations are a legitimate component of similar-ity. That is, perhaps thematic participants and taxonomicparticipants simply possess different conceptions of simi-larity. To assess this explanation of thematic responding,we directly probed participants’ beliefs about similarity.In particular, we gauged the extent to which participantsagreed (or disagreed) that two things are similar if (a) theyhave the same features, (b) they belong in the same cate-gory, and (c) they occur in the same scenario. The firsttwo potential sources of similarity (i.e., feature overlapand category co-membership) correspond to the compari-son process and were expected to be favored by taxonomicrespondents. The latter potential source of similarity (i.e.,scenario co-occurrence) corresponds instead to thematicintegration. The question of most interest here is whetherthematic participants endorse scenario co-occurrence as alegitimate source of similarity. If so, that would indicatethat their thematic responding is no mistake or confusion;thematic responding would be deliberate rather thanthoughtless. If thematic participants were to reject sce-nario co-occurrence, however, this would support the sup-position that thematic responding is inadvertent. So tosummarize, if thoughtlessness explains thematic respond-ing, then NFC should predict thematic preference. If, how-ever, thematic responding reflects a belief about the natureof similarity, then participants’ tendency to identify the-matic relations as relevant to similarity should predict the-matic preference.
A secondary purpose of Experiment 3 was to generalizethe observation of thematic responding to more controlledstimuli and a potentially less biased task. Regarding thestimuli, the prevalence of thematic responding in the pre-vious experiments could be due to various lexical factorssuch as word frequency, association, or co-occurrence fre-quency. That is, participants might have been inclined sim-ply to choose the alternative that was more frequent, more
strongly associated with the base, or more likely to co-oc-cur with the base in ordinary language use. To addressthese possibilities, in Experiment 3 we developed a newset of stimuli for which the taxonomic and thematic alter-natives were matched for word frequency, strength ofassociation with the base concept, and frequency of co-occurrence with the base concept. Regarding the task, itis possible that the presentation of two options on eachtrial of the experiment could artificially inflate the preva-lence of thematic responding; participants may infer animplicit demand to choose the thematic option on at leastsome of the trials. To address this concern, in Experiment 3we used a rating task in which participants rated the sim-ilarity of the base concept (e.g., ‘‘cake”) to a single otherconcept (e.g., ‘‘cookie”). To examine participants’ prefer-ences for taxonomic or thematic responding, we can com-pare for each base concept its similarity to the taxonomicalternative and its similarity to the thematic alternative.If an individual consistently rates the base concepts moresimilar to their thematic match than to their taxonomicmatch, then she would be a thematic participant. Thismethodology presumably will provide a less biased mea-sure of the prevalence of thematic responding.
6.1. Method
6.1.1. ParticipantsThirty-five undergraduates participated.
6.1.2. Materials and procedureItems consisted of 30 base concepts, each paired with
one taxonomic and one thematic alternative. For example,dungeon was paired with basement (taxonomic) and torture(thematic). Stimulus characteristics are summarized in Ta-ble 4, and a complete list of stimuli is presented in Table 5.As shown in Table 4, the taxonomic and thematic alterna-tives were matched for word frequency (p = .55), forwardassociation with the base (p = .78), backward associationwith the base (p = .47), and co-occurrence as indexed byboth Latent Semantic Analysis (LSA; Landauer & Dumais,2002; p = .60) and Google hits (p = .53). Thus, any differ-ence in ratings of the taxonomic and thematic alternativescannot be attributed to the lexical factors of frequency,association, or co-occurrence. To disguise the nature ofthe task, each base was also paired with an unrelated filleritem. Items were organized into three blocked lists tocounterbalance the order in which participants encoun-tered the three alternatives to each base concept.
Participants were randomly assigned to one experimen-tal list that included all 90 concept pairs (60 experimentaland 30 filler). Each trial consisted of a base concept pairedwith a taxonomic match, thematic match, or unrelated fil-ler, centrally presented on a computer display. Participantswere instructed to rate the similarity, on a scale from 1(not at all similar) to 7 (very similar) of the concept pairs.Responses were entered on the keyboard number pad.Items appeared in a pseudo-random order with the restric-tion that base concepts appeared only once in each third ofa list, and with the order of taxonomic, thematic, andunrelated matches for each base counterbalanced acrosslists.

Table 4Stimulus characteristics, Experiment 3
Alternative Association Co-occurrence
Word Frequency Forward Backward LSA Google
M SE M SE M SE M SE M SE
Taxonomic 23.8 6.6 0.15 0.04 0.10 0.04 0.39 0.03 9.25 4.26Thematic 29.5 6.6 0.16 0.04 0.14 0.03 0.36 0.04 6.35 2.25
Note: ‘‘Word Frequency” = written frequency in the Kucera–Francis norms; ‘‘Forward Association” = probability of producing the base given the alternative,from the Nelson et al. (1998) norms; ‘‘Backward Association” = probability of producing the alternative given the base, from the Nelson et al. (1998) norms;‘‘LSA” = cosine values from the ‘‘General reading up to 1st year college” online corpus; ‘‘Google” = number of hits (in millions) obtained in a search of‘‘[alternative] [base]” on google.com, data retrieved on 9/21/2007. The taxonomic and thematic alternatives did not differ significantly in any of thesemeasures.
Table 5Stimuli, Experiment 3
Base Taxonomic Thematic
Bee Butterfly HoneyBird Robin NestCake Cookie BirthdayCarrot Celery RabbitCow Pig RanchCrown Hat QueenDog Cat BoneDungeon Basement TortureDust Soot BroomFlower Plant VaseFur Hair CoatJar Bottle JellyKnight Soldier ArmorLamp Flashlight DeskMonkey Primate BananaMovie Documentary ProducerNeedle Pin ThimbleNet Rope FishOyster Clam PearlPastry Tart BakerPrison Jail CriminalRiver Lake BoatRobe Cloak BathSapphire Emerald RingSheep Goat WoolShip Yacht SailorShirt Jacket TieSmoke Smog FireSquirrel Rat NutTent Hut Camp
S. Simmons, Z. Estes / Cognition 108 (2008) 781–795 791
After the rating task participants completed the shortform of the Need for cognition scale (Cacioppo, Petty, &Kao, 1984). Participants rated the extent of their agree-ment, on a scale from 1 (very strongly disagree) to 9 (verystrongly agree), with 18 statements such as ‘‘I would prefercomplex to simple problems” and ‘‘I find satisfaction indeliberating hard and for long hours”. Nine items (e.g.,‘‘Thinking is not my idea of fun”.) were negatively worded.
Finally, participants indicated their degree of agree-ment, on a scale from 1 (very strongly disagree) to 9 (verystrongly agree) with the following statements, which werepresented in random order:
Two things are similar if they have the same features.Two things are similar if they belong in the samecategory.
Two things are similar if they occur in the samescenario.
6.2. Results
To test for an effect of list we conducted a 3 (list) by 3(item type) ANOVA on similarity ratings with participantsrandom. Because neither the main effect of list[F(2,32) = 1.79, p = .18] nor the list by item type interaction[F(4,64) = .99, p = .42] was significant, we collapsed acrosslists for the remaining analyses.
6.2.1. AgreementNext, we calculated thematic preference based on the
proportion of trials on which a participant assigned a high-er rating to a thematic match with a base than to a taxo-nomic match with that same base. For example, aparticipant’s rating for dungeon/torture was compared tohis rating for dungeon/basement. A thematic response wasrecorded if the rating was higher for the thematic pair. Ataxonomic response was recorded if the rating was higherfor the taxonomic pair. Instances where a participant as-signed the same rating to both pairs were excluded fromanalysis. Finally, we divided each participant’s total the-matic responses by the sum of thematic and taxonomic re-sponses. This measure of thematic proportion rangedacross participants from .00 to .91 (M = .43, SE = .05), indi-cating that substantial thematic responding was observedin the similarity ratings task, just as it was in the triadchoice task of the preceding experiments. Importantly,the prevalence of thematic responding generalizes acrosstasks.
Participants were subsequently assigned to responsegroups on the basis of binomial probability. Because thenumber of relevant trials varied across participants(depending on how many taxonomic and thematic pairselicited the same rating), binomial probability was assessedseparately for each participant. As in the previous experi-ments, between-participant disagreement in thematicpreference was evident (see Table 1): 40% of participantswere taxonomic and 23% were thematic. Thirty-seven per-cent of participants fell into the mixed response group.Thus, individual differences in thematic responding wereobtained even when word frequency, association strength,and co-occurrence frequency were controlled. To illustrate

Table 6Inter-correlations (r) between thematic preference, NFC, and follow-upquestions, Experiment 3
Thematicpreference
Categoryrelevance
Featurerelevance
Scenariorelevance
Category relevance .17Feature relevance .19 .74a
Scenario relevance .32b .42a .32NFC �.30b .14 .11 .12
a p < .05.b p < .08. df = 35.
792 S. Simmons, Z. Estes / Cognition 108 (2008) 781–795
the discrepant ratings of these participant groups, Fig. 7shows the mean similarity ratings of taxonomic and the-matic pairs by the taxonomic, mixed, and thematic partici-pants. As evident in the figure, taxonomic participants ratedthe base concepts more similar to their taxonomic matchthan to their thematic match [t(11) = 5.65, p < .01], whereasthematic participants rated the thematic matches moresimilar than the taxonomic matches [t(7) = �16.08,p < .01]. The mixed participants rated the taxonomic andthematic pairs equally (p = .14). This pattern of mean simi-larity ratings validates the separation of participants intothese three groups. It also highlights just how differentthe taxonomic and the thematic participants are in theirperceptions of similarity.
6.2.2. Need for cognitionNFC scores were based on participants’ average rating
on the questionnaire, with negatively worded items re-verse-scored. Therefore, scores could theoretically rangefrom 1 to 9, with 1 representing low NFC and 9 represent-ing high NFC. Participants exhibited a range of scores(2.72–7.28) with a mean slightly above the mid-point(M = 5.23, SE = .19).
6.2.3. Beliefs about similarityScores on the follow-up questions could range from 1 to
9, with 1 indicating low agreement and 9 indicating highagreement. Participants exhibited a range of beliefs con-cerning the relevance of category co-membership (2–9),feature overlap (2–9), and scenario co-occurrence (1–9)to similarity. Category co-membership (M = 7.06, SE = .24)and feature overlap (M = 6.91, SE = .31) were perceived tobe equally important to similarity (p = .49). However, sce-nario co-occurrence (M = 4.91, SE = .41) was perceived tobe somewhat less important than either category co-mem-bership [t(34) = 5.70, p < .001] or feature overlap [t(34) =4.74, p < .001]. Inter-correlations between these measuresare reported in Table 6. Category co-membership was sig-nificantly positively correlated with feature overlap. Partic-ipants who thought that membership in the same categorywas important to similarity also thought that featureoverlap was important. Category co-membership was alsopositively related to scenario co-occurrence. Participants’follow-up question ratings were then correlated with theirNFC scores (see Table 6). NFC was not associated with
4.93 5.03 5.11
3.04
5.186.14
1
2
3
4
5
6
7
TaxonomicParticipants
MixedParticipants
ThematicParticipants
Sim
ilarit
y
Taxonomic Thematic
Fig. 7. Mean similarity ratings as a function of response group and itemtype, Experiment 3.
participants’ beliefs about the importance of sharing fea-tures, belonging to the same category, or participating inthe same scenario to similarity (all p > .40). The lack ofassociation between NFC and scenario relevance was ofinterest. Evidently, participants who are low in NFC areno more likely than participants high in NFC to believe thatscenario co-occurrence is relevant to similarity. Thus, iflow NFC participants are indeed more likely to exhibit the-matic responding, it would not be attributable to a beliefthat scenario co-occurrence is relevant to similarity.
6.2.4. Predicting ratingsWe initially tested whether participants’ NFC, category
relevance, feature relevance, and scenario relevance werecorrelated with their thematic proportion. As shown in Ta-ble 6, NFC and scenario relevance were both marginallyassociated with thematic preference (p = .08 and p = .06,respectively). We therefore ran a regression analysis withthese two factors as predictors of thematic proportion.The overall model fit was significant [F(2,32) = 4.58,p < .05; R2 = .22], with both NFC [b = �.35, p < .05] and sce-nario relevance [b = .36, p < .05] significantly predictingthematic proportion. Participants who reported a low needfor cognition were more likely to rate thematic matchesmore similar than taxonomic matches. This finding sup-ports the hypothesis that thematic responding may not re-quire as much ‘‘deep” processing as taxonomic responding.However, those participants who exhibited greater the-matic responding were also more likely to endorse sce-nario co-occurrence as a legitimate source of similarity.This latter finding suggests that some participants do be-lieve that similarity should include thematic relations,and their ratings were consistent with this belief.
6.3. Discussion
Experiment 3 provides strong evidence for between-participant disagreement in the use of thematic relationsin similarity judgments and demonstrates an effect of the-matic relations using a novel, well-controlled item set.Therefore, the previous results cannot be attributed to lex-ical factors (i.e., word frequency, association strength, orco-occurrence) or to the use of a biasing task. Notably,there was considerable agreement among participantsconcerning the similarity of taxonomic items (Fig. 7). Allthree participant types gave roughly equal ratings to taxo-

S. Simmons, Z. Estes / Cognition 108 (2008) 781–795 793
nomic items. Thus, thematic preference in the triad taskdoes not appear to indicate a rejection of taxonomic simi-larity. Rather, it indicates the importance of thematic rela-tions relative to a taxonomic standard. For instance, amongtaxonomic participants, thematic relations are relativelyless important than taxonomic relations, while among the-matic participants, thematic relations are relatively moreimportant than taxonomic relations.
The weighting of thematic relations in similarity judg-ments reflected differences in NFC. Participants who exhib-ited a strong thematic preference tended to enjoy thinkingand problem-solving less than participants who exhibiteda weak thematic preference. The weighting of thematicrelations was also associated with an overt belief that par-ticipation in a common scenario is a legitimate source ofsimilarity. Participants with a strong thematic preferencetended to rate thematic relations as more relevant to sim-ilarity than participants with a weak thematic preference.Interestingly, the observation that NFC and scenario co-occurrence themselves were uncorrelated suggests thatthere may be two types of the thematic participants –those who believe that thematic integration should be acomponent of similarity, and those who simply do not pro-cess the stimuli very deeply.
7. General discussion
The preceding experiments have yielded three impor-tant results. First, these experiments revealed considerableindividual differences in the perception of similarity anddifference. Participants tended to choose the same typeof stimulus across trials for a given judgment. In similarityjudgments, for instance, some participants reliably chosethe thematic match, while other participants reliably chosethe taxonomic match. Few participants were agnostic inthe choice between thematic and taxonomic stimuli. Thesurprising prevalence of thematic responding was equallyevident whether judging which alternative is more ‘‘simi-lar to” the base (Experiment 1a) or which is more ‘‘like”the base (Experiment 1b). In fact, participants continuedto exhibit thematic similarity choices even when thosejudgments were directly contrasted with difference judg-ments of the same stimuli (Experiment 2a), though thisthematic tendency was reduced when similarity and dif-ference were judged on consecutive trials (Experiment2b). Moreover, consistent thematic responding was evi-dent not only in a triad choice task, but also in a similarityrating task (Experiment 3). Finally, participants’ thematictendencies were predicted by both their need for cognitionand their beliefs about similarity. Specifically, participantswith a high need for cognition were less likely to exhibitthematic responding, whereas participants who believethat scenario co-occurrence is a legitimate source of simi-larity were more likely to exhibit thematic responding.Although preliminary evidence supported the hypothesisof substantial individual variability in perceived similarity(Gentner & Brem, 1999; Simmons & Estes, submitted forpublication), these experiments provide the first demon-stration of how robust this individual variability is, andhow it relates to perceived difference.
The second important observation of these experimentsis that thematic responding is not simply a by-product oflexical factors. Previous demonstrations of a thematic ef-fect on similarity (Bassok & Medin, 1997; Estes, 2003;Jones & Love, 2007; Simmons & Estes, submitted for publi-cation; Wisniewski & Bassok, 1999) have not matched tax-onomic and thematic items for potential confounds such asword frequency, association strength, and co-occurrencefrequency. This is particularly problematic since manycommon thematically related concepts are also highlyassociated (e.g., milk/cow). However, a substantial numberof participants in Experiment 3 rated thematic items asmore similar than taxonomic items, even though thesewere matched for frequency, association, and co-occur-rence. Thus, the thematic effect on similarity is not attrib-utable to these lexical factors.
The third contribution of these experiments is to showthat thematic relations may induce a non-inversion of sim-ilarity and difference. Experiment 1a corroborated the the-matic non-inversion reported by Simmons and Estes(submitted for publication), and Experiment 2a providedthe first within-participant demonstration of this non-inversion. Moreover, when participants’ similarity and dif-ference choices were non-inverse, it was most often thethematic option that was chosen as both more similar toand more different from the base. Notably, however, thenon-inversion was eliminated entirely when participantsjudged both the similarity and the difference of the sameitems on consecutive trials (Experiment 2b). Thus, non-inversion is more than a group level phenomenon, but itis sensitive to the influence of participants’ beliefs concern-ing similarity and difference. Below we discuss the theo-retical and practical implications of these results.
These results clearly support a dual process model ofperceived similarity. Single process models such as thecontrast model (Tversky, 1977) and the structural align-ment model (e.g., Gentner & Markman, 1997) cannot ex-plain the present results. If similarity was the result ofcomparison only, then participants should have chosenthe taxonomic option consistently across trials, becausetaxonomically related stimuli are more easily aligned andhave more commonalities than do taxonomically unrelatedstimuli (Markman & Gentner, 1993a). So given the reliableand systematic occurrence of thematic choices, these re-sults undermine comparison-only models of similarity.Simply stated, a model of similarity that does not accountexplicitly for thematic integration cannot explain partici-pants’ similarity choices.
These findings also indicate that the current, general-ized version of the dual process model (Bassok & Medin,1997; Estes, 2003; Wisniewski & Bassok, 1999) must be ex-tended to describe accurately the influence of thematicintegration on the perception of similarity. Understandingthe systematic variability in thematic preference observedin the present experiments necessitates an individualizedapproach. In this model the weights assigned to thecomparison and integration processes vary dramaticallyacross individuals, but are consistent within an individual.Some participants weight comparison more than integra-tion (e.g., taxonomic participants), while others show thereverse pattern (e.g., thematic participants). And, some

794 S. Simmons, Z. Estes / Cognition 108 (2008) 781–795
participants assign the processes roughly equal weight(e.g., mixed participants). Thus, the tendency to compareor integrate is constrained not only by stimulus and taskfactors, as originally proposed by Wisniewski and Bassok(1999), but also by an individual’s preference for a givenprocess. In particular, the results of Experiment 3 suggestthat a preference for thematic integration in similarityjudgments may arise from two independent sources. Assuggested by Gentner and Brem (1999), some thematicrespondents simply do not process the stimuli very deeply.For these participants, thematic integration may be con-fused with feature comparison. However, other thematicrespondents are relatively more thoughtful, and they be-lieve that thematic relations are important for similarity.These participants appear to respond thematically as amatter of deliberate choice.
Note that an individualized dual process model can alsoaccommodate individual differences in categorization. Re-call that some participants tend to form thematic catego-ries, while others prefer to categorize taxonomically (Lin& Murphy, 2001; Murphy, 2001). Participants who putmore weight on thematic relations in similarity judgmentsmay go on to categorize thematically, and likewise partic-ipants who base their similarity judgments on attributesmay tend to form taxonomic categories. That is, individualdifferences in the perception of similarity may explain thedifferences in categorization found by Murphy (2001; Linand Murphy, 2001).
Like perceived similarity, perceived difference alsonecessitates an individualized dual process model. Someparticipants consistently chose the thematic alternativeas more different from the base, whereas other partici-pants consistently chose the taxonomic alternative. De-spite the comparable pattern of results for similarity anddifference choices, however, it is not sufficient to modeldifference as the opposite of similarity. As illustrated bythe occurrence of non-inversion, perceived similarity andperceived difference diverge in the weighting of the the-matic integration process. Specifically, the influence of the-matic integration was attenuated in the perception ofdifference. This result corroborates Simmons and Estes(submitted for publication), who found that thematic rela-tions account for less variance in difference judgmentsthan in similarity judgments.
Thus, it appears that different types of information arerelevant to similarity and difference. Our results suggestthat non-inversion is tied to the performance of partici-pants who prefer thematic relations in similarity, sincethese participants tend to answer less consistently thanthose who prefer comparison. However, this explanationshould be interpreted with caution. As seen in Experiment2b, non-inversion depends on the contiguity between sim-ilarity and difference judgments. Presenting similarity anddifference consecutively eliminates non-inversion, pre-sumably because participants believe that these judgmentsshould be complementary.
The individual differences observed in the presentexperiments, although substantial, do not necessarily re-flect large variability in conceptual knowledge; partici-pants who categorize thematically are aware of the logicbehind taxonomic categorization, and vice versa (Smiley
& Brown, 1979). Likewise, participants in similarity tasksof the sort reported here likely are aware of both thematicand taxonomic information. This presumed knowledge ofboth thematic and taxonomic information opens the possi-bility that individuals may respond inconsistently acrosstime. That is, if an individual holds both sources of infor-mation, there is some probability that he may weight the-matic information more heavily on one occasion than onanother. Indeed, such within-participant inconsistencyhas been observed in categorization (Barsalou, 1989),although not in terms of a taxonomic versus thematic pref-erence. However, two results argue against dramaticinconsistency in similarity judgments. First, Experiment 3demonstrated that the precise weights that individuals as-sign to the outputs of comparison and integration reflectdifferences in NFC; thematic participants are less likelythan their taxonomic counterparts to enjoy thinking andproblem-solving. Because NFC is stable over time, thematicresponding should also remain relatively stable over time.Furthermore, thematic and taxonomic participants appearto weight comparison and integration differently becausethey hold different beliefs about what information is rele-vant to similarity. Participants who believe that participa-tion in the same scenario is important to similarity tend toexhibit a strong thematic preference. Intuitively, it seemsunlikely that participants’ beliefs about similarity willchange substantially across time, and hence their similar-ity judgments should also remain stable across time. How-ever, more direct investigation of within-participantsconsistency in similarity judgments may be a fruitful direc-tion for further development of the individualized dualprocess model.
References
Barsalou, L. W. (1982). Context-independent and context-dependentinformation in concepts. Memory & Cognition, 10, 82–93.
Barsalou, L. W. (1989). Intraconcept similarity and its implications forinterconcept similarity. In A. Ortony & S. Vosniadou (Eds.), Similarityand analogical reasoning (pp. 76–121). Cambridge: CambridgeUniversity Press.
Bassok, M., & Medin, D. L. (1997). Birds of a feather flock together:Similarity judgments with semantically rich stimuli. Journal ofMemory and Language, 36, 311–336.
Beck, J. (1966). Effect of orientation and of shape similarity on perceptualgrouping. Perception & Psychophysics, 1, 300–302.
Cacioppo, J. T., & Petty, R. E. (1982). The need for cognition. Journal ofPersonality and Social Psychology, 42, 116–131.
Cacioppo, J. T., Petty, R. E., & Kao, C. F. (1984). The efficient assessment ofneed for cognition. Journal of Personality Assessment, 48, 306–307.
Estes, Z. (2003). A tale of two similarities: Comparison and integration inconceptual combination. Cognitive Science, 27, 911–921.
Estes, Z., & Hasson, U. (2004). The importance of being nonalignable: Acritical test of the structural alignment theory of similarity. Journal ofExperimental Psychology: Learning, Memory, and Cognition, 30,1082–1092.
Gati, I., & Tversky, A. (1984). Weighting common and distinctive featuresin conceptual and perceptual judgments. Cognitive Psychology, 16,341–370.
Gentner, D., & Brem, S. K. (1999). Is snow really similar to a shovel?Distinguishing similarity from thematic relatedness. In Proceedings ofthe 21st annual conference of the Cognitive Science Society(pp. 179–184). Hillsdale, NJ: Lawrence Earlbaum Associates.
Gentner, D., & Gunn, V. (2001). Structural alignment facilitates thenoticing of differences. Memory & Cognition, 29, 565–577.
Gentner, D., & Markman, A. B. (1994). Structural alignment incomparison: No difference without similarity. Psychological Science,5, 152–158.

S. Simmons, Z. Estes / Cognition 108 (2008) 781–795 795
Gentner, D., & Markman, A. B. (1997). Structure mapping in analogy andsimilarity. American Psychologist, 52, 45–56.
Goldstone, R. L. (1994). The role of similarity in categorization: Providinga groundwork. Cognition, 52, 125–157.
Hampton, J. A., Estes, Z., & Simmons, S. (2007). Metamorphosis: Essence,appearance and behavior in the categorization of natural kinds.Memory & Cognition, 35, 1785–1800.
Jones, M., & Love, B. (2007). Beyond common features: The role of roles indetermining similarity. Cognitive Psychology, 55, 196–231.
Landauer, T. K., & Dumais, S. T. (2002). A solution to Plato’s problem:The latent semantic analysis theory of the acquisition, induction,and representation of knowledge. Psychological Review, 104,211–240.
Lassiter, G. D., Briggs, M. A., & Slaw, R. D. (1991). Need for cognition,causal processing, and memory for behavior. Personality and SocialPsychology Bulletin, 17, 694–699.
Levin, I. P., Huneke, M. E., & Jasper, J. D. (2000). Information processing atsuccessive stages of decision making: Need for cognition andinclusion–exclusion effects. Organizational Behavior and HumanDecision Processes, 82, 171–193.
Lin, E. L., & Murphy, G. L. (2001). Thematic relations in adults’ concepts.Journal of Experimental Psychology: General, 130, 3–28.
Markman, A. B., & Gentner, D. (1993a). Splitting the difference: Astructural alignment view of similarity. Journal of Memory andLanguage, 32, 517–535.
Markman, A. B., & Gentner, D. (1993b). Structural alignment duringsimilarity comparisons. Cognitive Psychology, 25, 431–467.
Markman, E. M., & Hutchinson, J. E. (1984). Children’s sensitivity toconstraints on word meaning: Taxonomic versus thematic relations.Cognitive Psychology, 16, 1–27.
Medin, D. L., Goldstone, R. L., & Gentner, D. (1990). Similarity involvingattributes and relations: Judgments of similarity and difference arenot inverses. Psychological Science, 1, 64–69.
Medin, D. L., Goldstone, R. L., & Gentner, D. (1993). Respects for similarity.Psychological Review, 100, 254–278.
Murphy, G. L. (2001). Causes of taxonomic sorting by adults: A test of thethematic-to-taxonomic shift. Psychonomic Bulletin & Review, 8,834–839.
Navarro, D., & Lee, M. (2004). Common and distinctive features instimulus similarity: A modified version of the contrast model.Psychonomic Bulletin & Review, 11, 961–974.
Nelson, D. L., McEvoy, C. L., & Schreiber, T. A. (1998). The University ofSouth Florida word association, rhyme, and word fragment norms.Available from: http://www.usf.edu/FreeAssociation.
Simmons, S. & Estes, Z. (submitted for publication). Dual processes ofcomparison and integration in similarity and difference.
Smiley, S. S., & Brown, A. L. (1979). Conceptual preference for thematic ortaxonomic relations: A nonmonotonic age trend from preschool to oldage. Journal of Experimental Child Psychology, 28, 249–257.
Tversky, A. (1977). Features of similarity. Psychological Review, 84,327–352.
Wisniewski, E. J., & Bassok, M. (1999). What makes a man similar to a tie?Stimulus compatibility with comparison and integration. CognitivePsychology, 39, 208–238.