indirect cost rate proposal and central service cost
TRANSCRIPT
INDIRECT COST RATE PROPOSAL
AND CENTRAL SERVICE
COST ALLOCATION PLAN
1333 NW Eastman Parkway
Gresham, OR 97030
For Use During
Fiscal Year
2019-20
Based on Fiscal
Year 2017-18
Audited
Expenditures
July 1, 2019
City of Gresham, Oregon
INDIRECT COST RATE PROPOSAL
AND
CENTRAL SERVICE
COST ALLOCATION PLAN
For Use During Fiscal Year 2019-20
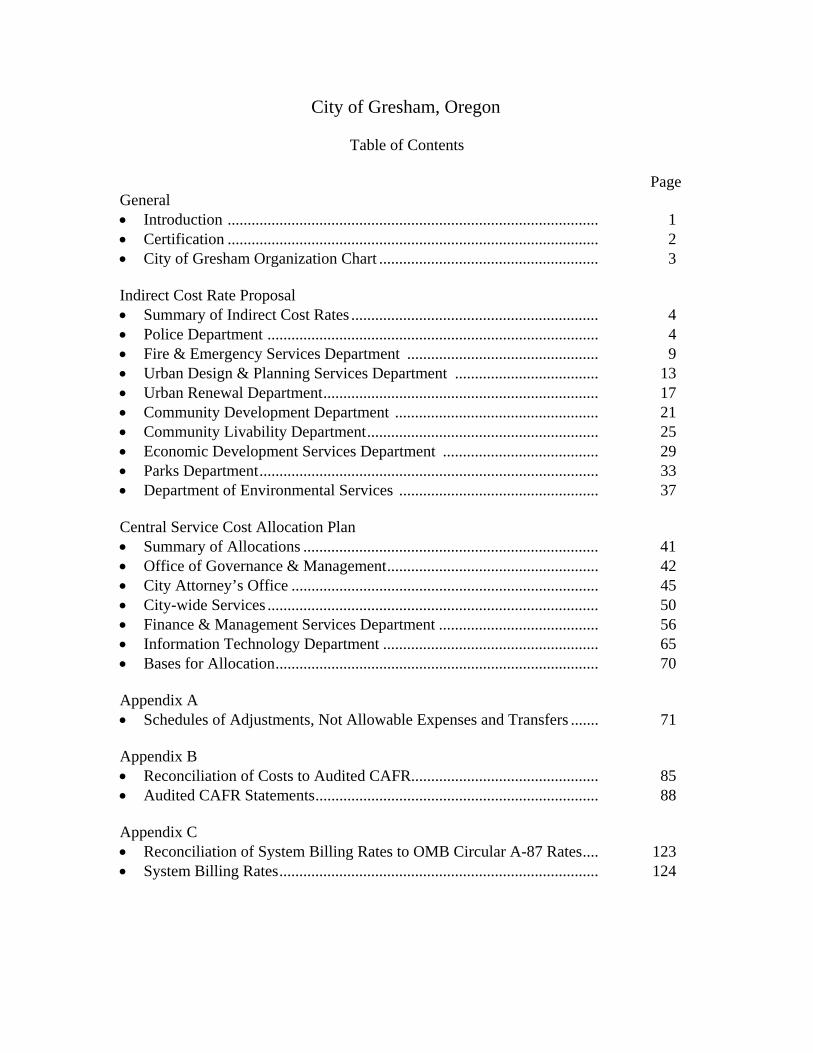
City of Gresham, Oregon
Table of Contents
Page General Introduction ............................................................................................. 1 Certification ............................................................................................. 2 City of Gresham Organization Chart ....................................................... 3 Indirect Cost Rate Proposal Summary of Indirect Cost Rates .............................................................. 4 Police Department ................................................................................... 4 Fire & Emergency Services Department ................................................ 9 Urban Design & Planning Services Department .................................... 13 Urban Renewal Department ..................................................................... 17 Community Development Department ................................................... 21 Community Livability Department .......................................................... 25 Economic Development Services Department ....................................... 29 Parks Department ..................................................................................... 33 Department of Environmental Services .................................................. 37 Central Service Cost Allocation Plan Summary of Allocations .......................................................................... 41 Office of Governance & Management ..................................................... 42 City Attorney’s Office ............................................................................. 45 City-wide Services ................................................................................... 50 Finance & Management Services Department ........................................ 56 Information Technology Department ...................................................... 65 Bases for Allocation ................................................................................. 70 Appendix A Schedules of Adjustments, Not Allowable Expenses and Transfers ....... 71 Appendix B Reconciliation of Costs to Audited CAFR............................................... 85 Audited CAFR Statements ....................................................................... 88 Appendix C Reconciliation of System Billing Rates to OMB Circular A-87 Rates .... 123 System Billing Rates ................................................................................ 124

GENERAL
City of Gresham, Oregon
INDIRECT COST RATE PROPOSAL
AND CENTRAL SERVICE
COST ALLOCATION PLAN
INTRODUCTION This plan summarizes the City of Gresham, Oregon’s indirect cost rates as determined by following the cost principles defined in 2 CFR 200 Subpart E, “Cost Principles”. The City has determined a rate for each of its operating departments by calculating the indirect costs within each department and adding indirect costs allocated from central service departments that provide citywide support. The report is comprised of three main sections and three appendices that support determination of the rates. The General section of the plan includes this introduction, certification of the cost determinations made in the plan, and the City’s organization chart, which shows all operations of the City including central service activities. The Indirect Cost Rate Proposal section of the plan provides a summary of indirect cost rates for each operating department to be used for billings of Federal grants as authorized by 2 CFR 200 Subpart E, “Cost Principles” and the Federal awards to which the rates apply. Following the summary is a breakdown of total costs for each operating department with elimination of costs that are not allowable, excluded costs and costs between funds arising from the City’s internal billing function. For each department, total costs after adjustments are identified as indirect or direct, central service allocated costs are added to the indirect costs and the sum is divided by direct costs to determine the indirect cost rate. The Central Service Cost Allocation Plan section provides a summary of allocations of central services to all departments and the reallocation of central service costs from other central service departments to the operating departments. Following the summary are detailed schedules showing the methodologies and allocation bases used and the resulting allocations by each central service department. Additional schedules supporting the proposal include detail of the adjustments to operating and central service departments required by 2 CFR 200 Subpart E, “Cost Principles”, a reconciliation of the costs used in the proposal to the City’s audited Comprehensive Annual Financial Report (CAFR) and a reconciliation showing that rates used in the City’s financial costing system equate to 2 CFR 200 Subpart E methodology rates. These schedules are provided in Appendices A, B and C respectively.
1
2
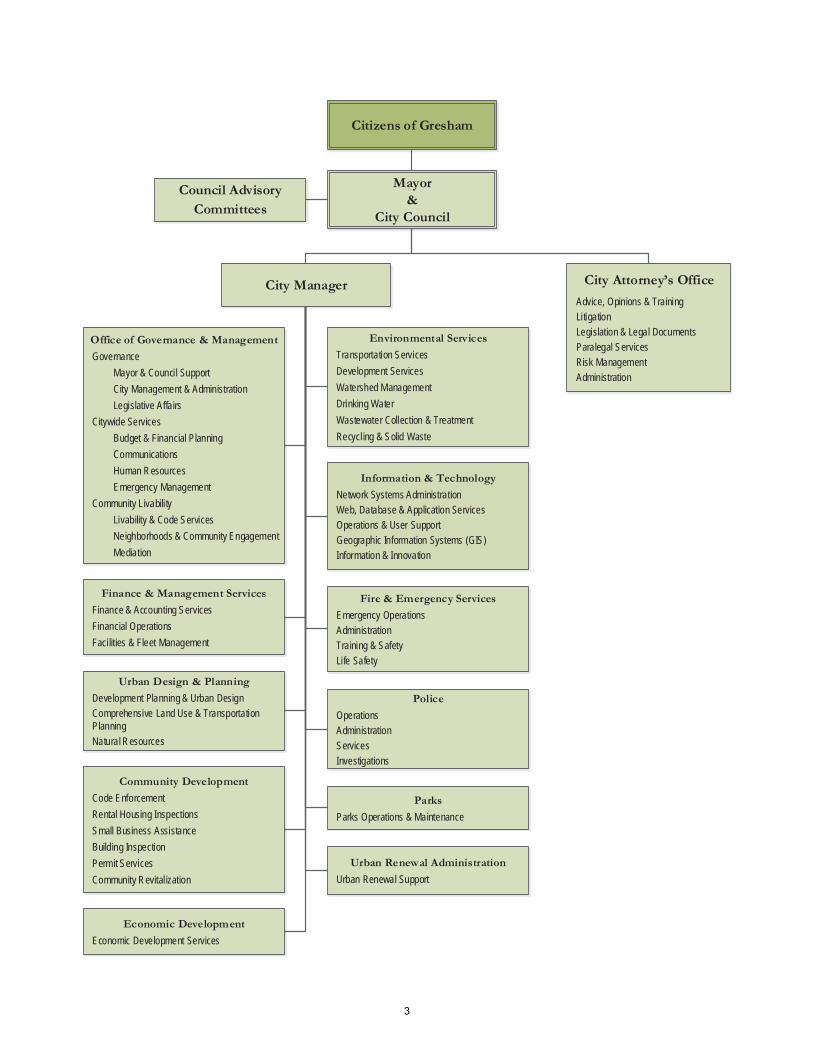
Citizens of Gresham
Mayor&
City Council
City Attorney’s Office
Advice, Opinions & TrainingLitigationLegislation & Legal DocumentsParalegal ServicesRisk ManagementAdministration
City Manager
Office of Governance & Management
GovernanceMayor & Council SupportCity Management & AdministrationLegislative Affairs
Citywide ServicesBudget & Financial PlanningCommunicationsHuman ResourcesEmergency Management
Community Livabili tyLivability & Code ServicesNeighborhoods & Community EngagementMediation
Finance & Management Services
Finance & Accounting ServicesFinancial OperationsFacilities & Fleet Management
Urban Design & Planning
Development Planning & Urban DesignComprehensive Land Use & Transportation PlanningNatural Resources
Environmental Services
Transportation ServicesDevelopment ServicesWatershed ManagementDrinking WaterWastewater Collection & TreatmentRecycling & Solid Waste
Information & Technology
Network Systems AdministrationWeb, Database & Application ServicesOperations & User SupportGeographic Information Systems (GIS)Information & Innovation
Economic Development
Economic Development Services
Urban Renewal Administration
Urban Renewal Support
Fire & Emergency Services
Emergency OperationsAdministrationTraining & SafetyLife Safety
Police
OperationsAdministrationServicesInvestigations
Community Development
Code EnforcementRental Housing InspectionsSmall Business AssistanceBuilding InspectionPermit ServicesCommunity Revitalization
Council Advisory Committees
Parks
Parks Operations & Maintenance
3
INDIRECT COST RATE PROPOSAL
Indirect Cost Indirect Direct
Operating Department Rate Costs Costs
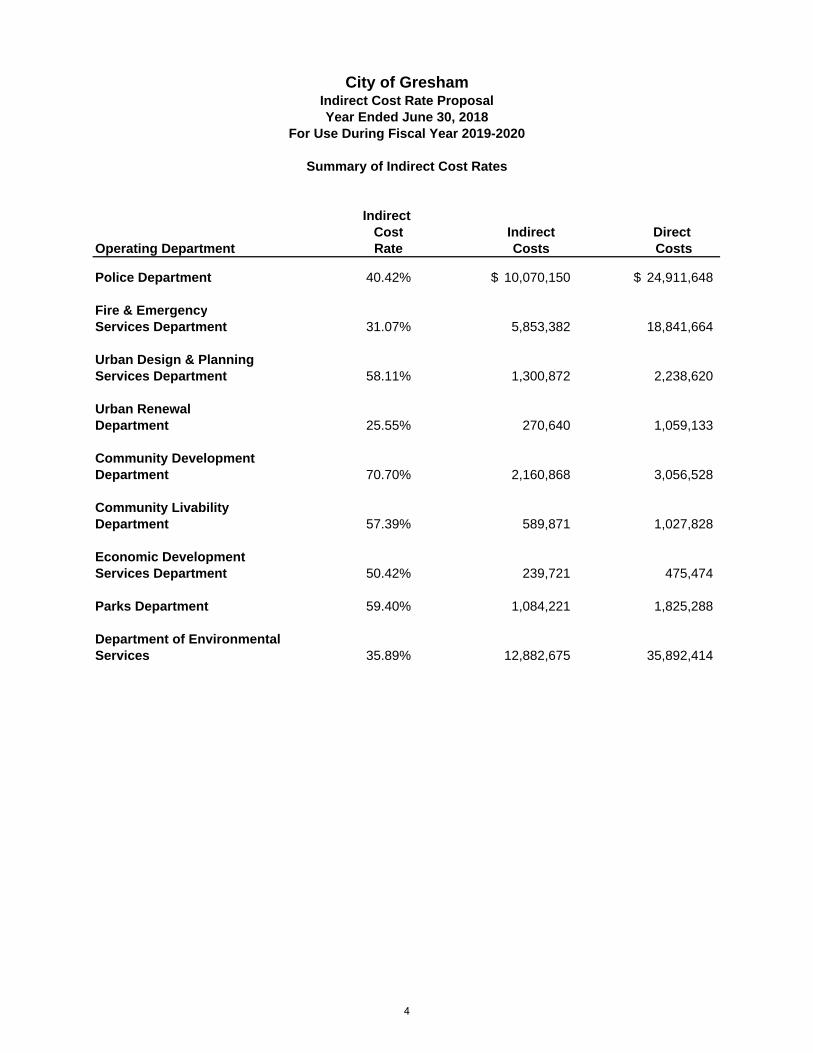
Police Department 40.42% 10,070,150$ 24,911,648$
Fire & EmergencyServices Department 31.07% 5,853,382 18,841,664
Urban Design & PlanningServices Department 58.11% 1,300,872 2,238,620
Urban RenewalDepartment 25.55% 270,640 1,059,133
Community DevelopmentDepartment 70.70% 2,160,868 3,056,528
Community LivabilityDepartment 57.39% 589,871 1,027,828
Economic DevelopmentServices Department 50.42% 239,721 475,474
Parks Department 59.40% 1,084,221 1,825,288
Department of EnvironmentalServices 35.89% 12,882,675 35,892,414
City of GreshamIndirect Cost Rate ProposalYear Ended June 30, 2018
Summary of Indirect Cost Rates
For Use During Fiscal Year 2019-2020
4
Police Department
MISSION STATEMENT Provide police services that involve the community in problem solving aimed at enhancing public safety and the quality of life, and which respect the Constitutional rights of all citizens. GENERAL DESCRIPTION Services provided by the Police Department primarily falls into two priorities - enforcement and investigation, followed by proactively addressing neighborhood livability issues through 21st Century Policing. Programs that enable the department to address these priorities are Administration, Operations, Investigations, and Services. DIVISIONS WITHIN THE DEPARTMENT • Administration • Operations • Investigations • Services
5
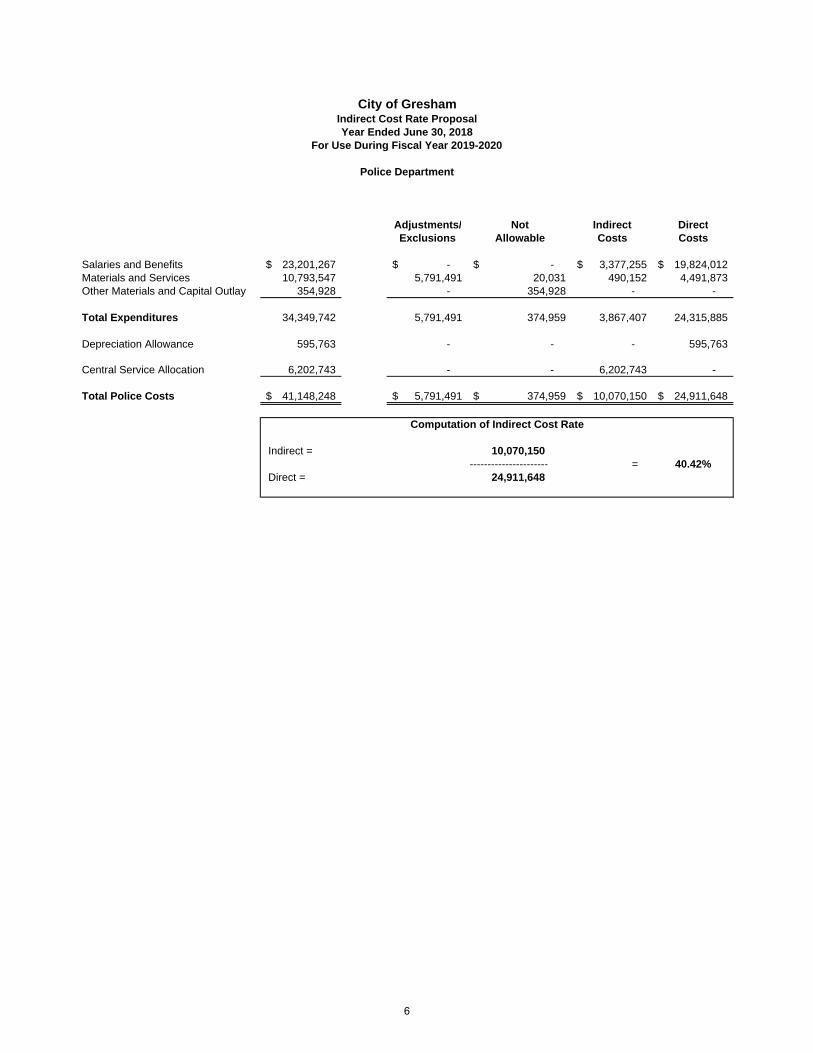
Adjustments/ Not Indirect DirectExclusions Allowable Costs Costs
Salaries and Benefits 23,201,267$ -$ -$ 3,377,255$ 19,824,012$ Materials and Services 10,793,547 5,791,491 20,031 490,152 4,491,873 Other Materials and Capital Outlay 354,928 - 354,928 - -
Total Expenditures 34,349,742 5,791,491 374,959 3,867,407 24,315,885
Depreciation Allowance 595,763 - - - 595,763
Central Service Allocation 6,202,743 - - 6,202,743 -
Total Police Costs 41,148,248$ 5,791,491$ 374,959$ 10,070,150$ 24,911,648$
Indirect = 10,070,150---------------------- = 40.42%
Direct = 24,911,648
Computation of Indirect Cost Rate
City of GreshamIndirect Cost Rate ProposalYear Ended June 30, 2018
Police Department
For Use During Fiscal Year 2019-2020
6
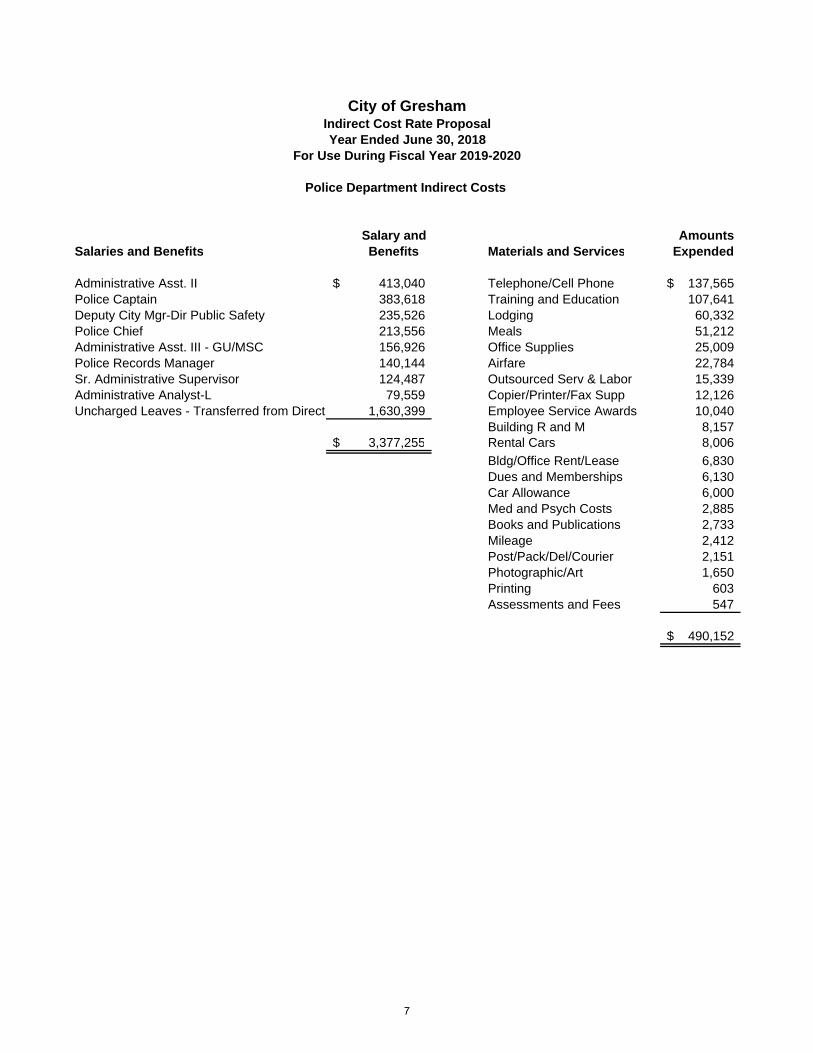
Salary and AmountsSalaries and Benefits Benefits Materials and Services Expended
Administrative Asst. II 413,040$ Telephone/Cell Phone 137,565$ Police Captain 383,618 Training and Education 107,641 Deputy City Mgr-Dir Public Safety 235,526 Lodging 60,332 Police Chief 213,556 Meals 51,212 Administrative Asst. III - GU/MSC 156,926 Office Supplies 25,009 Police Records Manager 140,144 Airfare 22,784 Sr. Administrative Supervisor 124,487 Outsourced Serv & Labor 15,339 Administrative Analyst-L 79,559 Copier/Printer/Fax Supp 12,126 Uncharged Leaves - Transferred from Direct 1,630,399 Employee Service Awards 10,040
Building R and M 8,157 3,377,255$ Rental Cars 8,006
Bldg/Office Rent/Lease 6,830 Dues and Memberships 6,130 Car Allowance 6,000 Med and Psych Costs 2,885 Books and Publications 2,733 Mileage 2,412 Post/Pack/Del/Courier 2,151 Photographic/Art 1,650 Printing 603 Assessments and Fees 547
490,152$
City of GreshamIndirect Cost Rate ProposalYear Ended June 30, 2018
Police Department Indirect Costs
For Use During Fiscal Year 2019-2020
7
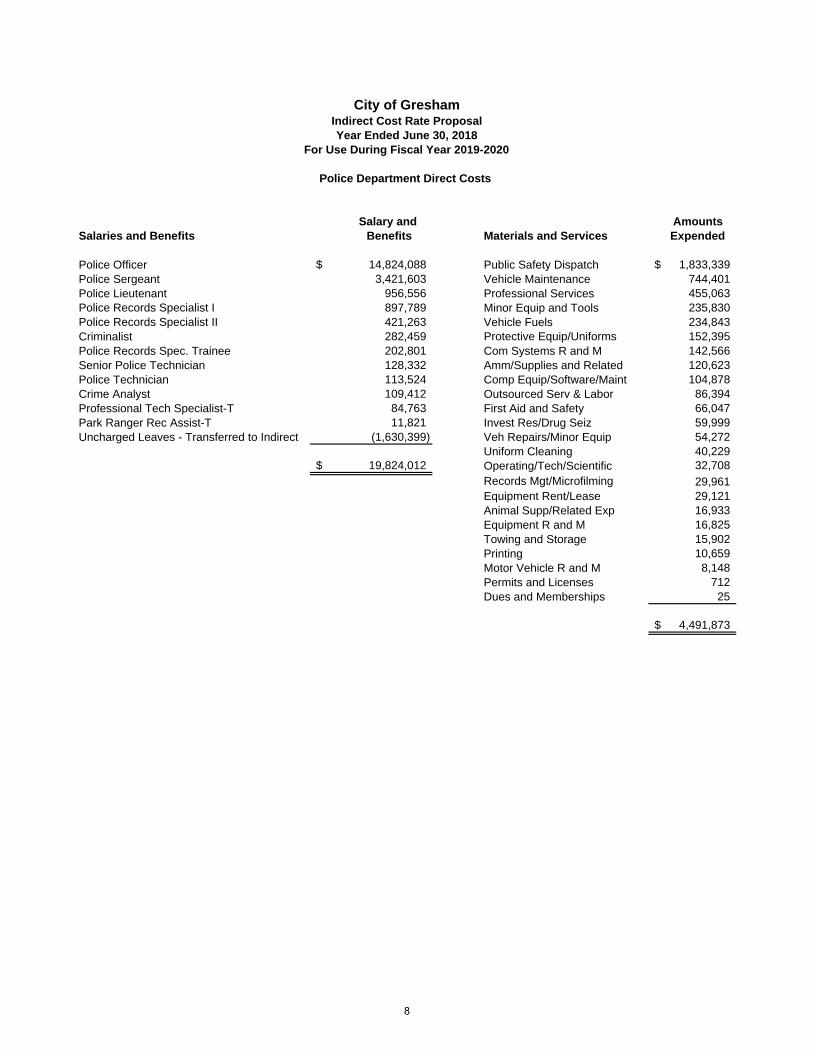
Salary and AmountsSalaries and Benefits Benefits Materials and Services Expended
Police Officer 14,824,088$ Public Safety Dispatch 1,833,339$ Police Sergeant 3,421,603 Vehicle Maintenance 744,401 Police Lieutenant 956,556 Professional Services 455,063 Police Records Specialist I 897,789 Minor Equip and Tools 235,830 Police Records Specialist II 421,263 Vehicle Fuels 234,843 Criminalist 282,459 Protective Equip/Uniforms 152,395 Police Records Spec. Trainee 202,801 Com Systems R and M 142,566 Senior Police Technician 128,332 Amm/Supplies and Related 120,623 Police Technician 113,524 Comp Equip/Software/Maint 104,878 Crime Analyst 109,412 Outsourced Serv & Labor 86,394 Professional Tech Specialist-T 84,763 First Aid and Safety 66,047 Park Ranger Rec Assist-T 11,821 Invest Res/Drug Seiz 59,999 Uncharged Leaves - Transferred to Indirect (1,630,399) Veh Repairs/Minor Equip 54,272
Uniform Cleaning 40,229 19,824,012$ Operating/Tech/Scientific 32,708
Records Mgt/Microfilming 29,961 Equipment Rent/Lease 29,121 Animal Supp/Related Exp 16,933 Equipment R and M 16,825 Towing and Storage 15,902 Printing 10,659 Motor Vehicle R and M 8,148 Permits and Licenses 712 Dues and Memberships 25
4,491,873$
City of GreshamIndirect Cost Rate ProposalYear Ended June 30, 2018
Police Department Direct Costs
For Use During Fiscal Year 2019-2020
8
Fire & Emergency Services Department MISSION STATEMENT The mission of the Gresham Fire and Emergency Services is to protect lives, property, and the environment. GENERAL DESCRIPTION The Fire & Emergency Services (FES) Department provides fire prevention, fire suppression, and emergency medical services to the cities of Gresham, Fairview, Wood Village, Troutdale and the area encompassed by Fire District 10. The service area covers sixty square miles, serving approximately 140,000 citizens. Fire and Emergency Services operates six fire stations within its service area and provides staffing for one of the three shifts at Portland Fire Station 31, a joint operation with Portland Fire and Rescue. Each engine company provides Advanced Life Support and has a trained firefighter/paramedic assigned to the crew. In addition, FES provides the following specialty rescue and response services: • Technical Rescue Team (including confined space for industrial users and high-angle rope
rescue) • Water Rescue • Regional Hazardous Materials Team to respond to chemical spills and biological incidents at
fixed sites, such as manufacturing facilities, and transportation accidents, including interstate and rail.
• Urban Search and Rescue (USAR) for structural collapse as a component of a regional response team.
• Chemical, Biological, Radiological, Nuclear, and Explosive (CBRNE) response including Mass Casualty.
DIVISIONS WITHIN THE DEPARTMENT • Administration • Emergency Operations • Life Safety • Training & Safety
9
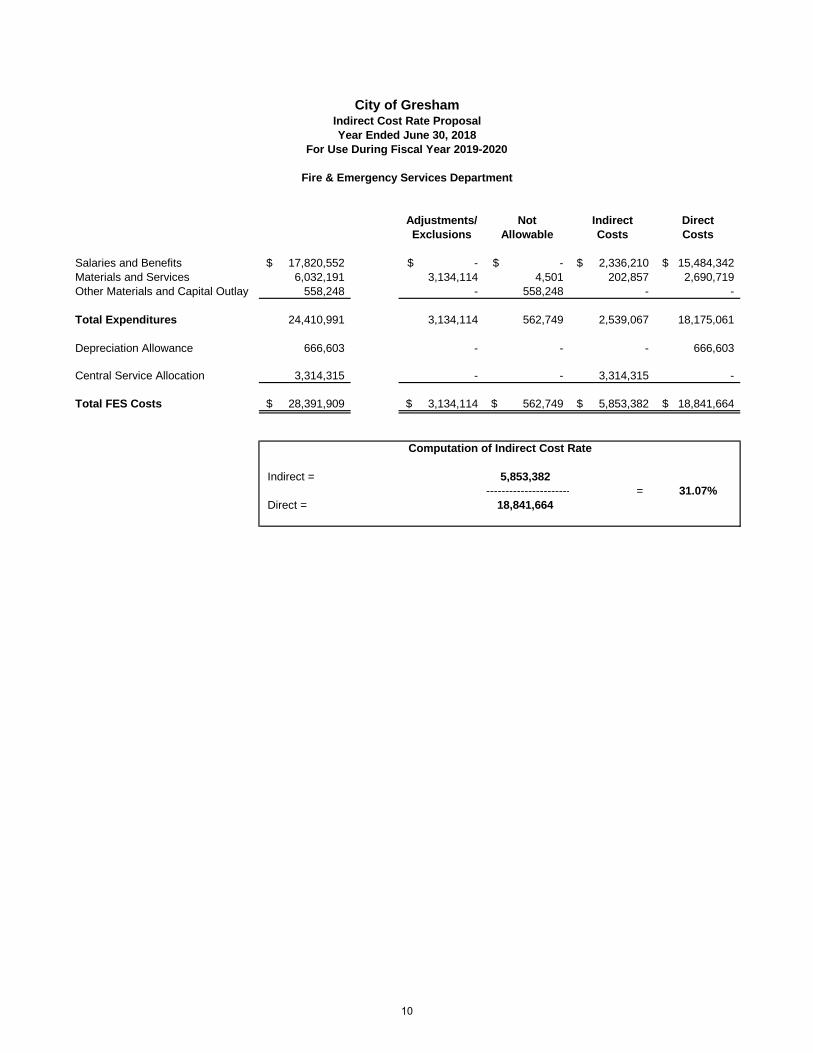
Adjustments/ Not Indirect DirectExclusions Allowable Costs Costs
Salaries and Benefits 17,820,552$ -$ -$ 2,336,210$ 15,484,342$ Materials and Services 6,032,191 3,134,114 4,501 202,857 2,690,719 Other Materials and Capital Outlay 558,248 - 558,248 - -
Total Expenditures 24,410,991 3,134,114 562,749 2,539,067 18,175,061
Depreciation Allowance 666,603 - - - 666,603
Central Service Allocation 3,314,315 - - 3,314,315 -
Total FES Costs 28,391,909$ 3,134,114$ 562,749$ 5,853,382$ 18,841,664$
5,853,382---------------------- = 31.07%
Direct = 18,841,664
Indirect =
City of GreshamIndirect Cost Rate ProposalYear Ended June 30, 2018
Fire & Emergency Services Department
For Use During Fiscal Year 2019-2020
Computation of Indirect Cost Rate
10
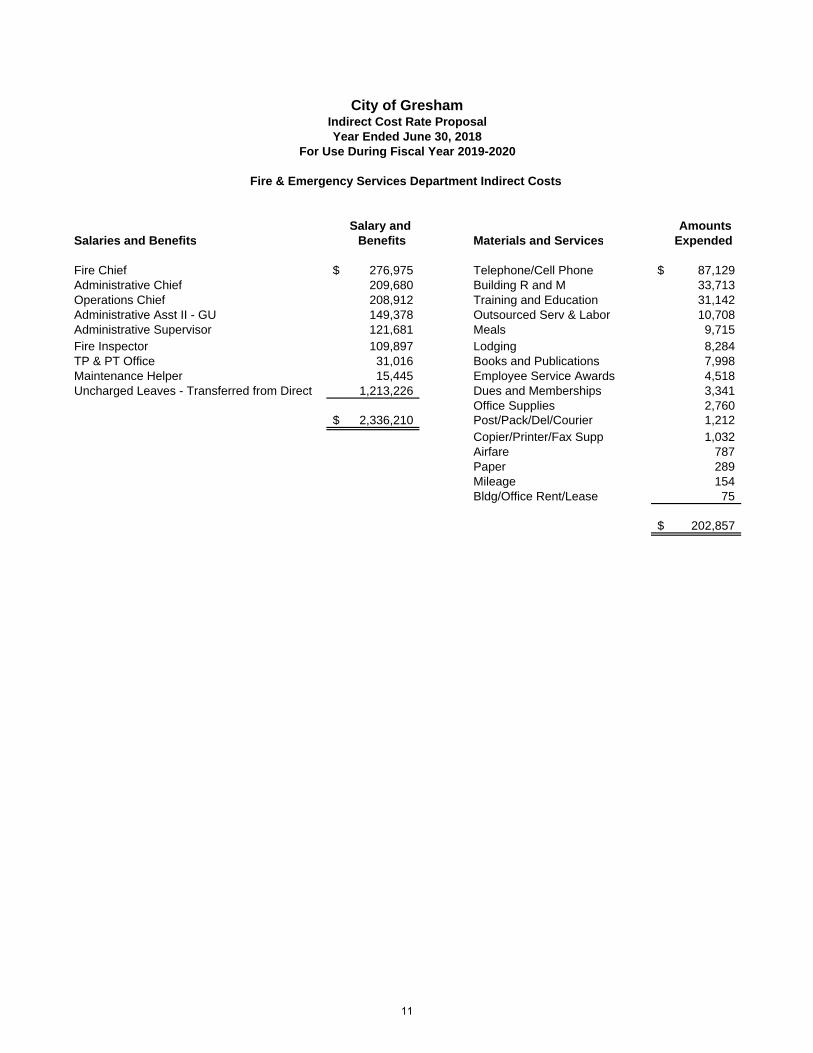
Salary and AmountsSalaries and Benefits Benefits Materials and Services Expended
Fire Chief 276,975$ Telephone/Cell Phone 87,129$ Administrative Chief 209,680 Building R and M 33,713 Operations Chief 208,912 Training and Education 31,142 Administrative Asst II - GU 149,378 Outsourced Serv & Labor 10,708 Administrative Supervisor 121,681 Meals 9,715 Fire Inspector 109,897 Lodging 8,284 TP & PT Office 31,016 Books and Publications 7,998 Maintenance Helper 15,445 Employee Service Awards 4,518 Uncharged Leaves - Transferred from Direct 1,213,226 Dues and Memberships 3,341
Office Supplies 2,760 2,336,210$ Post/Pack/Del/Courier 1,212
Copier/Printer/Fax Supp 1,032 Airfare 787 Paper 289 Mileage 154 Bldg/Office Rent/Lease 75
202,857$
City of GreshamIndirect Cost Rate Proposal
Fire & Emergency Services Department Indirect Costs
Year Ended June 30, 2018For Use During Fiscal Year 2019-2020
11
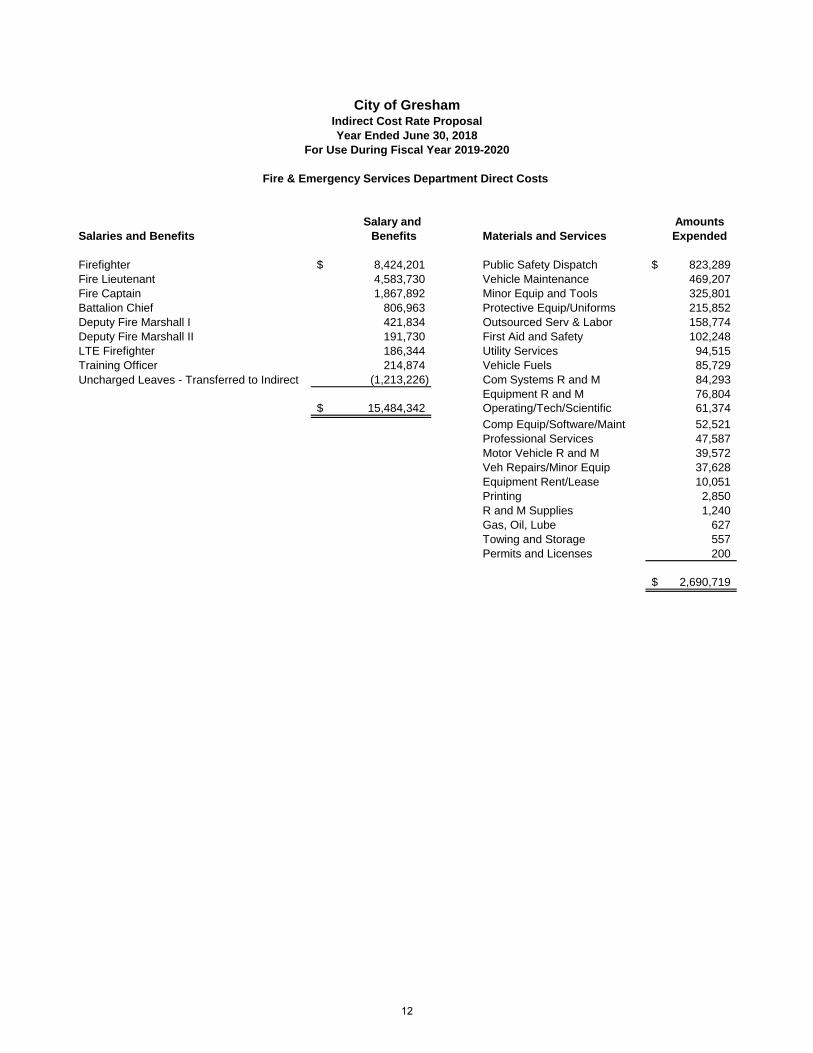
Salary and AmountsSalaries and Benefits Benefits Materials and Services Expended
Firefighter 8,424,201$ Public Safety Dispatch 823,289$ Fire Lieutenant 4,583,730 Vehicle Maintenance 469,207 Fire Captain 1,867,892 Minor Equip and Tools 325,801 Battalion Chief 806,963 Protective Equip/Uniforms 215,852 Deputy Fire Marshall I 421,834 Outsourced Serv & Labor 158,774 Deputy Fire Marshall II 191,730 First Aid and Safety 102,248 LTE Firefighter 186,344 Utility Services 94,515 Training Officer 214,874 Vehicle Fuels 85,729 Uncharged Leaves - Transferred to Indirect (1,213,226) Com Systems R and M 84,293
Equipment R and M 76,804 15,484,342$ Operating/Tech/Scientific 61,374
Comp Equip/Software/Maint 52,521 Professional Services 47,587 Motor Vehicle R and M 39,572 Veh Repairs/Minor Equip 37,628 Equipment Rent/Lease 10,051 Printing 2,850 R and M Supplies 1,240 Gas, Oil, Lube 627 Towing and Storage 557 Permits and Licenses 200
2,690,719$
City of GreshamIndirect Cost Rate ProposalYear Ended June 30, 2018
Fire & Emergency Services Department Direct Costs
For Use During Fiscal Year 2019-2020
12
Urban Design & Planning Services Department MISSION STATEMENT Your partners in creating a greater Gresham. GENERAL DESCRIPTION Urban Design & Planning (UDP) collaborates with residents, elected officials, and other community stakeholders to help create and implement a land use and transportation planning program that addresses the needs, wants, and visions of the Gresham community. The department provides a wide variety of land use planning-related services including development planning and urban design, comprehensive planning, and natural resource planning. As a result of on-going development activity and preparations for additional development-related opportunities, Urban Design and Planning is continuing to experience increasing demands for service. DIVISIONS WITHIN THE DEPARTMENT • Development Planning & Urban Design • Comprehensive Land Use &Transportation Planning • Natural Resources
13
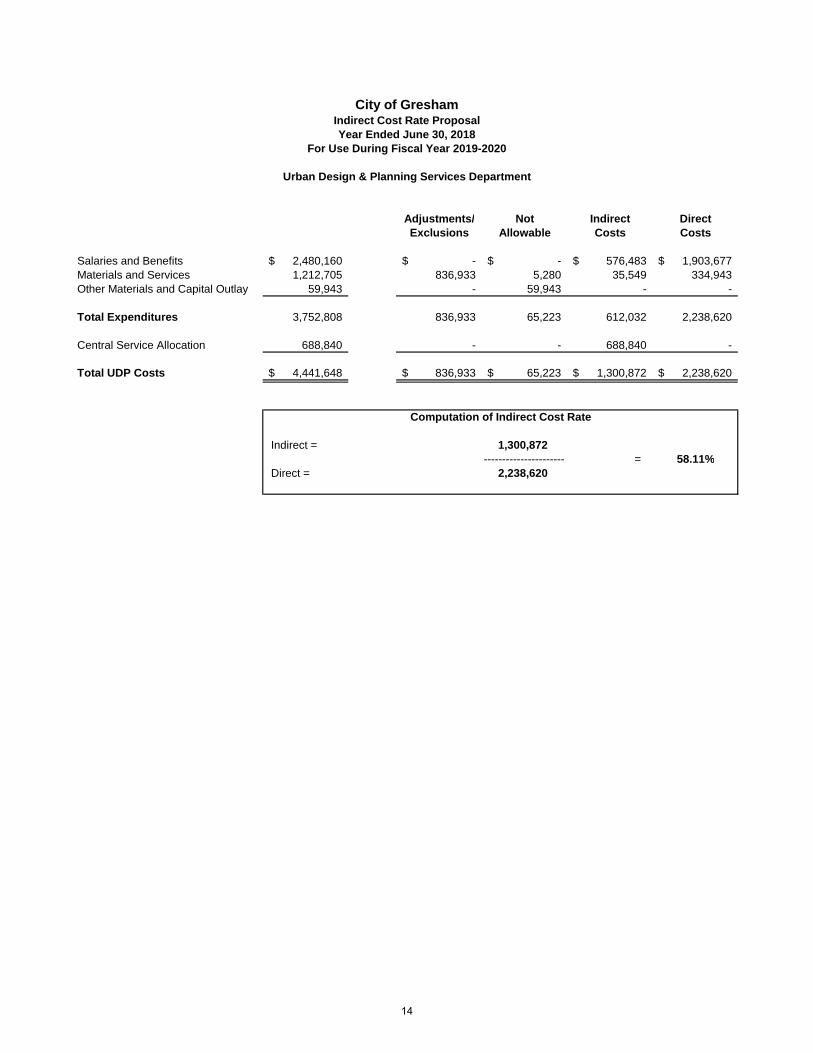
Adjustments/ Not Indirect DirectExclusions Allowable Costs Costs
Salaries and Benefits 2,480,160$ -$ -$ 576,483$ 1,903,677$ Materials and Services 1,212,705 836,933 5,280 35,549 334,943 Other Materials and Capital Outlay 59,943 - 59,943 - -
Total Expenditures 3,752,808 836,933 65,223 612,032 2,238,620
Central Service Allocation 688,840 - - 688,840 -
Total UDP Costs 4,441,648$ 836,933$ 65,223$ 1,300,872$ 2,238,620$
1,300,872---------------------- = 58.11%
Direct = 2,238,620
Computation of Indirect Cost Rate
Indirect =
City of GreshamIndirect Cost Rate ProposalYear Ended June 30, 2018
Urban Design & Planning Services Department
For Use During Fiscal Year 2019-2020
14
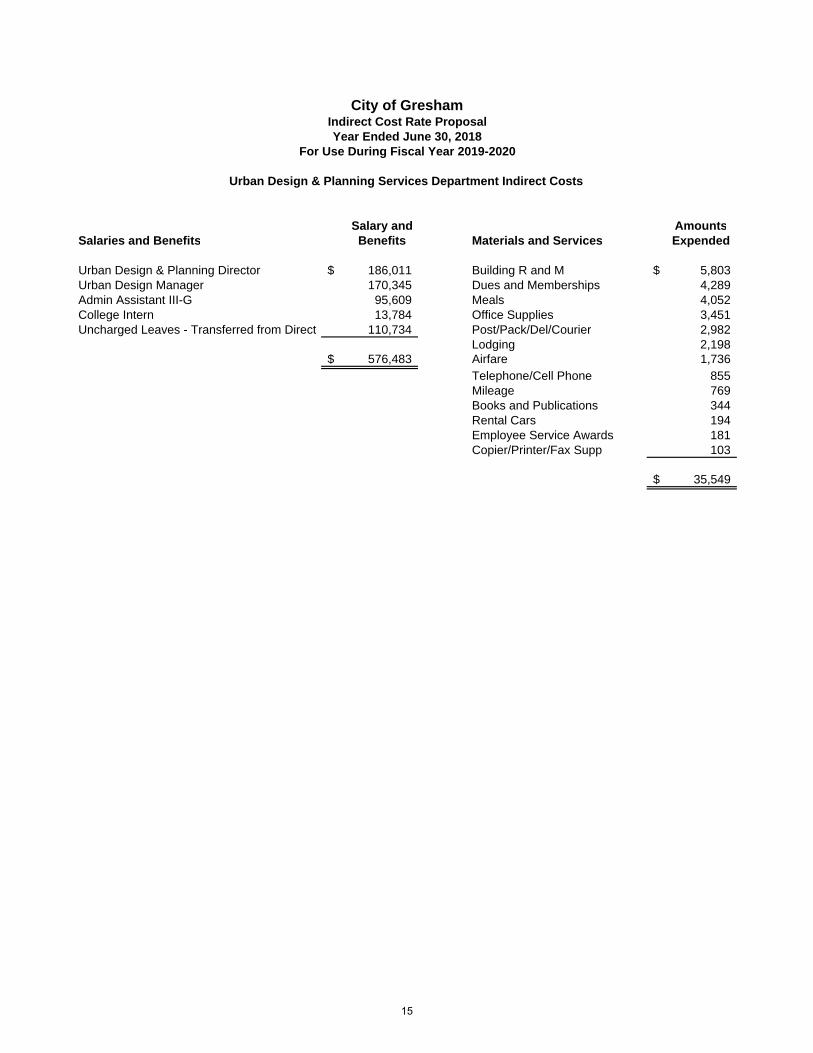
Salary and AmountsSalaries and Benefits Benefits Materials and Services Expended
Urban Design & Planning Director 186,011$ Building R and M 5,803$ Urban Design Manager 170,345 Dues and Memberships 4,289 Admin Assistant III-G 95,609 Meals 4,052 College Intern 13,784 Office Supplies 3,451 Uncharged Leaves - Transferred from Direct 110,734 Post/Pack/Del/Courier 2,982
Lodging 2,198 576,483$ Airfare 1,736
Telephone/Cell Phone 855 Mileage 769 Books and Publications 344 Rental Cars 194 Employee Service Awards 181 Copier/Printer/Fax Supp 103
35,549$
City of GreshamIndirect Cost Rate ProposalYear Ended June 30, 2018
Urban Design & Planning Services Department Indirect Costs
For Use During Fiscal Year 2019-2020
15
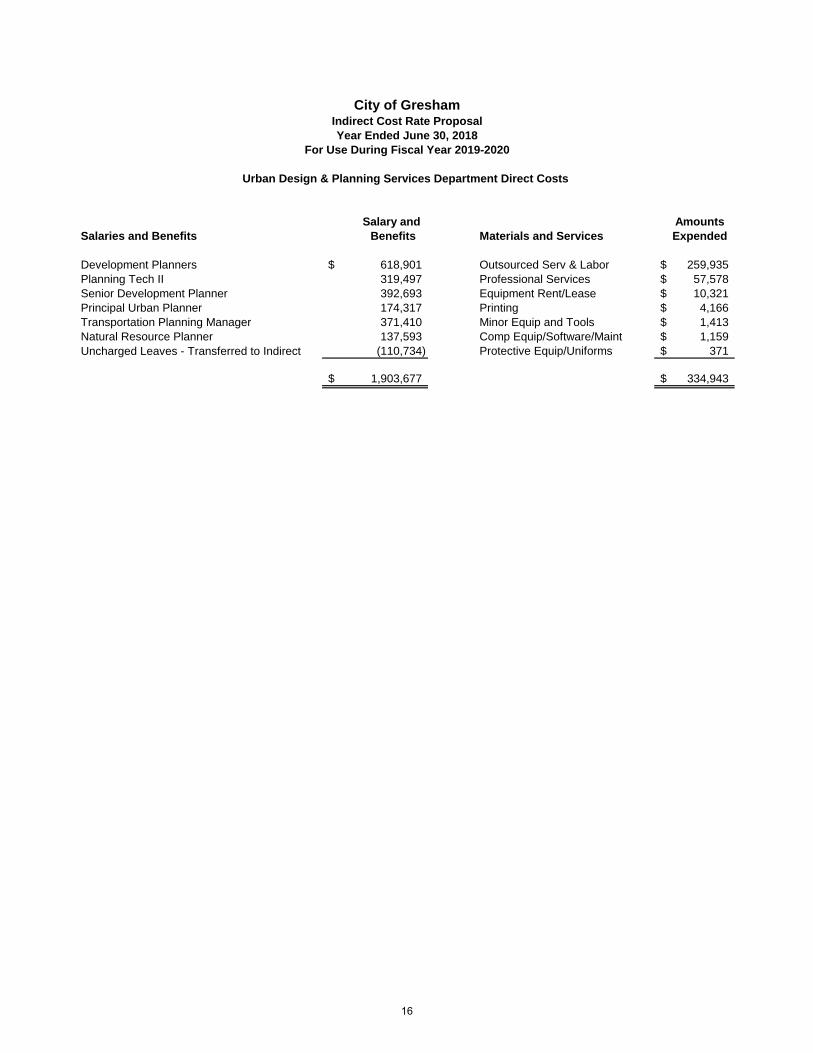
Salary and AmountsSalaries and Benefits Benefits Materials and Services Expended
Development Planners 618,901$ Outsourced Serv & Labor 259,935$ Planning Tech II 319,497 Professional Services 57,578$ Senior Development Planner 392,693 Equipment Rent/Lease 10,321$ Principal Urban Planner 174,317 Printing 4,166$ Transportation Planning Manager 371,410 Minor Equip and Tools 1,413$ Natural Resource Planner 137,593 Comp Equip/Software/Maint 1,159$ Uncharged Leaves - Transferred to Indirect (110,734) Protective Equip/Uniforms 371$
1,903,677$ 334,943$
City of GreshamIndirect Cost Rate ProposalYear Ended June 30, 2018
Urban Design & Planning Services Department Direct Costs
For Use During Fiscal Year 2019-2020
16
Urban Renewal GENERAL DESCRIPTION Urban Renewal is a public funding mechanism aimed at partnering with private development to promote job creation and community revitalization. Rockwood-West Gresham is the City’s first Urban Renewal Area (URA), established through a citywide vote in November 2003. The URA is approximately 1,200 acres, spanning from Yamhill Street to the south to Marine Drive to the north, centered along the 181st Street corridor. The Rockwood-West Gresham Urban Renewal Plan (Plan) serves as the guiding document. The City Council, in its role as Gresham Redevelopment Commission (GRDC), oversees implementation of the Plan. An advisory committee makes policy and project recommendations to the GRDC. The GRDC contracts with the City of Gresham for services to administer the Urban Renewal program, with the URA reimbursing the City for the costs incurred by staff and program administration. DIVISIONS WITHIN THE DEPARTMENT • Urban Renewal Administration
17
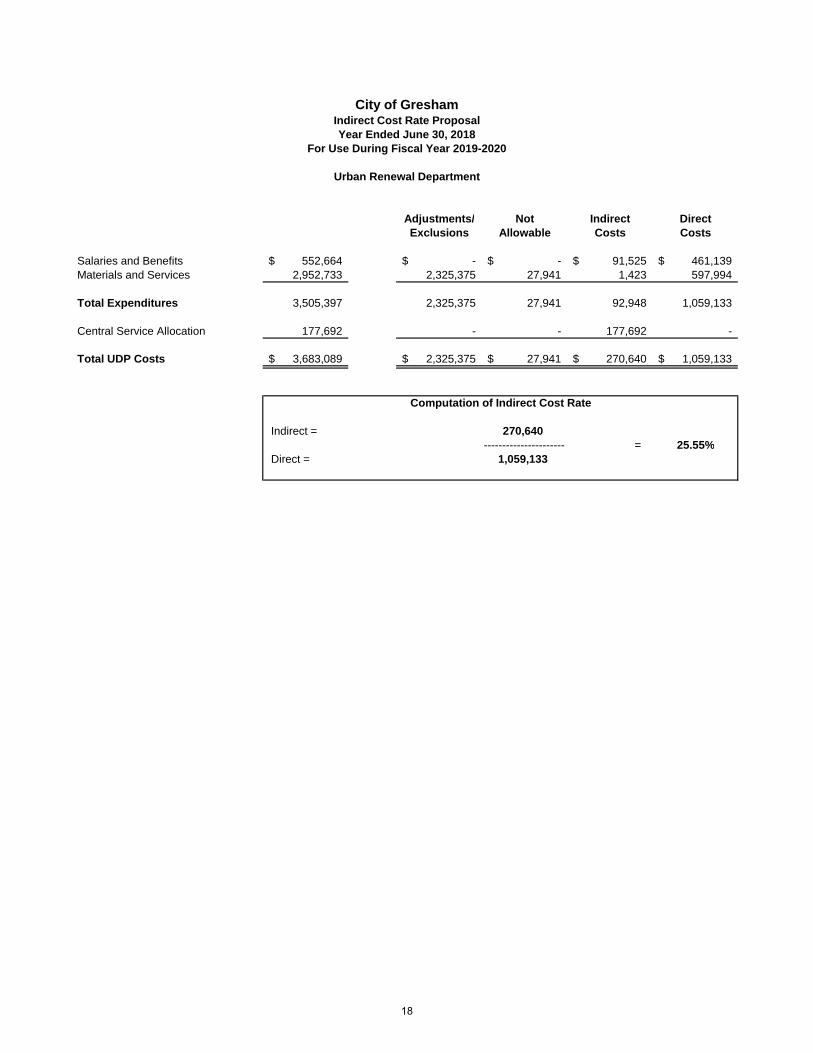
Adjustments/ Not Indirect DirectExclusions Allowable Costs Costs
Salaries and Benefits 552,664$ -$ -$ 91,525$ 461,139$ Materials and Services 2,952,733 2,325,375 27,941 1,423 597,994
Total Expenditures 3,505,397 2,325,375 27,941 92,948 1,059,133
Central Service Allocation 177,692 - - 177,692 -
Total UDP Costs 3,683,089$ 2,325,375$ 27,941$ 270,640$ 1,059,133$
270,640---------------------- = 25.55%
Direct = 1,059,133
Indirect =
City of GreshamIndirect Cost Rate ProposalYear Ended June 30, 2018
For Use During Fiscal Year 2019-2020
Urban Renewal Department
Computation of Indirect Cost Rate
18
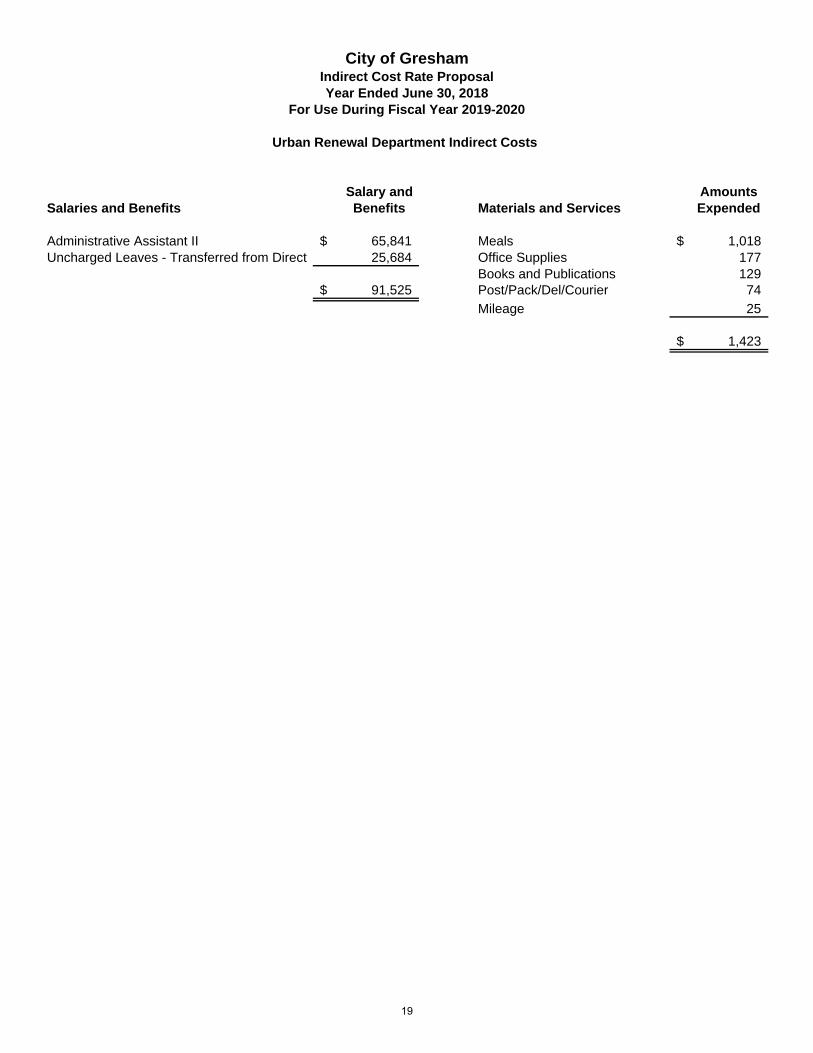
Salary and AmountsSalaries and Benefits Benefits Materials and Services Expended
Administrative Assistant II 65,841$ Meals 1,018$ Uncharged Leaves - Transferred from Direct 25,684 Office Supplies 177
Books and Publications 129 91,525$ Post/Pack/Del/Courier 74
Mileage 25
1,423$
City of GreshamIndirect Cost Rate ProposalYear Ended June 30, 2018
For Use During Fiscal Year 2019-2020
Urban Renewal Department Indirect Costs
19
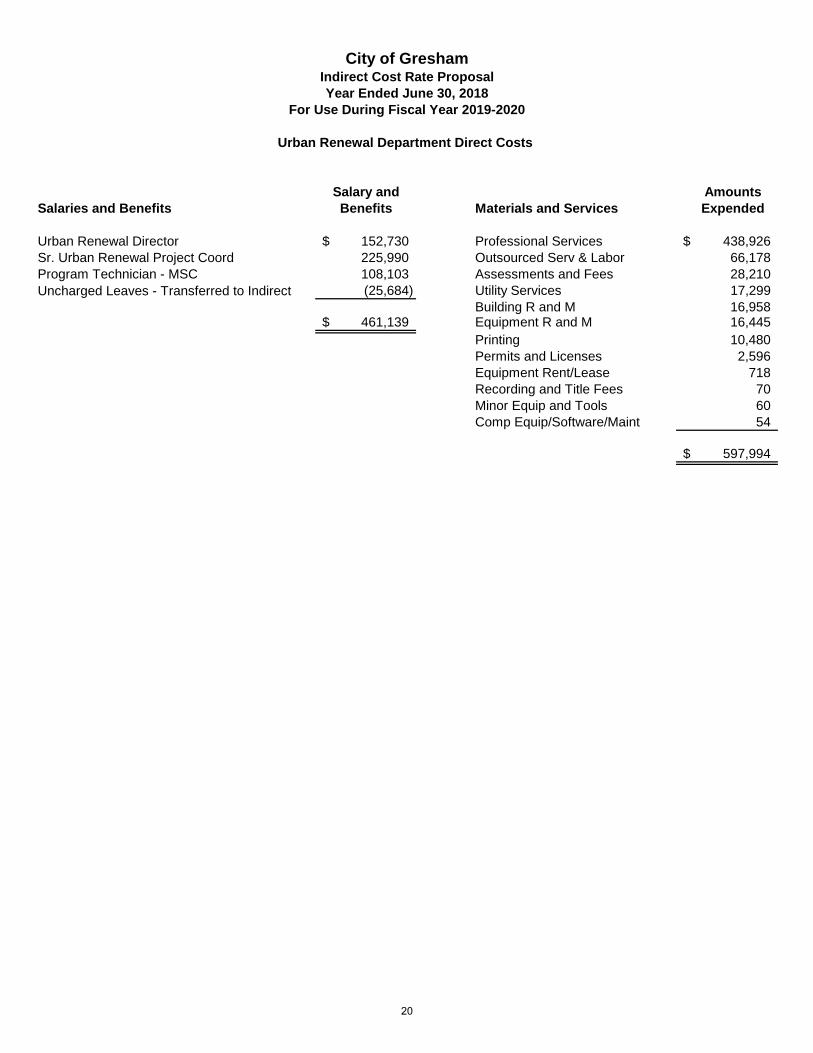
Salary and AmountsSalaries and Benefits Benefits Materials and Services Expended
Urban Renewal Director 152,730$ Professional Services 438,926$ Sr. Urban Renewal Project Coord 225,990 Outsourced Serv & Labor 66,178 Program Technician - MSC 108,103 Assessments and Fees 28,210 Uncharged Leaves - Transferred to Indirect (25,684) Utility Services 17,299
Building R and M 16,958 461,139$ Equipment R and M 16,445
Printing 10,480 Permits and Licenses 2,596 Equipment Rent/Lease 718 Recording and Title Fees 70 Minor Equip and Tools 60 Comp Equip/Software/Maint 54
597,994$
City of GreshamIndirect Cost Rate ProposalYear Ended June 30, 2018
For Use During Fiscal Year 2019-2020
Urban Renewal Department Direct Costs
20
Community Development MISSION STATEMENT Your partners in creating solutions for quality development and a healthy business climate. GENERAL DESCRIPTION Community Development is responsible for the orderly growth of Gresham through code compliance, inspection, and plan review. The department provides a wide variety of development services including: development plan review through final inspection, issuing building permits and performing building inspections, maintaining compliance with City Code through code enforcement, small business assistance, and performing rental housing inspections. DIVISIONS WITHIN THE DEPARTMENT • Code Compliance & Rental Housing Inspections • Community Revitalization • Building Inspection and Permitting • Commercial Business & Development Support • Permit Services • Mechanical, Structural, Electrical, & Plumbing
21

Adjustments/ Not Indirect DirectExclusions Allowable Costs Costs
Salaries and Benefits 3,440,635$ -$ -$ 758,153$ 2,682,482$ Materials and Services 2,523,067 1,247,915 1,050,176 55,972 169,004 Other Materials and Capital Outlay 49,552 - 49,552 - -
Total Expenditures 6,013,254 1,247,915 1,099,728 814,125 2,851,486
Transfers 164,947 - - - 164,947
Depreciation 40,095 - - - 40,095
Central Service Allocation 1,346,743 - - 1,346,743 -
Total CD Costs 7,565,039$ 1,247,915$ 1,099,728$ 2,160,868$ 3,056,528$
2,160,868---------------------- = 70.70%
Direct = 3,056,528
Computation of Indirect Cost Rate
Indirect =
City of GreshamIndirect Cost Rate ProposalYear Ended June 30, 2018
Community Development Department
For Use During Fiscal Year 2019-2020
22
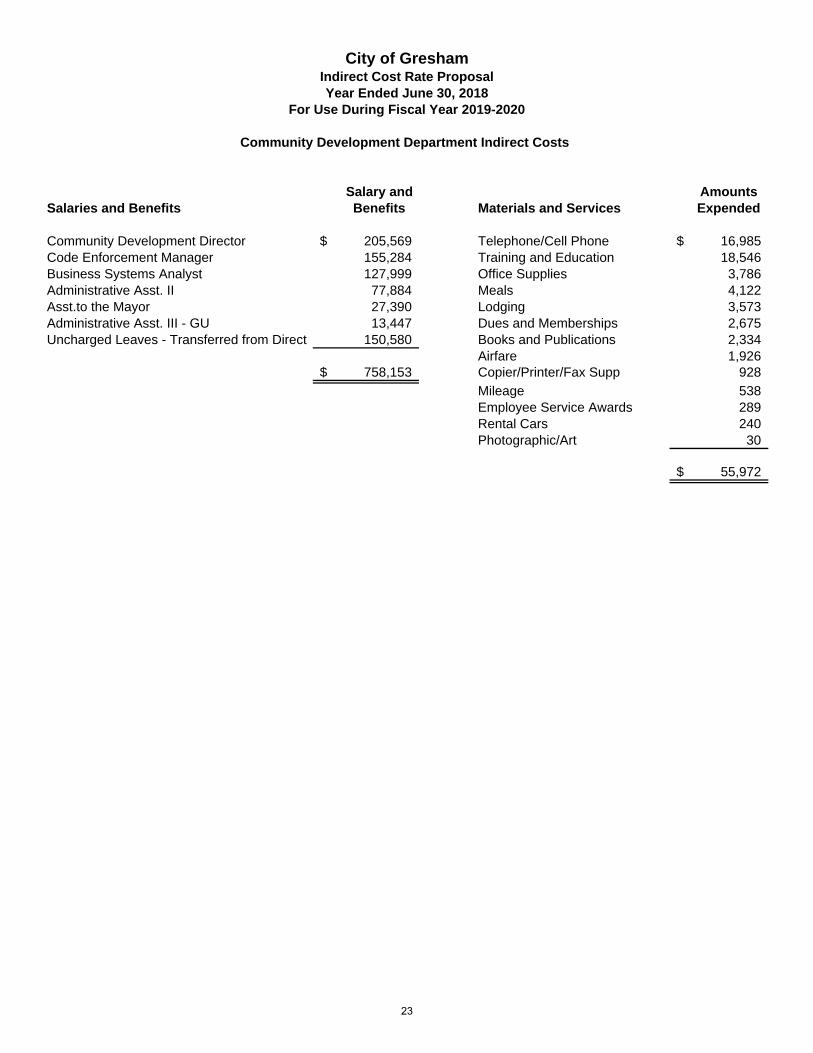
Salary and AmountsSalaries and Benefits Benefits Materials and Services Expended
Community Development Director 205,569$ Telephone/Cell Phone 16,985$ Code Enforcement Manager 155,284 Training and Education 18,546 Business Systems Analyst 127,999 Office Supplies 3,786 Administrative Asst. II 77,884 Meals 4,122 Asst.to the Mayor 27,390 Lodging 3,573 Administrative Asst. III - GU 13,447 Dues and Memberships 2,675 Uncharged Leaves - Transferred from Direct 150,580 Books and Publications 2,334
Airfare 1,926 758,153$ Copier/Printer/Fax Supp 928
Mileage 538 Employee Service Awards 289 Rental Cars 240 Photographic/Art 30
55,972$
City of GreshamIndirect Cost Rate ProposalYear Ended June 30, 2018
Community Development Department Indirect Costs
For Use During Fiscal Year 2019-2020
23
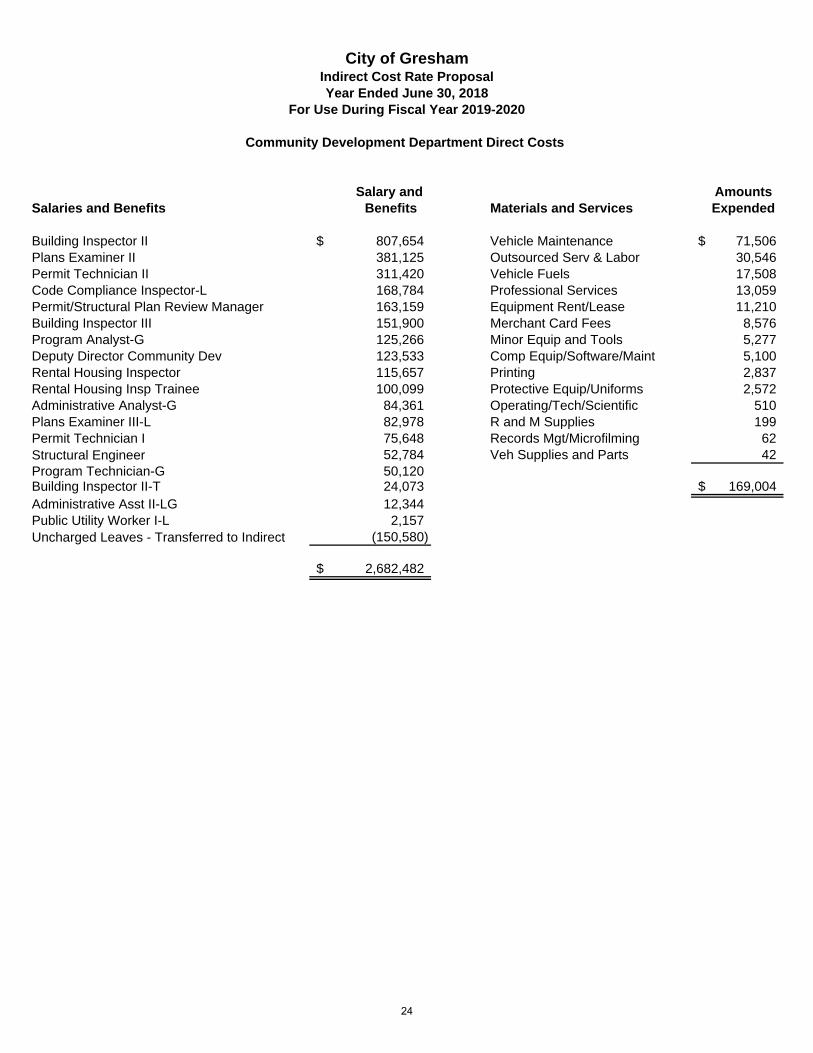
Salary and AmountsSalaries and Benefits Benefits Materials and Services Expended
Building Inspector II 807,654$ Vehicle Maintenance 71,506$ Plans Examiner II 381,125 Outsourced Serv & Labor 30,546 Permit Technician II 311,420 Vehicle Fuels 17,508 Code Compliance Inspector-L 168,784 Professional Services 13,059 Permit/Structural Plan Review Manager 163,159 Equipment Rent/Lease 11,210 Building Inspector III 151,900 Merchant Card Fees 8,576 Program Analyst-G 125,266 Minor Equip and Tools 5,277 Deputy Director Community Dev 123,533 Comp Equip/Software/Maint 5,100 Rental Housing Inspector 115,657 Printing 2,837 Rental Housing Insp Trainee 100,099 Protective Equip/Uniforms 2,572 Administrative Analyst-G 84,361 Operating/Tech/Scientific 510 Plans Examiner III-L 82,978 R and M Supplies 199 Permit Technician I 75,648 Records Mgt/Microfilming 62 Structural Engineer 52,784 Veh Supplies and Parts 42 Program Technician-G 50,120 Building Inspector II-T 24,073 169,004$ Administrative Asst II-LG 12,344 Public Utility Worker I-L 2,157 Uncharged Leaves - Transferred to Indirect (150,580)
2,682,482$
City of GreshamIndirect Cost Rate ProposalYear Ended June 30, 2018
Community Development Department Direct Costs
For Use During Fiscal Year 2019-2020
24
Community Livability
MISSION STATEMENT Employ practical solutions to compliance and utilize the power of the City’s volunteer network to keep Gresham neighborhoods livable, save the City time and money, and connect neighbors who need a helping hand with their fellow residents who would be willing to assist. GENERAL DESCRIPTION The Community Livability Department consists of the Office of Neighborhoods & Community Enhancement, Mediation Services Division, and the Livability & Code Services Division.
• The Office of Neighborhoods and Community Enhancement (ONCE) supports strong neighborhoods, authentic engagement and community problem-solving. ONCE is the coordinator for the City’s Neighborhood Association Program and other volunteer programs.
• The Mediation Services Division provides services to resolve conflicts involving neighbors, businesses, housing issues, families and employee disputes. In addition, the program conducts public and employee workshops on conflict management to increase the skills of the citizenry. The division serves East Multnomah County through intergovernmental agreements with the cities of Troutdale, Fairview, and Wood Village.
• The Livability and Code Services Division is responsible for improving and maintaining the livability of the Gresham community by addressing city code violations, including land use, nuisances, parking and abandoned vehicles, and the impacts of homelessness. The division responds to citizens’ concerns to resolve problems, ensure compliance with City Codes, connect those in need to resources and generally protect the investments that citizens and businesses have made in the Gresham community.
25
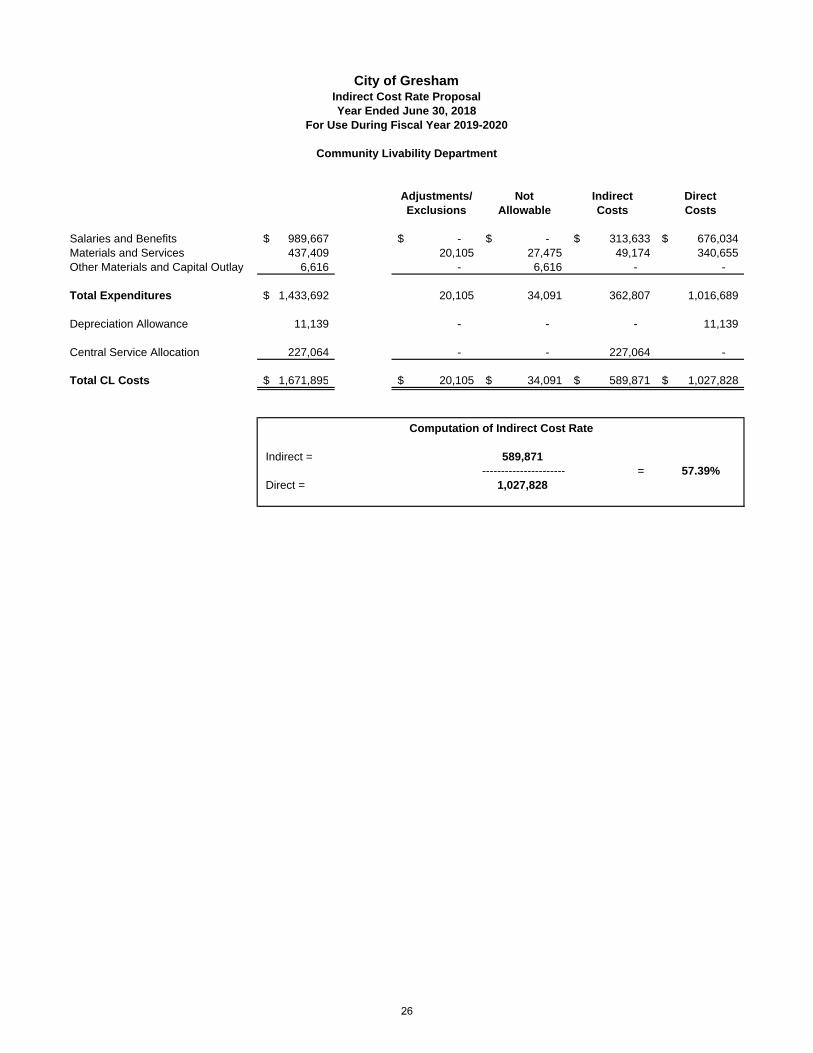
Adjustments/ Not Indirect DirectExclusions Allowable Costs Costs
Salaries and Benefits 989,667$ -$ -$ 313,633$ 676,034$ Materials and Services 437,409 20,105 27,475 49,174 340,655 Other Materials and Capital Outlay 6,616 - 6,616 - -
Total Expenditures 1,433,692$ 20,105 34,091 362,807 1,016,689
Depreciation Allowance 11,139 - - - 11,139
Central Service Allocation 227,064 - - 227,064 -
Total CL Costs 1,671,895$ 20,105$ 34,091$ 589,871$ 1,027,828$
589,871---------------------- = 57.39%
Direct = 1,027,828
Indirect =
City of GreshamIndirect Cost Rate ProposalYear Ended June 30, 2018
For Use During Fiscal Year 2019-2020
Community Livability Department
Computation of Indirect Cost Rate
26
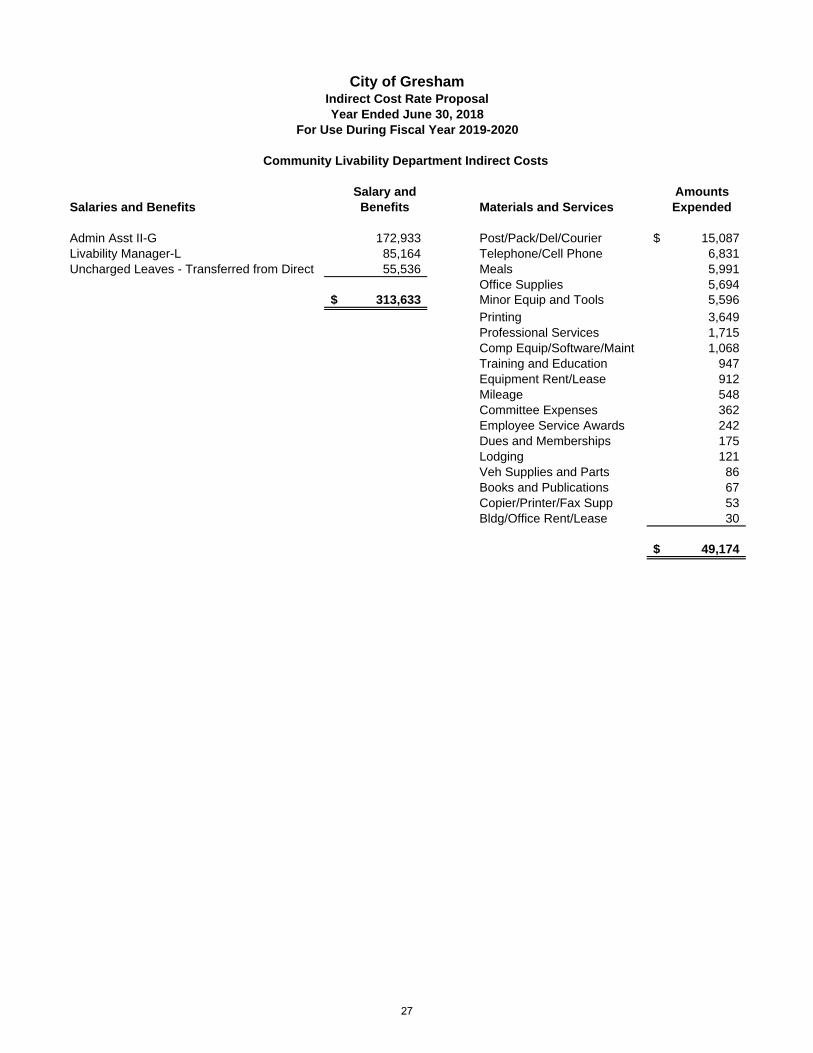
Salary and AmountsSalaries and Benefits Benefits Materials and Services Expended
Admin Asst II-G 172,933 Post/Pack/Del/Courier 15,087$ Livability Manager-L 85,164 Telephone/Cell Phone 6,831 Uncharged Leaves - Transferred from Direct 55,536 Meals 5,991
Office Supplies 5,694 313,633$ Minor Equip and Tools 5,596
Printing 3,649 Professional Services 1,715 Comp Equip/Software/Maint 1,068 Training and Education 947 Equipment Rent/Lease 912 Mileage 548 Committee Expenses 362 Employee Service Awards 242 Dues and Memberships 175 Lodging 121 Veh Supplies and Parts 86 Books and Publications 67 Copier/Printer/Fax Supp 53 Bldg/Office Rent/Lease 30
49,174$
City of GreshamIndirect Cost Rate ProposalYear Ended June 30, 2018
For Use During Fiscal Year 2019-2020
Community Livability Department Indirect Costs
27
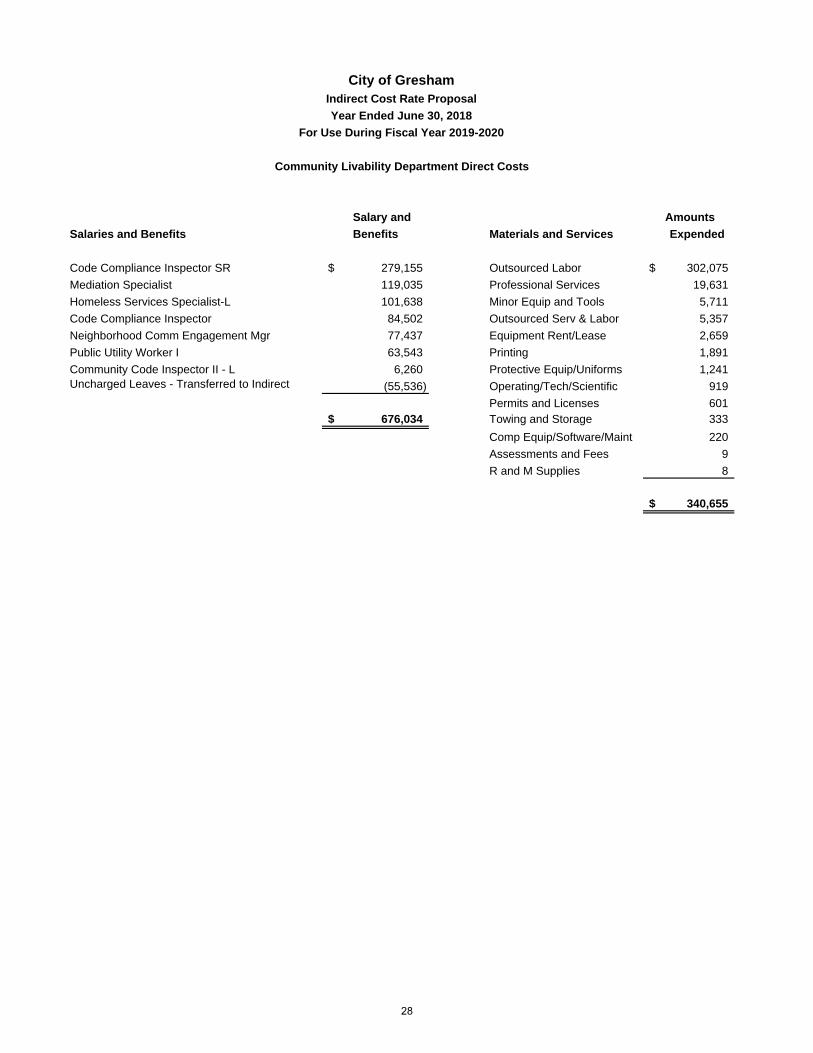
Salary and Amounts
Salaries and Benefits Benefits Materials and Services Expended
Code Compliance Inspector SR 279,155$ Outsourced Labor 302,075$
Mediation Specialist 119,035 Professional Services 19,631
Homeless Services Specialist-L 101,638 Minor Equip and Tools 5,711
Code Compliance Inspector 84,502 Outsourced Serv & Labor 5,357
Neighborhood Comm Engagement Mgr 77,437 Equipment Rent/Lease 2,659
Public Utility Worker I 63,543 Printing 1,891
Community Code Inspector II - L 6,260 Protective Equip/Uniforms 1,241 Uncharged Leaves - Transferred to Indirect (55,536) Operating/Tech/Scientific 919
Permits and Licenses 601 676,034$ Towing and Storage 333
Comp Equip/Software/Maint 220
Assessments and Fees 9
R and M Supplies 8
340,655$
City of GreshamIndirect Cost Rate Proposal
Year Ended June 30, 2018
For Use During Fiscal Year 2019-2020
Community Livability Department Direct Costs
28
Economic Development Services Department MISSION STATEMENT Creating solutions for quality development and a healthy business climate. GENERAL DESCRIPTION Economic Development Services (EDS) is responsible for business recruitment, retention, and relationships with the local business community, with a focus on traded sector industrial companies. DIVISIONS WITHIN THE DEPARTMENT • Economic Development
29
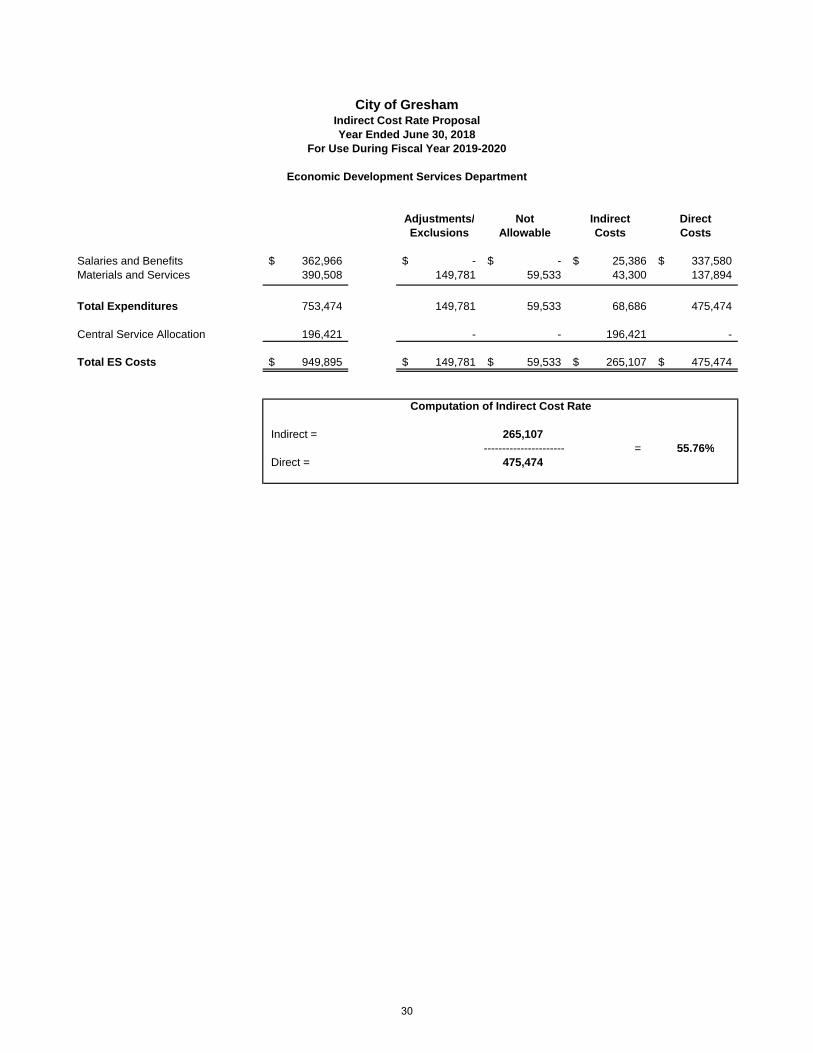
Adjustments/ Not Indirect DirectExclusions Allowable Costs Costs
Salaries and Benefits 362,966$ -$ -$ 25,386$ 337,580$ Materials and Services 390,508 149,781 59,533 43,300 137,894
Total Expenditures 753,474 149,781 59,533 68,686 475,474
Central Service Allocation 196,421 - - 196,421 -
Total ES Costs 949,895$ 149,781$ 59,533$ 265,107$ 475,474$
265,107---------------------- = 55.76%
Direct = 475,474
Computation of Indirect Cost Rate
Indirect =
City of GreshamIndirect Cost Rate ProposalYear Ended June 30, 2018
Economic Development Services Department
For Use During Fiscal Year 2019-2020
30
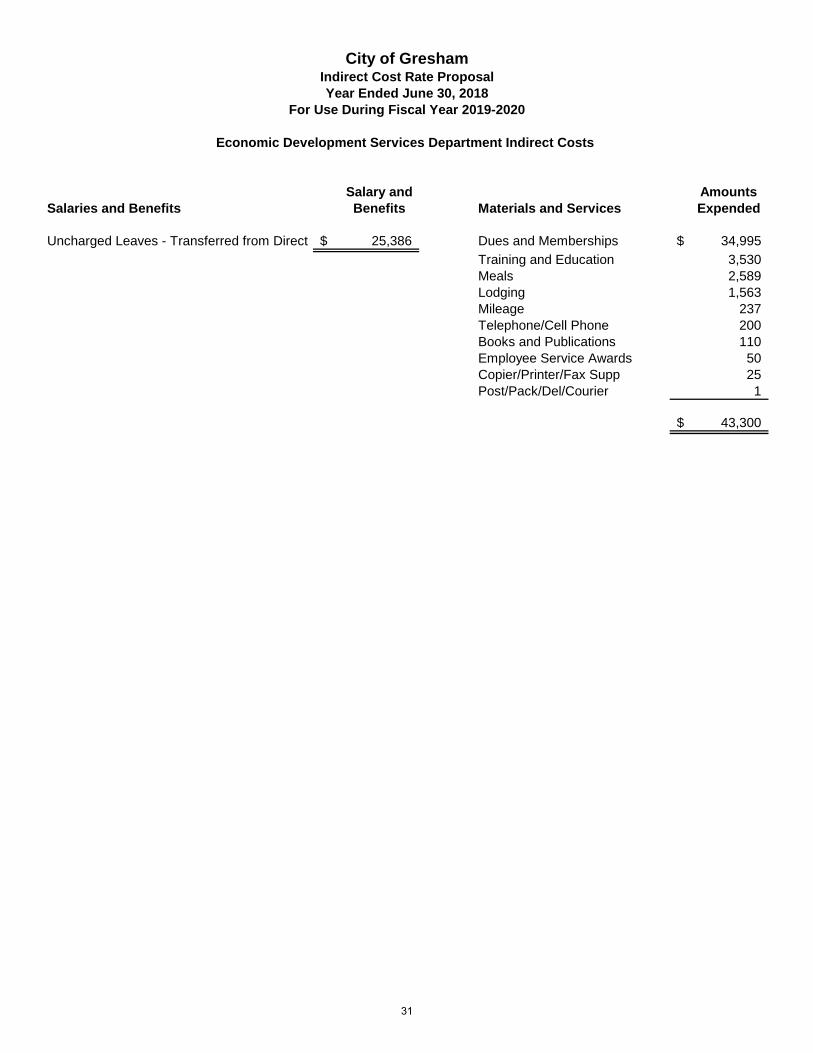
Salary and AmountsSalaries and Benefits Benefits Materials and Services Expended
Uncharged Leaves - Transferred from Direct 25,386$ Dues and Memberships 34,995$
Training and Education 3,530 Meals 2,589 Lodging 1,563 Mileage 237 Telephone/Cell Phone 200 Books and Publications 110 Employee Service Awards 50 Copier/Printer/Fax Supp 25 Post/Pack/Del/Courier 1
43,300$
City of GreshamIndirect Cost Rate ProposalYear Ended June 30, 2018
Economic Development Services Department Indirect Costs
For Use During Fiscal Year 2019-2020
31
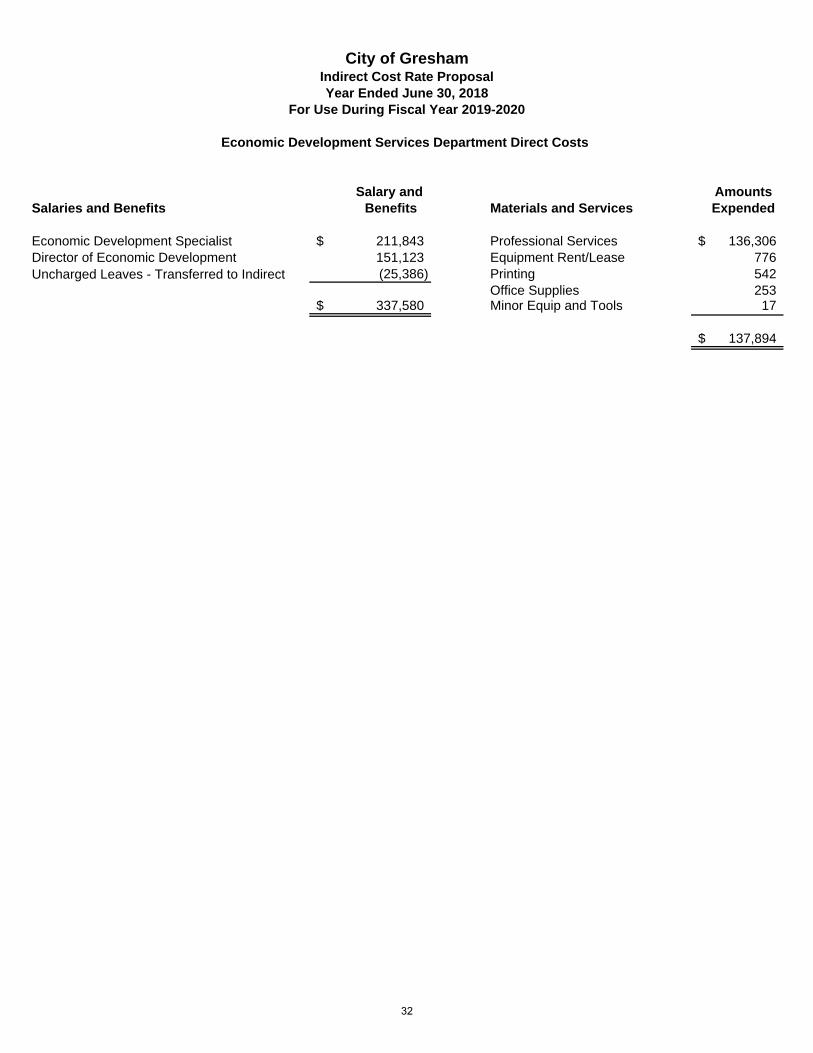
Salary and AmountsSalaries and Benefits Benefits Materials and Services Expended
Economic Development Specialist 211,843$ Professional Services 136,306$ Director of Economic Development 151,123 Equipment Rent/Lease 776 Uncharged Leaves - Transferred to Indirect (25,386) Printing 542
Office Supplies 253 337,580$ Minor Equip and Tools 17
137,894$
City of GreshamIndirect Cost Rate ProposalYear Ended June 30, 2018
Economic Development Services Department Direct Costs
For Use During Fiscal Year 2019-2020
32
Parks Department MISSION STATEMENT Maintain and operate public park infrastructure, open space properties, trails and support for recreational programs for safe and enjoyment of our citizens and the general public. GENERAL DESCRIPTION The Parks Department maintains over 314 acres of active parks, 8 miles of trails, and is the community steward for over 800 acres of natural areas. The department coordinates with community volunteers, when available, on maintenance and operation related activities. Parks supports the administration of recreational programs such as the SKIP program and a field and shelter reservation system. The department also supports a variety of special events each year including the Community Spirit of Christmas, the Hood to Coast Relay Race, and Gresham Arts Festival to name a few. Operating expenditures for Parks are budgeted in the General Fund and in Police, Fire and Parks Fund. Parks related capital improvement projects are budgeted in the Park CIP Fund with resources from system development charges, grants, loans, and private donations. DIVISIONS WITHIN THE DEPARTMENT • Park Maintenance and Operations
33
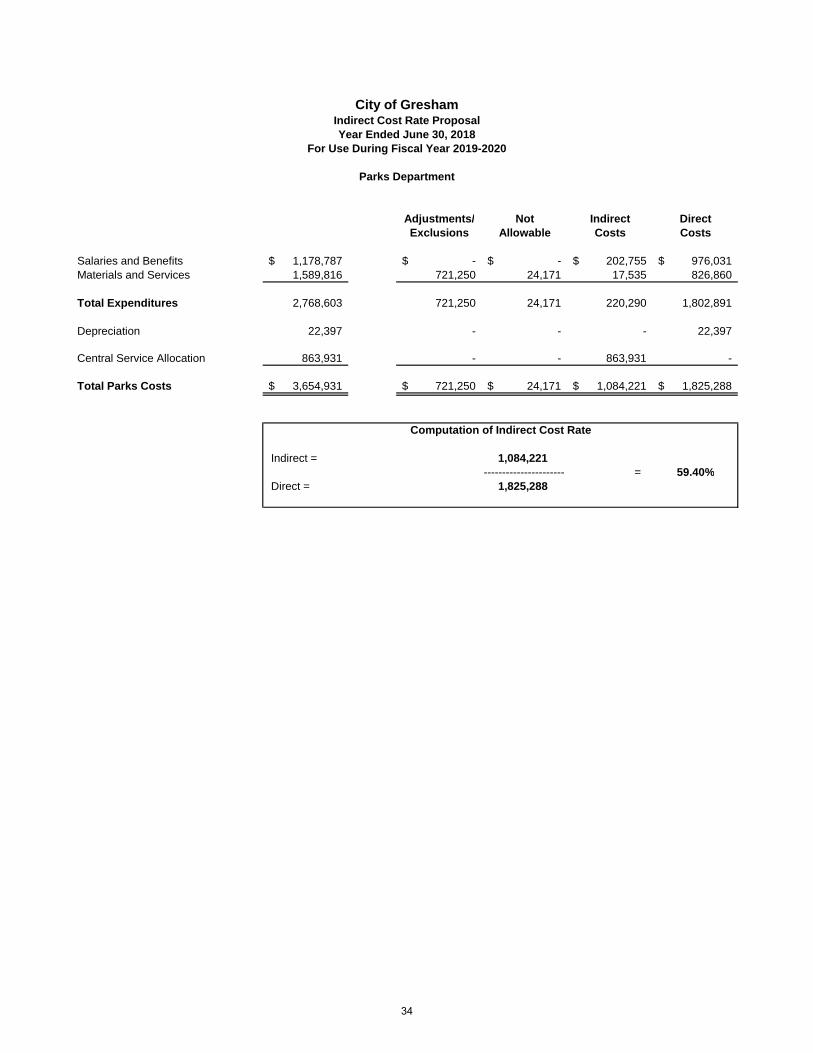
Adjustments/ Not Indirect DirectExclusions Allowable Costs Costs
Salaries and Benefits 1,178,787$ -$ -$ 202,755$ 976,031$ Materials and Services 1,589,816 721,250 24,171 17,535 826,860
Total Expenditures 2,768,603 721,250 24,171 220,290 1,802,891
Depreciation 22,397 - - - 22,397
Central Service Allocation 863,931 - - 863,931 -
Total Parks Costs 3,654,931$ 721,250$ 24,171$ 1,084,221$ 1,825,288$
1,084,221---------------------- = 59.40%
Direct = 1,825,288
Indirect =
City of GreshamIndirect Cost Rate ProposalYear Ended June 30, 2018
For Use During Fiscal Year 2019-2020
Parks Department
Computation of Indirect Cost Rate
34
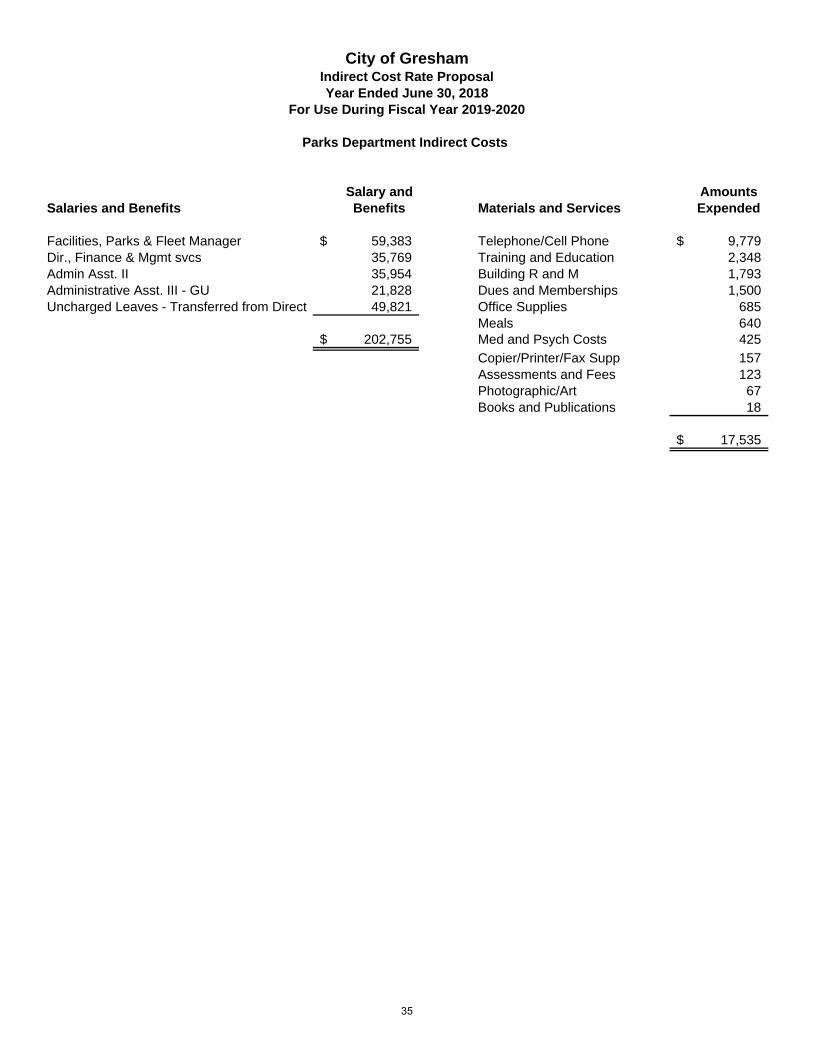
Salary and AmountsSalaries and Benefits Benefits Materials and Services Expended
Facilities, Parks & Fleet Manager 59,383$ Telephone/Cell Phone 9,779$ Dir., Finance & Mgmt svcs 35,769 Training and Education 2,348 Admin Asst. II 35,954 Building R and M 1,793 Administrative Asst. III - GU 21,828 Dues and Memberships 1,500 Uncharged Leaves - Transferred from Direct 49,821 Office Supplies 685
Meals 640 202,755$ Med and Psych Costs 425
Copier/Printer/Fax Supp 157 Assessments and Fees 123 Photographic/Art 67 Books and Publications 18
17,535$
City of GreshamIndirect Cost Rate ProposalYear Ended June 30, 2018
For Use During Fiscal Year 2019-2020
Parks Department Indirect Costs
35
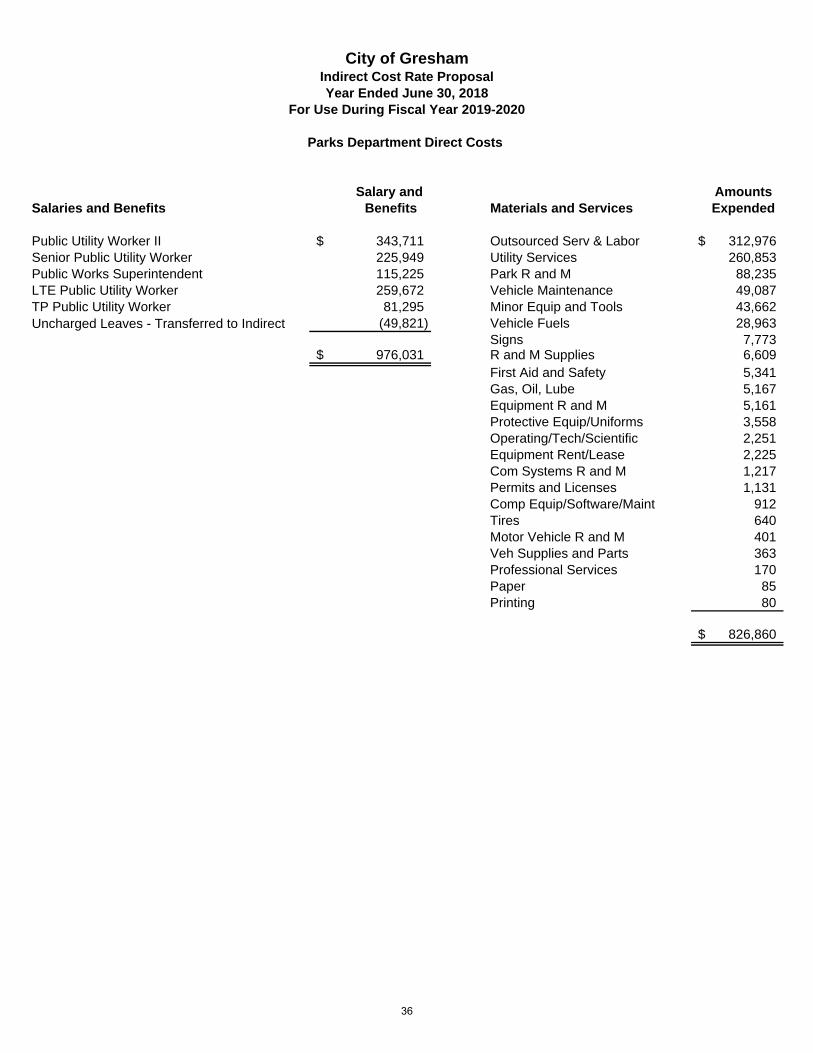
Salary and AmountsSalaries and Benefits Benefits Materials and Services Expended
Public Utility Worker II 343,711$ Outsourced Serv & Labor 312,976$ Senior Public Utility Worker 225,949 Utility Services 260,853 Public Works Superintendent 115,225 Park R and M 88,235 LTE Public Utility Worker 259,672 Vehicle Maintenance 49,087 TP Public Utility Worker 81,295 Minor Equip and Tools 43,662 Uncharged Leaves - Transferred to Indirect (49,821) Vehicle Fuels 28,963
Signs 7,773 976,031$ R and M Supplies 6,609
First Aid and Safety 5,341 Gas, Oil, Lube 5,167 Equipment R and M 5,161 Protective Equip/Uniforms 3,558 Operating/Tech/Scientific 2,251 Equipment Rent/Lease 2,225 Com Systems R and M 1,217 Permits and Licenses 1,131 Comp Equip/Software/Maint 912 Tires 640 Motor Vehicle R and M 401 Veh Supplies and Parts 363 Professional Services 170 Paper 85 Printing 80
826,860$
City of GreshamIndirect Cost Rate ProposalYear Ended June 30, 2018
For Use During Fiscal Year 2019-2020
Parks Department Direct Costs
36
Department of Environmental Services MISSION STATEMENT Meet the essential needs of the community by efficiently providing clean water, safe transportation, waste disposal, and other core public services while protecting the environment. GENERAL DESCRIPTION The Department of Environmental Services (DES) provides services in the areas of transportation, storm, and surface water, drinking water, wastewater collection and treatment, park design and construction, and recycling and solid waste. DES operates and maintains existing infrastructure systems, as well as plans, designs, and manages the construction or implementation of new or upgraded facilities required to meet the needs of our customers. The service areas within DES are supported by shared administration, public works construction inspection, and development review and permitting. Together, these core services provide a better quality of life for our customers and the public. DIVISIONS WITHIN THE DEPARTMENT • Transportation Services • Development Services • Recycling & Solid Waste • Water Resources • Drinking Water • Wastewater Collection & Treatment • Watershed
37
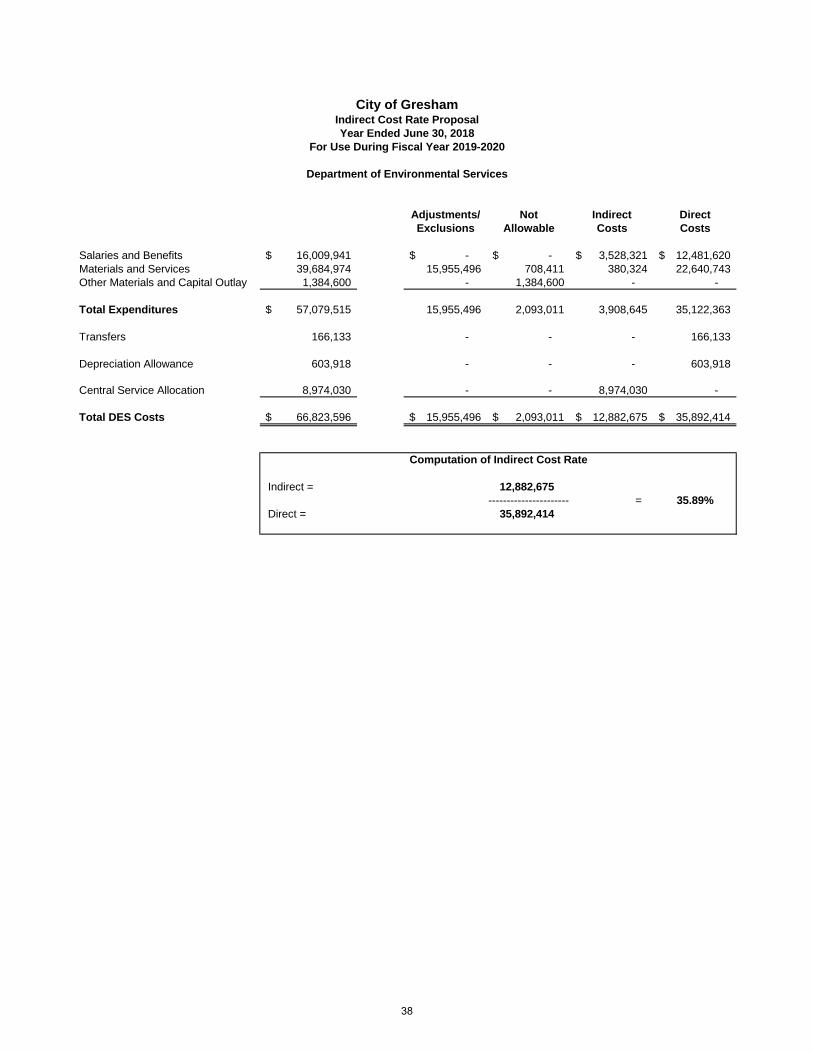
Adjustments/ Not Indirect DirectExclusions Allowable Costs Costs
Salaries and Benefits 16,009,941$ -$ -$ 3,528,321$ 12,481,620$ Materials and Services 39,684,974 15,955,496 708,411 380,324 22,640,743 Other Materials and Capital Outlay 1,384,600 - 1,384,600 - -
Total Expenditures 57,079,515$ 15,955,496 2,093,011 3,908,645 35,122,363
Transfers 166,133 - - - 166,133
Depreciation Allowance 603,918 - - - 603,918
Central Service Allocation 8,974,030 - - 8,974,030 -
Total DES Costs 66,823,596$ 15,955,496$ 2,093,011$ 12,882,675$ 35,892,414$
12,882,675---------------------- = 35.89%
Direct = 35,892,414
City of Gresham
Indirect =
Computation of Indirect Cost Rate
Department of Environmental Services
Year Ended June 30, 2018Indirect Cost Rate Proposal
For Use During Fiscal Year 2019-2020
38
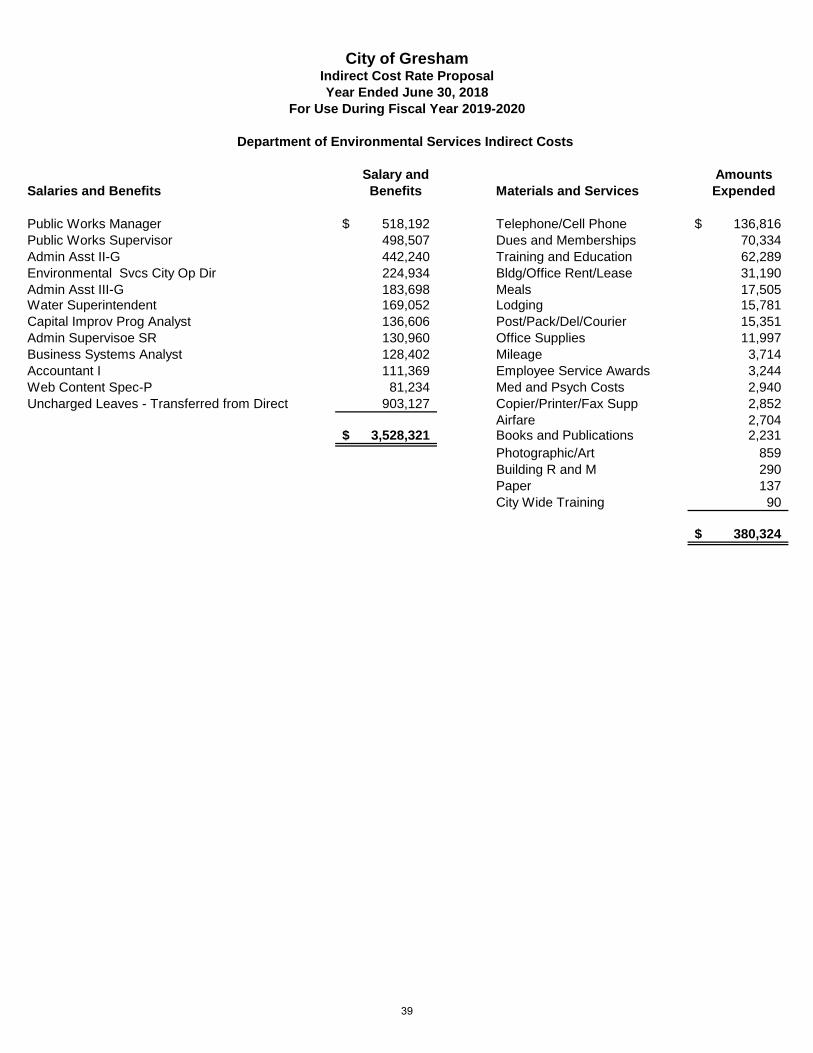
Salary and AmountsSalaries and Benefits Benefits Materials and Services Expended
Public Works Manager 518,192$ Telephone/Cell Phone 136,816$ Public Works Supervisor 498,507 Dues and Memberships 70,334 Admin Asst II-G 442,240 Training and Education 62,289 Environmental Svcs City Op Dir 224,934 Bldg/Office Rent/Lease 31,190 Admin Asst III-G 183,698 Meals 17,505 Water Superintendent 169,052 Lodging 15,781 Capital Improv Prog Analyst 136,606 Post/Pack/Del/Courier 15,351 Admin Supervisoe SR 130,960 Office Supplies 11,997 Business Systems Analyst 128,402 Mileage 3,714 Accountant I 111,369 Employee Service Awards 3,244 Web Content Spec-P 81,234 Med and Psych Costs 2,940 Uncharged Leaves - Transferred from Direct 903,127 Copier/Printer/Fax Supp 2,852
Airfare 2,704 3,528,321$ Books and Publications 2,231
Photographic/Art 859 Building R and M 290 Paper 137 City Wide Training 90
380,324$
City of GreshamIndirect Cost Rate ProposalYear Ended June 30, 2018
Department of Environmental Services Indirect Costs
For Use During Fiscal Year 2019-2020
39
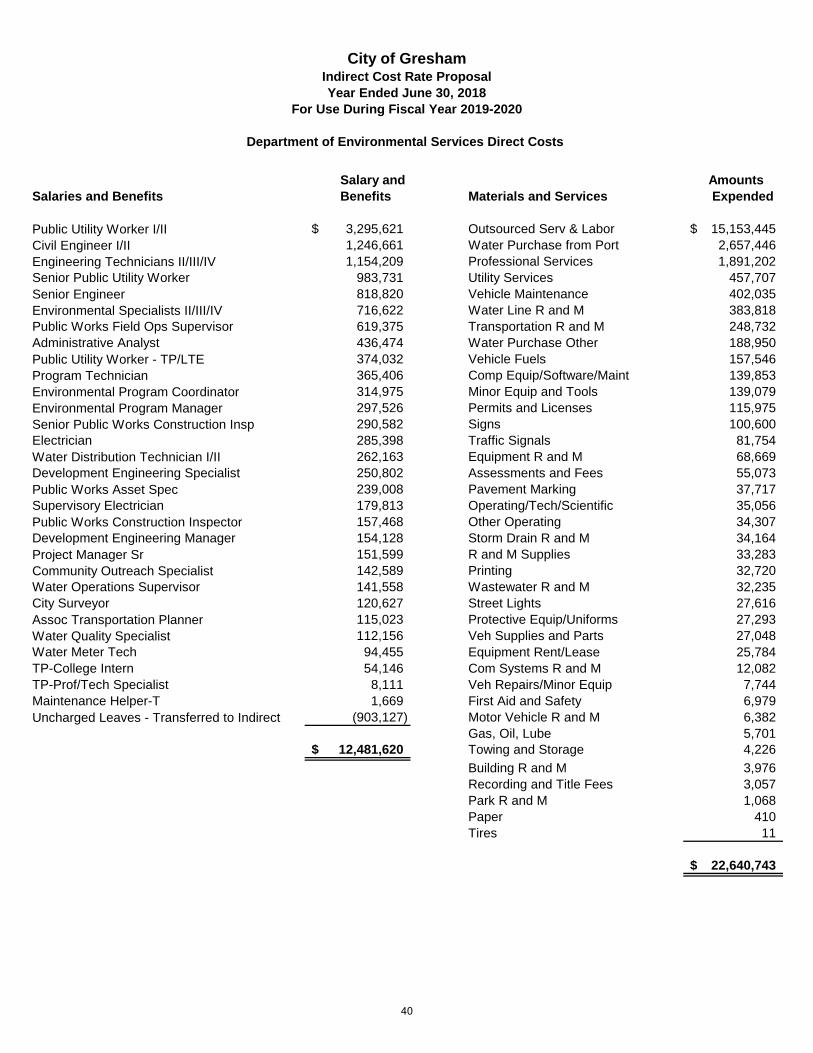
Salary and AmountsSalaries and Benefits Benefits Materials and Services Expended
Public Utility Worker I/II 3,295,621$ Outsourced Serv & Labor 15,153,445$ Civil Engineer I/II 1,246,661 Water Purchase from Port 2,657,446 Engineering Technicians II/III/IV 1,154,209 Professional Services 1,891,202 Senior Public Utility Worker 983,731 Utility Services 457,707 Senior Engineer 818,820 Vehicle Maintenance 402,035 Environmental Specialists II/III/IV 716,622 Water Line R and M 383,818 Public Works Field Ops Supervisor 619,375 Transportation R and M 248,732 Administrative Analyst 436,474 Water Purchase Other 188,950 Public Utility Worker - TP/LTE 374,032 Vehicle Fuels 157,546 Program Technician 365,406 Comp Equip/Software/Maint 139,853 Environmental Program Coordinator 314,975 Minor Equip and Tools 139,079 Environmental Program Manager 297,526 Permits and Licenses 115,975 Senior Public Works Construction Insp 290,582 Signs 100,600 Electrician 285,398 Traffic Signals 81,754 Water Distribution Technician I/II 262,163 Equipment R and M 68,669 Development Engineering Specialist 250,802 Assessments and Fees 55,073 Public Works Asset Spec 239,008 Pavement Marking 37,717 Supervisory Electrician 179,813 Operating/Tech/Scientific 35,056 Public Works Construction Inspector 157,468 Other Operating 34,307 Development Engineering Manager 154,128 Storm Drain R and M 34,164 Project Manager Sr 151,599 R and M Supplies 33,283 Community Outreach Specialist 142,589 Printing 32,720 Water Operations Supervisor 141,558 Wastewater R and M 32,235 City Surveyor 120,627 Street Lights 27,616 Assoc Transportation Planner 115,023 Protective Equip/Uniforms 27,293 Water Quality Specialist 112,156 Veh Supplies and Parts 27,048 Water Meter Tech 94,455 Equipment Rent/Lease 25,784 TP-College Intern 54,146 Com Systems R and M 12,082 TP-Prof/Tech Specialist 8,111 Veh Repairs/Minor Equip 7,744Maintenance Helper-T 1,669 First Aid and Safety 6,979Uncharged Leaves - Transferred to Indirect (903,127) Motor Vehicle R and M 6,382
Gas, Oil, Lube 5,70112,481,620$ Towing and Storage 4,226
Building R and M 3,976Recording and Title Fees 3,057Park R and M 1,068Paper 410Tires 11
22,640,743$
City of GreshamIndirect Cost Rate ProposalYear Ended June 30, 2018
Department of Environmental Services Direct Costs
For Use During Fiscal Year 2019-2020
40
CENTRAL SERVICE COST ALLOCATION PLAN
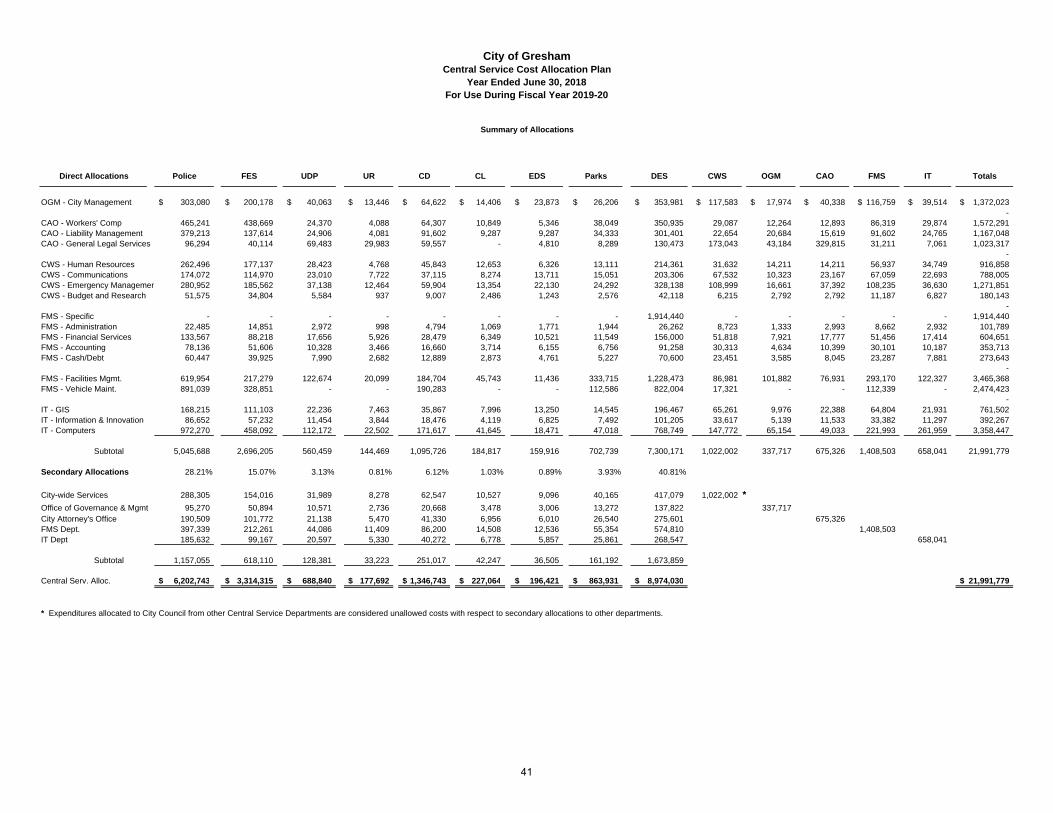
OGM - City Management 303,080$ 200,178$ 40,063$ 13,446$ 64,622$ 14,406$ 23,873$ 26,206$ 353,981$ 117,583$ 17,974$ 40,338$ 116,759$ 39,514$ 1,372,023$ -
CAO - Workers' Comp 465,241 438,669 24,370 4,088 64,307 10,849 5,346 38,049 350,935 29,087 12,264 12,893 86,319 29,874 1,572,291 CAO - Liability Management 379,213 137,614 24,906 4,081 91,602 9,287 9,287 34,333 301,401 22,654 20,684 15,619 91,602 24,765 1,167,048 CAO - General Legal Services 96,294 40,114 69,483 29,983 59,557 - 4,810 8,289 130,473 173,043 43,184 329,815 31,211 7,061 1,023,317
- CWS - Human Resources 262,496 177,137 28,423 4,768 45,843 12,653 6,326 13,111 214,361 31,632 14,211 14,211 56,937 34,749 916,858 CWS - Communications 174,072 114,970 23,010 7,722 37,115 8,274 13,711 15,051 203,306 67,532 10,323 23,167 67,059 22,693 788,005 CWS - Emergency Managemen 280,952 185,562 37,138 12,464 59,904 13,354 22,130 24,292 328,138 108,999 16,661 37,392 108,235 36,630 1,271,851 CWS - Budget and Research 51,575 34,804 5,584 937 9,007 2,486 1,243 2,576 42,118 6,215 2,792 2,792 11,187 6,827 180,143
- FMS - Specific - - - - - - - - 1,914,440 - - - - - 1,914,440 FMS - Administration 22,485 14,851 2,972 998 4,794 1,069 1,771 1,944 26,262 8,723 1,333 2,993 8,662 2,932 101,789 FMS - Financial Services 133,567 88,218 17,656 5,926 28,479 6,349 10,521 11,549 156,000 51,818 7,921 17,777 51,456 17,414 604,651 FMS - Accounting 78,136 51,606 10,328 3,466 16,660 3,714 6,155 6,756 91,258 30,313 4,634 10,399 30,101 10,187 353,713 FMS - Cash/Debt 60,447 39,925 7,990 2,682 12,889 2,873 4,761 5,227 70,600 23,451 3,585 8,045 23,287 7,881 273,643
- FMS - Facilities Mgmt. 619,954 217,279 122,674 20,099 184,704 45,743 11,436 333,715 1,228,473 86,981 101,882 76,931 293,170 122,327 3,465,368 FMS - Vehicle Maint. 891,039 328,851 - - 190,283 - - 112,586 822,004 17,321 - - 112,339 - 2,474,423
- IT - GIS 168,215 111,103 22,236 7,463 35,867 7,996 13,250 14,545 196,467 65,261 9,976 22,388 64,804 21,931 761,502 IT - Information & Innovation 86,652 57,232 11,454 3,844 18,476 4,119 6,825 7,492 101,205 33,617 5,139 11,533 33,382 11,297 392,267 IT - Computers 972,270 458,092 112,172 22,502 171,617 41,645 18,471 47,018 768,749 147,772 65,154 49,033 221,993 261,959 3,358,447
Subtotal 5,045,688 2,696,205 560,459 144,469 1,095,726 184,817 159,916 702,739 7,300,171 1,022,002 337,717 675,326 1,408,503 658,041 21,991,779
Secondary Allocations 28.21% 15.07% 3.13% 0.81% 6.12% 1.03% 0.89% 3.93% 40.81%
City-wide Services 288,305 154,016 31,989 8,278 62,547 10,527 9,096 40,165 417,079 1,022,002 *Office of Governance & Mgmt 95,270 50,894 10,571 2,736 20,668 3,478 3,006 13,272 137,822 337,717 City Attorney's Office 190,509 101,772 21,138 5,470 41,330 6,956 6,010 26,540 275,601 675,326 FMS Dept. 397,339 212,261 44,086 11,409 86,200 14,508 12,536 55,354 574,810 1,408,503 IT Dept 185,632 99,167 20,597 5,330 40,272 6,778 5,857 25,861 268,547 658,041
Subtotal 1,157,055 618,110 128,381 33,223 251,017 42,247 36,505 161,192 1,673,859
Central Serv. Alloc. 6,202,743$ 3,314,315$ 688,840$ 177,692$ 1,346,743$ 227,064$ 196,421$ 863,931$ 8,974,030$ 21,991,779$
* Expenditures allocated to City Council from other Central Service Departments are considered unallowed costs with respect to secondary allocations to other departments.
Direct Allocations FESPolice UR ParksEDSUDP CL TotalsFMSCAO ITOGM
City of GreshamCentral Service Cost Allocation Plan
Year Ended June 30, 2018For Use During Fiscal Year 2019-20
Summary of Allocations
CD DES CWS
41
Office of Governance & Management
MISSION STATEMENT Strategically guide the organization by providing leadership and facilitating community participation in government. Proactively partner with customers, deliver quality service, create innovative solutions and promote mutual respect and diversity. GENERAL DESCRIPTION The Office of Governance & Management (OGM) consists of the Mayor and Council, who are elected by the citizens and supported by the appointed City Manager. The City Manager carries out Council policy by coordinating overall operations of city services and implementing public policy and directing the affairs of the City in support the City Council’s goals and objectives. OGM supports the Mayor and Council by assisting elected officials in policy development and external governmental matters, providing citywide coordination of major new development initiatives and directing effective legislative strategies to advance and protect the interests of the City of Gresham. In addition, OGM also provides citywide services in the areas of organizational planning and improvement, organizational compliance, community outreach, recording services, public information, internal communications, human resources, budget preparation, financial planning, mediation services, emergency management and preparedness, and neighborhood and volunteer programs.
For budgeting purposes, OGM is displayed as three separate departments. This is intended to better illustrate the different functions and types of services provided by each department.
The three areas are:
Governance and Administration
Citywide Services
Community Livability
42
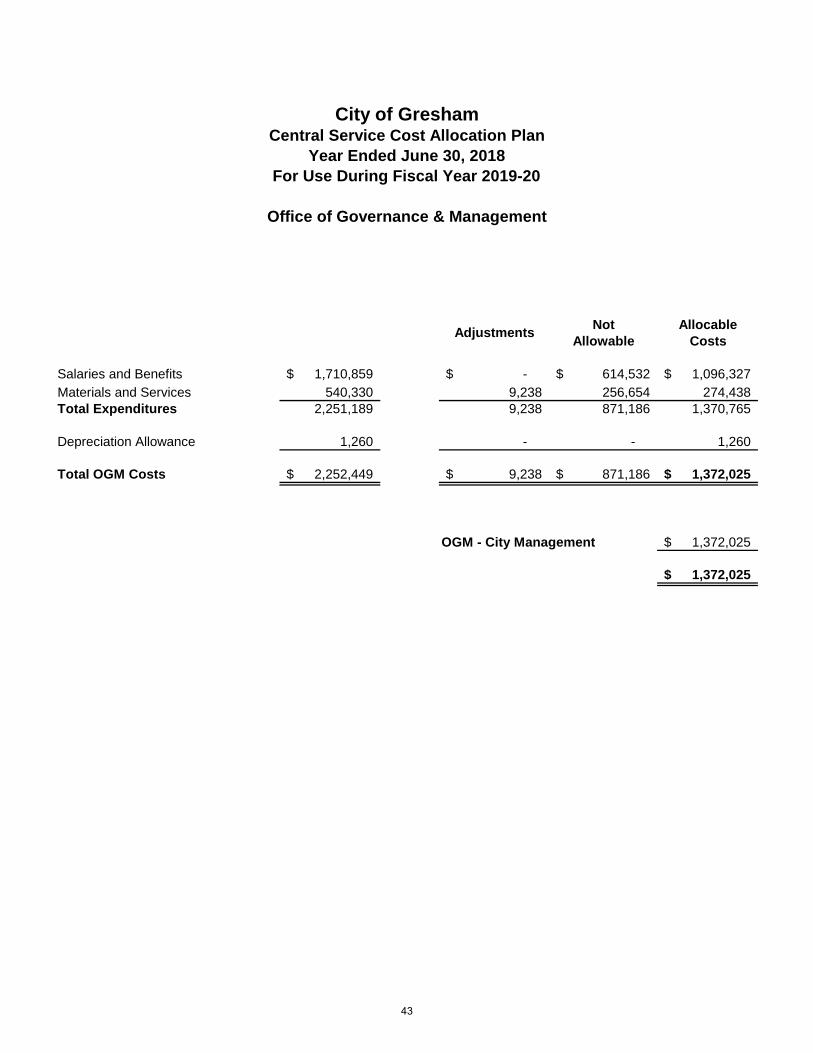
Not AllocableAllowable Costs
Salaries and Benefits 1,710,859$ -$ 614,532$ 1,096,327$ Materials and Services 540,330 9,238 256,654 274,438 Total Expenditures 2,251,189 9,238 871,186 1,370,765
Depreciation Allowance 1,260 - - 1,260
Total OGM Costs 2,252,449$ 9,238$ 871,186$ 1,372,025$
OGM - City Management 1,372,025$
1,372,025$
City of GreshamCentral Service Cost Allocation Plan
Year Ended June 30, 2018
Office of Governance & Management
Adjustments
For Use During Fiscal Year 2019-20
43
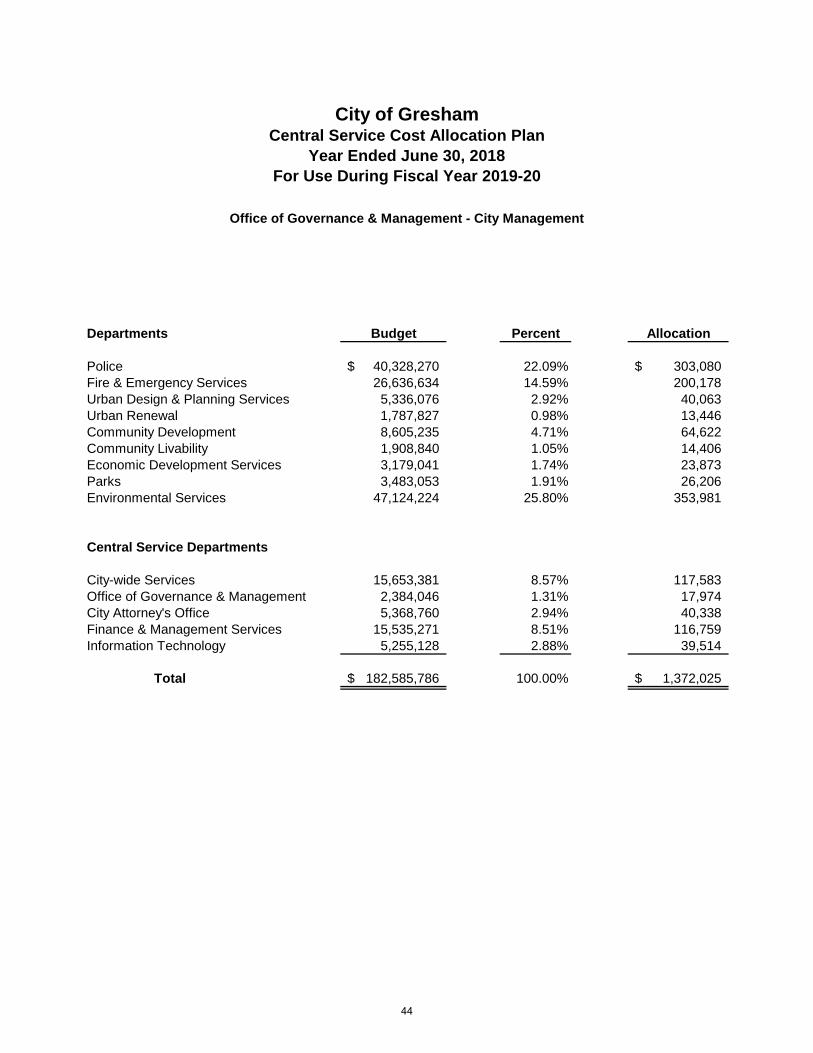
Budget Percent Allocation
Police 40,328,270$ 22.09% 303,080$ Fire & Emergency Services 26,636,634 14.59% 200,178 Urban Design & Planning Services 5,336,076 2.92% 40,063 Urban Renewal 1,787,827 0.98% 13,446 Community Development 8,605,235 4.71% 64,622 Community Livability 1,908,840 1.05% 14,406 Economic Development Services 3,179,041 1.74% 23,873 Parks 3,483,053 1.91% 26,206 Environmental Services 47,124,224 25.80% 353,981
Central Service Departments
City-wide Services 15,653,381 8.57% 117,583 Office of Governance & Management 2,384,046 1.31% 17,974 City Attorney's Office 5,368,760 2.94% 40,338 Finance & Management Services 15,535,271 8.51% 116,759 Information Technology 5,255,128 2.88% 39,514
Total 182,585,786$ 100.00% 1,372,025$
Departments
City of GreshamCentral Service Cost Allocation Plan
Year Ended June 30, 2018
Office of Governance & Management - City Management
For Use During Fiscal Year 2019-20
44
City Attorney’s Office
MISSION STATEMENT Identify, anticipate, and respond to the legal needs of the City by providing high quality, timely, and cost-effective legal and risk management services. GENERAL DESCRIPTION The City Attorney’s Office (CAO) provides services to the Council, City Manager, Service Area Managers, and staff, and Council Citizen Advisory Committees. Services include legal advice and opinions, the creation, review, and approval of all written contracts and legal documents, the preparation of ordinances, resolutions, and other documents, the defense and representation of City Officers and employees, the initiation of legal action as directed by Council, citywide legal training and supervision of outside legal counsel.
Risk Management is responsible for the liability insurance program, self-insured workers’ compensation program, property insurance, loss control, OR-OSHA compliance, and citywide safety issues. Risk Management will continue their efforts to make safety and loss control a priority in the day to day operations of the organization. The City Manager and City Attorney are committed to raising staff awareness of risk, safety and liability issues, and implementing operational changes where warranted.
45
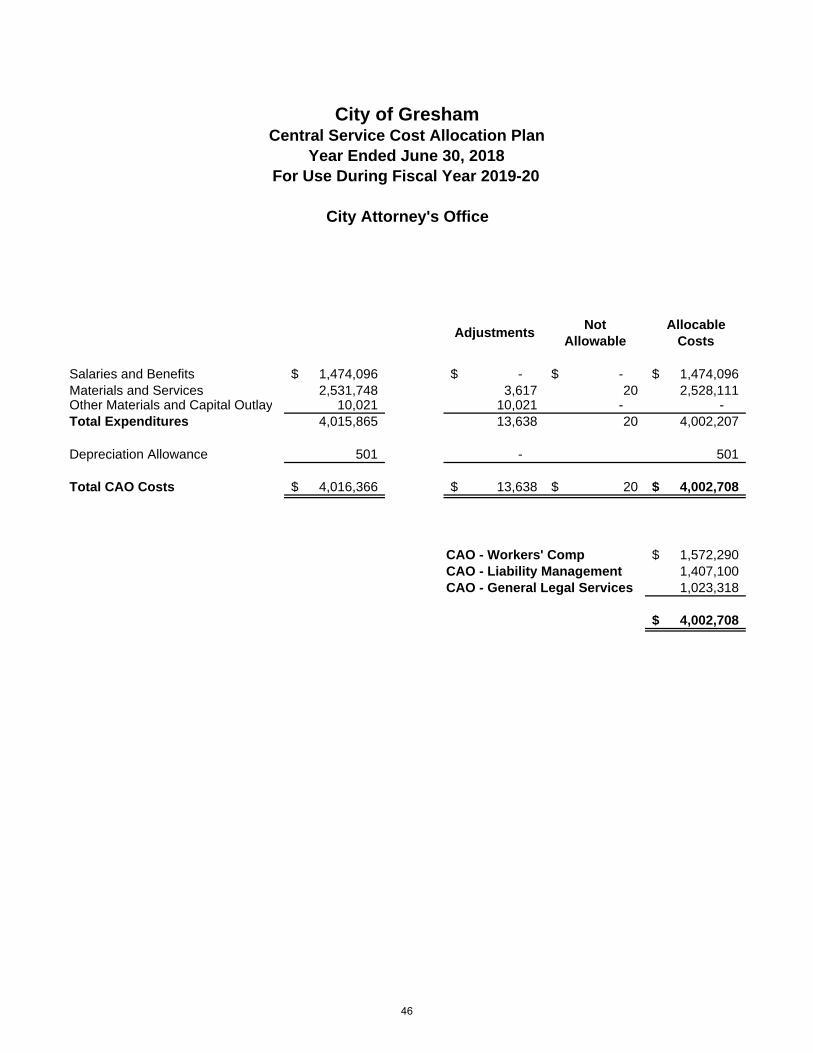
Not AllocableAllowable Costs
Salaries and Benefits 1,474,096$ -$ -$ 1,474,096$ Materials and Services 2,531,748 3,617 20 2,528,111 Other Materials and Capital Outlay 10,021 10,021 - - Total Expenditures 4,015,865 13,638 20 4,002,207
Depreciation Allowance 501 - 501
Total CAO Costs 4,016,366$ 13,638$ 20$ 4,002,708$
CAO - Workers' Comp 1,572,290$ CAO - Liability Management 1,407,100 CAO - General Legal Services 1,023,318
4,002,708$
City of GreshamCentral Service Cost Allocation Plan
Year Ended June 30, 2018
City Attorney's Office
Adjustments
For Use During Fiscal Year 2019-20
46
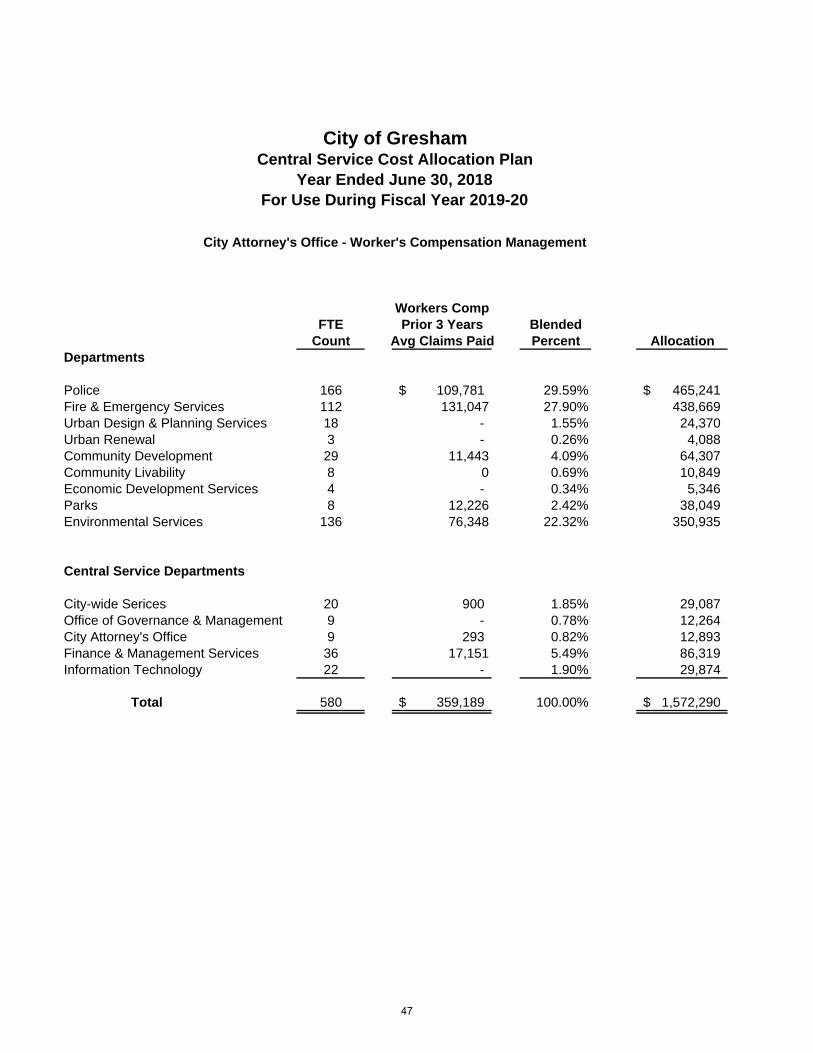
Workers CompFTE Prior 3 Years Blended
Count Avg Claims Paid Percent Allocation
Police 166 109,781$ 29.59% 465,241$ Fire & Emergency Services 112 131,047 27.90% 438,669 Urban Design & Planning Services 18 - 1.55% 24,370 Urban Renewal 3 - 0.26% 4,088 Community Development 29 11,443 4.09% 64,307 Community Livability 8 0 0.69% 10,849 Economic Development Services 4 - 0.34% 5,346 Parks 8 12,226 2.42% 38,049 Environmental Services 136 76,348 22.32% 350,935
City-wide Serices 20 900 1.85% 29,087 Office of Governance & Management 9 - 0.78% 12,264 City Attorney's Office 9 293 0.82% 12,893 Finance & Management Services 36 17,151 5.49% 86,319 Information Technology 22 - 1.90% 29,874
Total 580 359,189$ 100.00% 1,572,290$
Central Service Departments
City of GreshamCentral Service Cost Allocation Plan
Year Ended June 30, 2018
City Attorney's Office - Worker's Compensation Management
For Use During Fiscal Year 2019-20
Departments
47
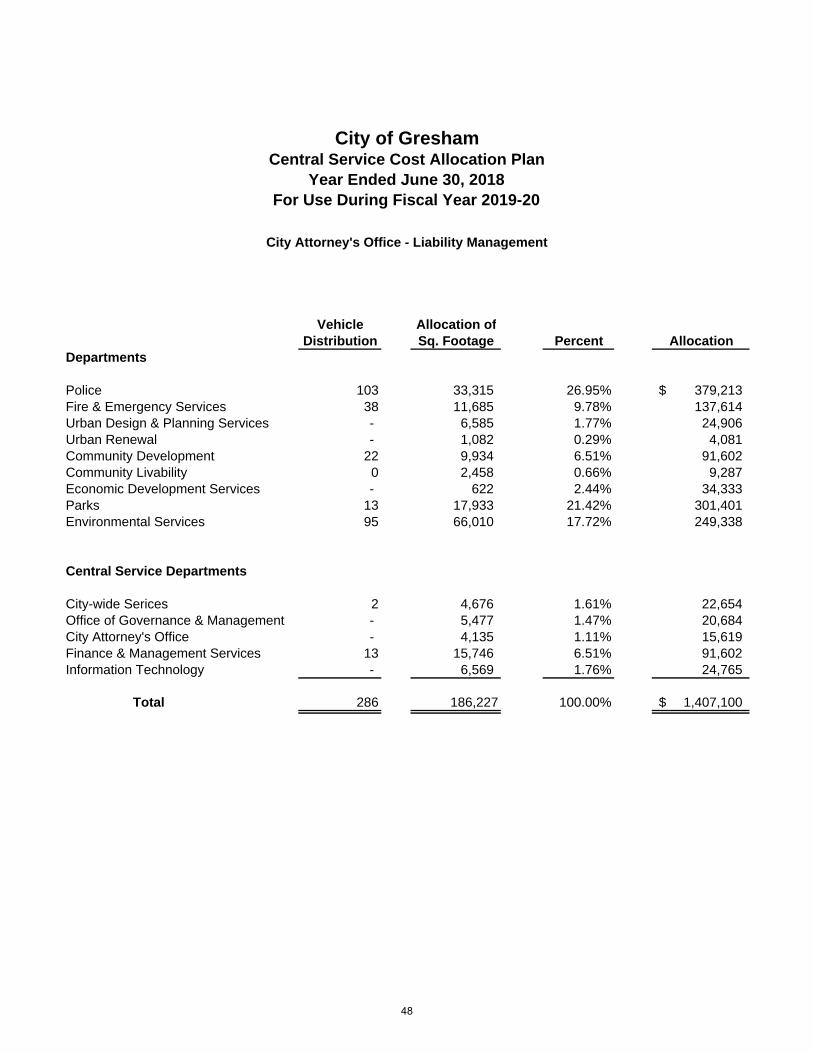
Vehicle Allocation ofDistribution Sq. Footage Percent Allocation
Police 103 33,315 26.95% 379,213$ Fire & Emergency Services 38 11,685 9.78% 137,614 Urban Design & Planning Services - 6,585 1.77% 24,906 Urban Renewal - 1,082 0.29% 4,081 Community Development 22 9,934 6.51% 91,602 Community Livability 0 2,458 0.66% 9,287 Economic Development Services - 622 2.44% 34,333 Parks 13 17,933 21.42% 301,401 Environmental Services 95 66,010 17.72% 249,338
City-wide Serices 2 4,676 1.61% 22,654 Office of Governance & Management - 5,477 1.47% 20,684 City Attorney's Office - 4,135 1.11% 15,619 Finance & Management Services 13 15,746 6.51% 91,602 Information Technology - 6,569 1.76% 24,765
Total 286 186,227 100.00% 1,407,100$
Central Service Departments
City of GreshamCentral Service Cost Allocation Plan
Year Ended June 30, 2018
City Attorney's Office - Liability Management
For Use During Fiscal Year 2019-20
Departments
48
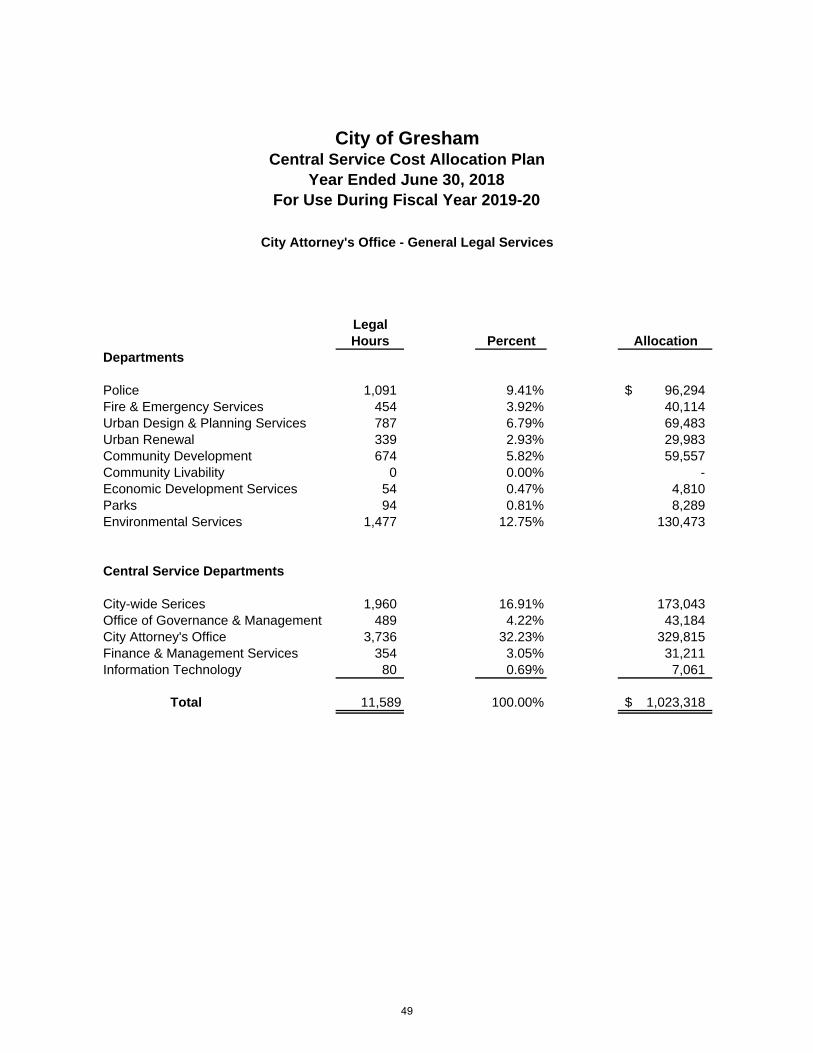
LegalHours Percent Allocation
Police 1,091 9.41% 96,294$ Fire & Emergency Services 454 3.92% 40,114 Urban Design & Planning Services 787 6.79% 69,483 Urban Renewal 339 2.93% 29,983 Community Development 674 5.82% 59,557 Community Livability 0 0.00% - Economic Development Services 54 0.47% 4,810 Parks 94 0.81% 8,289 Environmental Services 1,477 12.75% 130,473
City-wide Serices 1,960 16.91% 173,043 Office of Governance & Management 489 4.22% 43,184 City Attorney's Office 3,736 32.23% 329,815 Finance & Management Services 354 3.05% 31,211 Information Technology 80 0.69% 7,061
Total 11,589 100.00% 1,023,318$
Central Service Departments
City of GreshamCentral Service Cost Allocation Plan
Year Ended June 30, 2018
City Attorney's Office - General Legal Services
For Use During Fiscal Year 2019-20
Departments
49
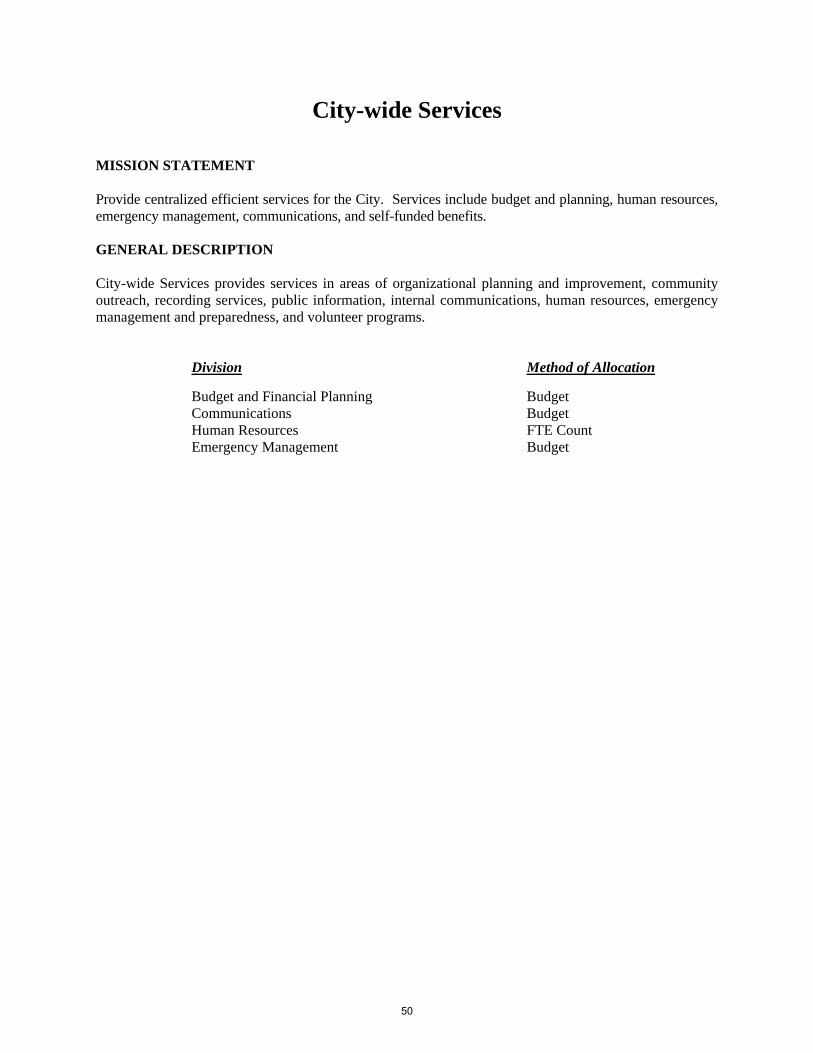
City-wide Services MISSION STATEMENT Provide centralized efficient services for the City. Services include budget and planning, human resources, emergency management, communications, and self-funded benefits. GENERAL DESCRIPTION City-wide Services provides services in areas of organizational planning and improvement, community outreach, recording services, public information, internal communications, human resources, emergency management and preparedness, and volunteer programs.
Division Method of Allocation
Budget and Financial Planning Budget Communications Budget Human Resources FTE Count Emergency Management Budget
50
Not AllocableAllowable Costs
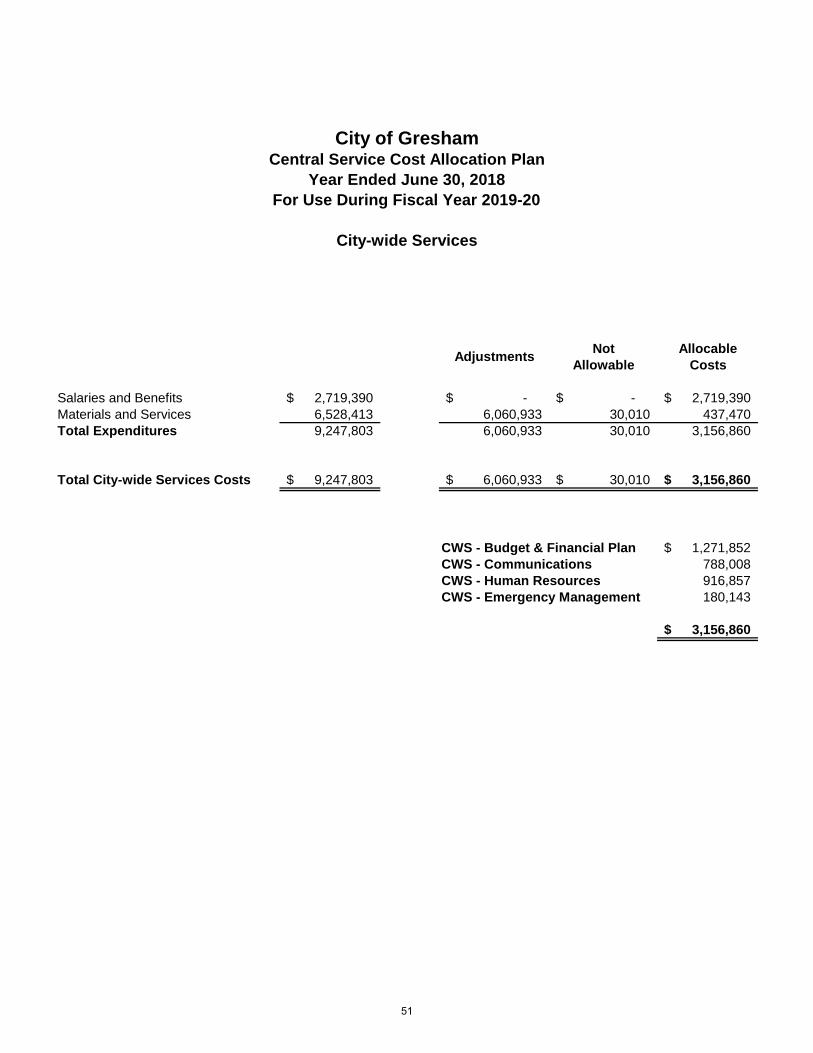
Salaries and Benefits 2,719,390$ -$ -$ 2,719,390$ Materials and Services 6,528,413 6,060,933 30,010 437,470 Total Expenditures 9,247,803 6,060,933 30,010 3,156,860
Total City-wide Services Costs 9,247,803$ 6,060,933$ 30,010$ 3,156,860$
CWS - Budget & Financial Plan 1,271,852$ CWS - Communications 788,008 CWS - Human Resources 916,857 CWS - Emergency Management 180,143
3,156,860$
City of GreshamCentral Service Cost Allocation Plan
Year Ended June 30, 2018For Use During Fiscal Year 2019-20
City-wide Services
Adjustments
51
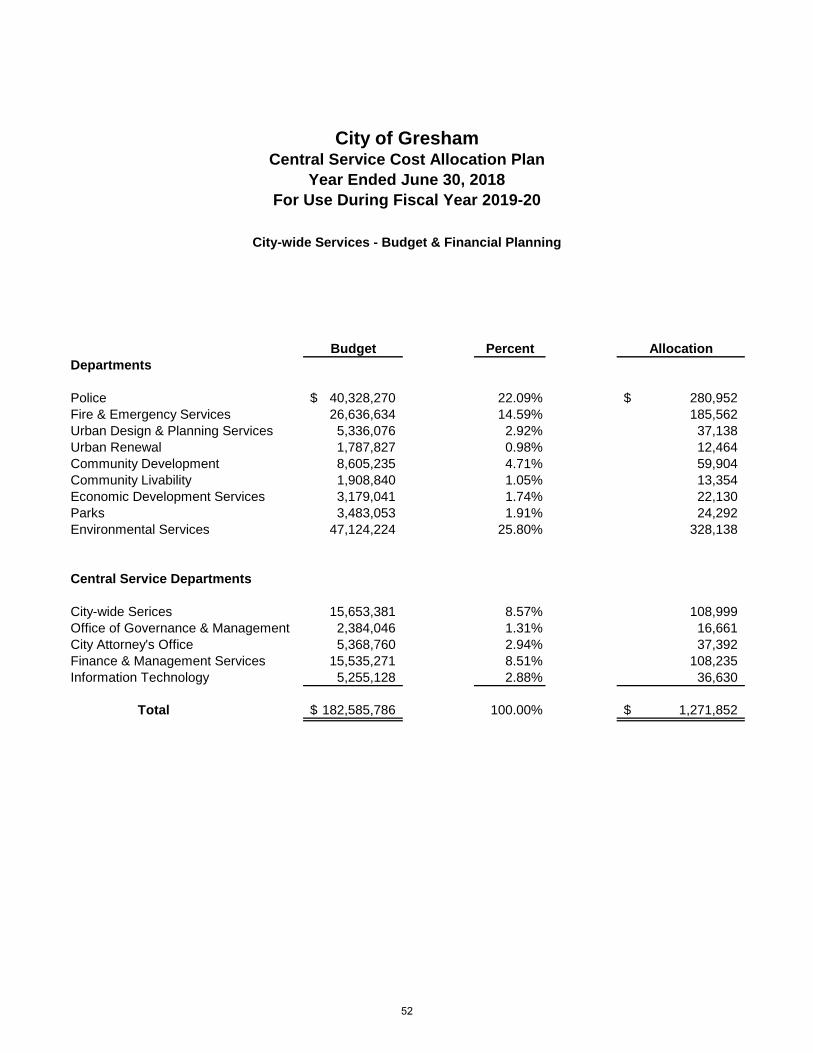
Budget Percent Allocation
Police 40,328,270$ 22.09% 280,952$ Fire & Emergency Services 26,636,634 14.59% 185,562 Urban Design & Planning Services 5,336,076 2.92% 37,138 Urban Renewal 1,787,827 0.98% 12,464 Community Development 8,605,235 4.71% 59,904 Community Livability 1,908,840 1.05% 13,354 Economic Development Services 3,179,041 1.74% 22,130 Parks 3,483,053 1.91% 24,292 Environmental Services 47,124,224 25.80% 328,138
City-wide Serices 15,653,381 8.57% 108,999 Office of Governance & Management 2,384,046 1.31% 16,661 City Attorney's Office 5,368,760 2.94% 37,392 Finance & Management Services 15,535,271 8.51% 108,235 Information Technology 5,255,128 2.88% 36,630
Total 182,585,786$ 100.00% 1,271,852$
Departments
Central Service Departments
City of GreshamCentral Service Cost Allocation Plan
Year Ended June 30, 2018
City-wide Services - Budget & Financial Planning
For Use During Fiscal Year 2019-20
52
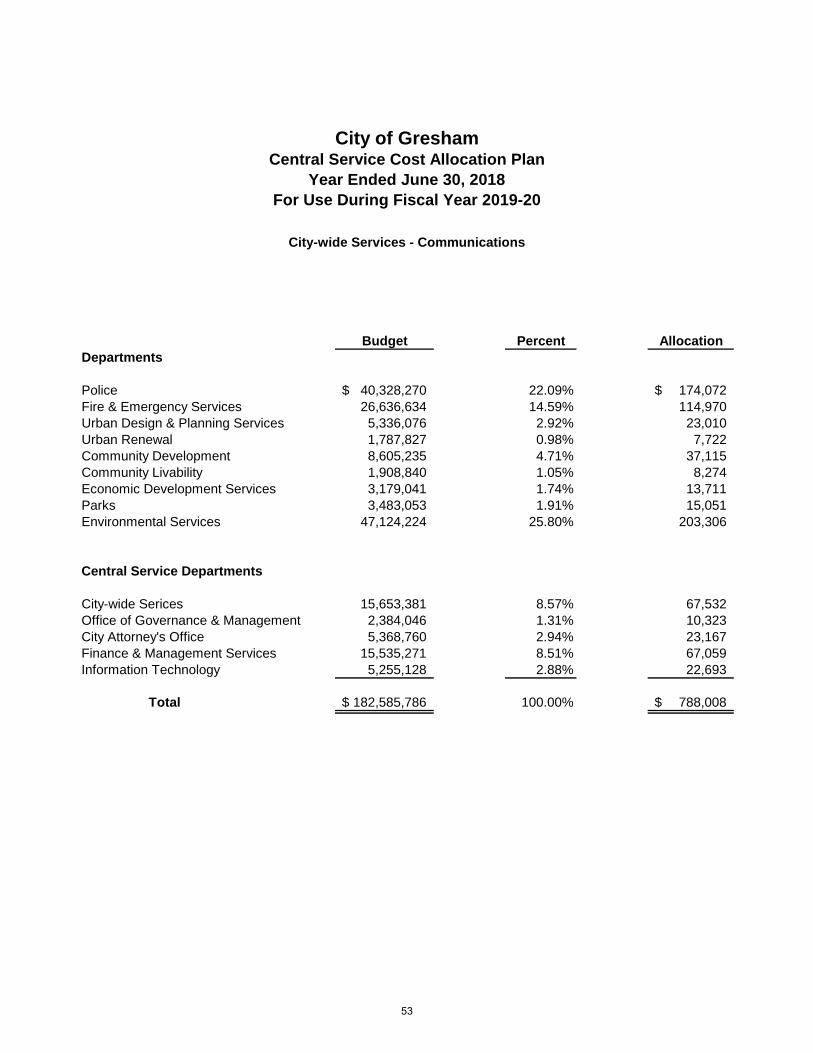
Budget Percent Allocation
Police 40,328,270$ 22.09% 174,072$ Fire & Emergency Services 26,636,634 14.59% 114,970 Urban Design & Planning Services 5,336,076 2.92% 23,010 Urban Renewal 1,787,827 0.98% 7,722 Community Development 8,605,235 4.71% 37,115 Community Livability 1,908,840 1.05% 8,274 Economic Development Services 3,179,041 1.74% 13,711 Parks 3,483,053 1.91% 15,051 Environmental Services 47,124,224 25.80% 203,306
City-wide Serices 15,653,381 8.57% 67,532 Office of Governance & Management 2,384,046 1.31% 10,323 City Attorney's Office 5,368,760 2.94% 23,167 Finance & Management Services 15,535,271 8.51% 67,059 Information Technology 5,255,128 2.88% 22,693
Total 182,585,786$ 100.00% 788,008$
Central Service Departments
City of GreshamCentral Service Cost Allocation Plan
Year Ended June 30, 2018For Use During Fiscal Year 2019-20
City-wide Services - Communications
Departments
53
FTECount Percent Allocation
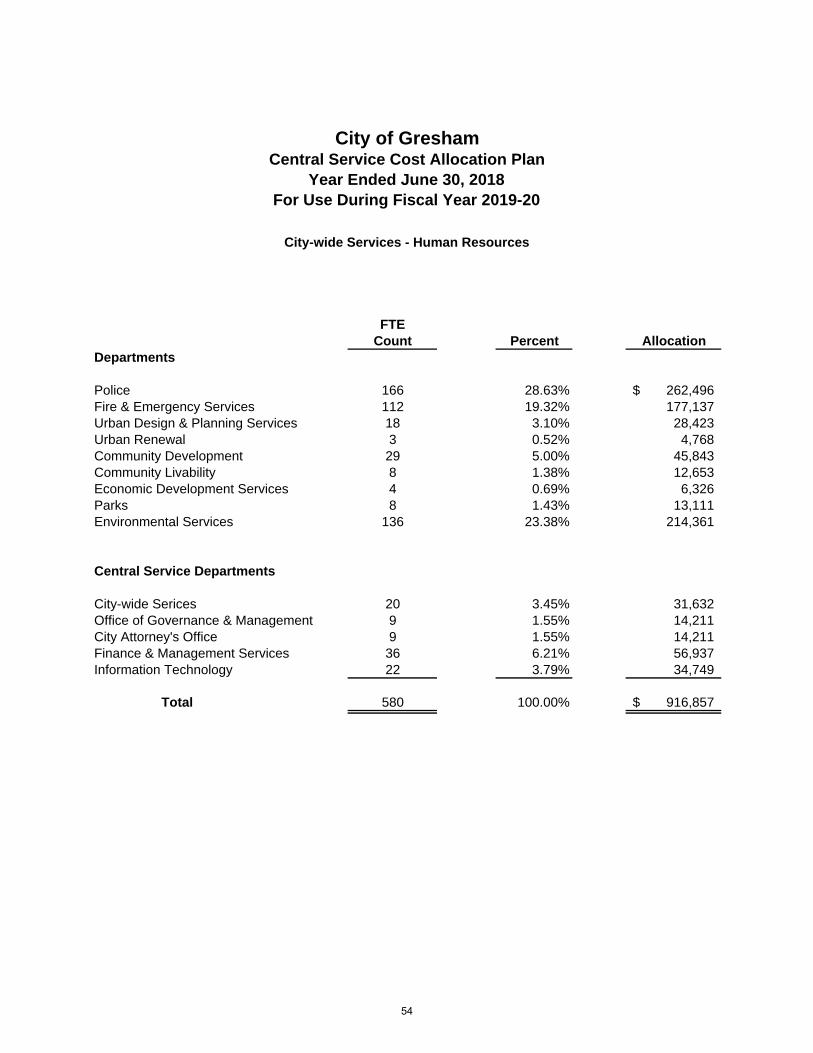
Police 166 28.63% 262,496$ Fire & Emergency Services 112 19.32% 177,137 Urban Design & Planning Services 18 3.10% 28,423 Urban Renewal 3 0.52% 4,768 Community Development 29 5.00% 45,843 Community Livability 8 1.38% 12,653 Economic Development Services 4 0.69% 6,326 Parks 8 1.43% 13,111 Environmental Services 136 23.38% 214,361
City-wide Serices 20 3.45% 31,632 Office of Governance & Management 9 1.55% 14,211 City Attorney's Office 9 1.55% 14,211 Finance & Management Services 36 6.21% 56,937 Information Technology 22 3.79% 34,749
Total 580 100.00% 916,857$
Central Service Departments
Departments
City of GreshamCentral Service Cost Allocation Plan
Year Ended June 30, 2018
City-wide Services - Human Resources
For Use During Fiscal Year 2019-20
54
FTECount Percent Allocation
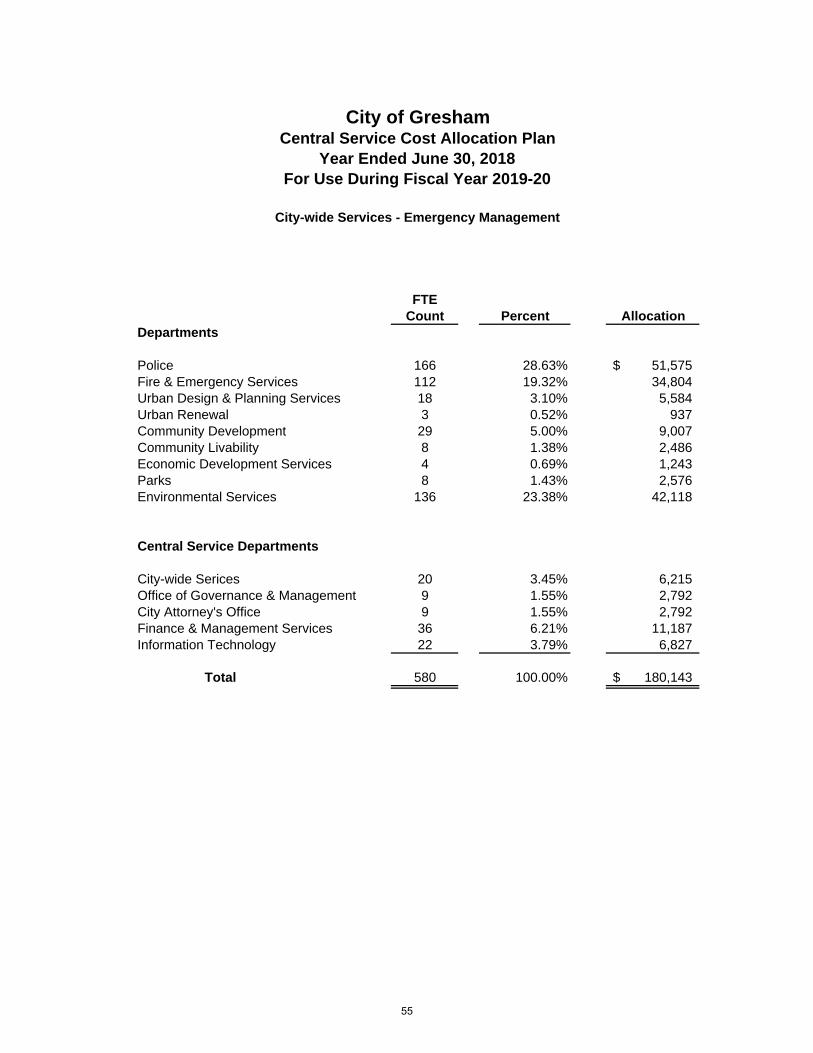
Police 166 28.63% 51,575$ Fire & Emergency Services 112 19.32% 34,804 Urban Design & Planning Services 18 3.10% 5,584 Urban Renewal 3 0.52% 937 Community Development 29 5.00% 9,007 Community Livability 8 1.38% 2,486 Economic Development Services 4 0.69% 1,243 Parks 8 1.43% 2,576 Environmental Services 136 23.38% 42,118
City-wide Serices 20 3.45% 6,215 Office of Governance & Management 9 1.55% 2,792 City Attorney's Office 9 1.55% 2,792 Finance & Management Services 36 6.21% 11,187 Information Technology 22 3.79% 6,827
Total 580 100.00% 180,143$
Central Service Departments
City of GreshamCentral Service Cost Allocation Plan
Year Ended June 30, 2018For Use During Fiscal Year 2019-20
City-wide Services - Emergency Management
Departments
55
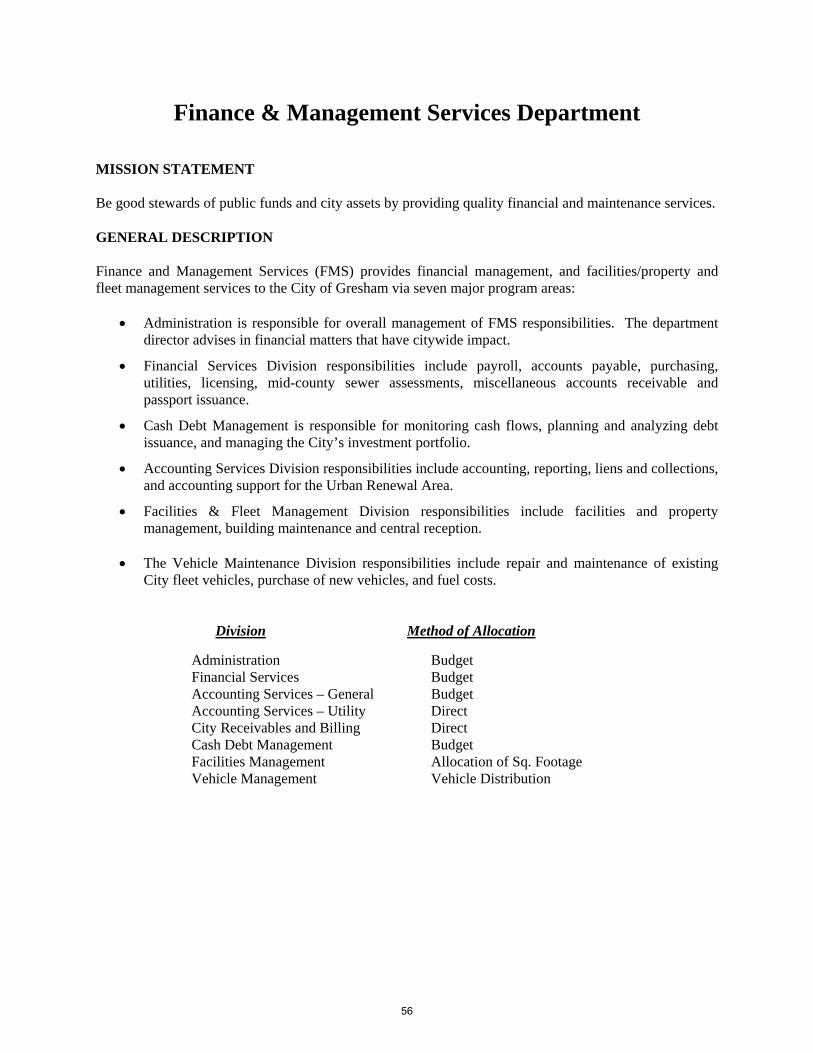
Finance & Management Services Department MISSION STATEMENT Be good stewards of public funds and city assets by providing quality financial and maintenance services. GENERAL DESCRIPTION Finance and Management Services (FMS) provides financial management, and facilities/property and fleet management services to the City of Gresham via seven major program areas:
Administration is responsible for overall management of FMS responsibilities. The department director advises in financial matters that have citywide impact.
Financial Services Division responsibilities include payroll, accounts payable, purchasing, utilities, licensing, mid-county sewer assessments, miscellaneous accounts receivable and passport issuance.
Cash Debt Management is responsible for monitoring cash flows, planning and analyzing debt issuance, and managing the City’s investment portfolio.
Accounting Services Division responsibilities include accounting, reporting, liens and collections, and accounting support for the Urban Renewal Area.
Facilities & Fleet Management Division responsibilities include facilities and property management, building maintenance and central reception.
The Vehicle Maintenance Division responsibilities include repair and maintenance of existing
City fleet vehicles, purchase of new vehicles, and fuel costs.
Division Method of Allocation
Administration Budget Financial Services Budget Accounting Services – General Budget Accounting Services – Utility Direct City Receivables and Billing Direct Cash Debt Management Budget Facilities Management Allocation of Sq. Footage Vehicle Management Vehicle Distribution
56
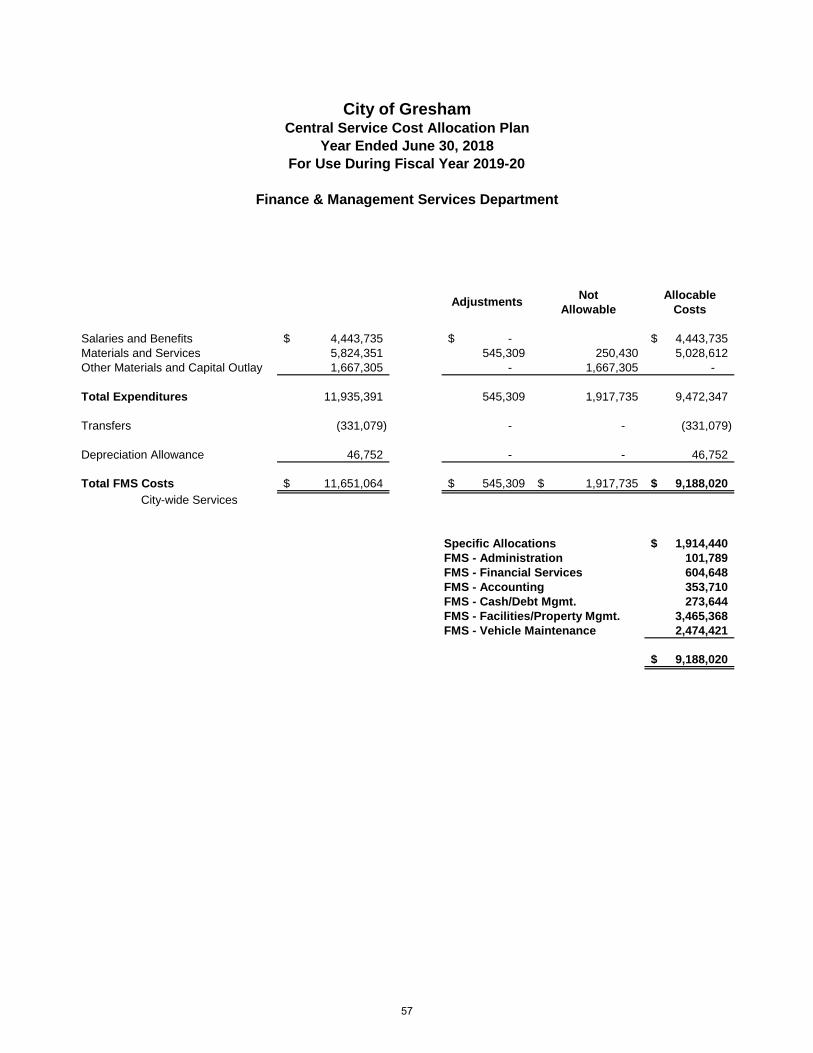
Not AllocableAllowable Costs
Salaries and Benefits 4,443,735$ -$ 4,443,735$ Materials and Services 5,824,351 545,309 250,430 5,028,612 Other Materials and Capital Outlay 1,667,305 - 1,667,305 -
Total Expenditures 11,935,391 545,309 1,917,735 9,472,347
Transfers (331,079) - - (331,079)
Depreciation Allowance 46,752 - - 46,752
Total FMS Costs 11,651,064$ 545,309$ 1,917,735$ 9,188,020$ City-wide Services
Specific Allocations 1,914,440$ FMS - Administration 101,789 FMS - Financial Services 604,648 FMS - Accounting 353,710 FMS - Cash/Debt Mgmt. 273,644 FMS - Facilities/Property Mgmt. 3,465,368 FMS - Vehicle Maintenance 2,474,421
9,188,020$
Adjustments
City of GreshamCentral Service Cost Allocation Plan
Year Ended June 30, 2018
Finance & Management Services Department
For Use During Fiscal Year 2019-20
57
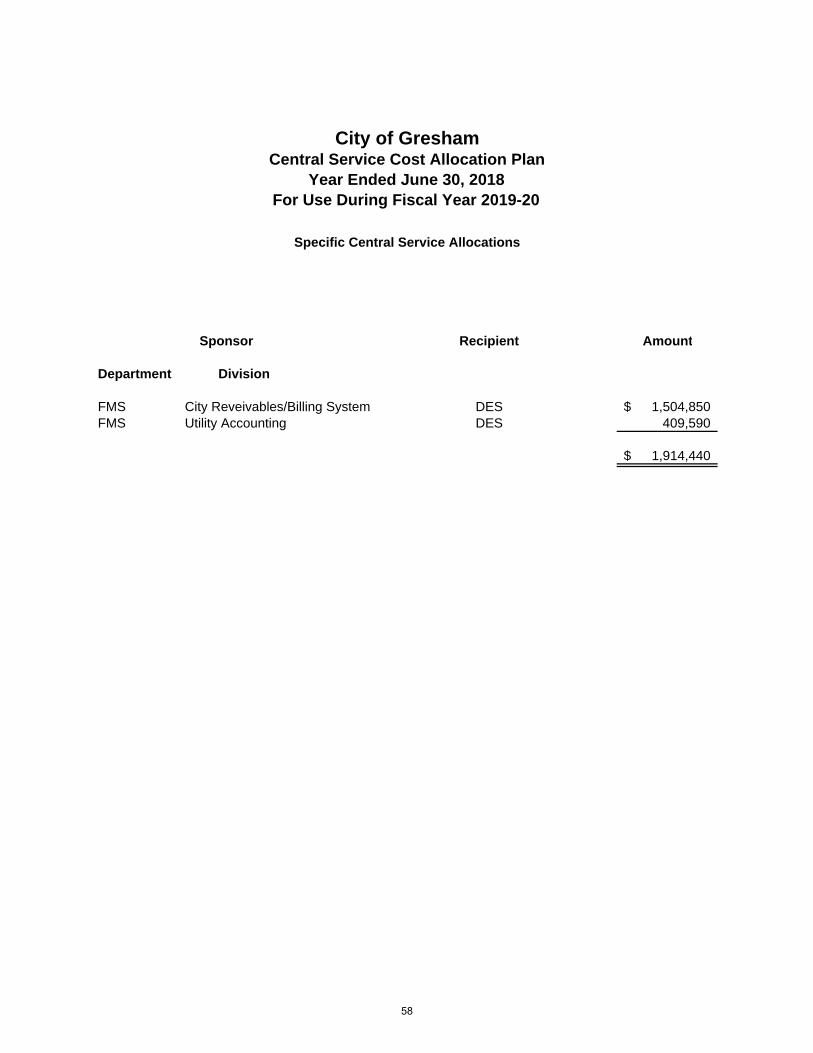
Recipient Amount
Department Division
FMS City Reveivables/Billing System DES 1,504,850$ FMS Utility Accounting DES 409,590
1,914,440$
Sponsor
City of GreshamCentral Service Cost Allocation Plan
Year Ended June 30, 2018
Specific Central Service Allocations
For Use During Fiscal Year 2019-20
58
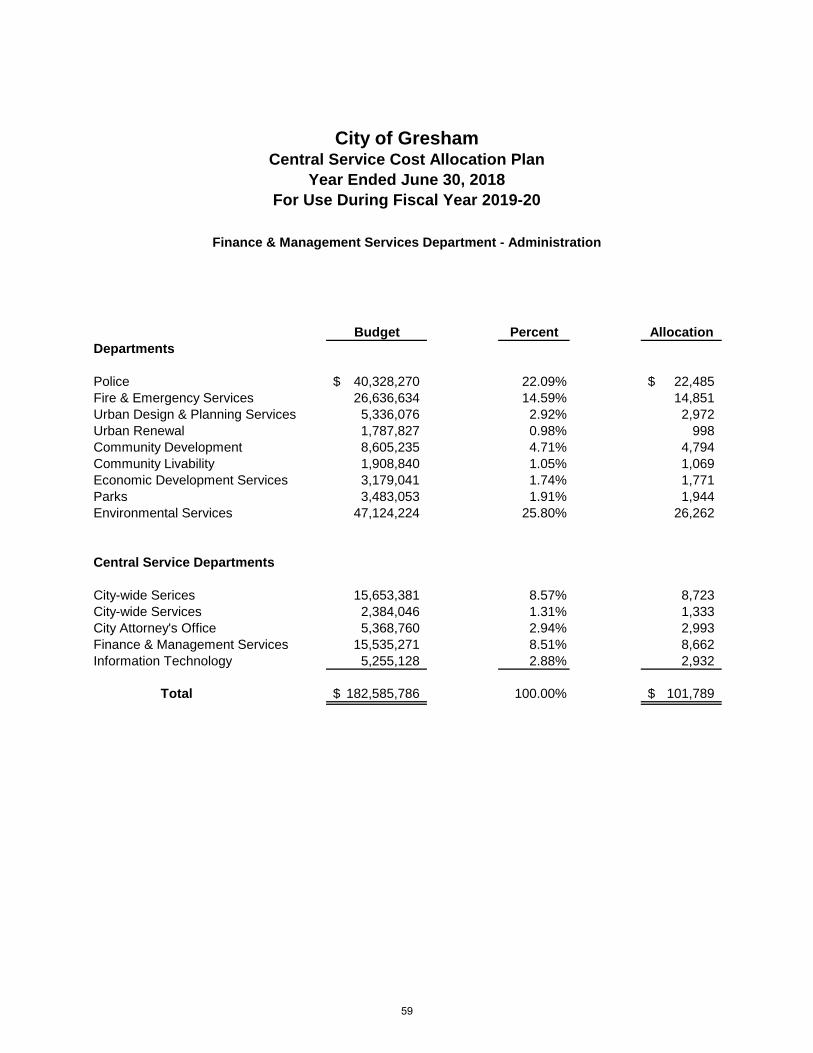
Budget Percent Allocation
Police 40,328,270$ 22.09% 22,485$ Fire & Emergency Services 26,636,634 14.59% 14,851 Urban Design & Planning Services 5,336,076 2.92% 2,972 Urban Renewal 1,787,827 0.98% 998 Community Development 8,605,235 4.71% 4,794 Community Livability 1,908,840 1.05% 1,069 Economic Development Services 3,179,041 1.74% 1,771 Parks 3,483,053 1.91% 1,944 Environmental Services 47,124,224 25.80% 26,262
City-wide Serices 15,653,381 8.57% 8,723 City-wide Services 2,384,046 1.31% 1,333 City Attorney's Office 5,368,760 2.94% 2,993 Finance & Management Services 15,535,271 8.51% 8,662 Information Technology 5,255,128 2.88% 2,932
Total 182,585,786$ 100.00% 101,789$
Central Service Departments
City of GreshamCentral Service Cost Allocation Plan
Year Ended June 30, 2018
Finance & Management Services Department - Administration
For Use During Fiscal Year 2019-20
Departments
59
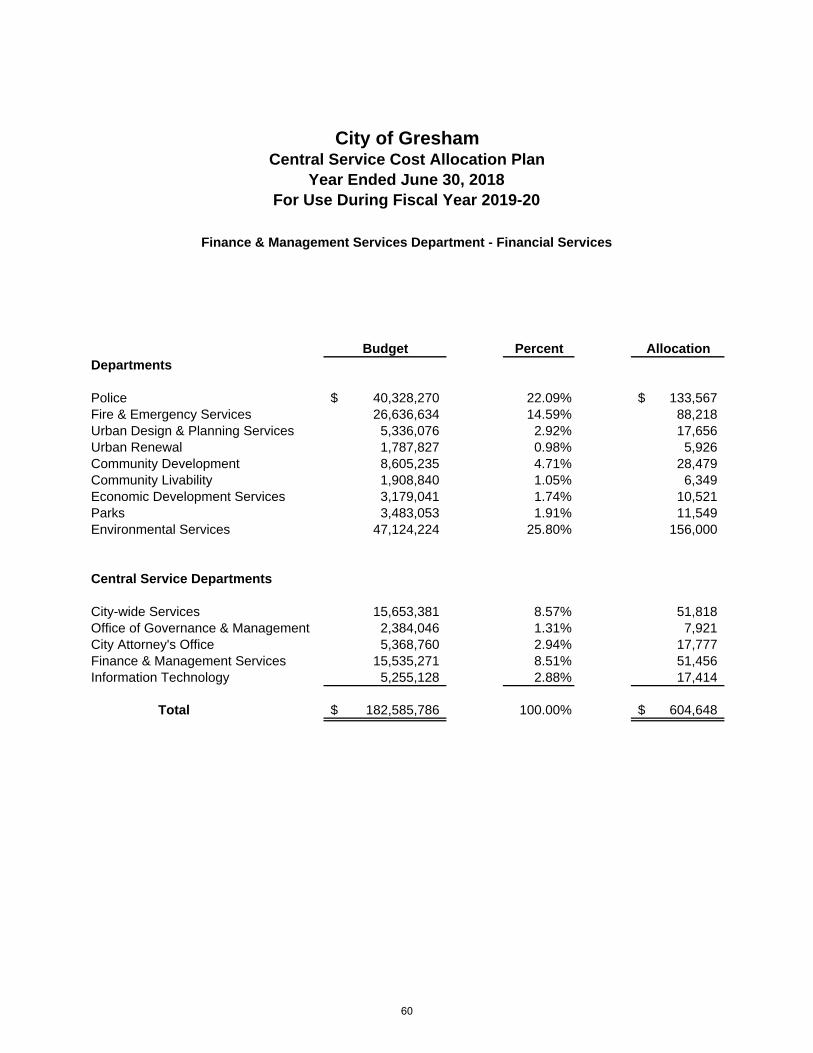
Budget Percent Allocation
Police 40,328,270$ 22.09% 133,567$ Fire & Emergency Services 26,636,634 14.59% 88,218 Urban Design & Planning Services 5,336,076 2.92% 17,656 Urban Renewal 1,787,827 0.98% 5,926 Community Development 8,605,235 4.71% 28,479 Community Livability 1,908,840 1.05% 6,349 Economic Development Services 3,179,041 1.74% 10,521 Parks 3,483,053 1.91% 11,549 Environmental Services 47,124,224 25.80% 156,000
City-wide Services 15,653,381 8.57% 51,818 Office of Governance & Management 2,384,046 1.31% 7,921 City Attorney's Office 5,368,760 2.94% 17,777 Finance & Management Services 15,535,271 8.51% 51,456 Information Technology 5,255,128 2.88% 17,414
Total 182,585,786$ 100.00% 604,648$
Departments
Central Service Departments
City of GreshamCentral Service Cost Allocation Plan
Year Ended June 30, 2018
Finance & Management Services Department - Financial Services
For Use During Fiscal Year 2019-20
60
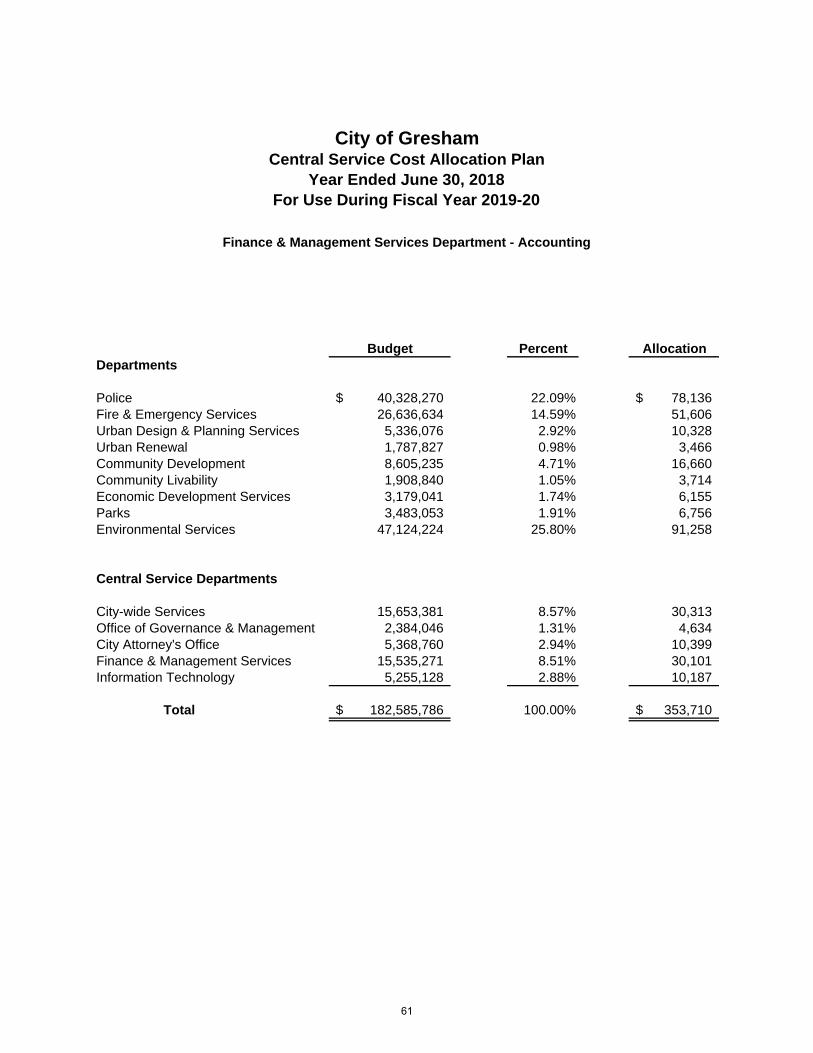
Budget Percent Allocation
Police 40,328,270$ 22.09% 78,136$ Fire & Emergency Services 26,636,634 14.59% 51,606 Urban Design & Planning Services 5,336,076 2.92% 10,328 Urban Renewal 1,787,827 0.98% 3,466 Community Development 8,605,235 4.71% 16,660 Community Livability 1,908,840 1.05% 3,714 Economic Development Services 3,179,041 1.74% 6,155 Parks 3,483,053 1.91% 6,756 Environmental Services 47,124,224 25.80% 91,258
City-wide Services 15,653,381 8.57% 30,313 Office of Governance & Management 2,384,046 1.31% 4,634 City Attorney's Office 5,368,760 2.94% 10,399 Finance & Management Services 15,535,271 8.51% 30,101 Information Technology 5,255,128 2.88% 10,187
Total 182,585,786$ 100.00% 353,710$
Departments
Central Service Departments
City of GreshamCentral Service Cost Allocation Plan
Year Ended June 30, 2018
Finance & Management Services Department - Accounting
For Use During Fiscal Year 2019-20
61
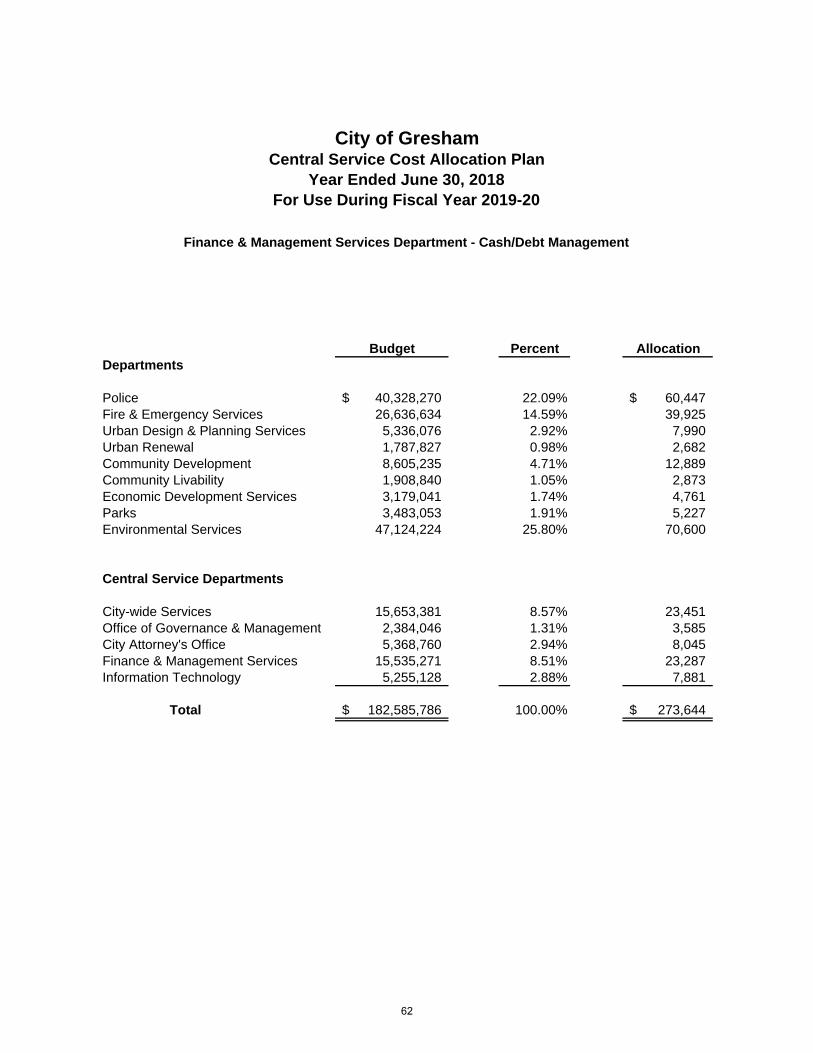
Budget Percent Allocation
Police 40,328,270$ 22.09% 60,447$ Fire & Emergency Services 26,636,634 14.59% 39,925 Urban Design & Planning Services 5,336,076 2.92% 7,990 Urban Renewal 1,787,827 0.98% 2,682 Community Development 8,605,235 4.71% 12,889 Community Livability 1,908,840 1.05% 2,873 Economic Development Services 3,179,041 1.74% 4,761 Parks 3,483,053 1.91% 5,227 Environmental Services 47,124,224 25.80% 70,600
City-wide Services 15,653,381 8.57% 23,451 Office of Governance & Management 2,384,046 1.31% 3,585 City Attorney's Office 5,368,760 2.94% 8,045 Finance & Management Services 15,535,271 8.51% 23,287 Information Technology 5,255,128 2.88% 7,881
Total 182,585,786$ 100.00% 273,644$
Departments
Central Service Departments
City of GreshamCentral Service Cost Allocation Plan
Year Ended June 30, 2018
Finance & Management Services Department - Cash/Debt Management
For Use During Fiscal Year 2019-20
62
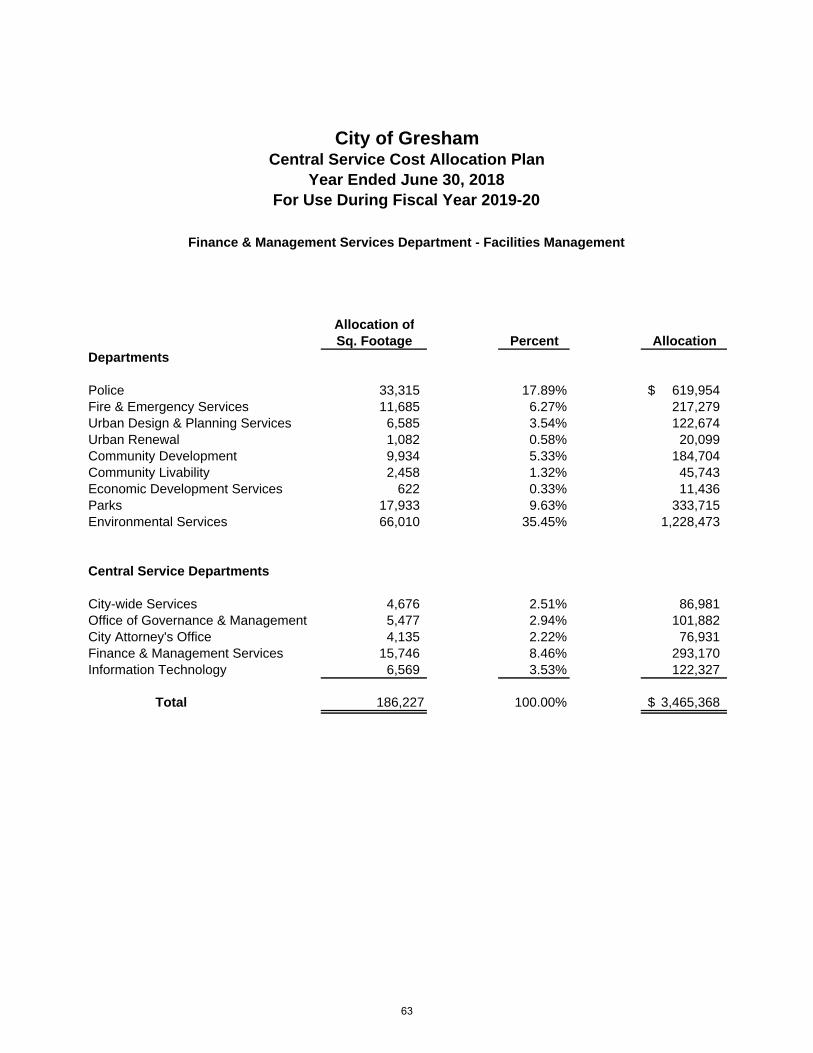
Allocation ofSq. Footage Percent Allocation
Police 33,315 17.89% 619,954$ Fire & Emergency Services 11,685 6.27% 217,279 Urban Design & Planning Services 6,585 3.54% 122,674 Urban Renewal 1,082 0.58% 20,099 Community Development 9,934 5.33% 184,704 Community Livability 2,458 1.32% 45,743 Economic Development Services 622 0.33% 11,436 Parks 17,933 9.63% 333,715 Environmental Services 66,010 35.45% 1,228,473
City-wide Services 4,676 2.51% 86,981 Office of Governance & Management 5,477 2.94% 101,882 City Attorney's Office 4,135 2.22% 76,931 Finance & Management Services 15,746 8.46% 293,170
6,569 3.53% 122,327
Total 186,227 100.00% 3,465,368$
Information Technology
Departments
Central Service Departments
City of Gresham
Finance & Management Services Department - Facilities Management
Central Service Cost Allocation PlanYear Ended June 30, 2018
For Use During Fiscal Year 2019-20
63
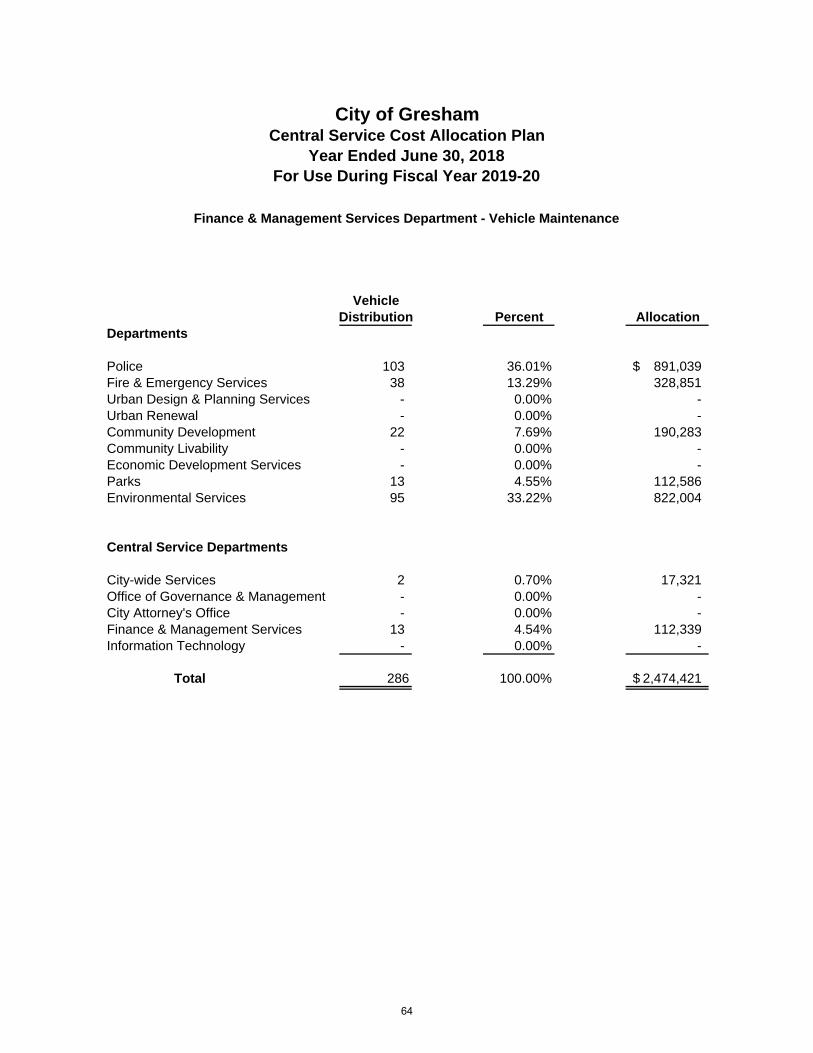
VehicleDistribution Percent Allocation
Police 103 36.01% 891,039$ Fire & Emergency Services 38 13.29% 328,851 Urban Design & Planning Services - 0.00% - Urban Renewal - 0.00% - Community Development 22 7.69% 190,283 Community Livability - 0.00% - Economic Development Services - 0.00% - Parks 13 4.55% 112,586 Environmental Services 95 33.22% 822,004
City-wide Services 2 0.70% 17,321 Office of Governance & Management - 0.00% - City Attorney's Office - 0.00% - Finance & Management Services 13 4.54% 112,339
- 0.00% -
Total 286 100.00% 2,474,421$
City of GreshamCentral Service Cost Allocation Plan
Year Ended June 30, 2018
Finance & Management Services Department - Vehicle Maintenance
For Use During Fiscal Year 2019-20
Information Technology
Departments
Central Service Departments
64
Information Technology Department
MISSION STATEMENT As the stewards of the City’s information and technology, our mission is to provide comprehensive technology services, analytics and business solutions that support the delivery of City services. GENERAL DESCRIPTION Information and Technology delivers service in a variety of areas including network systems, user services, application services, unified communications, collaborative tool sets, geographical information systems, analytics, data visualization, project management, and business process improvement. These programs allow the City of Gresham to provide efficient and effective services to the community.
Division Method of Allocation
IT – Computers Computer Systems, FTE Count GIS Budget Information & Innovation Budget
65
Not AllocableAllowable Costs
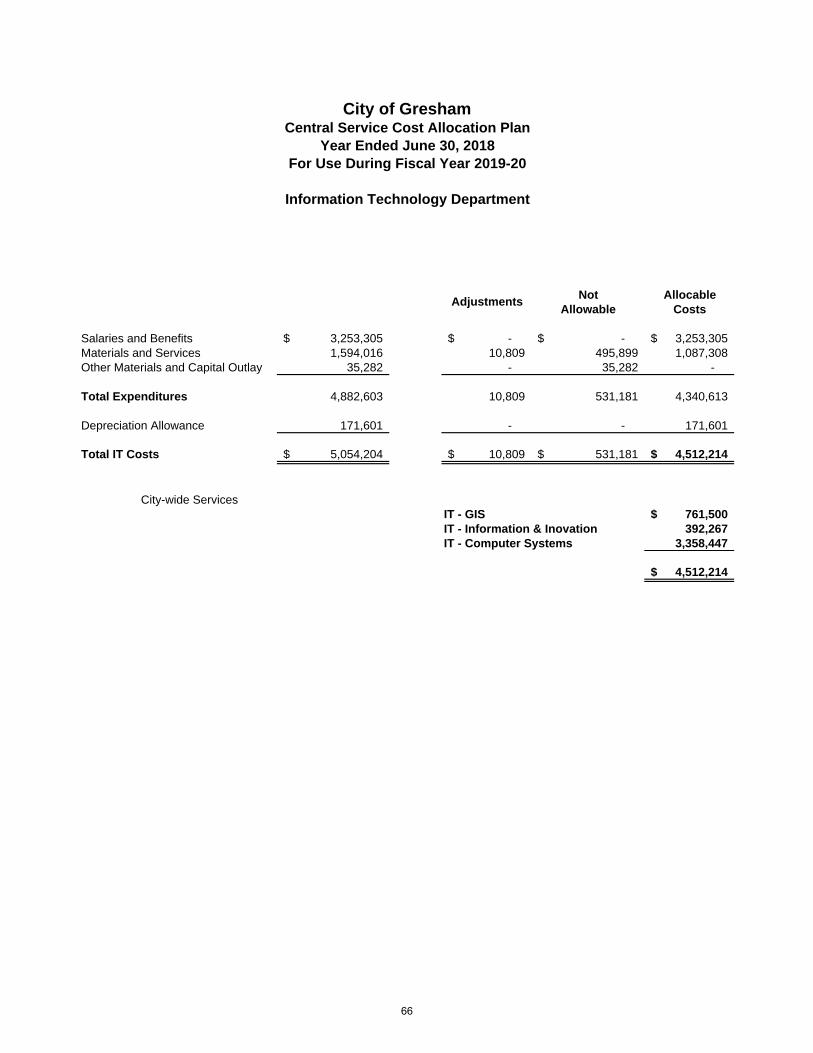
Salaries and Benefits 3,253,305$ -$ -$ 3,253,305$ Materials and Services 1,594,016 10,809 495,899 1,087,308 Other Materials and Capital Outlay 35,282 - 35,282 -
Total Expenditures 4,882,603 10,809 531,181 4,340,613
Depreciation Allowance 171,601 - - 171,601
Total IT Costs 5,054,204$ 10,809$ 531,181$ 4,512,214$
City-wide ServicesIT - GIS 761,500$ IT - Information & Inovation 392,267 IT - Computer Systems 3,358,447
4,512,214$
Adjustments
City of GreshamCentral Service Cost Allocation Plan
Year Ended June 30, 2018
Information Technology Department
For Use During Fiscal Year 2019-20
66
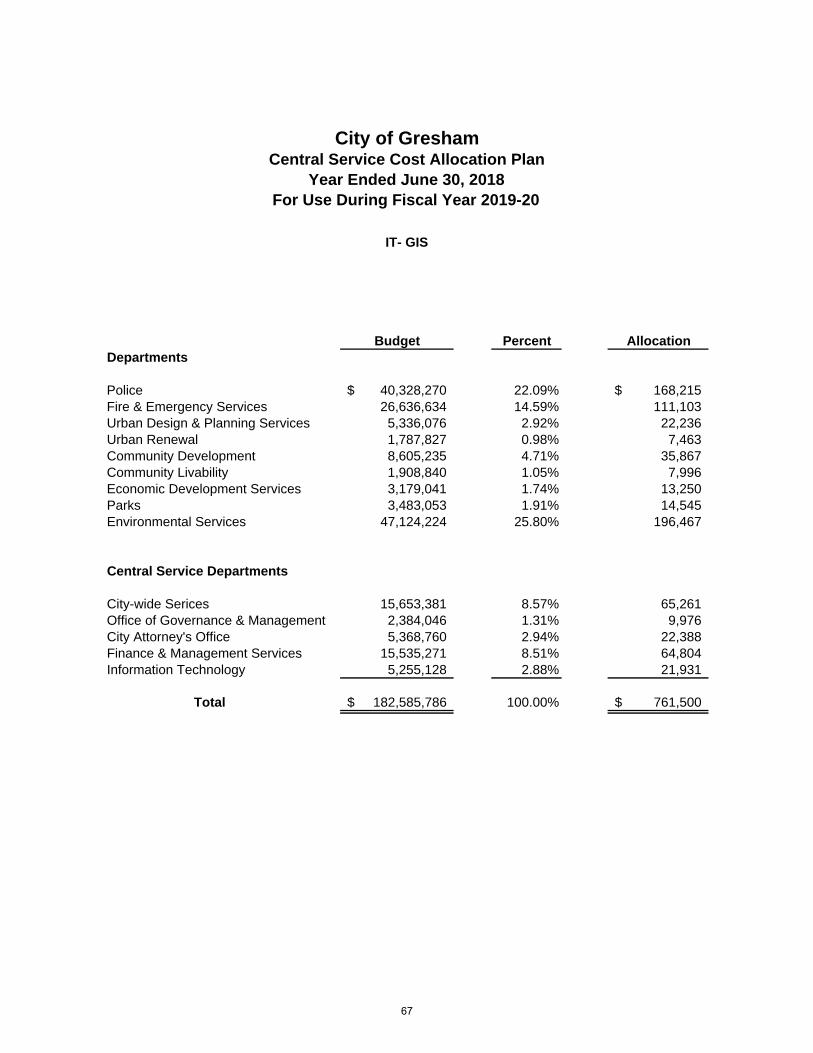
Budget Percent Allocation
Police 40,328,270$ 22.09% 168,215$ Fire & Emergency Services 26,636,634 14.59% 111,103 Urban Design & Planning Services 5,336,076 2.92% 22,236 Urban Renewal 1,787,827 0.98% 7,463 Community Development 8,605,235 4.71% 35,867 Community Livability 1,908,840 1.05% 7,996 Economic Development Services 3,179,041 1.74% 13,250 Parks 3,483,053 1.91% 14,545 Environmental Services 47,124,224 25.80% 196,467
City-wide Serices 15,653,381 8.57% 65,261 Office of Governance & Management 2,384,046 1.31% 9,976 City Attorney's Office 5,368,760 2.94% 22,388 Finance & Management Services 15,535,271 8.51% 64,804 Information Technology 5,255,128 2.88% 21,931
Total 182,585,786$ 100.00% 761,500$
Departments
Central Service Departments
City of GreshamCentral Service Cost Allocation Plan
Year Ended June 30, 2018For Use During Fiscal Year 2019-20
IT- GIS
67
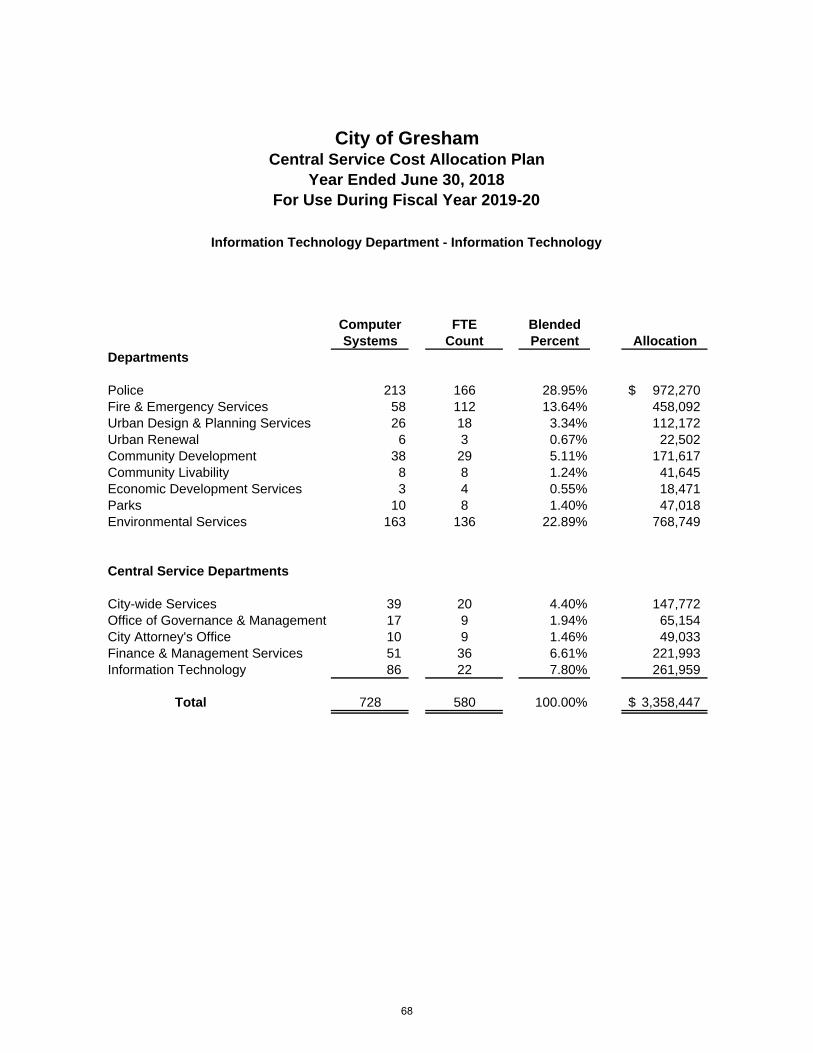
Computer FTE BlendedSystems Count Percent Allocation
Police 213 166 28.95% 972,270$ Fire & Emergency Services 58 112 13.64% 458,092 Urban Design & Planning Services 26 18 3.34% 112,172 Urban Renewal 6 3 0.67% 22,502 Community Development 38 29 5.11% 171,617 Community Livability 8 8 1.24% 41,645 Economic Development Services 3 4 0.55% 18,471 Parks 10 8 1.40% 47,018 Environmental Services 163 136 22.89% 768,749
City-wide Services 39 20 4.40% 147,772 Office of Governance & Management 17 9 1.94% 65,154 City Attorney's Office 10 9 1.46% 49,033 Finance & Management Services 51 36 6.61% 221,993 Information Technology 86 22 7.80% 261,959
Total 728 580 100.00% 3,358,447$
Central Service Departments
City of GreshamCentral Service Cost Allocation Plan
Year Ended June 30, 2018
Information Technology Department - Information Technology
For Use During Fiscal Year 2019-20
Departments
68
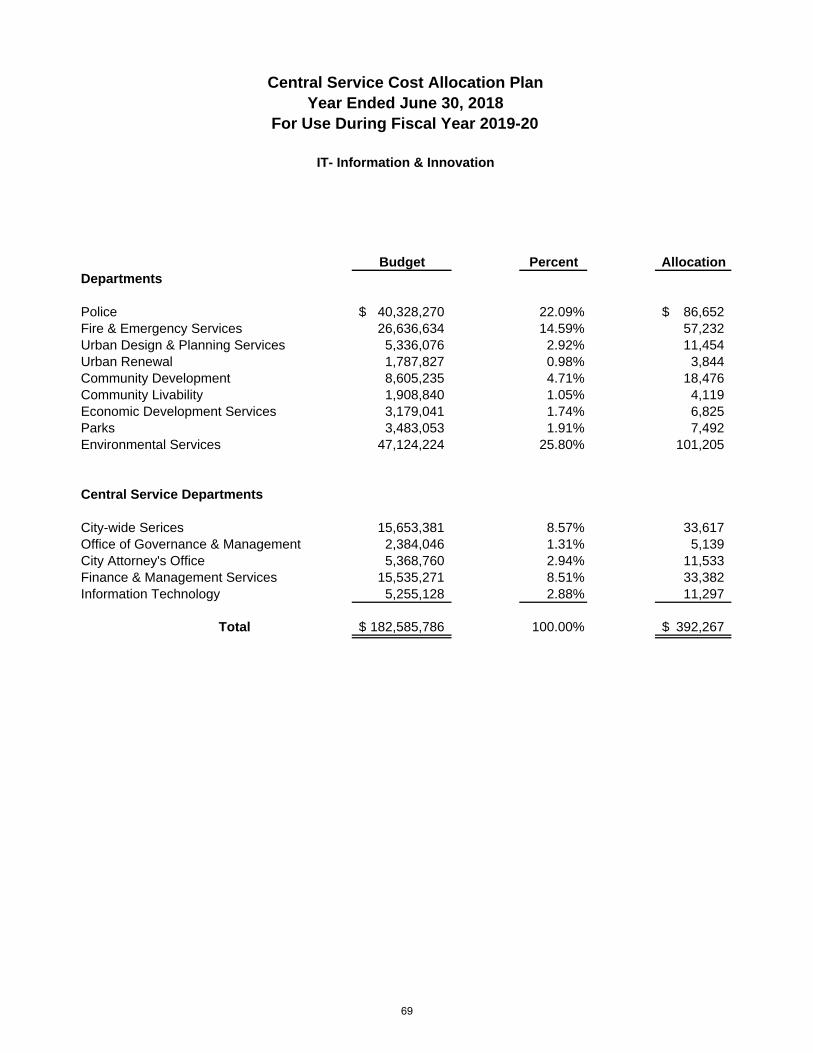
Budget Percent Allocation
Police 40,328,270$ 22.09% 86,652$ Fire & Emergency Services 26,636,634 14.59% 57,232 Urban Design & Planning Services 5,336,076 2.92% 11,454 Urban Renewal 1,787,827 0.98% 3,844 Community Development 8,605,235 4.71% 18,476 Community Livability 1,908,840 1.05% 4,119 Economic Development Services 3,179,041 1.74% 6,825 Parks 3,483,053 1.91% 7,492 Environmental Services 47,124,224 25.80% 101,205
City-wide Serices 15,653,381 8.57% 33,617 Office of Governance & Management 2,384,046 1.31% 5,139 City Attorney's Office 5,368,760 2.94% 11,533 Finance & Management Services 15,535,271 8.51% 33,382 Information Technology 5,255,128 2.88% 11,297
Total 182,585,786$ 100.00% 392,267$
Central Service Departments
Central Service Cost Allocation PlanYear Ended June 30, 2018
For Use During Fiscal Year 2019-20
IT- Information & Innovation
Departments
69
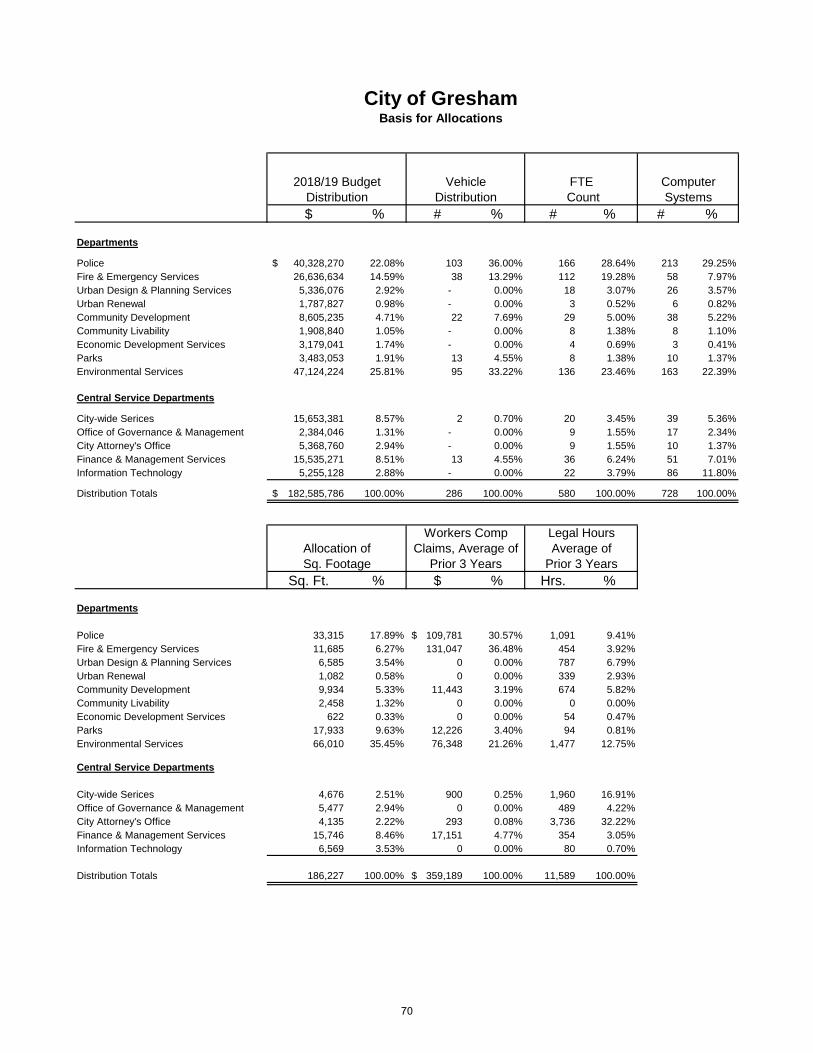
$ % # % # % # %
Departments
Police 40,328,270$ 22.08% 103 36.00% 166 28.64% 213 29.25%Fire & Emergency Services 26,636,634 14.59% 38 13.29% 112 19.28% 58 7.97%Urban Design & Planning Services 5,336,076 2.92% - 0.00% 18 3.07% 26 3.57%Urban Renewal 1,787,827 0.98% - 0.00% 3 0.52% 6 0.82%Community Development 8,605,235 4.71% 22 7.69% 29 5.00% 38 5.22%Community Livability 1,908,840 1.05% - 0.00% 8 1.38% 8 1.10%Economic Development Services 3,179,041 1.74% - 0.00% 4 0.69% 3 0.41%Parks 3,483,053 1.91% 13 4.55% 8 1.38% 10 1.37%Environmental Services 47,124,224 25.81% 95 33.22% 136 23.46% 163 22.39%
Central Service Departments
City-wide Serices 15,653,381 8.57% 2 0.70% 20 3.45% 39 5.36%Office of Governance & Management 2,384,046 1.31% - 0.00% 9 1.55% 17 2.34%City Attorney's Office 5,368,760 2.94% - 0.00% 9 1.55% 10 1.37%Finance & Management Services 15,535,271 8.51% 13 4.55% 36 6.24% 51 7.01%Information Technology 5,255,128 2.88% - 0.00% 22 3.79% 86 11.80%
Distribution Totals 182,585,786$ 100.00% 286 100.00% 580 100.00% 728 100.00%
Sq. Ft. % $ % Hrs. %
Departments
Police 33,315 17.89% 109,781$ 30.57% 1,091 9.41%Fire & Emergency Services 11,685 6.27% 131,047 36.48% 454 3.92%Urban Design & Planning Services 6,585 3.54% 0 0.00% 787 6.79%Urban Renewal 1,082 0.58% 0 0.00% 339 2.93%Community Development 9,934 5.33% 11,443 3.19% 674 5.82%Community Livability 2,458 1.32% 0 0.00% 0 0.00%Economic Development Services 622 0.33% 0 0.00% 54 0.47%Parks 17,933 9.63% 12,226 3.40% 94 0.81%Environmental Services 66,010 35.45% 76,348 21.26% 1,477 12.75%
Central Service Departments
City-wide Serices 4,676 2.51% 900 0.25% 1,960 16.91%Office of Governance & Management 5,477 2.94% 0 0.00% 489 4.22%City Attorney's Office 4,135 2.22% 293 0.08% 3,736 32.22%Finance & Management Services 15,746 8.46% 17,151 4.77% 354 3.05%Information Technology 6,569 3.53% 0 0.00% 80 0.70%
Distribution Totals 186,227 100.00% 359,189$ 100.00% 11,589 100.00%
City of GreshamBasis for Allocations
2018/19 Budget VehicleSystemsDistribution
Workers Comp
Prior 3 Years
Distribution
Legal Hours
Computer
Average of
FTE Count
Allocation of Claims, Average ofSq. Footage Prior 3 Years
70

APPENDIX A
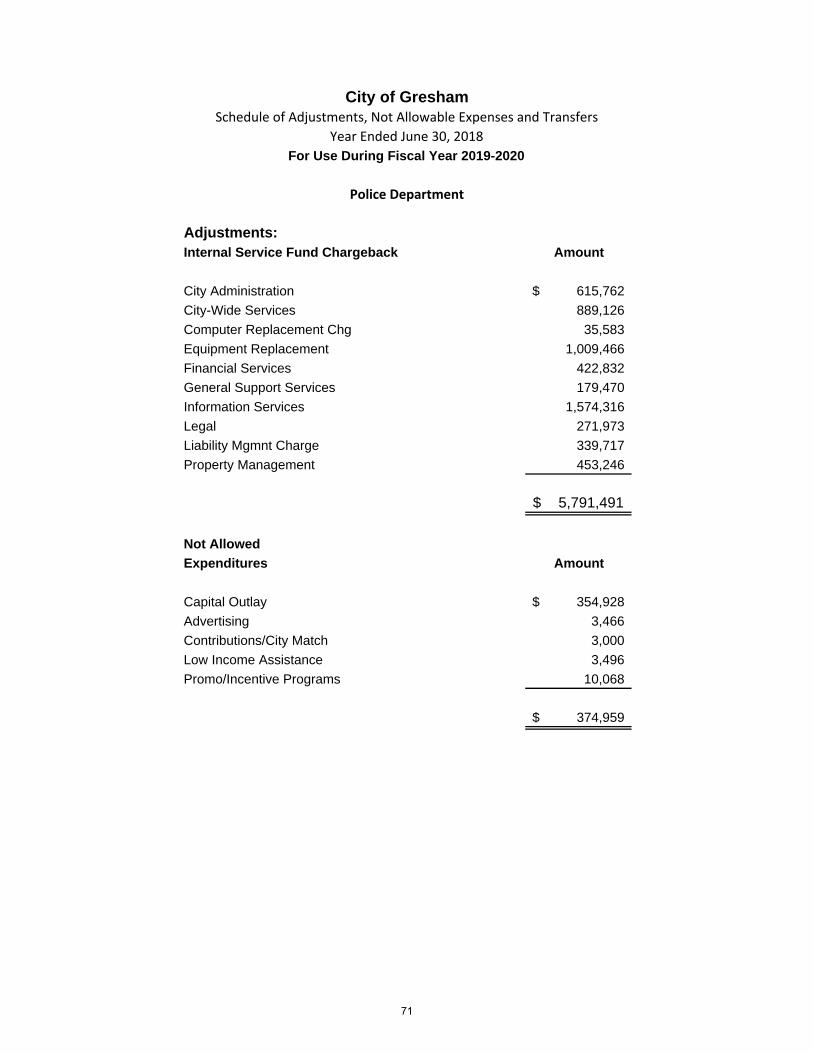
Adjustments:Internal Service Fund Chargeback Amount
City Administration 615,762$
City-Wide Services 889,126
Computer Replacement Chg 35,583
Equipment Replacement 1,009,466
Financial Services 422,832
General Support Services 179,470
Information Services 1,574,316
Legal 271,973
Liability Mgmnt Charge 339,717
Property Management 453,246
5,791,491$
Not Allowed
Expenditures Amount
Capital Outlay 354,928$
Advertising 3,466
Contributions/City Match 3,000
Low Income Assistance 3,496
Promo/Incentive Programs 10,068
374,959$
City of GreshamSchedule of Adjustments, Not Allowable Expenses and Transfers
Year Ended June 30, 2018
Police Department
For Use During Fiscal Year 2019-2020
71
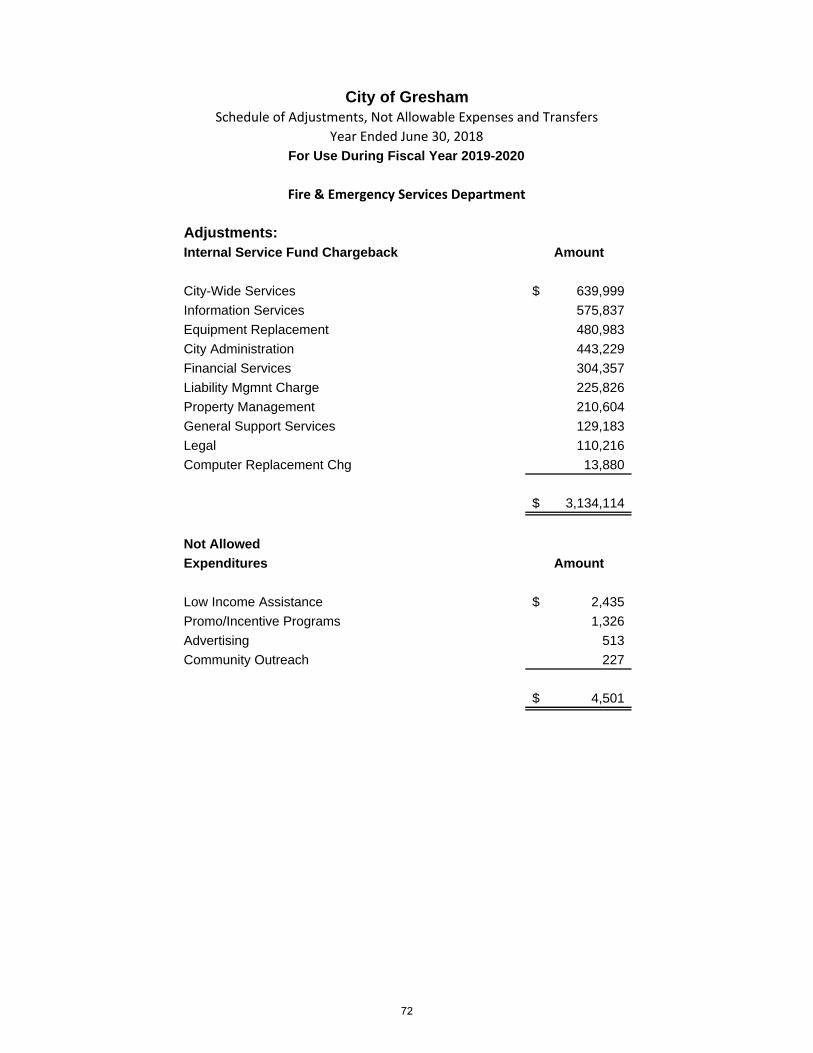
Adjustments:Internal Service Fund Chargeback Amount
City-Wide Services 639,999$
Information Services 575,837
Equipment Replacement 480,983
City Administration 443,229
Financial Services 304,357
Liability Mgmnt Charge 225,826
Property Management 210,604
General Support Services 129,183
Legal 110,216
Computer Replacement Chg 13,880
3,134,114$
Not Allowed
Expenditures Amount
Low Income Assistance 2,435$
Promo/Incentive Programs 1,326
Advertising 513
Community Outreach 227
4,501$
City of GreshamSchedule of Adjustments, Not Allowable Expenses and Transfers
Year Ended June 30, 2018
Fire & Emergency Services Department
For Use During Fiscal Year 2019-2020
72
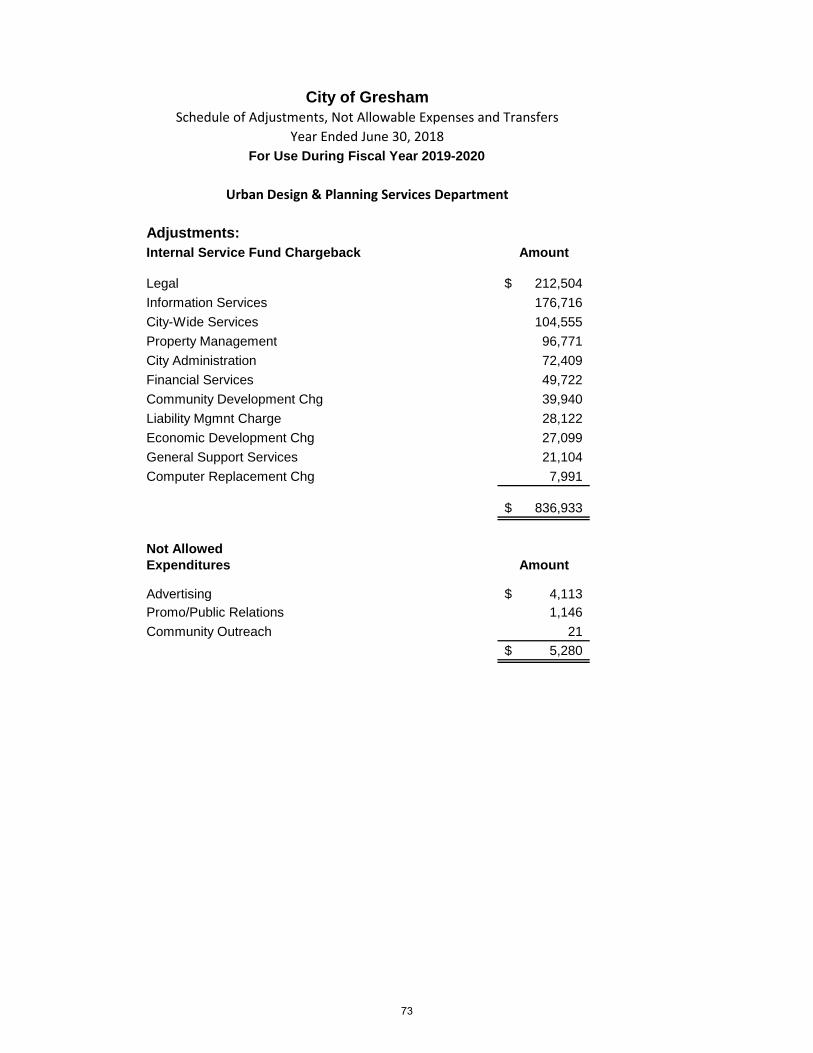
Adjustments:Internal Service Fund Chargeback Amount
Legal 212,504$
Information Services 176,716
City-Wide Services 104,555
Property Management 96,771
City Administration 72,409
Financial Services 49,722
Community Development Chg 39,940
Liability Mgmnt Charge 28,122
Economic Development Chg 27,099
General Support Services 21,104
Computer Replacement Chg 7,991
836,933$
Not AllowedExpenditures Amount
Advertising 4,113$ Promo/Public Relations 1,146
Community Outreach 21
5,280$
City of GreshamSchedule of Adjustments, Not Allowable Expenses and Transfers
Year Ended June 30, 2018
Urban Design & Planning Services Department
For Use During Fiscal Year 2019-2020
73
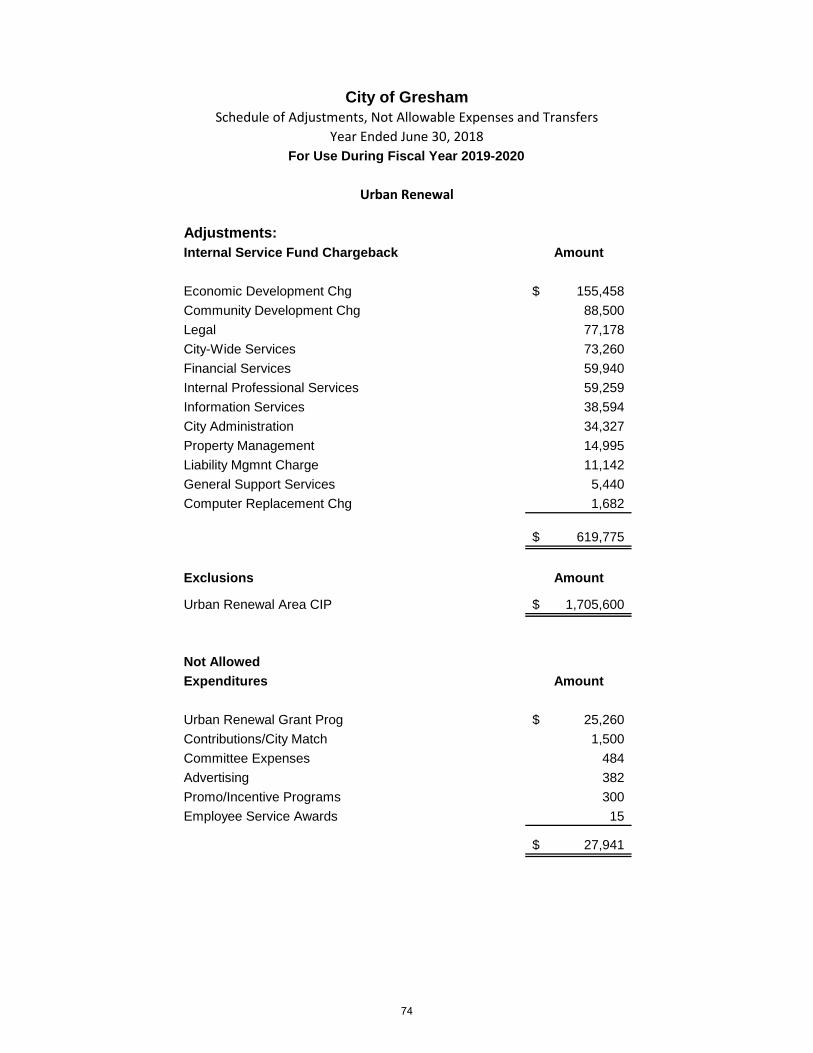
Adjustments:Internal Service Fund Chargeback Amount
Economic Development Chg 155,458$
Community Development Chg 88,500
Legal 77,178
City-Wide Services 73,260
Financial Services 59,940
Internal Professional Services 59,259
Information Services 38,594
City Administration 34,327
Property Management 14,995
Liability Mgmnt Charge 11,142
General Support Services 5,440
Computer Replacement Chg 1,682
619,775$
Exclusions Amount
Urban Renewal Area CIP 1,705,600$
Not Allowed
Expenditures Amount
Urban Renewal Grant Prog 25,260$
Contributions/City Match 1,500
Committee Expenses 484
Advertising 382
Promo/Incentive Programs 300
Employee Service Awards 15
27,941$
City of GreshamSchedule of Adjustments, Not Allowable Expenses and Transfers
Year Ended June 30, 2018
For Use During Fiscal Year 2019-2020
Urban Renewal
74
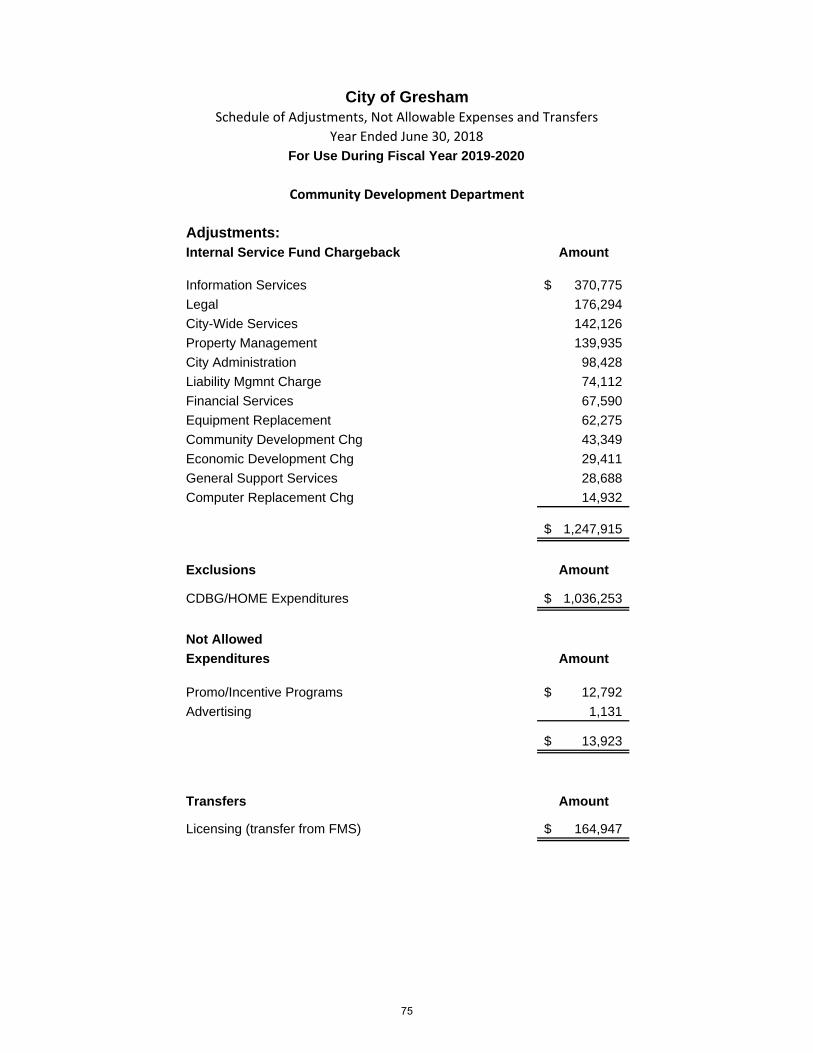
Adjustments:Internal Service Fund Chargeback Amount
Information Services 370,775$
Legal 176,294
City-Wide Services 142,126
Property Management 139,935
City Administration 98,428
Liability Mgmnt Charge 74,112
Financial Services 67,590
Equipment Replacement 62,275
Community Development Chg 43,349
Economic Development Chg 29,411
General Support Services 28,688
Computer Replacement Chg 14,932
1,247,915$
Exclusions Amount
CDBG/HOME Expenditures 1,036,253$
Not Allowed
Expenditures Amount
Promo/Incentive Programs 12,792$
Advertising 1,131
13,923$
Transfers Amount
Licensing (transfer from FMS) 164,947$
City of GreshamSchedule of Adjustments, Not Allowable Expenses and Transfers
Year Ended June 30, 2018
Community Development Department
For Use During Fiscal Year 2019-2020
75
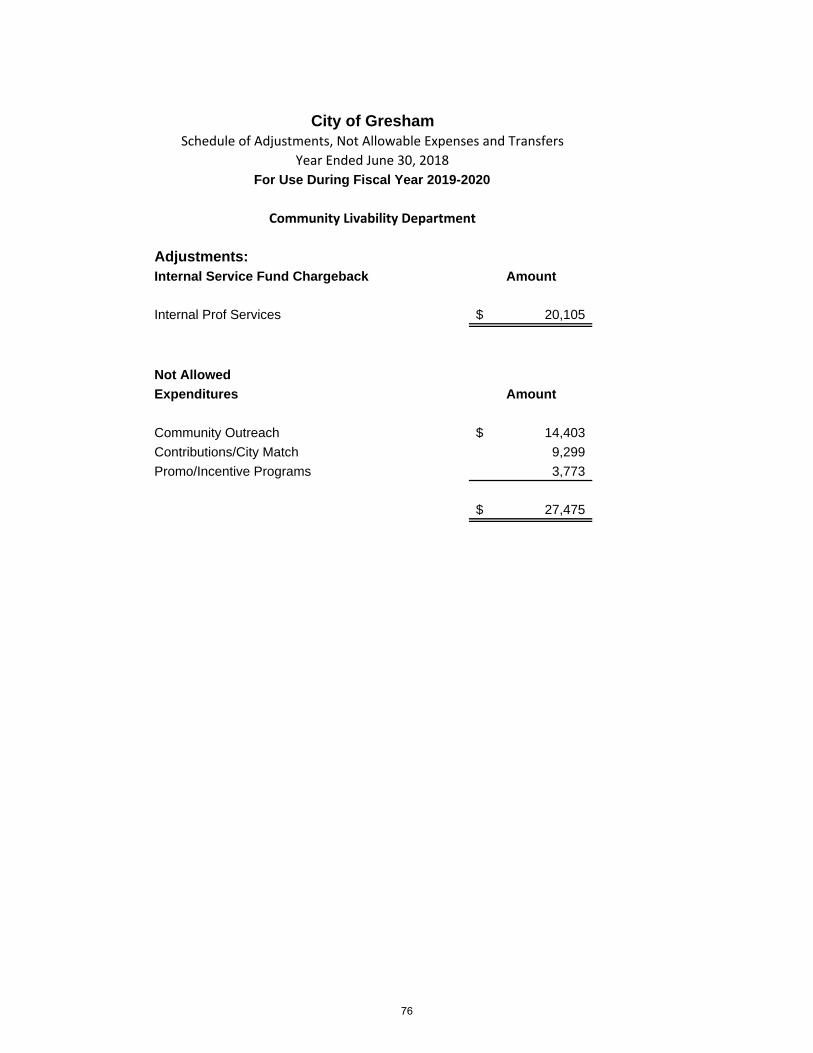
Adjustments:Internal Service Fund Chargeback Amount
Internal Prof Services 20,105$
Not Allowed
Expenditures Amount
Community Outreach 14,403$
Contributions/City Match 9,299
Promo/Incentive Programs 3,773
27,475$
City of GreshamSchedule of Adjustments, Not Allowable Expenses and Transfers
Year Ended June 30, 2018
For Use During Fiscal Year 2019-2020
Community Livability Department
76
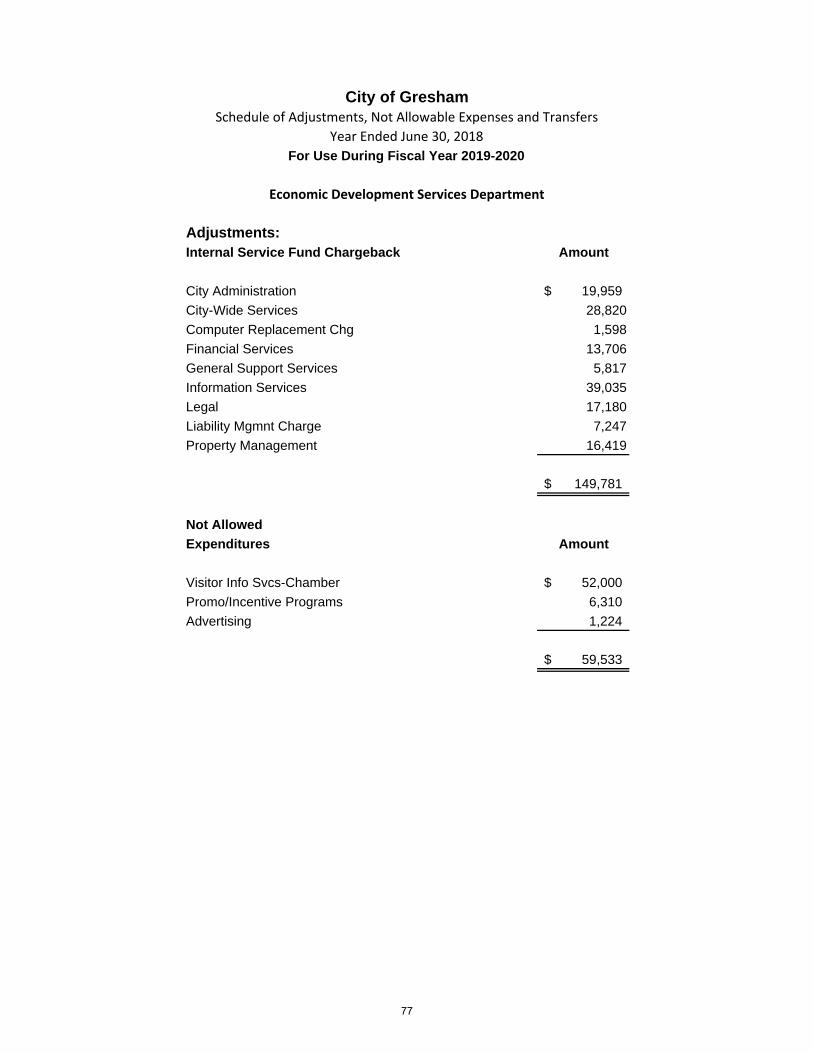
Adjustments:Internal Service Fund Chargeback Amount
City Administration 19,959$
City-Wide Services 28,820
Computer Replacement Chg 1,598
Financial Services 13,706
General Support Services 5,817
Information Services 39,035
Legal 17,180
Liability Mgmnt Charge 7,247
Property Management 16,419
149,781$
Not Allowed
Expenditures Amount
Visitor Info Svcs-Chamber 52,000$
Promo/Incentive Programs 6,310
Advertising 1,224
59,533$
City of GreshamSchedule of Adjustments, Not Allowable Expenses and Transfers
Year Ended June 30, 2018
Economic Development Services Department
For Use During Fiscal Year 2019-2020
77
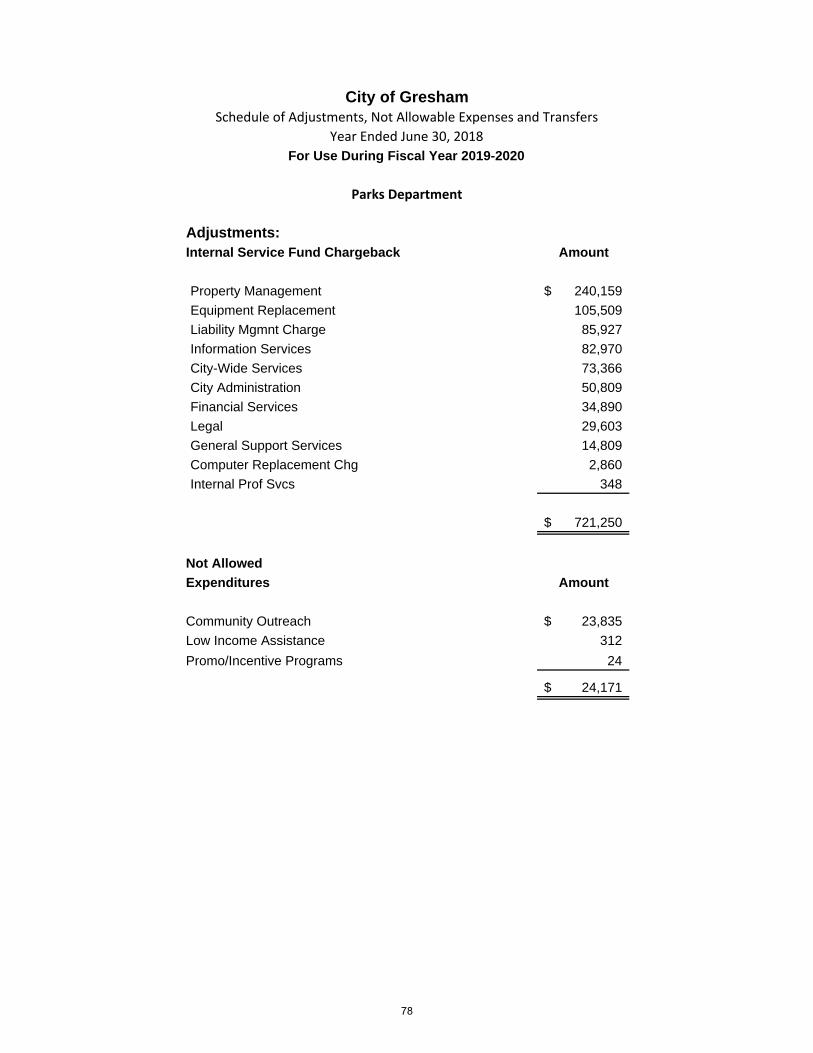
Adjustments:Internal Service Fund Chargeback Amount
Property Management 240,159$
Equipment Replacement 105,509
Liability Mgmnt Charge 85,927
Information Services 82,970
City-Wide Services 73,366
City Administration 50,809
Financial Services 34,890
Legal 29,603
General Support Services 14,809
Computer Replacement Chg 2,860
Internal Prof Svcs 348
721,250$
Not Allowed
Expenditures Amount
Community Outreach 23,835$
Low Income Assistance 312
Promo/Incentive Programs 24
24,171$
City of GreshamSchedule of Adjustments, Not Allowable Expenses and Transfers
Year Ended June 30, 2018
For Use During Fiscal Year 2019-2020
Parks Department
78
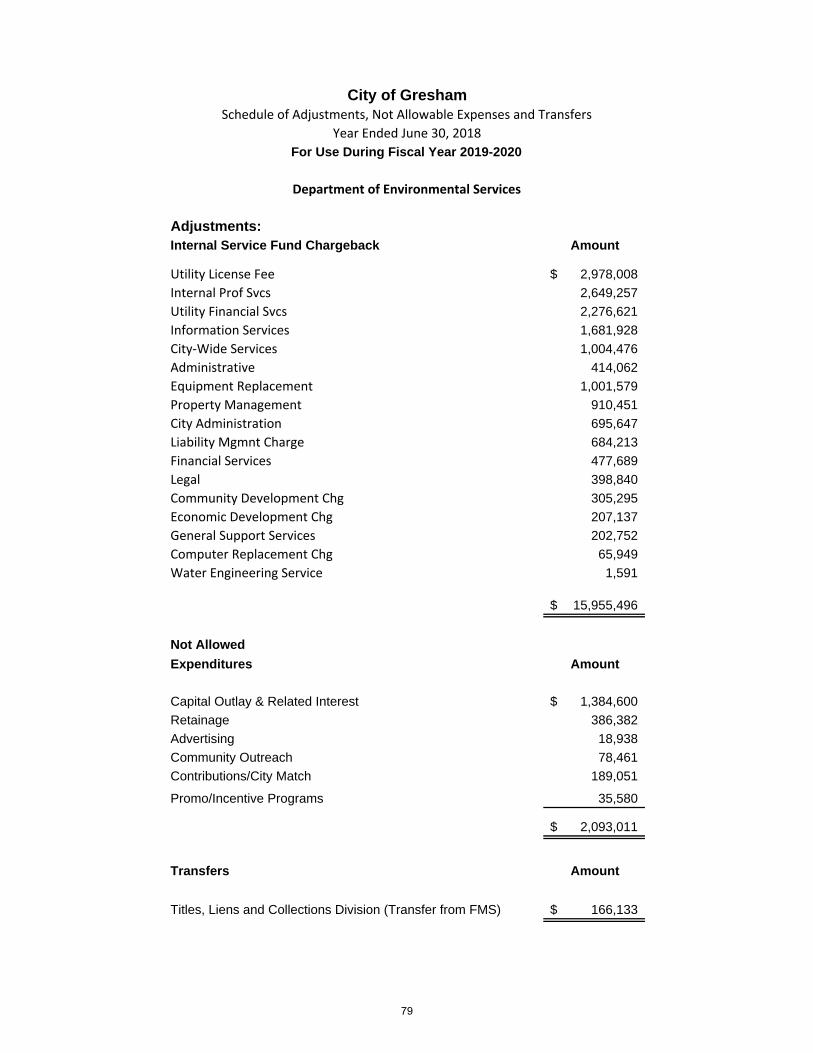
Adjustments:Internal Service Fund Chargeback Amount
Utility License Fee 2,978,008$
Internal Prof Svcs 2,649,257
Utility Financial Svcs 2,276,621
Information Services 1,681,928
City‐Wide Services 1,004,476
Administrative 414,062
Equipment Replacement 1,001,579
Property Management 910,451
City Administration 695,647
Liability Mgmnt Charge 684,213
Financial Services 477,689
Legal 398,840
Community Development Chg 305,295
Economic Development Chg 207,137
General Support Services 202,752
Computer Replacement Chg 65,949
Water Engineering Service 1,591
15,955,496$
Not Allowed
Expenditures Amount
Capital Outlay & Related Interest 1,384,600$
Retainage 386,382
Advertising 18,938
Community Outreach 78,461
Contributions/City Match 189,051
Promo/Incentive Programs 35,580
2,093,011$
Transfers Amount
Titles, Liens and Collections Division (Transfer from FMS) 166,133$
City of GreshamSchedule of Adjustments, Not Allowable Expenses and Transfers
Year Ended June 30, 2018
Department of Environmental Services
For Use During Fiscal Year 2019-2020
79
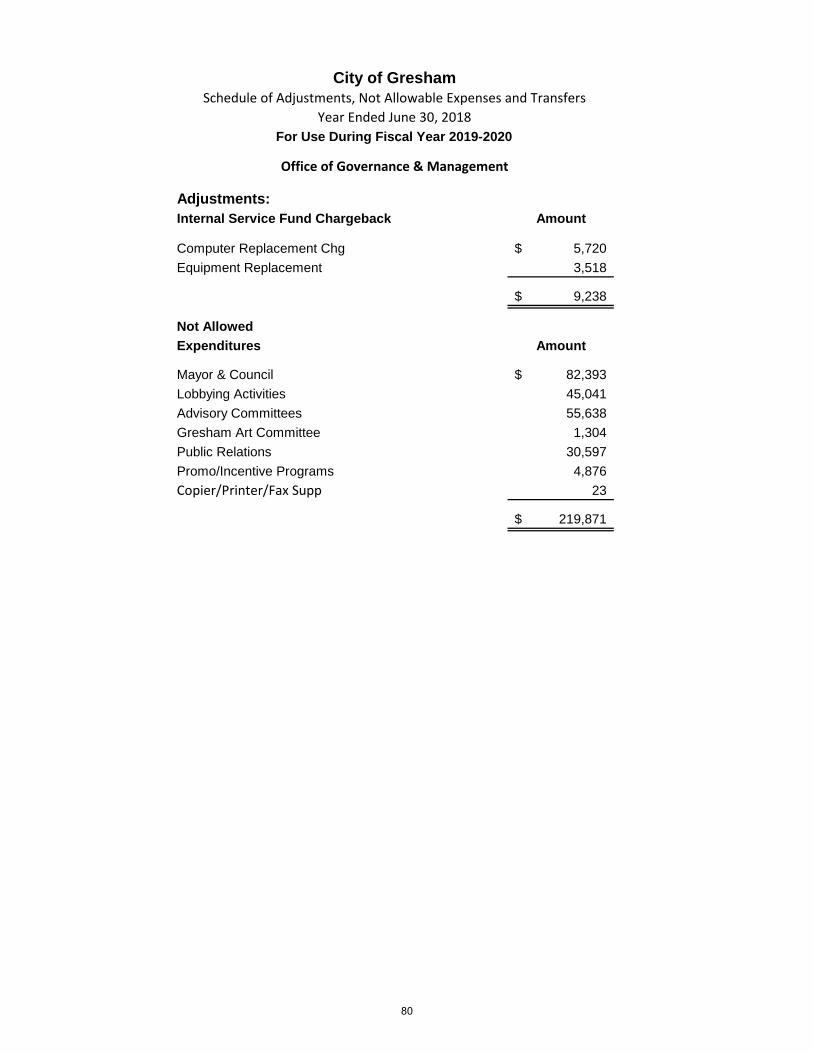
Adjustments:Internal Service Fund Chargeback Amount
Computer Replacement Chg 5,720$
Equipment Replacement 3,518
9,238$
Not Allowed
Expenditures Amount
Mayor & Council 82,393$
Lobbying Activities 45,041
Advisory Committees 55,638
Gresham Art Committee 1,304
Public Relations 30,597
Promo/Incentive Programs 4,876
Copier/Printer/Fax Supp 23
219,871$
City of GreshamSchedule of Adjustments, Not Allowable Expenses and Transfers
Year Ended June 30, 2018
Office of Governance & Management
For Use During Fiscal Year 2019-2020
80
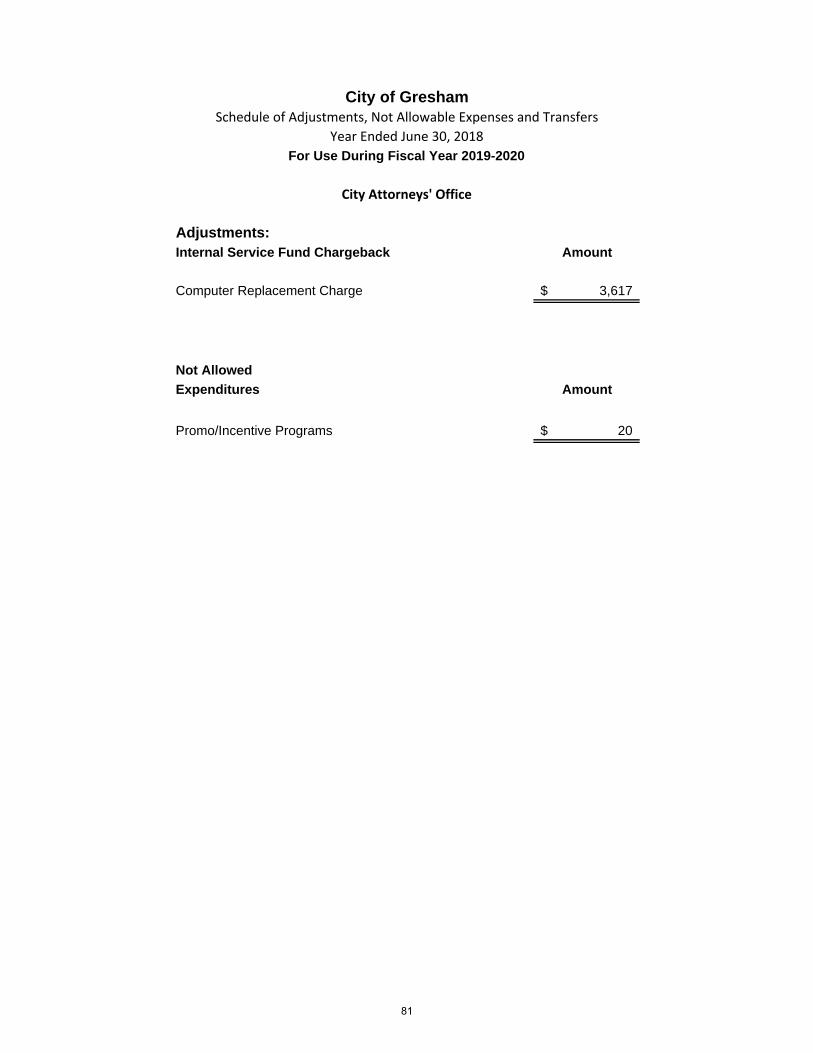
Adjustments:Internal Service Fund Chargeback Amount
Computer Replacement Charge 3,617$
Not Allowed
Expenditures Amount
Promo/Incentive Programs 20$
City of GreshamSchedule of Adjustments, Not Allowable Expenses and Transfers
Year Ended June 30, 2018
City Attorneys' Office
For Use During Fiscal Year 2019-2020
81
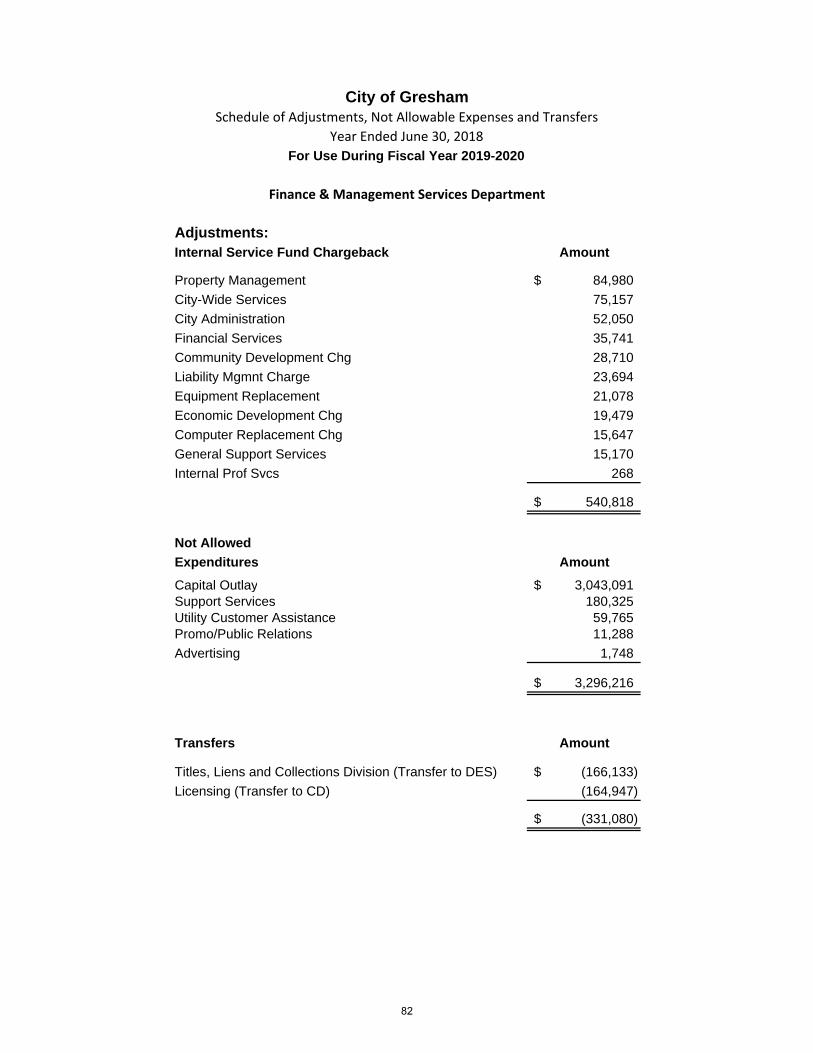
Adjustments:Internal Service Fund Chargeback Amount
Property Management 84,980$
City-Wide Services 75,157
City Administration 52,050
Financial Services 35,741
Community Development Chg 28,710
Liability Mgmnt Charge 23,694
Equipment Replacement 21,078
Economic Development Chg 19,479
Computer Replacement Chg 15,647
General Support Services 15,170
Internal Prof Svcs 268
540,818$
Not Allowed
Expenditures Amount
Capital Outlay 3,043,091$ Support Services 180,325 Utility Customer Assistance 59,765 Promo/Public Relations 11,288
Advertising 1,748
3,296,216$
Transfers Amount
Titles, Liens and Collections Division (Transfer to DES) (166,133)$
Licensing (Transfer to CD) (164,947)
(331,080)$
City of GreshamSchedule of Adjustments, Not Allowable Expenses and Transfers
Year Ended June 30, 2018
Finance & Management Services Department
For Use During Fiscal Year 2019-2020
82
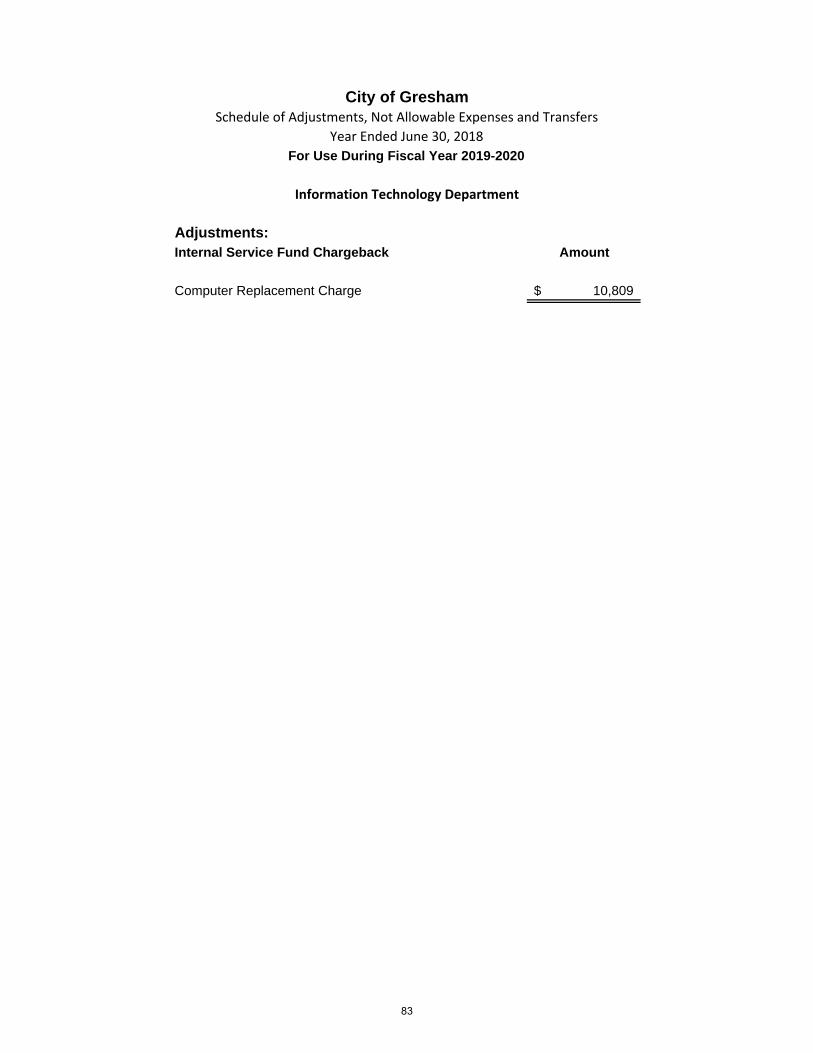
Adjustments:Internal Service Fund Chargeback Amount
Computer Replacement Charge 10,809$
City of GreshamSchedule of Adjustments, Not Allowable Expenses and Transfers
Year Ended June 30, 2018
Information Technology Department
For Use During Fiscal Year 2019-2020
83
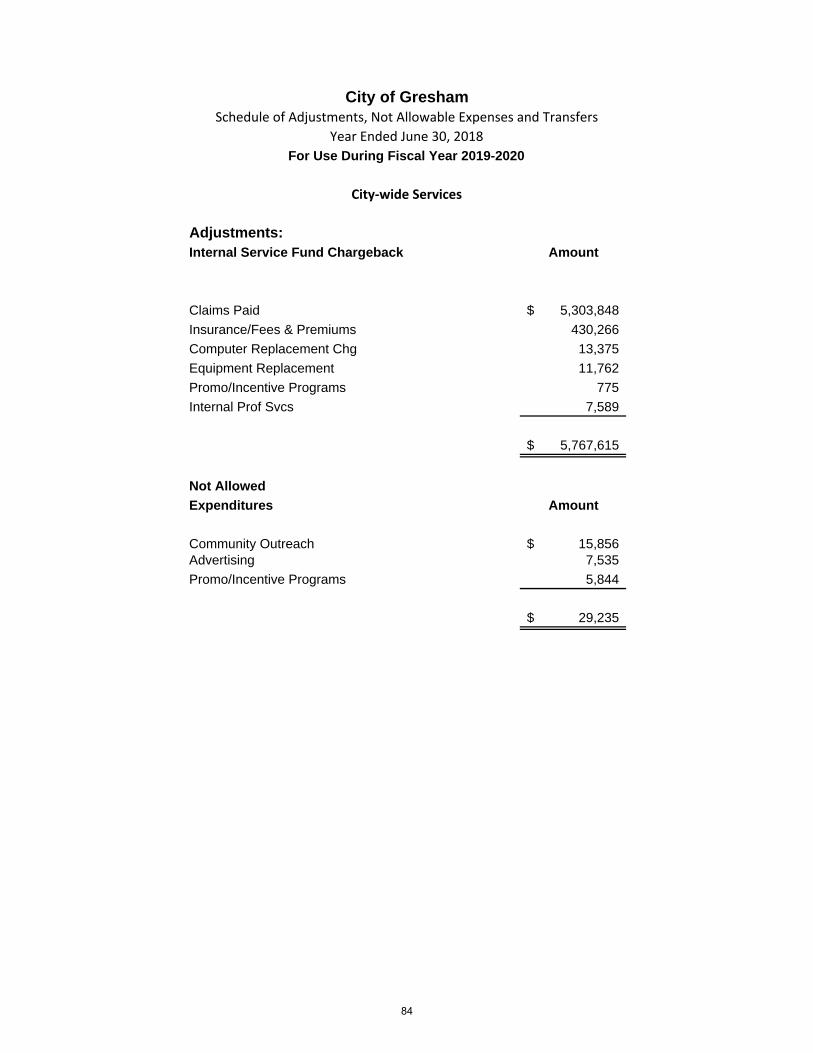
Adjustments:Internal Service Fund Chargeback Amount
Claims Paid 5,303,848$
Insurance/Fees & Premiums 430,266
Computer Replacement Chg 13,375
Equipment Replacement 11,762
Promo/Incentive Programs 775
Internal Prof Svcs 7,589
5,767,615$
Not Allowed
Expenditures Amount
Community Outreach 15,856$ Advertising 7,535
Promo/Incentive Programs 5,844
29,235$
City of GreshamSchedule of Adjustments, Not Allowable Expenses and Transfers
Year Ended June 30, 2018
City‐wide Services
For Use During Fiscal Year 2019-2020
84

APPENDIX B
Reconciliation of Costs to Audited CAFR
Appendix B provides a reconciliation of the costs included in this plan to our Comprehensive Annual Financial Report (CAFR), which has been audited Isler CPA. The approach taken is to accumulate all departmental expenditures as outlined in this Indirect Cost Rate Proposal and Cost Allocation Plan, and compare the total departmental expenditures with the total fund expenditures as outlined in the CAFR.
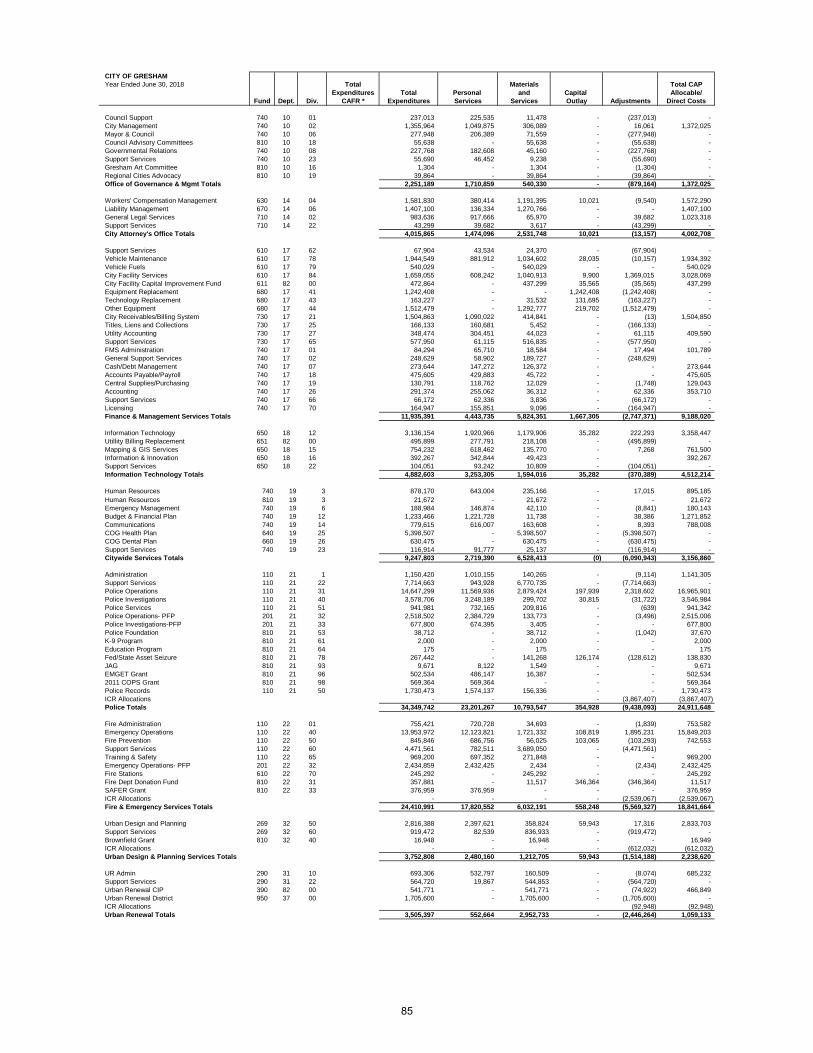
CITY OF GRESHAMYear Ended June 30, 2018 Total Materials Total CAP
Expenditures Total Personal and Capital Allocable/Fund Dept. Div. CAFR * Expenditures Services Services Outlay Adjustments Direct Costs
Council Support 740 10 01 237,013 225,535 11,478 - (237,013) - City Management 740 10 02 1,355,964 1,049,875 306,089 - 16,061 1,372,025 Mayor & Council 740 10 06 277,948 206,389 71,559 - (277,948) - Council Advisory Committees 810 10 18 55,638 - 55,638 - (55,638) - Governmental Relations 740 10 08 227,768 182,608 45,160 - (227,768) - Support Services 740 10 23 55,690 46,452 9,238 - (55,690) - Gresham Art Committee 810 10 16 1,304 - 1,304 - (1,304) - Regional Cities Advocacy 810 10 19 39,864 - 39,864 - (39,864) - Office of Governance & Mgmt Totals 2,251,189 1,710,859 540,330 - (879,164) 1,372,025
Workers' Compensation Management 630 14 04 1,581,830 380,414 1,191,395 10,021 (9,540) 1,572,290 Liability Management 670 14 06 1,407,100 136,334 1,270,766 - - 1,407,100 General Legal Services 710 14 02 983,636 917,666 65,970 - 39,682 1,023,318 Support Services 710 14 22 43,299 39,682 3,617 - (43,299) - City Attorney's Office Totals 4,015,865 1,474,096 2,531,748 10,021 (13,157) 4,002,708
Support Services 610 17 62 67,904 43,534 24,370 - (67,904) - Vehicle Maintenance 610 17 78 1,944,549 881,912 1,034,602 28,035 (10,157) 1,934,392 Vehicle Fuels 610 17 79 540,029 - 540,029 - - 540,029 City Facility Services 610 17 84 1,659,055 608,242 1,040,913 9,900 1,369,015 3,028,069 City Facility Capital Improvement Fund 611 82 00 472,864 - 437,299 35,565 (35,565) 437,299 Equipment Replacement 680 17 41 1,242,408 - - 1,242,408 (1,242,408) - Technology Replacement 680 17 43 163,227 - 31,532 131,695 (163,227) - Other Equipment 680 17 44 1,512,479 - 1,292,777 219,702 (1,512,479) - City Receivables/Billing System 730 17 21 1,504,863 1,090,022 414,841 - (13) 1,504,850 Titles, Liens and Collections 730 17 25 166,133 160,681 5,452 - (166,133) - Utility Accounting 730 17 27 348,474 304,451 44,023 - 61,115 409,590 Support Services 730 17 65 577,950 61,115 516,835 - (577,950) - FMS Administration 740 17 01 84,294 65,710 18,584 - 17,494 101,789 General Support Services 740 17 02 248,629 58,902 189,727 - (248,629) - Cash/Debt Management 740 17 07 273,644 147,272 126,372 - - 273,644 Accounts Payable/Payroll 740 17 18 475,605 429,883 45,722 - - 475,605 Central Supplies/Purchasing 740 17 19 130,791 118,762 12,029 - (1,748) 129,043 Accounting 740 17 26 291,374 255,062 36,312 - 62,336 353,710 Support Services 740 17 66 66,172 62,336 3,836 - (66,172) - Licensing 740 17 70 164,947 155,851 9,096 - (164,947) - Finance & Management Services Totals 11,935,391 4,443,735 5,824,351 1,667,305 (2,747,371) 9,188,020
Information Technology 650 18 12 3,136,154 1,920,966 1,179,906 35,282 222,293 3,358,447 Utillity Billing Replacement 651 82 00 495,899 277,791 218,108 - (495,899) - Mapping & GIS Services 650 18 15 754,232 618,462 135,770 - 7,268 761,500 Information & Innovation 650 18 16 392,267 342,844 49,423 - 392,267 Support Services 650 18 22 104,051 93,242 10,809 - (104,051) - Information Technology Totals 4,882,603 3,253,305 1,594,016 35,282 (370,389) 4,512,214
Human Resources 740 19 3 878,170 643,004 235,166 - 17,015 895,185 Human Resources 810 19 3 21,672 - 21,672 - - 21,672 Emergency Management 740 19 6 188,984 146,874 42,110 - (8,841) 180,143 Budget & Financial Plan 740 19 12 1,233,466 1,221,728 11,738 - 38,386 1,271,852 Communications 740 19 14 779,615 616,007 163,608 - 8,393 788,008 COG Health Plan 640 19 25 5,398,507 - 5,398,507 - (5,398,507) - COG Dental Plan 660 19 26 630,475 - 630,475 - (630,475) - Support Services 740 19 23 116,914 91,777 25,137 - (116,914) - Citywide Services Totals 9,247,803 2,719,390 6,528,413 (0) (6,090,943) 3,156,860
Administration 110 21 1 1,150,420 1,010,155 140,265 - (9,114) 1,141,305 Support Services 110 21 22 7,714,663 943,928 6,770,735 - (7,714,663) - Police Operations 110 21 31 14,647,299 11,569,936 2,879,424 197,939 2,318,602 16,965,901 Police Investigations 110 21 40 3,578,706 3,248,189 299,702 30,815 (31,722) 3,546,984 Police Services 110 21 51 941,981 732,165 209,816 - (639) 941,342 Police Operations- PFP 201 21 32 2,518,502 2,384,729 133,773 - (3,496) 2,515,006 Police Investigations-PFP 201 21 33 677,800 674,395 3,405 - - 677,800 Police Foundation 810 21 53 38,712 - 38,712 - (1,042) 37,670 K-9 Program 810 21 61 2,000 - 2,000 - - 2,000 Education Program 810 21 64 175 - 175 - - 175 Fed/State Asset Seizure 810 21 78 267,442 - 141,268 126,174 (128,612) 138,830 JAG 810 21 93 9,671 8,122 1,549 - - 9,671 EMGET Grant 810 21 96 502,534 486,147 16,387 - - 502,534 2011 COPS Grant 810 21 98 569,364 569,364 - - - 569,364 Police Records 110 21 50 1,730,473 1,574,137 156,336 - - 1,730,473 ICR Allocations - - - - (3,867,407) (3,867,407) Police Totals 34,349,742 23,201,267 10,793,547 354,928 (9,438,093) 24,911,648
Fire Administration 110 22 01 755,421 720,728 34,693 - (1,839) 753,582 Emergency Operations 110 22 40 13,953,972 12,123,821 1,721,332 108,819 1,895,231 15,849,203 Fire Prevention 110 22 50 845,846 686,756 56,025 103,065 (103,293) 742,553 Support Services 110 22 60 4,471,561 782,511 3,689,050 - (4,471,561) - Training & Safety 110 22 65 969,200 697,352 271,848 - - 969,200 Emergency Operations- PFP 201 22 32 2,434,859 2,432,425 2,434 - (2,434) 2,432,425 Fire Stations 610 22 70 245,292 - 245,292 - - 245,292 Fire Dept Donation Fund 810 22 31 357,881 - 11,517 346,364 (346,364) 11,517 SAFER Grant 810 22 33 376,959 376,959 - - - 376,959 ICR Allocations - - - - (2,539,067) (2,539,067) Fire & Emergency Services Totals 24,410,991 17,820,552 6,032,191 558,248 (5,569,327) 18,841,664
Urban Design and Planning 269 32 50 2,816,388 2,397,621 358,824 59,943 17,316 2,833,703 Support Services 269 32 60 919,472 82,539 836,933 - (919,472) - Brownfield Grant 810 32 40 16,948 - 16,948 - - 16,949 ICR Allocations - - - - (612,032) (612,032) Urban Design & Planning Services Totals 3,752,808 2,480,160 1,212,705 59,943 (1,514,188) 2,238,620
UR Admin 290 31 10 693,306 532,797 160,509 - (8,074) 685,232 Support Services 290 31 22 564,720 19,867 544,853 - (564,720) - Urban Renewal CIP 390 82 00 541,771 - 541,771 - (74,922) 466,849 Urban Renewal District 950 37 00 1,705,600 - 1,705,600 - (1,705,600) - ICR Allocations (92,948) (92,948) Urban Renewal Totals 3,505,397 552,664 2,952,733 - (2,446,264) 1,059,133
85
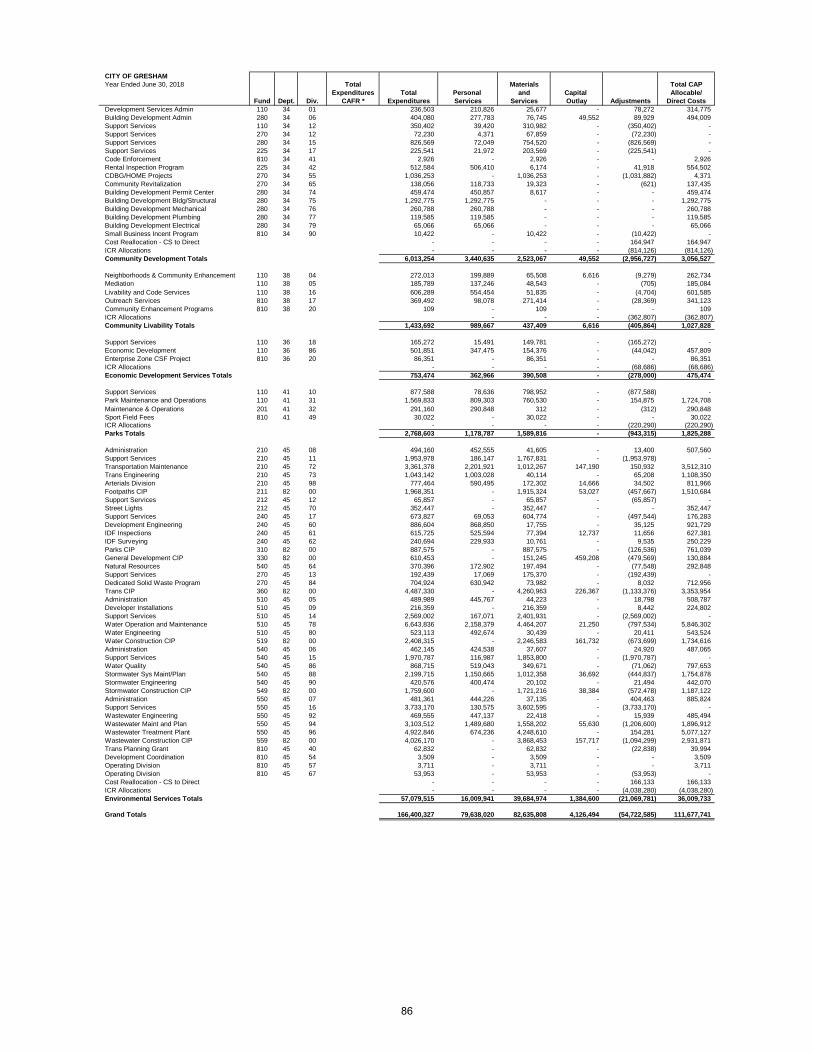
CITY OF GRESHAMYear Ended June 30, 2018 Total Materials Total CAP
Expenditures Total Personal and Capital Allocable/Fund Dept. Div. CAFR * Expenditures Services Services Outlay Adjustments Direct Costs
Development Services Admin 110 34 01 236,503 210,826 25,677 - 78,272 314,775 Building Development Admin 280 34 06 404,080 277,783 76,745 49,552 89,929 494,009 Support Services 110 34 12 350,402 39,420 310,982 - (350,402) - Support Services 270 34 12 72,230 4,371 67,859 - (72,230) - Support Services 280 34 15 826,569 72,049 754,520 - (826,569) - Support Services 225 34 17 225,541 21,972 203,569 - (225,541) - Code Enforcement 810 34 41 2,926 - 2,926 - - 2,926 Rental Inspection Program 225 34 42 512,584 506,410 6,174 - 41,918 554,502 CDBG/HOME Projects 270 34 55 1,036,253 - 1,036,253 - (1,031,882) 4,371 Community Revitalization 270 34 65 138,056 118,733 19,323 - (621) 137,435 Building Development Permit Center 280 34 74 459,474 450,857 8,617 - - 459,474 Building Development Bldg/Structural 280 34 75 1,292,775 1,292,775 - - - 1,292,775 Building Development Mechanical 280 34 76 260,788 260,788 - - - 260,788 Building Development Plumbing 280 34 77 119,585 119,585 - - - 119,585 Building Development Electrical 280 34 79 65,066 65,066 - - - 65,066 Small Business Incent Program 810 34 90 10,422 - 10,422 - (10,422) - Cost Reallocation - CS to Direct - - - - 164,947 164,947 ICR Allocations - - - - (814,126) (814,126) Community Development Totals 6,013,254 3,440,635 2,523,067 49,552 (2,956,727) 3,056,527
Neighborhoods & Community Enhancement 110 38 04 272,013 199,889 65,508 6,616 (9,279) 262,734 Mediation 110 38 05 185,789 137,246 48,543 - (705) 185,084 Livability and Code Services 110 38 16 606,289 554,454 51,835 - (4,704) 601,585 Outreach Services 810 38 17 369,492 98,078 271,414 - (28,369) 341,123 Community Enhancement Programs 810 38 20 109 - 109 - - 109 ICR Allocations - - - (362,807) (362,807) Community Livability Totals 1,433,692 989,667 437,409 6,616 (405,864) 1,027,828
Support Services 110 36 18 165,272 15,491 149,781 - (165,272) - Economic Development 110 36 86 501,851 347,475 154,376 - (44,042) 457,809 Enterprise Zone CSF Project 810 36 20 86,351 - 86,351 - - 86,351 ICR Allocations - - - - (68,686) (68,686) Economic Development Services Totals 753,474 362,966 390,508 - (278,000) 475,474
Support Services 110 41 10 877,588 78,636 798,952 - (877,588) - Park Maintenance and Operations 110 41 31 1,569,833 809,303 760,530 - 154,875 1,724,708 Maintenance & Operations 201 41 32 291,160 290,848 312 - (312) 290,848 Sport Field Fees 810 41 49 30,022 - 30,022 - - 30,022 ICR Allocations - - - - (220,290) (220,290) Parks Totals 2,768,603 1,178,787 1,589,816 - (943,315) 1,825,288
Administration 210 45 08 494,160 452,555 41,605 - 13,400 507,560 Support Services 210 45 11 1,953,978 186,147 1,767,831 - (1,953,978) - Transportation Maintenance 210 45 72 3,361,378 2,201,921 1,012,267 147,190 150,932 3,512,310 Trans Engineering 210 45 73 1,043,142 1,003,028 40,114 - 65,208 1,108,350 Arterials Division 210 45 98 777,464 590,495 172,302 14,666 34,502 811,966 Footpaths CIP 211 82 00 1,968,351 - 1,915,324 53,027 (457,667) 1,510,684 Support Services 212 45 12 65,857 - 65,857 - (65,857) - Street Lights 212 45 70 352,447 - 352,447 - - 352,447 Support Services 240 45 17 673,827 69,053 604,774 - (497,544) 176,283 Development Engineering 240 45 60 886,604 868,850 17,755 - 35,125 921,729 IDF Inspections 240 45 61 615,725 525,594 77,394 12,737 11,656 627,381 IDF Surveying 240 45 62 240,694 229,933 10,761 - 9,535 250,229 Parks CIP 310 82 00 887,575 - 887,575 - (126,536) 761,039 General Development CIP 330 82 00 610,453 - 151,245 459,208 (479,569) 130,884 Natural Resources 540 45 64 370,396 172,902 197,494 - (77,548) 292,848 Support Services 270 45 13 192,439 17,069 175,370 - (192,439) - Dedicated Solid Waste Program 270 45 84 704,924 630,942 73,982 - 8,032 712,956 Trans CIP 360 82 00 4,487,330 - 4,260,963 226,367 (1,133,376) 3,353,954 Administration 510 45 05 489,989 445,767 44,223 - 18,798 508,787 Developer Installations 510 45 09 216,359 - 216,359 - 8,442 224,802 Support Services 510 45 14 2,569,002 167,071 2,401,931 - (2,569,002) - Water Operation and Maintenance 510 45 78 6,643,836 2,158,379 4,464,207 21,250 (797,534) 5,846,302 Water Engineering 510 45 80 523,113 492,674 30,439 - 20,411 543,524 Water Construction CIP 519 82 00 2,408,315 - 2,246,583 161,732 (673,699) 1,734,616 Administration 540 45 06 462,145 424,538 37,607 - 24,920 487,065 Support Services 540 45 15 1,970,787 116,987 1,853,800 - (1,970,787) - Water Quality 540 45 86 868,715 519,043 349,671 - (71,062) 797,653 Stormwater Sys Maint/Plan 540 45 88 2,199,715 1,150,665 1,012,358 36,692 (444,837) 1,754,878 Stormwater Engineering 540 45 90 420,576 400,474 20,102 - 21,494 442,070 Stormwater Construction CIP 549 82 00 1,759,600 - 1,721,216 38,384 (572,478) 1,187,122 Administration 550 45 07 481,361 444,226 37,135 - 404,463 885,824 Support Services 550 45 16 3,733,170 130,575 3,602,595 - (3,733,170) - Wastewater Engineering 550 45 92 469,555 447,137 22,418 - 15,939 485,494 Wastewater Maint and Plan 550 45 94 3,103,512 1,489,680 1,558,202 55,630 (1,206,600) 1,896,912 Wastewater Treatment Plant 550 45 96 4,922,846 674,236 4,248,610 - 154,281 5,077,127 Wastewater Construction CIP 559 82 00 4,026,170 - 3,868,453 157,717 (1,094,299) 2,931,871 Trans Planning Grant 810 45 40 62,832 - 62,832 - (22,838) 39,994 Development Coordination 810 45 54 3,509 - 3,509 - - 3,509 Operating Division 810 45 57 3,711 - 3,711 - - 3,711 Operating Division 810 45 67 53,953 - 53,953 - (53,953) - Cost Reallocation - CS to Direct - - - - 166,133 166,133 ICR Allocations - - - - (4,038,280) (4,038,280) Environmental Services Totals 57,079,515 16,009,941 39,684,974 1,384,600 (21,069,781) 36,009,733
Grand Totals 166,400,327 79,638,020 82,635,808 4,126,494 (54,722,585) 111,677,741
86
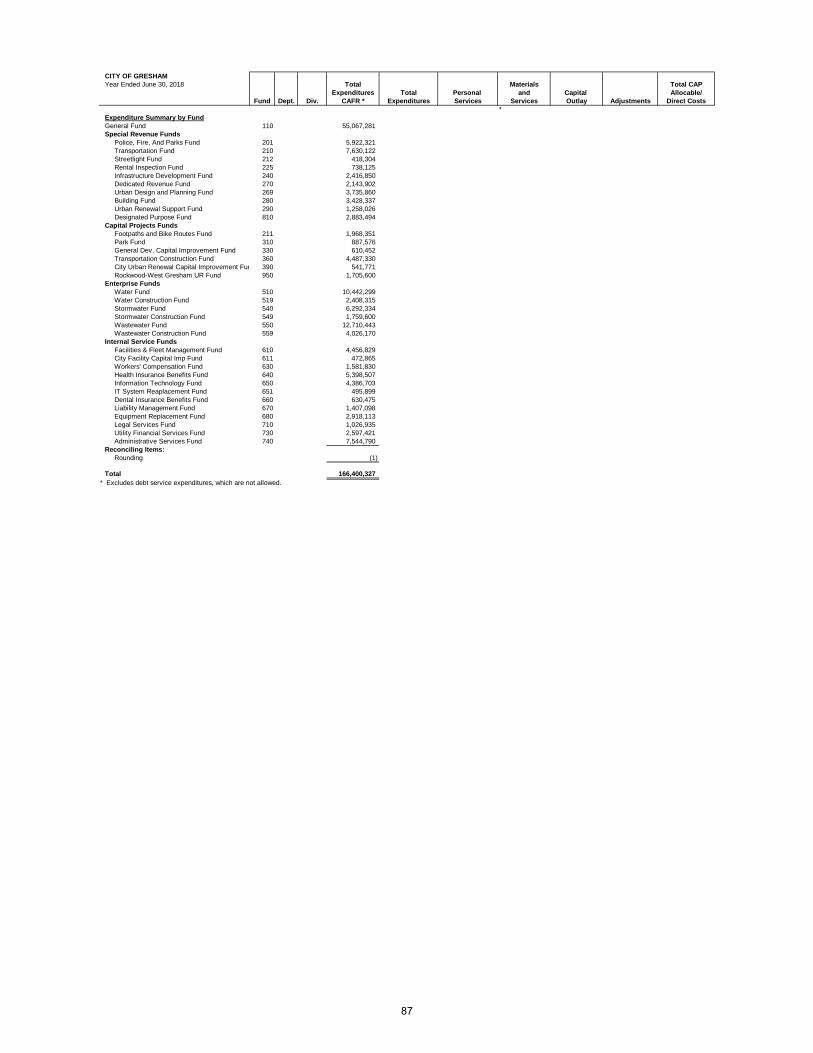
CITY OF GRESHAMYear Ended June 30, 2018 Total Materials Total CAP
Expenditures Total Personal and Capital Allocable/Fund Dept. Div. CAFR * Expenditures Services Services Outlay Adjustments Direct Costs
*
General Fund 110 55,067,281 Special Revenue Funds Police, Fire, And Parks Fund 201 5,922,321 Transportation Fund 210 7,630,122 Streetlight Fund 212 418,304 Rental Inspection Fund 225 738,125 Infrastructure Development Fund 240 2,416,850 Dedicated Revenue Fund 270 2,143,902 Urban Design and Planning Fund 269 3,735,860 Building Fund 280 3,428,337 Urban Renewal Support Fund 290 1,258,026 Designated Purpose Fund 810 2,883,494 Capital Projects Funds Footpaths and Bike Routes Fund 211 1,968,351 Park Fund 310 887,576 General Dev. Capital Improvement Fund 330 610,452 Transportation Construction Fund 360 4,487,330 City Urban Renewal Capital Improvement Fun 390 541,771 Rockwood-West Gresham UR Fund 950 1,705,600 Enterprise Funds Water Fund 510 10,442,299 Water Construction Fund 519 2,408,315 Stormwater Fund 540 6,292,334 Stormwater Construction Fund 549 1,759,600 Wastewater Fund 550 12,710,443 Wastewater Construction Fund 559 4,026,170 Internal Service Funds Facilities & Fleet Management Fund 610 4,456,829 City Facility Capital Imp Fund 611 472,865 Workers' Compensation Fund 630 1,581,830 Health Insurance Benefits Fund 640 5,398,507 Information Technology Fund 650 4,386,703 IT System Reaplacement Fund 651 495,899 Dental Insurance Benefits Fund 660 630,475 Liability Management Fund 670 1,407,098 Equipment Replacement Fund 680 2,918,113 Legal Services Fund 710 1,026,935 Utility Financial Services Fund 730 2,597,421 Administrative Services Fund 740 7,544,790 Reconciling Items: Rounding (1)
Total 166,400,327* Excludes debt service expenditures, which are not allowed.
Expenditure Summary by Fund
87
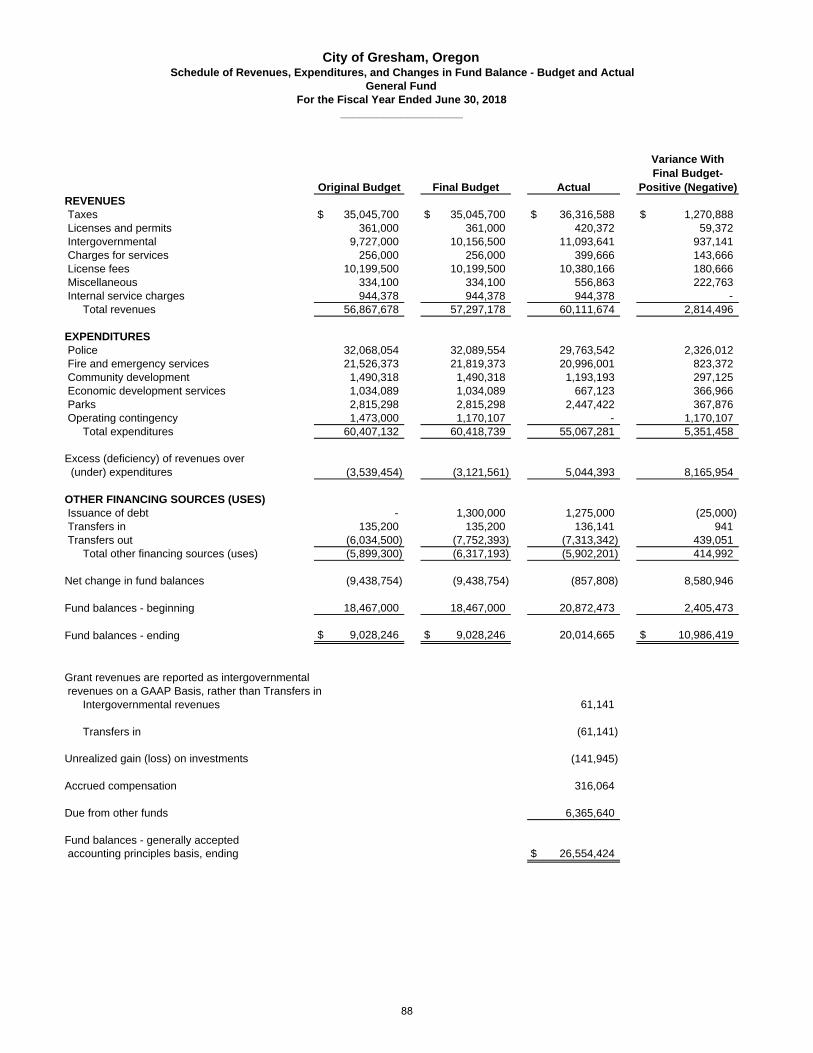
REVENUES Taxes $ 35,045,700 $ 35,045,700 $ 36,316,588 $ 1,270,888 Licenses and permits 361,000 361,000 420,372 59,372 Intergovernmental 9,727,000 10,156,500 11,093,641 937,141 Charges for services 256,000 256,000 399,666 143,666 License fees 10,199,500 10,199,500 10,380,166 180,666 Miscellaneous 334,100 334,100 556,863 222,763 Internal service charges 944,378 944,378 944,378 -
Total revenues 56,867,678 57,297,178 60,111,674 2,814,496
EXPENDITURES Police 32,068,054 32,089,554 29,763,542 2,326,012 Fire and emergency services 21,526,373 21,819,373 20,996,001 823,372 Community development 1,490,318 1,490,318 1,193,193 297,125 Economic development services 1,034,089 1,034,089 667,123 366,966 Parks 2,815,298 2,815,298 2,447,422 367,876 Operating contingency 1,473,000 1,170,107 - 1,170,107
Total expenditures 60,407,132 60,418,739 55,067,281 5,351,458
Excess (deficiency) of revenues over (under) expenditures (3,539,454) (3,121,561) 5,044,393 8,165,954
OTHER FINANCING SOURCES (USES) Issuance of debt - 1,300,000 1,275,000 (25,000) Transfers in 135,200 135,200 136,141 941 Transfers out (6,034,500) (7,752,393) (7,313,342) 439,051
Total other financing sources (uses) (5,899,300) (6,317,193) (5,902,201) 414,992
Net change in fund balances (9,438,754) (9,438,754) (857,808) 8,580,946
Fund balances - beginning 18,467,000 18,467,000 20,872,473 2,405,473
Fund balances - ending $ 9,028,246 $ 9,028,246 20,014,665 $ 10,986,419
Grant revenues are reported as intergovernmental revenues on a GAAP Basis, rather than Transfers in
Intergovernmental revenues 61,141
Transfers in (61,141)
Unrealized gain (loss) on investments (141,945)
Accrued compensation 316,064
Due from other funds 6,365,640
Fund balances - generally accepted accounting principles basis, ending $ 26,554,424
Original Budget Final Budget Actual
Variance With Final Budget-
Positive (Negative)
City of Gresham, OregonSchedule of Revenues, Expenditures, and Changes in Fund Balance - Budget and Actual
General FundFor the Fiscal Year Ended June 30, 2018
____________________
88
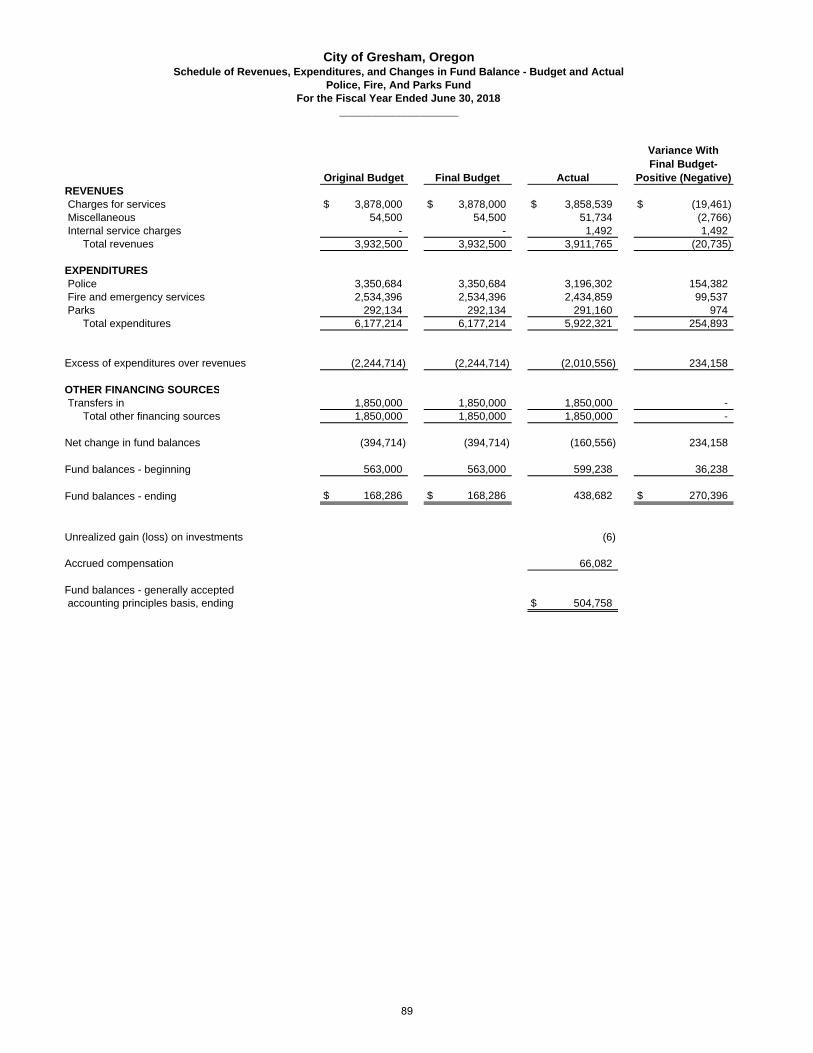
REVENUES Charges for services $ 3,878,000 $ 3,878,000 $ 3,858,539 $ (19,461) Miscellaneous 54,500 54,500 51,734 (2,766) Internal service charges - - 1,492 1,492
Total revenues 3,932,500 3,932,500 3,911,765 (20,735)
EXPENDITURES Police 3,350,684 3,350,684 3,196,302 154,382 Fire and emergency services 2,534,396 2,534,396 2,434,859 99,537 Parks 292,134 292,134 291,160 974
Total expenditures 6,177,214 6,177,214 5,922,321 254,893
Excess of expenditures over revenues (2,244,714) (2,244,714) (2,010,556) 234,158
OTHER FINANCING SOURCES Transfers in 1,850,000 1,850,000 1,850,000 -
Total other financing sources 1,850,000 1,850,000 1,850,000 -
Net change in fund balances (394,714) (394,714) (160,556) 234,158
Fund balances - beginning 563,000 563,000 599,238 36,238
Fund balances - ending $ 168,286 $ 168,286 438,682 $ 270,396
Unrealized gain (loss) on investments (6)
Accrued compensation 66,082
Fund balances - generally accepted accounting principles basis, ending $ 504,758
Original Budget Final Budget Actual
Variance With Final Budget-
Positive (Negative)
City of Gresham, OregonSchedule of Revenues, Expenditures, and Changes in Fund Balance - Budget and Actual
Police, Fire, And Parks FundFor the Fiscal Year Ended June 30, 2018
____________________
89
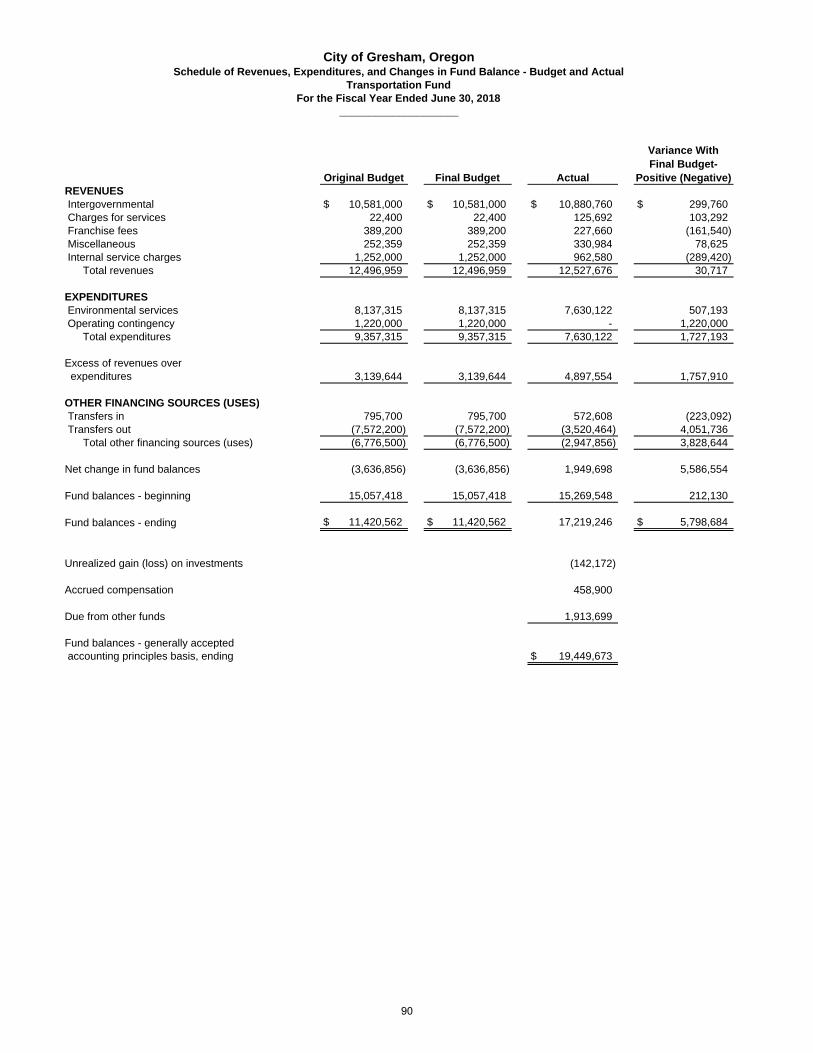
REVENUES Intergovernmental $ 10,581,000 $ 10,581,000 $ 10,880,760 $ 299,760 Charges for services 22,400 22,400 125,692 103,292 Franchise fees 389,200 389,200 227,660 (161,540) Miscellaneous 252,359 252,359 330,984 78,625 Internal service charges 1,252,000 1,252,000 962,580 (289,420)
Total revenues 12,496,959 12,496,959 12,527,676 30,717
EXPENDITURES Environmental services 8,137,315 8,137,315 7,630,122 507,193 Operating contingency 1,220,000 1,220,000 - 1,220,000
Total expenditures 9,357,315 9,357,315 7,630,122 1,727,193
Excess of revenues over expenditures 3,139,644 3,139,644 4,897,554 1,757,910
OTHER FINANCING SOURCES (USES) Transfers in 795,700 795,700 572,608 (223,092) Transfers out (7,572,200) (7,572,200) (3,520,464) 4,051,736
Total other financing sources (uses) (6,776,500) (6,776,500) (2,947,856) 3,828,644
Net change in fund balances (3,636,856) (3,636,856) 1,949,698 5,586,554
Fund balances - beginning 15,057,418 15,057,418 15,269,548 212,130
Fund balances - ending $ 11,420,562 $ 11,420,562 17,219,246 $ 5,798,684
Unrealized gain (loss) on investments (142,172)
Accrued compensation 458,900
Due from other funds 1,913,699
Fund balances - generally accepted accounting principles basis, ending $ 19,449,673
Original Budget Final Budget Actual
Variance With Final Budget-
Positive (Negative)
City of Gresham, OregonSchedule of Revenues, Expenditures, and Changes in Fund Balance - Budget and Actual
Transportation FundFor the Fiscal Year Ended June 30, 2018
____________________
90
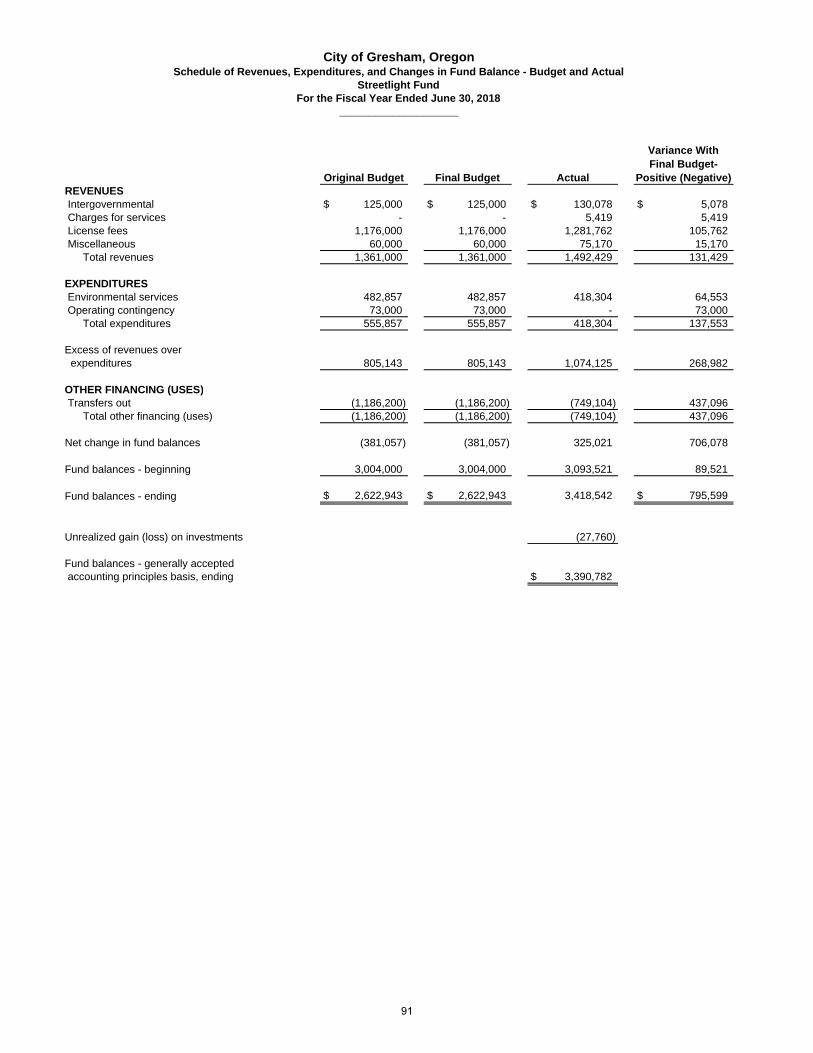
REVENUES Intergovernmental $ 125,000 $ 125,000 $ 130,078 $ 5,078 Charges for services - - 5,419 5,419 License fees 1,176,000 1,176,000 1,281,762 105,762 Miscellaneous 60,000 60,000 75,170 15,170
Total revenues 1,361,000 1,361,000 1,492,429 131,429
EXPENDITURES Environmental services 482,857 482,857 418,304 64,553 Operating contingency 73,000 73,000 - 73,000
Total expenditures 555,857 555,857 418,304 137,553
Excess of revenues over expenditures 805,143 805,143 1,074,125 268,982
OTHER FINANCING (USES) Transfers out (1,186,200) (1,186,200) (749,104) 437,096
Total other financing (uses) (1,186,200) (1,186,200) (749,104) 437,096
Net change in fund balances (381,057) (381,057) 325,021 706,078
Fund balances - beginning 3,004,000 3,004,000 3,093,521 89,521
Fund balances - ending $ 2,622,943 $ 2,622,943 3,418,542 $ 795,599
Unrealized gain (loss) on investments (27,760)
Fund balances - generally accepted accounting principles basis, ending $ 3,390,782
Original Budget Final Budget Actual
Variance With Final Budget-
Positive (Negative)
City of Gresham, OregonSchedule of Revenues, Expenditures, and Changes in Fund Balance - Budget and Actual
Streetlight FundFor the Fiscal Year Ended June 30, 2018
____________________
91
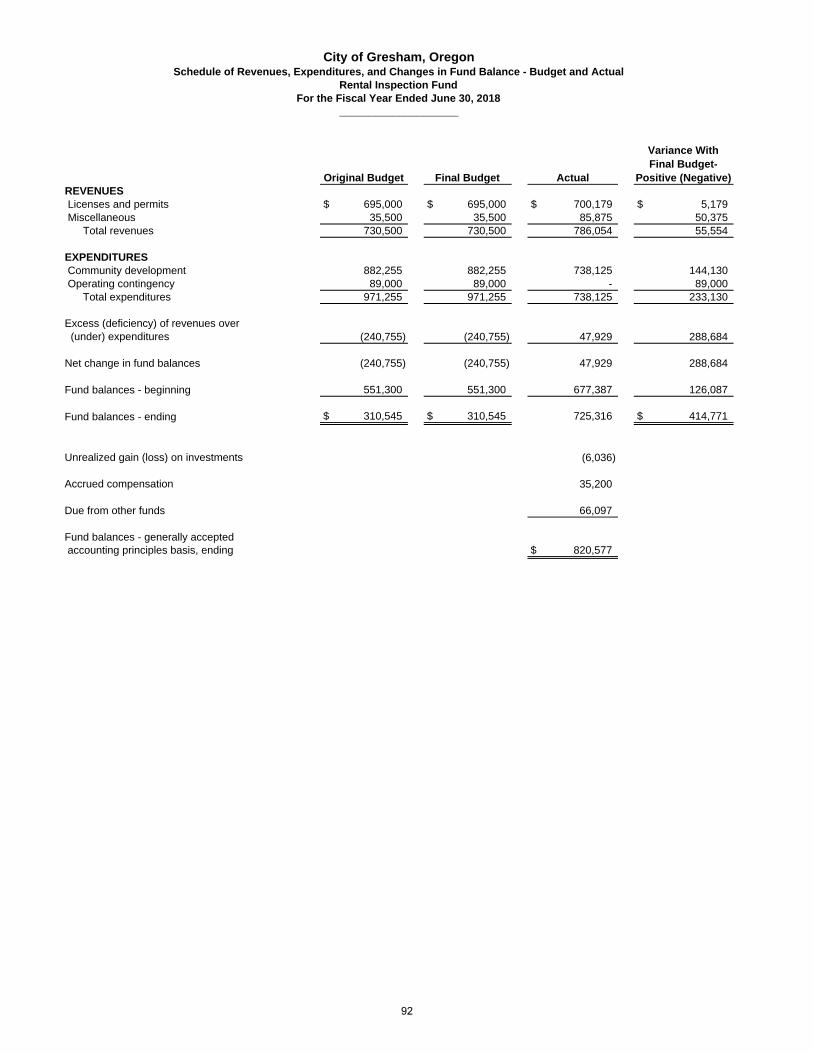
REVENUES Licenses and permits $ 695,000 $ 695,000 $ 700,179 $ 5,179 Miscellaneous 35,500 35,500 85,875 50,375
Total revenues 730,500 730,500 786,054 55,554
EXPENDITURES Community development 882,255 882,255 738,125 144,130 Operating contingency 89,000 89,000 - 89,000
Total expenditures 971,255 971,255 738,125 233,130
Excess (deficiency) of revenues over (under) expenditures (240,755) (240,755) 47,929 288,684
Net change in fund balances (240,755) (240,755) 47,929 288,684
Fund balances - beginning 551,300 551,300 677,387 126,087
Fund balances - ending $ 310,545 $ 310,545 725,316 $ 414,771
Unrealized gain (loss) on investments (6,036)
Accrued compensation 35,200
Due from other funds 66,097
Fund balances - generally accepted accounting principles basis, ending $ 820,577
Original Budget Final Budget Actual
Variance With Final Budget-
Positive (Negative)
City of Gresham, OregonSchedule of Revenues, Expenditures, and Changes in Fund Balance - Budget and Actual
Rental Inspection FundFor the Fiscal Year Ended June 30, 2018
____________________
92
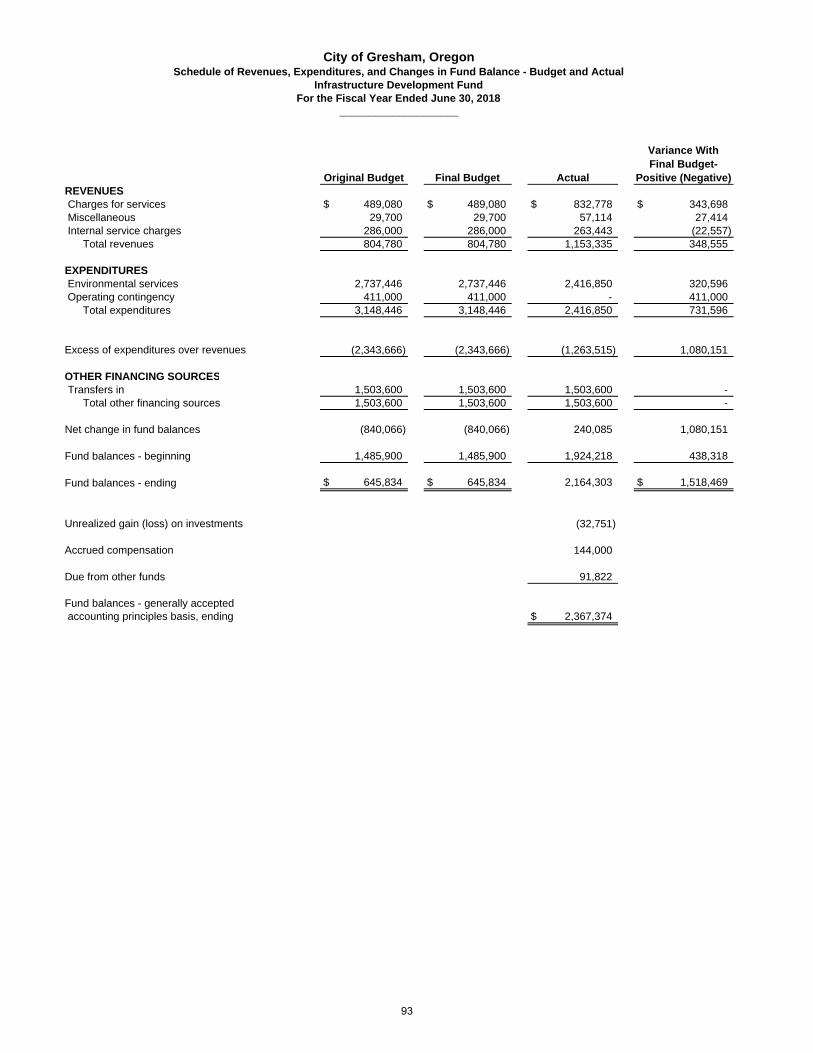
REVENUES Charges for services $ 489,080 $ 489,080 $ 832,778 $ 343,698 Miscellaneous 29,700 29,700 57,114 27,414 Internal service charges 286,000 286,000 263,443 (22,557)
Total revenues 804,780 804,780 1,153,335 348,555
EXPENDITURES Environmental services 2,737,446 2,737,446 2,416,850 320,596 Operating contingency 411,000 411,000 - 411,000
Total expenditures 3,148,446 3,148,446 2,416,850 731,596
Excess of expenditures over revenues (2,343,666) (2,343,666) (1,263,515) 1,080,151
OTHER FINANCING SOURCES Transfers in 1,503,600 1,503,600 1,503,600 -
Total other financing sources 1,503,600 1,503,600 1,503,600 -
Net change in fund balances (840,066) (840,066) 240,085 1,080,151
Fund balances - beginning 1,485,900 1,485,900 1,924,218 438,318
Fund balances - ending $ 645,834 $ 645,834 2,164,303 $ 1,518,469
Unrealized gain (loss) on investments (32,751)
Accrued compensation 144,000
Due from other funds 91,822
Fund balances - generally accepted accounting principles basis, ending $ 2,367,374
Original Budget Final Budget Actual
Variance With Final Budget-
Positive (Negative)
City of Gresham, OregonSchedule of Revenues, Expenditures, and Changes in Fund Balance - Budget and Actual
Infrastructure Development FundFor the Fiscal Year Ended June 30, 2018
____________________
93
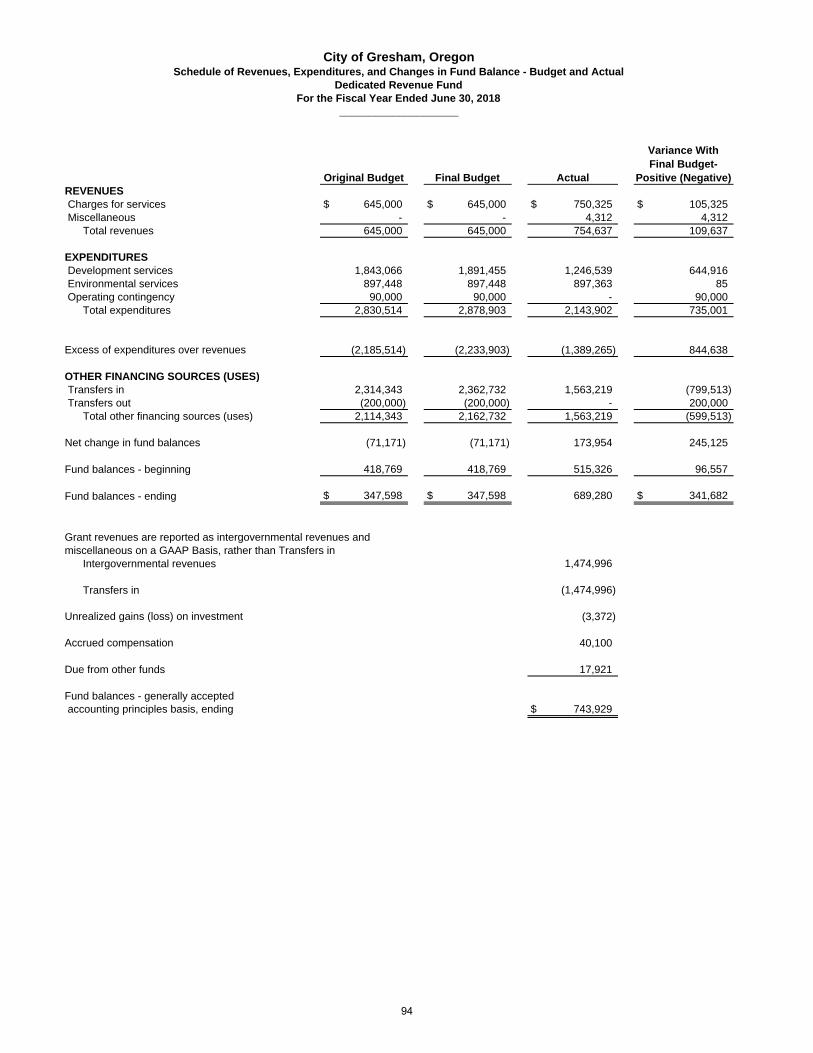
REVENUES Charges for services $ 645,000 $ 645,000 $ 750,325 $ 105,325 Miscellaneous - - 4,312 4,312
Total revenues 645,000 645,000 754,637 109,637
EXPENDITURES Development services 1,843,066 1,891,455 1,246,539 644,916 Environmental services 897,448 897,448 897,363 85 Operating contingency 90,000 90,000 - 90,000
Total expenditures 2,830,514 2,878,903 2,143,902 735,001
Excess of expenditures over revenues (2,185,514) (2,233,903) (1,389,265) 844,638
OTHER FINANCING SOURCES (USES) Transfers in 2,314,343 2,362,732 1,563,219 (799,513) Transfers out (200,000) (200,000) - 200,000
Total other financing sources (uses) 2,114,343 2,162,732 1,563,219 (599,513)
Net change in fund balances (71,171) (71,171) 173,954 245,125
Fund balances - beginning 418,769 418,769 515,326 96,557
Fund balances - ending $ 347,598 $ 347,598 689,280 $ 341,682
Grant revenues are reported as intergovernmental revenues and miscellaneous on a GAAP Basis, rather than Transfers in
Intergovernmental revenues 1,474,996
Transfers in (1,474,996)
Unrealized gains (loss) on investment (3,372)
Accrued compensation 40,100
Due from other funds 17,921
Fund balances - generally accepted accounting principles basis, ending $ 743,929
Original Budget Final Budget Actual
Variance With Final Budget-
Positive (Negative)
City of Gresham, OregonSchedule of Revenues, Expenditures, and Changes in Fund Balance - Budget and Actual
Dedicated Revenue FundFor the Fiscal Year Ended June 30, 2018
____________________
94

REVENUES Charges for services $ 940,000 $ 940,000 $ 908,149 $ (31,851) Miscellaneous 32,200 32,200 42,217 10,017
Total revenues 972,200 972,200 950,366 (21,834)
EXPENDITURES Urban design and planning 4,143,706 4,193,706 3,735,860 457,846 Operating contingency 414,000 414,000 - 414,000
Total expenditures 4,557,706 4,607,706 3,735,860 871,846
Excess of expenditures over revenues (3,585,506) (3,635,506) (2,785,494) 850,012
OTHER FINANCING SOURCES (USES) Transfers in 2,500,000 2,500,000 2,370,470 (129,530) Transfers out (139,200) (139,200) (139,200) -
Total other financing sources (uses) 2,360,800 2,360,800 2,231,270 (129,530)
Net change in fund balances (1,224,706) (1,274,706) (554,224) 720,482
Fund balances - beginning 2,082,000 2,132,000 2,332,908 200,908
Fund balances - ending $ 857,294 $ 857,294 1,778,684 $ 921,390
Unrealized gain (loss) on investments (17,486)
Accrued compensation 205,500
Fund balances - generally accepted accounting principles basis, ending $ 1,966,698
City of Gresham, OregonSchedule of Revenues, Expenditures, and Changes in Fund Balance - Budget and Actual
Urban Design & Planning FundFor the Fiscal Year Ended June 30, 2018
Original Budget Final Budget Actual
Variance With Final Budget-
Positive (Negative)
____________________
95
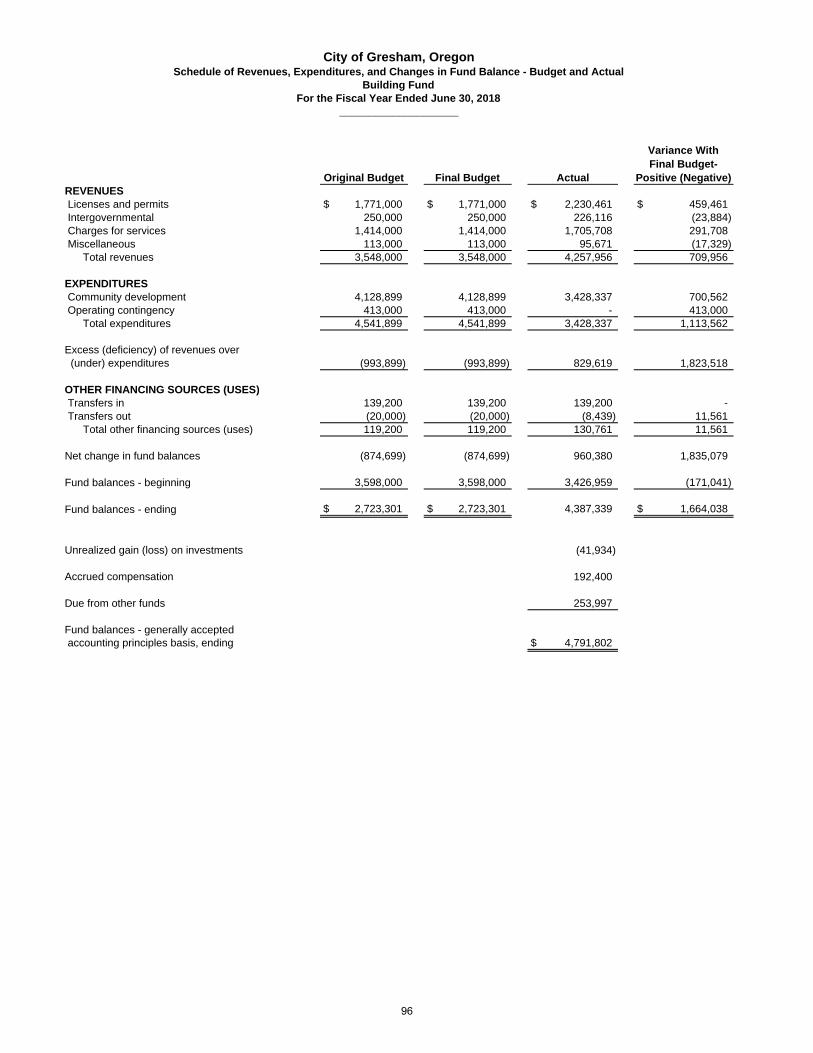
REVENUES Licenses and permits $ 1,771,000 $ 1,771,000 $ 2,230,461 $ 459,461 Intergovernmental 250,000 250,000 226,116 (23,884) Charges for services 1,414,000 1,414,000 1,705,708 291,708 Miscellaneous 113,000 113,000 95,671 (17,329)
Total revenues 3,548,000 3,548,000 4,257,956 709,956
EXPENDITURES Community development 4,128,899 4,128,899 3,428,337 700,562 Operating contingency 413,000 413,000 - 413,000
Total expenditures 4,541,899 4,541,899 3,428,337 1,113,562
Excess (deficiency) of revenues over (under) expenditures (993,899) (993,899) 829,619 1,823,518
OTHER FINANCING SOURCES (USES) Transfers in 139,200 139,200 139,200 - Transfers out (20,000) (20,000) (8,439) 11,561
Total other financing sources (uses) 119,200 119,200 130,761 11,561
Net change in fund balances (874,699) (874,699) 960,380 1,835,079
Fund balances - beginning 3,598,000 3,598,000 3,426,959 (171,041)
Fund balances - ending $ 2,723,301 $ 2,723,301 4,387,339 $ 1,664,038
Unrealized gain (loss) on investments (41,934)
Accrued compensation 192,400
Due from other funds 253,997
Fund balances - generally accepted accounting principles basis, ending $ 4,791,802
Original Budget Final Budget Actual
Variance With Final Budget-
Positive (Negative)
City of Gresham, OregonSchedule of Revenues, Expenditures, and Changes in Fund Balance - Budget and Actual
Building FundFor the Fiscal Year Ended June 30, 2018
____________________
96

REVENUES Intergovernmental $ 2,244,900 $ 2,244,900 $ 1,195,500 $ (1,049,400)
Total revenues 2,244,900 2,244,900 1,195,500 (1,049,400)
EXPENDITURES Urban renewal 1,905,383 1,905,383 1,258,026 647,357 Operating contingency 200,000 200,000 - 200,000
Total expenditures 2,105,383 2,105,383 1,258,026 847,357
Excess (deficiency) of revenues over (under) expenditures 139,517 139,517 (62,526) (202,043)
OTHER FINANCING (USES) Transfers out (50,000) (50,000) - 50,000
Total other financing (uses) (50,000) (50,000) - 50,000
Net change in fund balances 89,517 89,517 (62,526) (152,043)
Fund balances - beginning 103,000 103,000 63,366 (39,634)
Fund balances - ending $ 192,517 $ 192,517 840 $ (191,677)
Unrealized gain (loss) on investments (649)
Accrued compensation 65,700
Fund balances - generally accepted accounting principles basis, ending $ 65,891
Original Budget Final Budget Actual
Variance With Final Budget-
Positive (Negative)
City of Gresham, OregonSchedule of Revenues, Expenditures, and Changes in Fund Balance - Budget and Actual
Urban Renewal Support FundFor the Fiscal Year Ended June 30, 2018
____________________
97
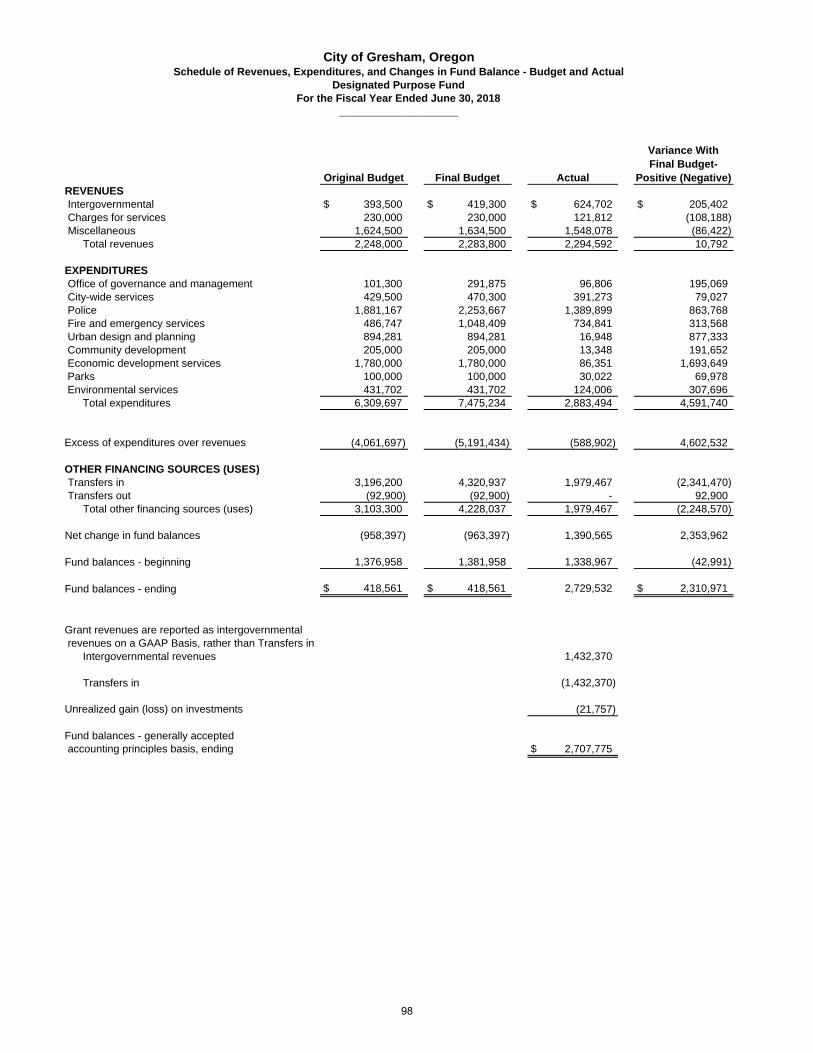
REVENUES Intergovernmental $ 393,500 $ 419,300 $ 624,702 $ 205,402 Charges for services 230,000 230,000 121,812 (108,188) Miscellaneous 1,624,500 1,634,500 1,548,078 (86,422)
Total revenues 2,248,000 2,283,800 2,294,592 10,792
EXPENDITURES Office of governance and management 101,300 291,875 96,806 195,069 City-wide services 429,500 470,300 391,273 79,027 Police 1,881,167 2,253,667 1,389,899 863,768 Fire and emergency services 486,747 1,048,409 734,841 313,568 Urban design and planning 894,281 894,281 16,948 877,333 Community development 205,000 205,000 13,348 191,652 Economic development services 1,780,000 1,780,000 86,351 1,693,649 Parks 100,000 100,000 30,022 69,978 Environmental services 431,702 431,702 124,006 307,696
Total expenditures 6,309,697 7,475,234 2,883,494 4,591,740
Excess of expenditures over revenues (4,061,697) (5,191,434) (588,902) 4,602,532
OTHER FINANCING SOURCES (USES) Transfers in 3,196,200 4,320,937 1,979,467 (2,341,470) Transfers out (92,900) (92,900) - 92,900
Total other financing sources (uses) 3,103,300 4,228,037 1,979,467 (2,248,570)
Net change in fund balances (958,397) (963,397) 1,390,565 2,353,962
Fund balances - beginning 1,376,958 1,381,958 1,338,967 (42,991)
Fund balances - ending $ 418,561 $ 418,561 2,729,532 $ 2,310,971
Grant revenues are reported as intergovernmental revenues on a GAAP Basis, rather than Transfers in
Intergovernmental revenues 1,432,370
Transfers in (1,432,370)
Unrealized gain (loss) on investments (21,757)
Fund balances - generally accepted accounting principles basis, ending $ 2,707,775
Original Budget Final Budget Actual
Variance With Final Budget-
Positive (Negative)
City of Gresham, OregonSchedule of Revenues, Expenditures, and Changes in Fund Balance - Budget and Actual
Designated Purpose FundFor the Fiscal Year Ended June 30, 2018
____________________
98
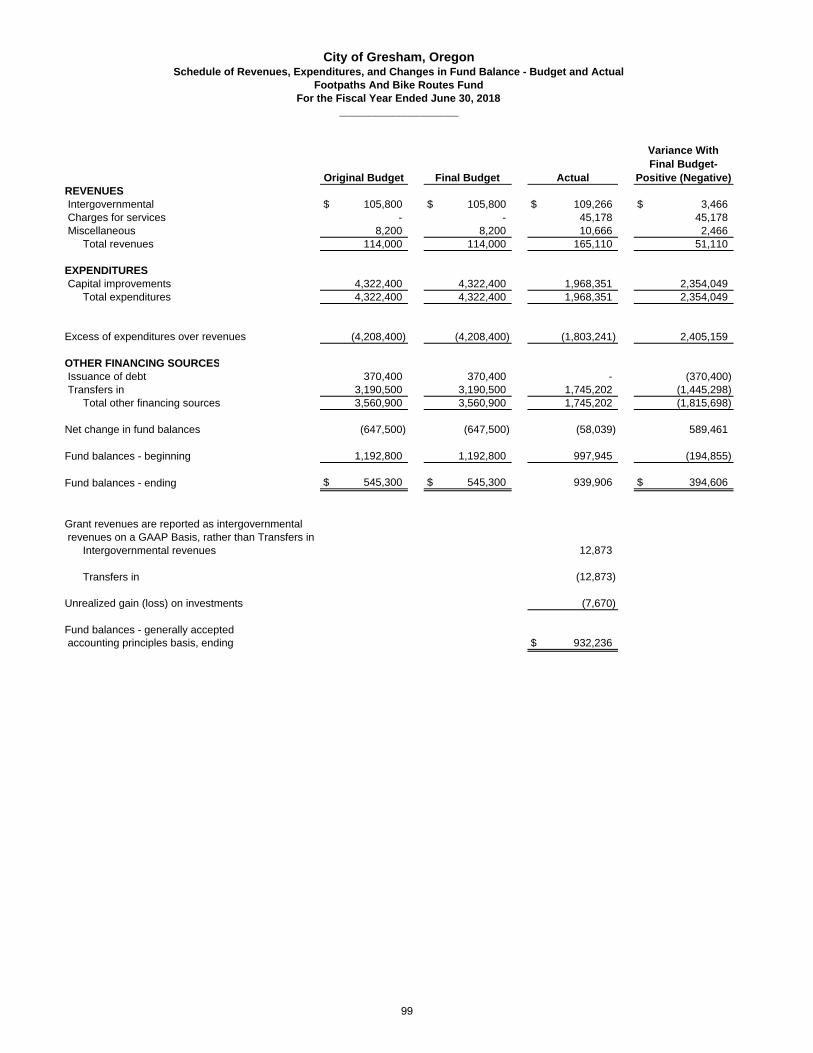
REVENUES Intergovernmental $ 105,800 $ 105,800 $ 109,266 $ 3,466 Charges for services - - 45,178 45,178 Miscellaneous 8,200 8,200 10,666 2,466
Total revenues 114,000 114,000 165,110 51,110
EXPENDITURES Capital improvements 4,322,400 4,322,400 1,968,351 2,354,049
Total expenditures 4,322,400 4,322,400 1,968,351 2,354,049
Excess of expenditures over revenues (4,208,400) (4,208,400) (1,803,241) 2,405,159
OTHER FINANCING SOURCES Issuance of debt 370,400 370,400 - (370,400) Transfers in 3,190,500 3,190,500 1,745,202 (1,445,298)
Total other financing sources 3,560,900 3,560,900 1,745,202 (1,815,698)
Net change in fund balances (647,500) (647,500) (58,039) 589,461
Fund balances - beginning 1,192,800 1,192,800 997,945 (194,855)
Fund balances - ending $ 545,300 $ 545,300 939,906 $ 394,606
Grant revenues are reported as intergovernmental revenues on a GAAP Basis, rather than Transfers in
Intergovernmental revenues 12,873
Transfers in (12,873)
Unrealized gain (loss) on investments (7,670)
Fund balances - generally accepted accounting principles basis, ending $ 932,236
Original Budget Final Budget Actual
Variance With Final Budget-
Positive (Negative)
City of Gresham, OregonSchedule of Revenues, Expenditures, and Changes in Fund Balance - Budget and Actual
Footpaths And Bike Routes FundFor the Fiscal Year Ended June 30, 2018
____________________
99
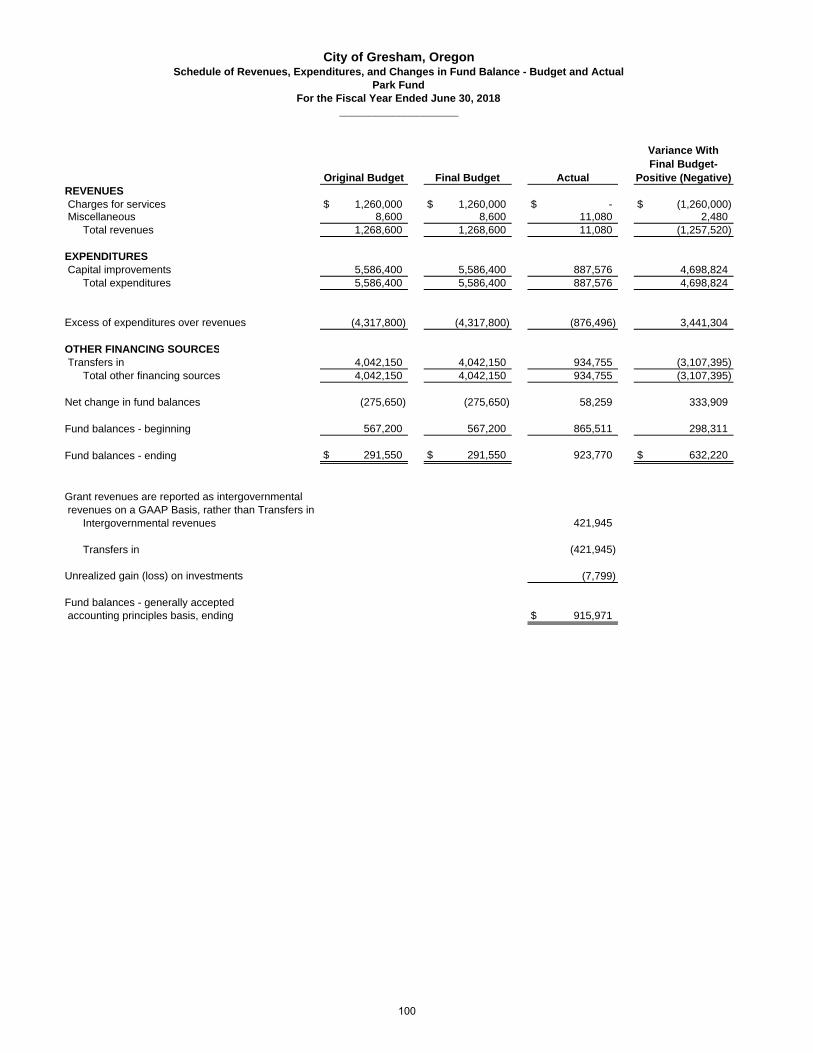
REVENUES Charges for services $ 1,260,000 $ 1,260,000 $ - $ (1,260,000) Miscellaneous 8,600 8,600 11,080 2,480
Total revenues 1,268,600 1,268,600 11,080 (1,257,520)
EXPENDITURES Capital improvements 5,586,400 5,586,400 887,576 4,698,824
Total expenditures 5,586,400 5,586,400 887,576 4,698,824
Excess of expenditures over revenues (4,317,800) (4,317,800) (876,496) 3,441,304
OTHER FINANCING SOURCES Transfers in 4,042,150 4,042,150 934,755 (3,107,395)
Total other financing sources 4,042,150 4,042,150 934,755 (3,107,395)
Net change in fund balances (275,650) (275,650) 58,259 333,909
Fund balances - beginning 567,200 567,200 865,511 298,311
Fund balances - ending $ 291,550 $ 291,550 923,770 $ 632,220
Grant revenues are reported as intergovernmental revenues on a GAAP Basis, rather than Transfers in
Intergovernmental revenues 421,945
Transfers in (421,945)
Unrealized gain (loss) on investments (7,799)
Fund balances - generally accepted accounting principles basis, ending $ 915,971
Original Budget Final Budget Actual
Variance With Final Budget-
Positive (Negative)
City of Gresham, OregonSchedule of Revenues, Expenditures, and Changes in Fund Balance - Budget and Actual
Park FundFor the Fiscal Year Ended June 30, 2018
____________________
100
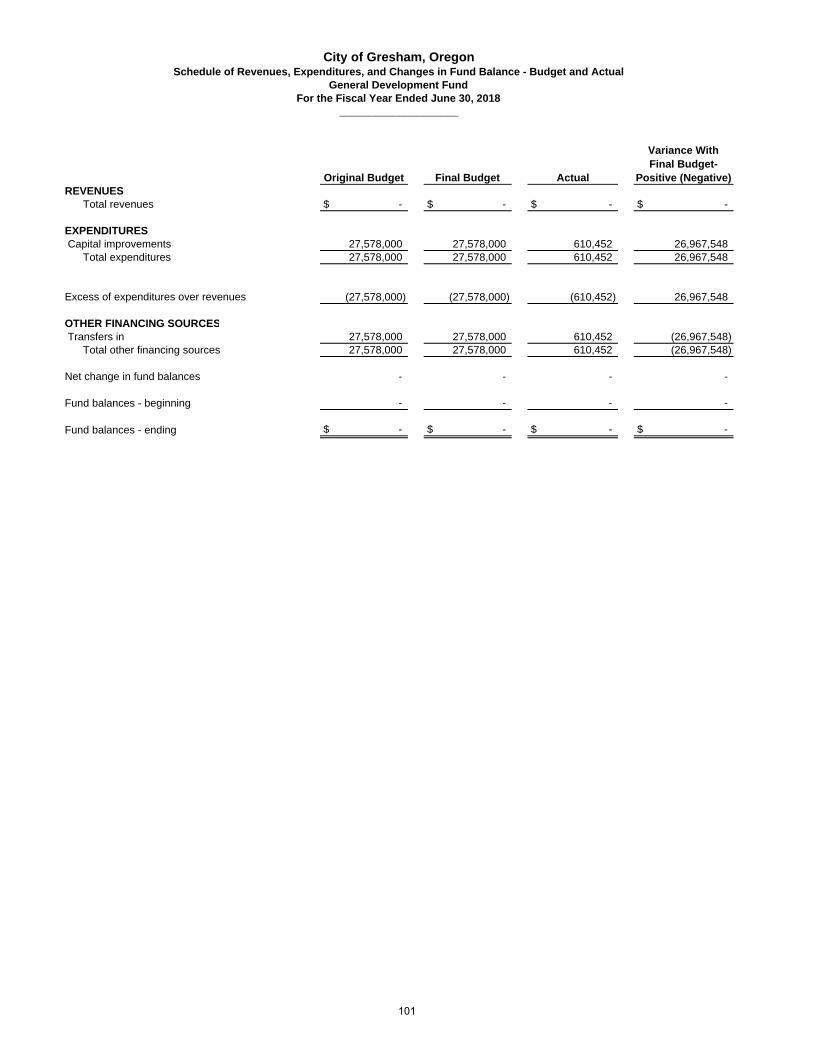
REVENUESTotal revenues $ - $ - $ - $ -
EXPENDITURES Capital improvements 27,578,000 27,578,000 610,452 26,967,548
Total expenditures 27,578,000 27,578,000 610,452 26,967,548
Excess of expenditures over revenues (27,578,000) (27,578,000) (610,452) 26,967,548
OTHER FINANCING SOURCES Transfers in 27,578,000 27,578,000 610,452 (26,967,548)
Total other financing sources 27,578,000 27,578,000 610,452 (26,967,548)
Net change in fund balances - - - -
Fund balances - beginning - - - -
Fund balances - ending $ - $ - $ - $ -
Original Budget Final Budget Actual
Variance With Final Budget-
Positive (Negative)
City of Gresham, OregonSchedule of Revenues, Expenditures, and Changes in Fund Balance - Budget and Actual
General Development FundFor the Fiscal Year Ended June 30, 2018
____________________
101
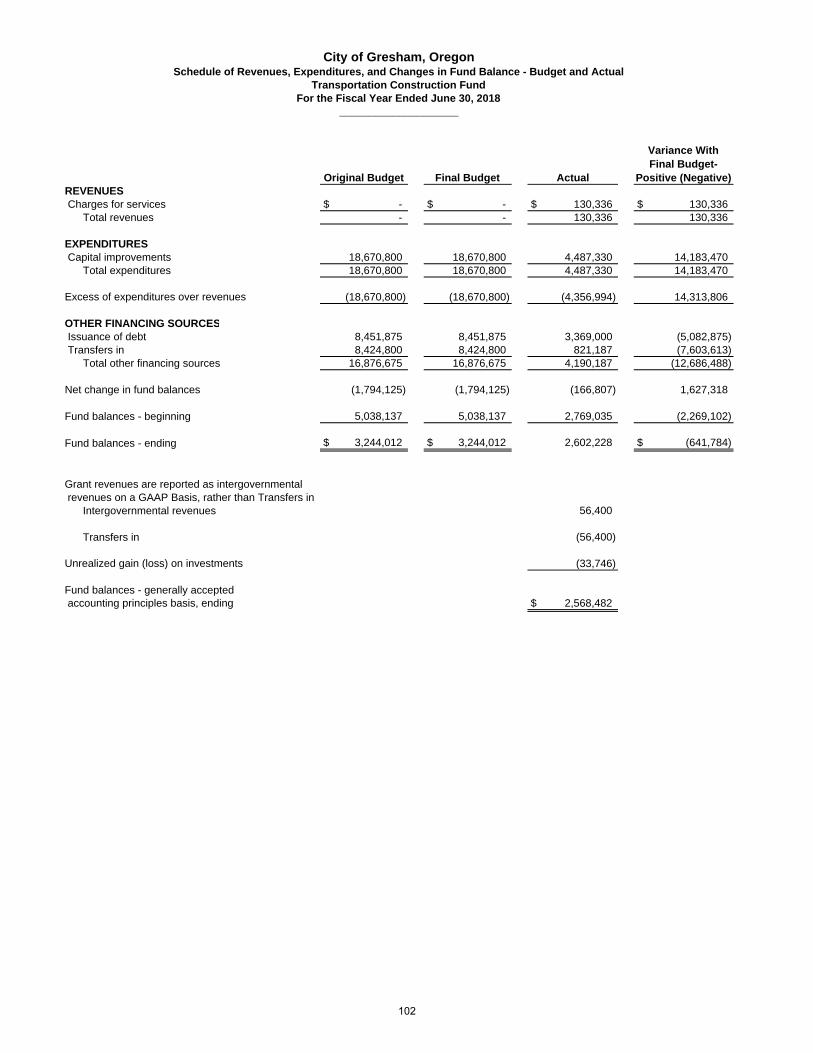
REVENUES Charges for services $ - $ - $ 130,336 $ 130,336
Total revenues - - 130,336 130,336
EXPENDITURES Capital improvements 18,670,800 18,670,800 4,487,330 14,183,470
Total expenditures 18,670,800 18,670,800 4,487,330 14,183,470
Excess of expenditures over revenues (18,670,800) (18,670,800) (4,356,994) 14,313,806
OTHER FINANCING SOURCES Issuance of debt 8,451,875 8,451,875 3,369,000 (5,082,875) Transfers in 8,424,800 8,424,800 821,187 (7,603,613)
Total other financing sources 16,876,675 16,876,675 4,190,187 (12,686,488)
Net change in fund balances (1,794,125) (1,794,125) (166,807) 1,627,318
Fund balances - beginning 5,038,137 5,038,137 2,769,035 (2,269,102)
Fund balances - ending $ 3,244,012 $ 3,244,012 2,602,228 $ (641,784)
Grant revenues are reported as intergovernmental revenues on a GAAP Basis, rather than Transfers in
Intergovernmental revenues 56,400
Transfers in (56,400)
Unrealized gain (loss) on investments (33,746)
Fund balances - generally accepted accounting principles basis, ending $ 2,568,482
Original Budget Final Budget Actual
Variance With Final Budget-
Positive (Negative)
City of Gresham, OregonSchedule of Revenues, Expenditures, and Changes in Fund Balance - Budget and Actual
Transportation Construction FundFor the Fiscal Year Ended June 30, 2018
____________________
102
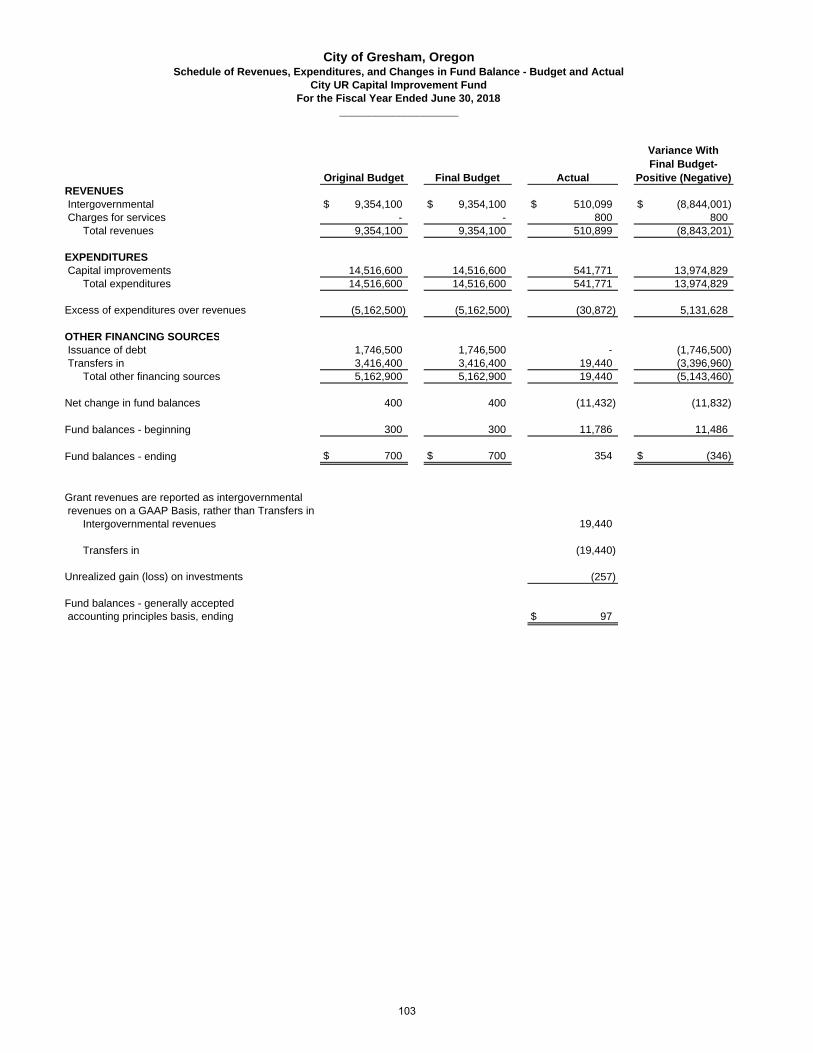
REVENUES Intergovernmental $ 9,354,100 $ 9,354,100 $ 510,099 $ (8,844,001) Charges for services - - 800 800
Total revenues 9,354,100 9,354,100 510,899 (8,843,201)
EXPENDITURES Capital improvements 14,516,600 14,516,600 541,771 13,974,829
Total expenditures 14,516,600 14,516,600 541,771 13,974,829
Excess of expenditures over revenues (5,162,500) (5,162,500) (30,872) 5,131,628
OTHER FINANCING SOURCES Issuance of debt 1,746,500 1,746,500 - (1,746,500) Transfers in 3,416,400 3,416,400 19,440 (3,396,960)
Total other financing sources 5,162,900 5,162,900 19,440 (5,143,460)
Net change in fund balances 400 400 (11,432) (11,832)
Fund balances - beginning 300 300 11,786 11,486
Fund balances - ending $ 700 $ 700 354 $ (346)
Grant revenues are reported as intergovernmental revenues on a GAAP Basis, rather than Transfers in
Intergovernmental revenues 19,440
Transfers in (19,440)
Unrealized gain (loss) on investments (257)
Fund balances - generally accepted accounting principles basis, ending $ 97
Original Budget Final Budget Actual
Variance With Final Budget-
Positive (Negative)
City of Gresham, OregonSchedule of Revenues, Expenditures, and Changes in Fund Balance - Budget and Actual
City UR Capital Improvement FundFor the Fiscal Year Ended June 30, 2018
____________________
103

REVENUES Charges for services $ 30,600 $ 30,600 $ 33,766 $ 3,166 Miscellaneous 17,300 17,300 47,551 30,251
Total revenues 47,900 47,900 81,317 33,417
EXPENDITURES Urban renewal 11,598,921 11,598,921 1,705,600 9,893,321 Operating contingency 500,000 500,000 - 500,000
Total expenditures 12,098,921 12,098,921 1,705,600 10,393,321
Excess of expenditures over revenues (12,051,021) (12,051,021) (1,624,283) 10,426,738
OTHER FINANCING SOURCES Loan proceeds 10,871,700 10,871,700 1,000,000 (9,871,700)
Total other financing sources 10,871,700 10,871,700 1,000,000 (9,871,700)
Net change in fund balances (1,179,321) (1,179,321) (624,283) 555,038
Fund balances - beginning 1,227,300 1,227,300 1,246,142 18,842
Fund balances - ending $ 47,979 $ 47,979 621,859 $ 573,880
Unrealized gain (loss) on investments (4,675)
Fund balances - generally accepted accounting principles basis, ending $ 617,184
Original Budget Final Budget Actual
Variance With Final Budget-
Positive (Negative)
City of Gresham, OregonSchedule of Revenues, Expenditures, and Changes in Fund Balance - Budget and Actual
Rockwood UR Capital Projects FundFor the Fiscal Year Ended June 30, 2018
____________________
104
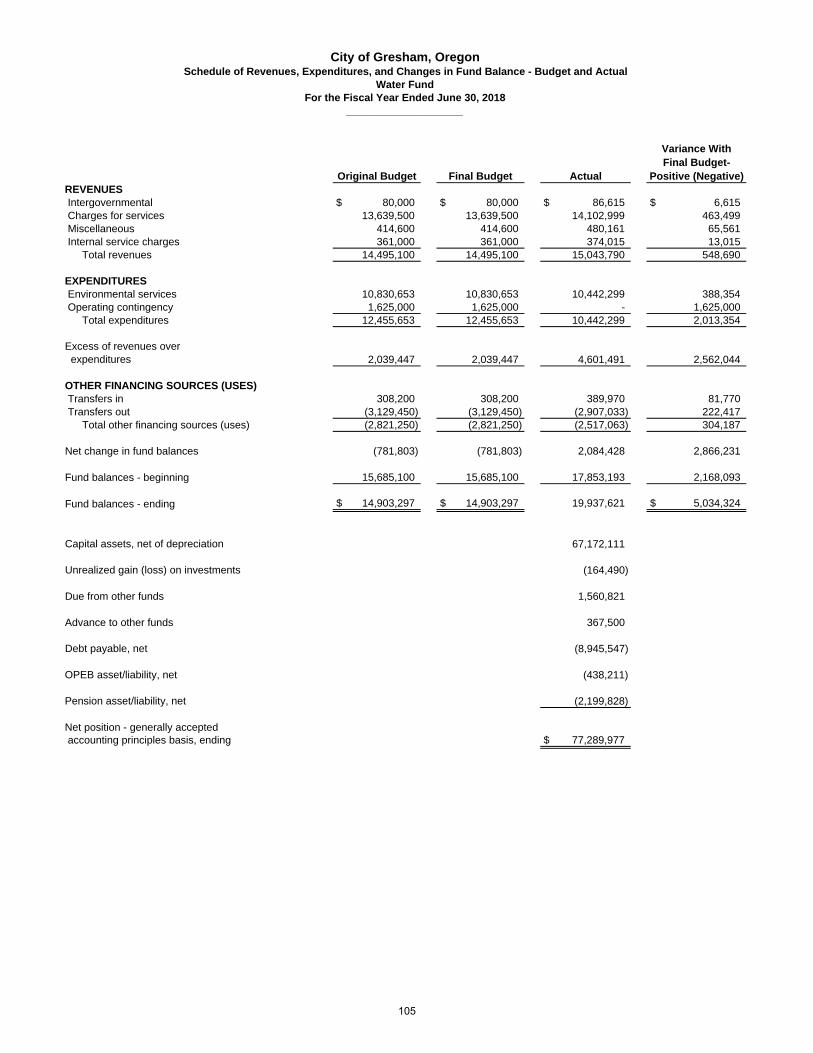
REVENUES Intergovernmental $ 80,000 $ 80,000 $ 86,615 $ 6,615 Charges for services 13,639,500 13,639,500 14,102,999 463,499 Miscellaneous 414,600 414,600 480,161 65,561 Internal service charges 361,000 361,000 374,015 13,015
Total revenues 14,495,100 14,495,100 15,043,790 548,690
EXPENDITURES Environmental services 10,830,653 10,830,653 10,442,299 388,354 Operating contingency 1,625,000 1,625,000 - 1,625,000
Total expenditures 12,455,653 12,455,653 10,442,299 2,013,354
Excess of revenues over expenditures 2,039,447 2,039,447 4,601,491 2,562,044
OTHER FINANCING SOURCES (USES) Transfers in 308,200 308,200 389,970 81,770 Transfers out (3,129,450) (3,129,450) (2,907,033) 222,417
Total other financing sources (uses) (2,821,250) (2,821,250) (2,517,063) 304,187
Net change in fund balances (781,803) (781,803) 2,084,428 2,866,231
Fund balances - beginning 15,685,100 15,685,100 17,853,193 2,168,093
Fund balances - ending $ 14,903,297 $ 14,903,297 19,937,621 $ 5,034,324
Capital assets, net of depreciation 67,172,111
Unrealized gain (loss) on investments (164,490)
Due from other funds 1,560,821
Advance to other funds 367,500
Debt payable, net (8,945,547)
OPEB asset/liability, net (438,211)
Pension asset/liability, net (2,199,828)
Net position - generally accepted accounting principles basis, ending $ 77,289,977
Original Budget Final Budget Actual
Variance With Final Budget-
Positive (Negative)
City of Gresham, OregonSchedule of Revenues, Expenditures, and Changes in Fund Balance - Budget and Actual
Water FundFor the Fiscal Year Ended June 30, 2018
____________________
105
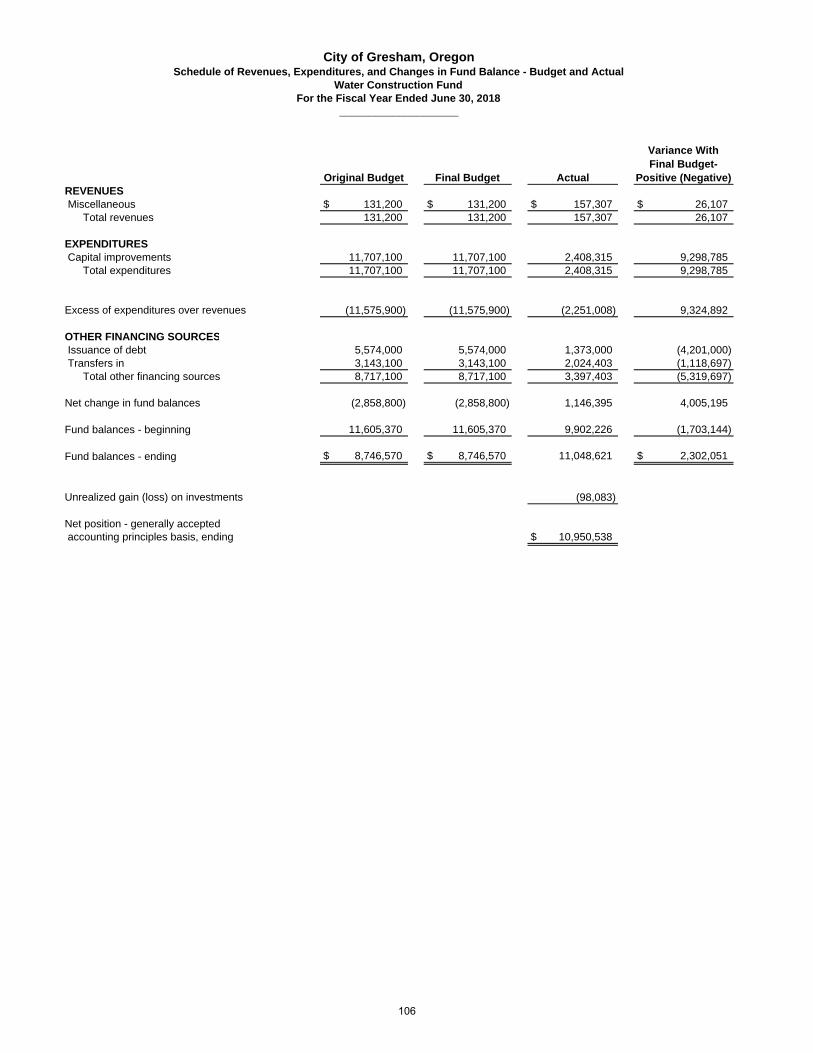
REVENUES Miscellaneous $ 131,200 $ 131,200 $ 157,307 $ 26,107
Total revenues 131,200 131,200 157,307 26,107
EXPENDITURES Capital improvements 11,707,100 11,707,100 2,408,315 9,298,785
Total expenditures 11,707,100 11,707,100 2,408,315 9,298,785
Excess of expenditures over revenues (11,575,900) (11,575,900) (2,251,008) 9,324,892
OTHER FINANCING SOURCES Issuance of debt 5,574,000 5,574,000 1,373,000 (4,201,000) Transfers in 3,143,100 3,143,100 2,024,403 (1,118,697)
Total other financing sources 8,717,100 8,717,100 3,397,403 (5,319,697)
Net change in fund balances (2,858,800) (2,858,800) 1,146,395 4,005,195
Fund balances - beginning 11,605,370 11,605,370 9,902,226 (1,703,144)
Fund balances - ending $ 8,746,570 $ 8,746,570 11,048,621 $ 2,302,051
Unrealized gain (loss) on investments (98,083)
Net position - generally accepted accounting principles basis, ending $ 10,950,538
Original Budget Final Budget Actual
Variance With Final Budget-
Positive (Negative)
City of Gresham, OregonSchedule of Revenues, Expenditures, and Changes in Fund Balance - Budget and Actual
Water Construction FundFor the Fiscal Year Ended June 30, 2018
____________________
106
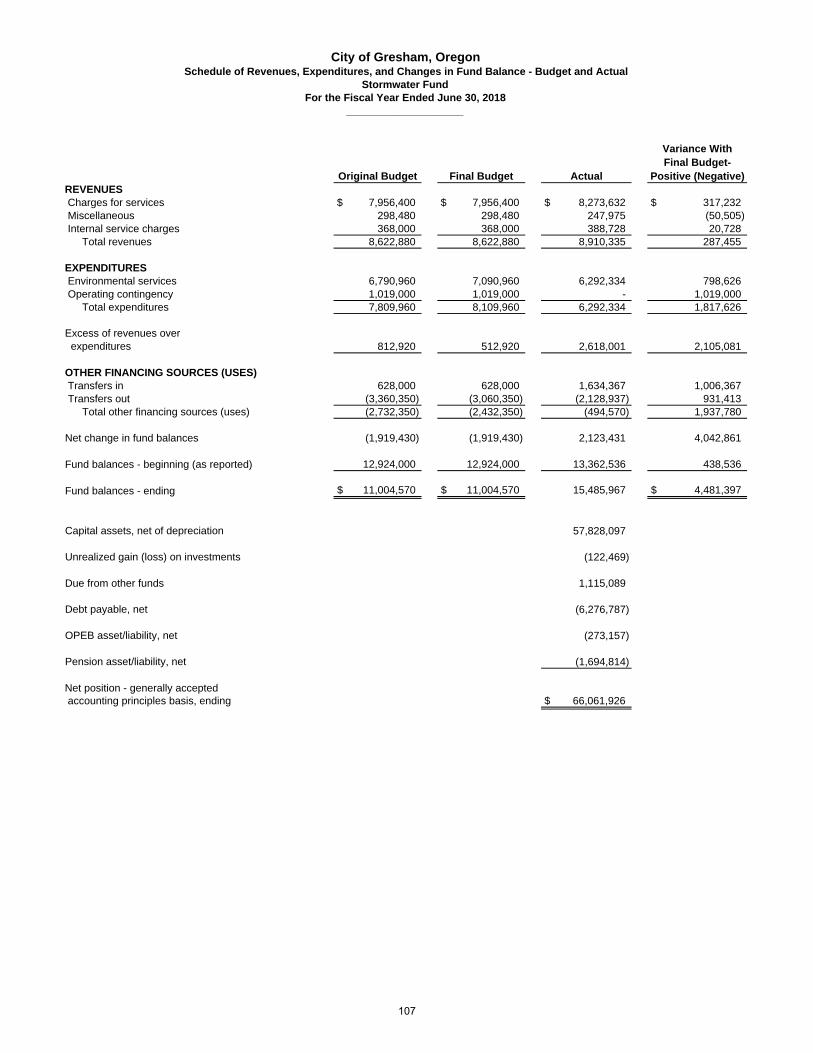
REVENUES Charges for services $ 7,956,400 $ 7,956,400 $ 8,273,632 $ 317,232 Miscellaneous 298,480 298,480 247,975 (50,505) Internal service charges 368,000 368,000 388,728 20,728
Total revenues 8,622,880 8,622,880 8,910,335 287,455
EXPENDITURES Environmental services 6,790,960 7,090,960 6,292,334 798,626 Operating contingency 1,019,000 1,019,000 - 1,019,000
Total expenditures 7,809,960 8,109,960 6,292,334 1,817,626
Excess of revenues over expenditures 812,920 512,920 2,618,001 2,105,081
OTHER FINANCING SOURCES (USES) Transfers in 628,000 628,000 1,634,367 1,006,367 Transfers out (3,360,350) (3,060,350) (2,128,937) 931,413
Total other financing sources (uses) (2,732,350) (2,432,350) (494,570) 1,937,780
Net change in fund balances (1,919,430) (1,919,430) 2,123,431 4,042,861
Fund balances - beginning (as reported) 12,924,000 12,924,000 13,362,536 438,536
Fund balances - ending $ 11,004,570 $ 11,004,570 15,485,967 $ 4,481,397
Capital assets, net of depreciation 57,828,097
Unrealized gain (loss) on investments (122,469)
Due from other funds 1,115,089
Debt payable, net (6,276,787)
OPEB asset/liability, net (273,157)
Pension asset/liability, net (1,694,814)
Net position - generally accepted accounting principles basis, ending $ 66,061,926
Original Budget Final Budget Actual
Variance With Final Budget-
Positive (Negative)
City of Gresham, OregonSchedule of Revenues, Expenditures, and Changes in Fund Balance - Budget and Actual
Stormwater FundFor the Fiscal Year Ended June 30, 2018
____________________
107

REVENUES Miscellaneous $ 57,600 $ 57,600 $ 108,926 $ 51,326
Total revenues 57,600 57,600 108,926 51,326
EXPENDITURES Capital improvements 10,823,000 10,523,000 1,759,600 8,763,400
Total expenditures 10,823,000 10,523,000 1,759,600 8,763,400
Excess of expenditures over revenues (10,765,400) (10,465,400) (1,650,674) 8,814,726
OTHER FINANCING SOURCES Issuance of debt 2,591,100 2,591,100 - (2,591,100) Transfers in 5,263,100 4,963,100 1,677,141 (3,285,959)
Total other financing sources 7,854,200 7,554,200 1,677,141 (5,877,059)
Net change in fund balances (2,911,200) (2,911,200) 26,467 2,937,667
Fund balances - beginning 7,518,600 7,518,600 7,397,969 (120,631)
Fund balances - ending $ 4,607,400 $ 4,607,400 7,424,436 $ 2,817,036
Grant revenues are reported as intergovernmental revenues on a GAAP Basis, rather than Transfers in
Intergovernmental revenues 728,305
Transfers in (728,305)
Unrealized gain (loss) on investments (58,860)
Net position - generally accepted accounting principles basis, ending $ 7,365,576
Original Budget Final Budget Actual
Variance With Final Budget-
Positive (Negative)
City of Gresham, OregonSchedule of Revenues, Expenditures, and Changes in Fund Balance - Budget and Actual
Stormwater Construction FundFor the Fiscal Year Ended June 30, 2018
____________________
108
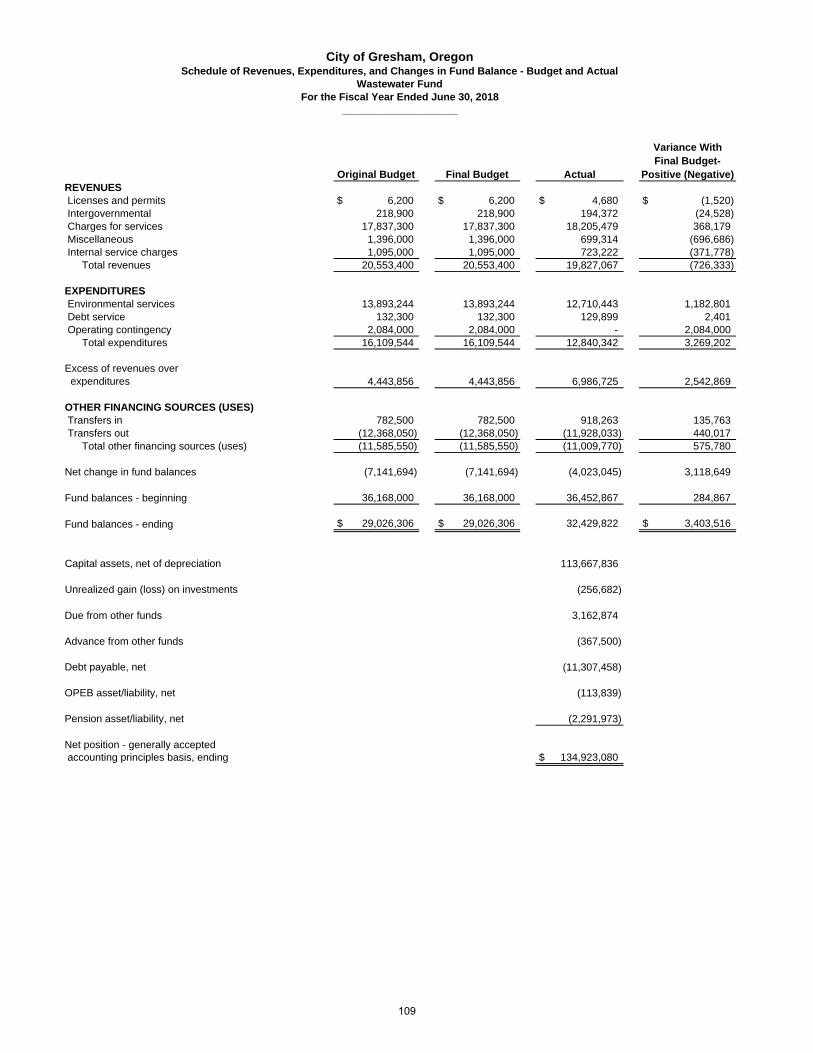
REVENUES Licenses and permits $ 6,200 $ 6,200 $ 4,680 $ (1,520) Intergovernmental 218,900 218,900 194,372 (24,528) Charges for services 17,837,300 17,837,300 18,205,479 368,179 Miscellaneous 1,396,000 1,396,000 699,314 (696,686) Internal service charges 1,095,000 1,095,000 723,222 (371,778)
Total revenues 20,553,400 20,553,400 19,827,067 (726,333)
EXPENDITURES Environmental services 13,893,244 13,893,244 12,710,443 1,182,801 Debt service 132,300 132,300 129,899 2,401 Operating contingency 2,084,000 2,084,000 - 2,084,000
Total expenditures 16,109,544 16,109,544 12,840,342 3,269,202
Excess of revenues over expenditures 4,443,856 4,443,856 6,986,725 2,542,869
OTHER FINANCING SOURCES (USES) Transfers in 782,500 782,500 918,263 135,763 Transfers out (12,368,050) (12,368,050) (11,928,033) 440,017
Total other financing sources (uses) (11,585,550) (11,585,550) (11,009,770) 575,780
Net change in fund balances (7,141,694) (7,141,694) (4,023,045) 3,118,649
Fund balances - beginning 36,168,000 36,168,000 36,452,867 284,867
Fund balances - ending $ 29,026,306 $ 29,026,306 32,429,822 $ 3,403,516
Capital assets, net of depreciation 113,667,836
Unrealized gain (loss) on investments (256,682)
Due from other funds 3,162,874
Advance from other funds (367,500)
Debt payable, net (11,307,458)
OPEB asset/liability, net (113,839)
Pension asset/liability, net (2,291,973)
Net position - generally accepted accounting principles basis, ending $ 134,923,080
Original Budget Final Budget Actual
Variance With Final Budget-
Positive (Negative)
City of Gresham, OregonSchedule of Revenues, Expenditures, and Changes in Fund Balance - Budget and Actual
Wastewater FundFor the Fiscal Year Ended June 30, 2018
____________________
109
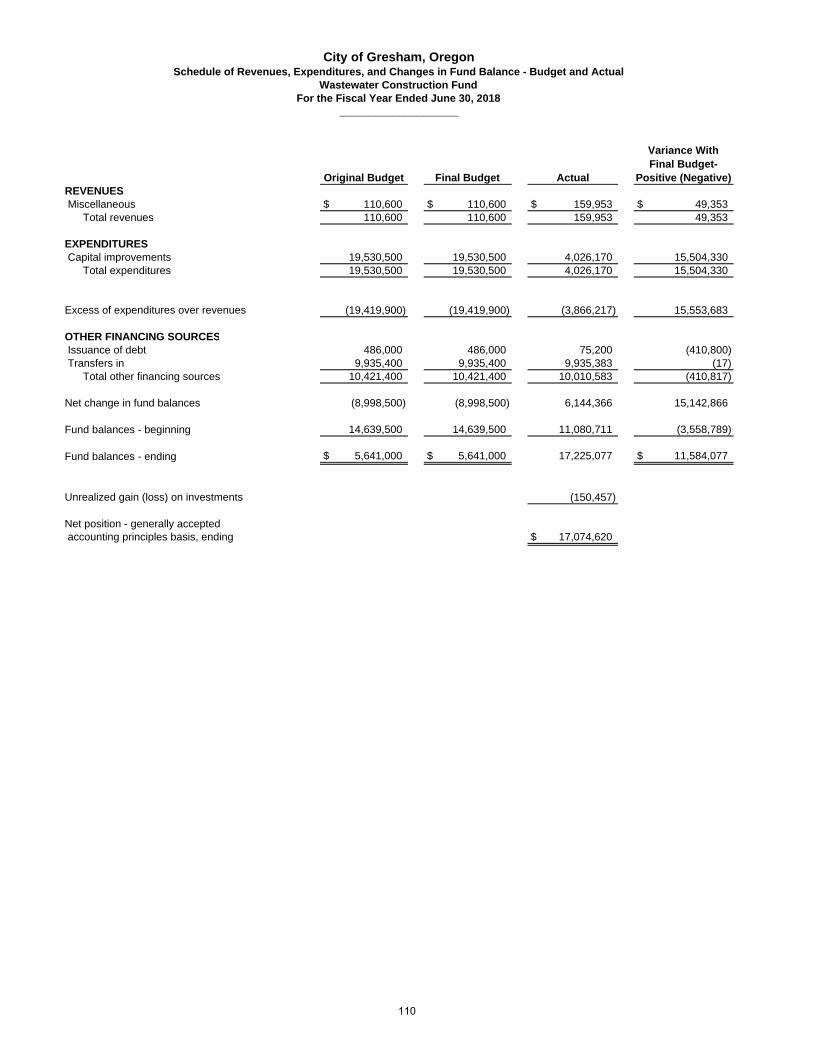
REVENUES Miscellaneous $ 110,600 $ 110,600 $ 159,953 $ 49,353
Total revenues 110,600 110,600 159,953 49,353
EXPENDITURES Capital improvements 19,530,500 19,530,500 4,026,170 15,504,330
Total expenditures 19,530,500 19,530,500 4,026,170 15,504,330
Excess of expenditures over revenues (19,419,900) (19,419,900) (3,866,217) 15,553,683
OTHER FINANCING SOURCES Issuance of debt 486,000 486,000 75,200 (410,800) Transfers in 9,935,400 9,935,400 9,935,383 (17)
Total other financing sources 10,421,400 10,421,400 10,010,583 (410,817)
Net change in fund balances (8,998,500) (8,998,500) 6,144,366 15,142,866
Fund balances - beginning 14,639,500 14,639,500 11,080,711 (3,558,789)
Fund balances - ending $ 5,641,000 $ 5,641,000 17,225,077 $ 11,584,077
Unrealized gain (loss) on investments (150,457)
Net position - generally accepted accounting principles basis, ending $ 17,074,620
Original Budget Final Budget Actual
Variance With Final Budget-
Positive (Negative)
City of Gresham, OregonSchedule of Revenues, Expenditures, and Changes in Fund Balance - Budget and Actual
Wastewater Construction FundFor the Fiscal Year Ended June 30, 2018
____________________
110
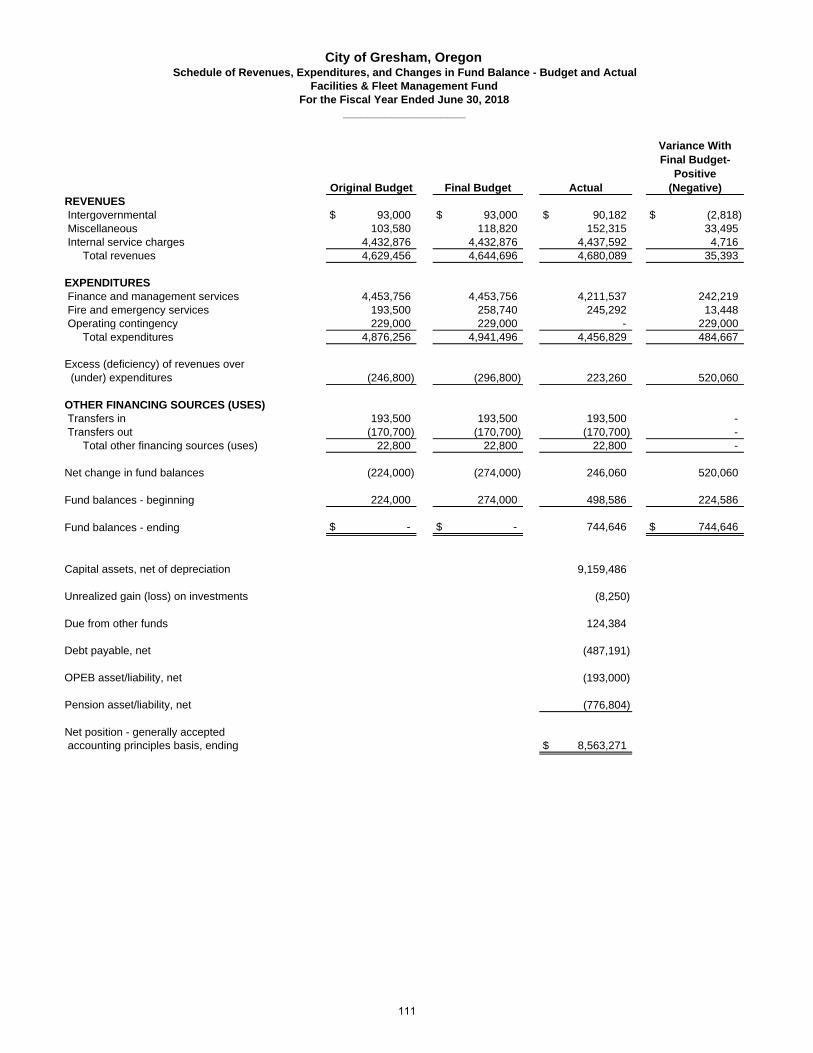
REVENUES Intergovernmental $ 93,000 $ 93,000 $ 90,182 $ (2,818) Miscellaneous 103,580 118,820 152,315 33,495 Internal service charges 4,432,876 4,432,876 4,437,592 4,716
Total revenues 4,629,456 4,644,696 4,680,089 35,393
EXPENDITURES Finance and management services 4,453,756 4,453,756 4,211,537 242,219 Fire and emergency services 193,500 258,740 245,292 13,448 Operating contingency 229,000 229,000 - 229,000
Total expenditures 4,876,256 4,941,496 4,456,829 484,667
Excess (deficiency) of revenues over (under) expenditures (246,800) (296,800) 223,260 520,060
OTHER FINANCING SOURCES (USES) Transfers in 193,500 193,500 193,500 - Transfers out (170,700) (170,700) (170,700) -
Total other financing sources (uses) 22,800 22,800 22,800 -
Net change in fund balances (224,000) (274,000) 246,060 520,060
Fund balances - beginning 224,000 274,000 498,586 224,586
Fund balances - ending $ - $ - 744,646 $ 744,646
Capital assets, net of depreciation 9,159,486
Unrealized gain (loss) on investments (8,250)
Due from other funds 124,384
Debt payable, net (487,191)
OPEB asset/liability, net (193,000)
Pension asset/liability, net (776,804)
Net position - generally accepted accounting principles basis, ending $ 8,563,271
Original Budget Final Budget Actual
Variance With Final Budget-
Positive (Negative)
City of Gresham, OregonSchedule of Revenues, Expenditures, and Changes in Fund Balance - Budget and Actual
Facilities & Fleet Management FundFor the Fiscal Year Ended June 30, 2018
____________________
111

REVENUES Miscellaneous $ - $ - $ 23,400 $ 23,400
Total revenues - - 23,400 23,400
EXPENDITURES Capital improvements 1,396,000 1,396,000 472,865 923,135
Total expenditures 1,396,000 1,396,000 472,865 923,135
Excess of expenditures over revenues (1,396,000) (1,396,000) (449,465) 946,535
OTHER FINANCING SOURCES Transfers in 148,200 148,200 98,200 (50,000)
Total other financing sources 148,200 148,200 98,200 (50,000)
Net change in fund balances (1,247,800) (1,247,800) (351,265) 896,535
Fund balances - beginning 1,341,500 1,341,500 1,206,554 (134,946)
Fund balances - ending $ 93,700 $ 93,700 855,289 $ 761,589
Unrealized gain (loss) on investments (8,207)
Net position - generally accepted accounting principles basis, ending $ 847,082
Original Budget Final Budget Actual
Variance With Final Budget-
Positive (Negative)
City of Gresham, OregonSchedule of Revenues, Expenditures, and Changes in Fund Balance - Budget and Actual
City Facility Capital Improvement FundFor the Fiscal Year Ended June 30, 2018
____________________
112
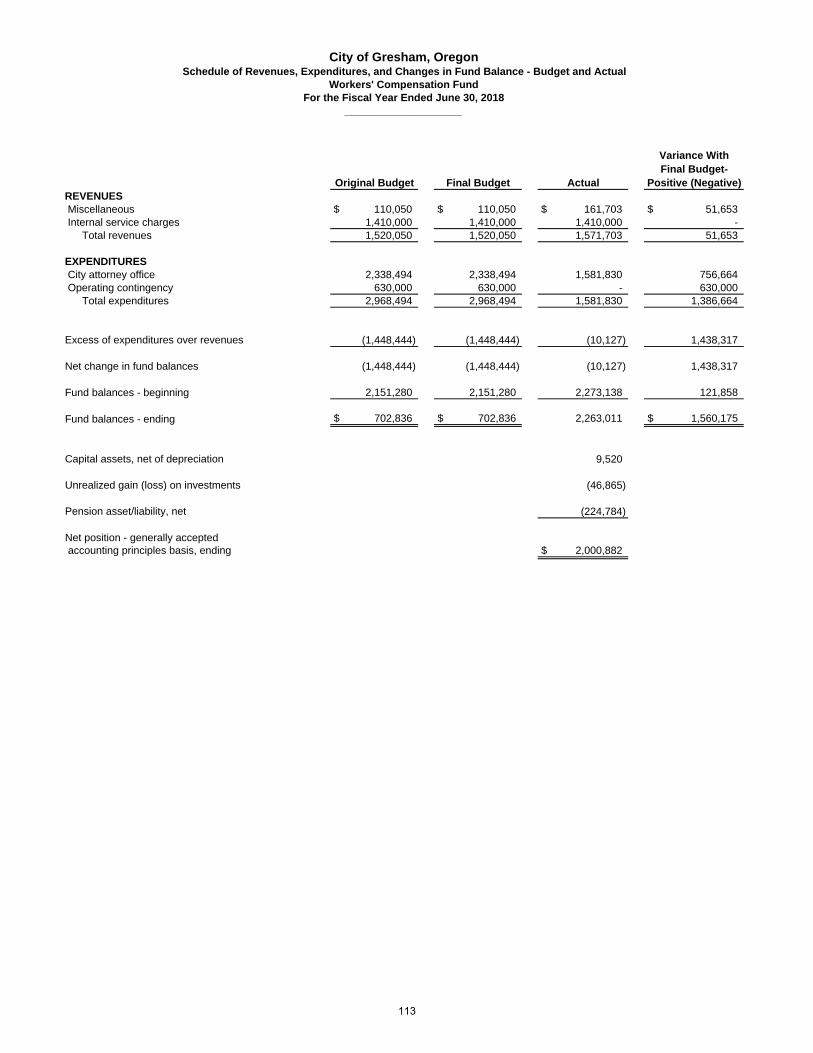
REVENUES Miscellaneous $ 110,050 $ 110,050 $ 161,703 $ 51,653 Internal service charges 1,410,000 1,410,000 1,410,000 -
Total revenues 1,520,050 1,520,050 1,571,703 51,653
EXPENDITURES City attorney office 2,338,494 2,338,494 1,581,830 756,664 Operating contingency 630,000 630,000 - 630,000
Total expenditures 2,968,494 2,968,494 1,581,830 1,386,664
Excess of expenditures over revenues (1,448,444) (1,448,444) (10,127) 1,438,317
Net change in fund balances (1,448,444) (1,448,444) (10,127) 1,438,317
Fund balances - beginning 2,151,280 2,151,280 2,273,138 121,858
Fund balances - ending $ 702,836 $ 702,836 2,263,011 $ 1,560,175
Capital assets, net of depreciation 9,520
Unrealized gain (loss) on investments (46,865)
Pension asset/liability, net (224,784)
Net position - generally accepted accounting principles basis, ending $ 2,000,882
Original Budget Final Budget Actual
Variance With Final Budget-
Positive (Negative)
City of Gresham, OregonSchedule of Revenues, Expenditures, and Changes in Fund Balance - Budget and Actual
Workers' Compensation FundFor the Fiscal Year Ended June 30, 2018
____________________
113
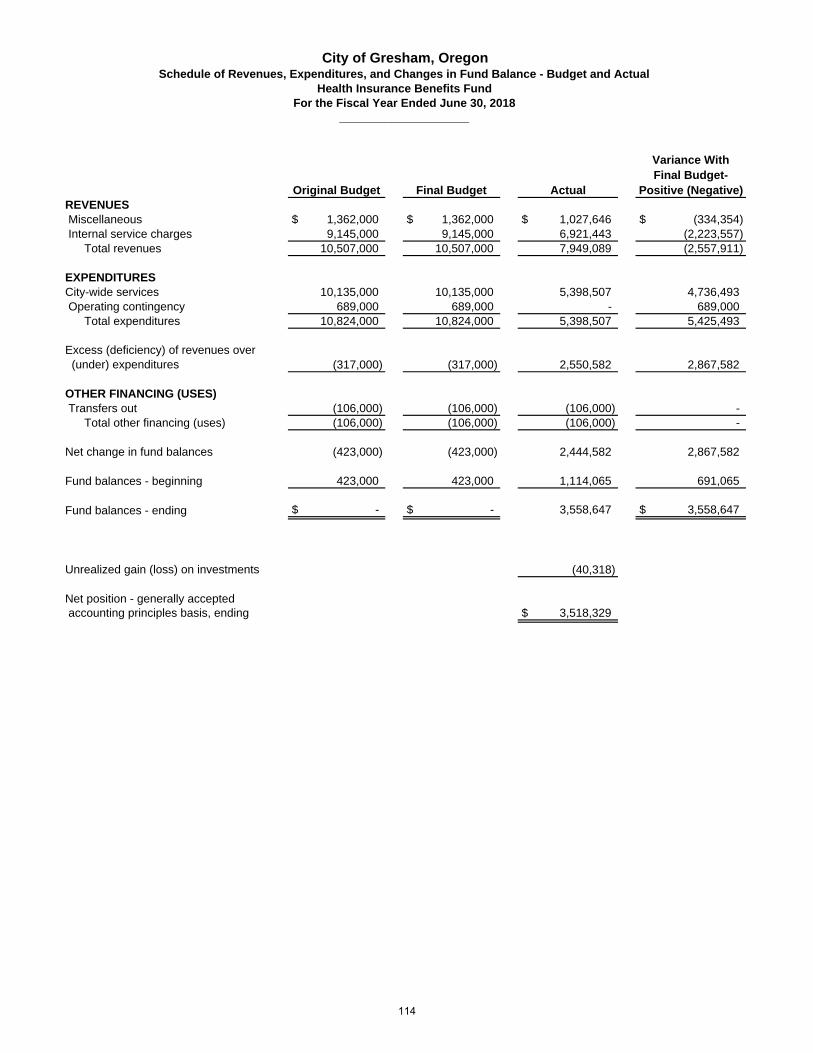
REVENUES Miscellaneous $ 1,362,000 $ 1,362,000 $ 1,027,646 $ (334,354) Internal service charges 9,145,000 9,145,000 6,921,443 (2,223,557)
Total revenues 10,507,000 10,507,000 7,949,089 (2,557,911)
EXPENDITURES City-wide services 10,135,000 10,135,000 5,398,507 4,736,493 Operating contingency 689,000 689,000 - 689,000
Total expenditures 10,824,000 10,824,000 5,398,507 5,425,493
Excess (deficiency) of revenues over (under) expenditures (317,000) (317,000) 2,550,582 2,867,582
OTHER FINANCING (USES) Transfers out (106,000) (106,000) (106,000) -
Total other financing (uses) (106,000) (106,000) (106,000) -
Net change in fund balances (423,000) (423,000) 2,444,582 2,867,582
Fund balances - beginning 423,000 423,000 1,114,065 691,065
Fund balances - ending $ - $ - 3,558,647 $ 3,558,647
Unrealized gain (loss) on investments (40,318)
Net position - generally accepted accounting principles basis, ending $ 3,518,329
Original Budget Final Budget Actual
Variance With Final Budget-
Positive (Negative)
City of Gresham, OregonSchedule of Revenues, Expenditures, and Changes in Fund Balance - Budget and Actual
Health Insurance Benefits FundFor the Fiscal Year Ended June 30, 2018
____________________
114
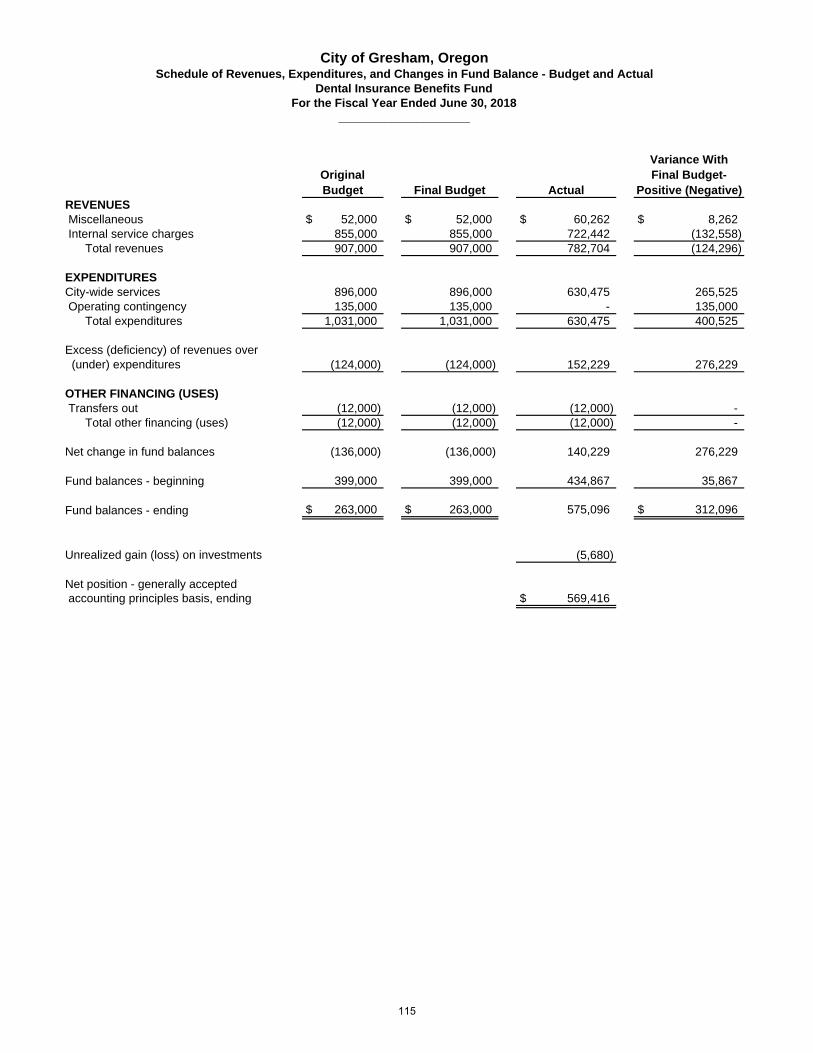
REVENUES Miscellaneous $ 52,000 $ 52,000 $ 60,262 $ 8,262 Internal service charges 855,000 855,000 722,442 (132,558)
Total revenues 907,000 907,000 782,704 (124,296)
EXPENDITURES City-wide services 896,000 896,000 630,475 265,525 Operating contingency 135,000 135,000 - 135,000
Total expenditures 1,031,000 1,031,000 630,475 400,525
Excess (deficiency) of revenues over (under) expenditures (124,000) (124,000) 152,229 276,229
OTHER FINANCING (USES) Transfers out (12,000) (12,000) (12,000) -
Total other financing (uses) (12,000) (12,000) (12,000) -
Net change in fund balances (136,000) (136,000) 140,229 276,229
Fund balances - beginning 399,000 399,000 434,867 35,867
Fund balances - ending $ 263,000 $ 263,000 575,096 $ 312,096
Unrealized gain (loss) on investments (5,680)
Net position - generally accepted accounting principles basis, ending $ 569,416
Original Budget Final Budget Actual
Variance With Final Budget-
Positive (Negative)
City of Gresham, OregonSchedule of Revenues, Expenditures, and Changes in Fund Balance - Budget and Actual
Dental Insurance Benefits FundFor the Fiscal Year Ended June 30, 2018
____________________
115
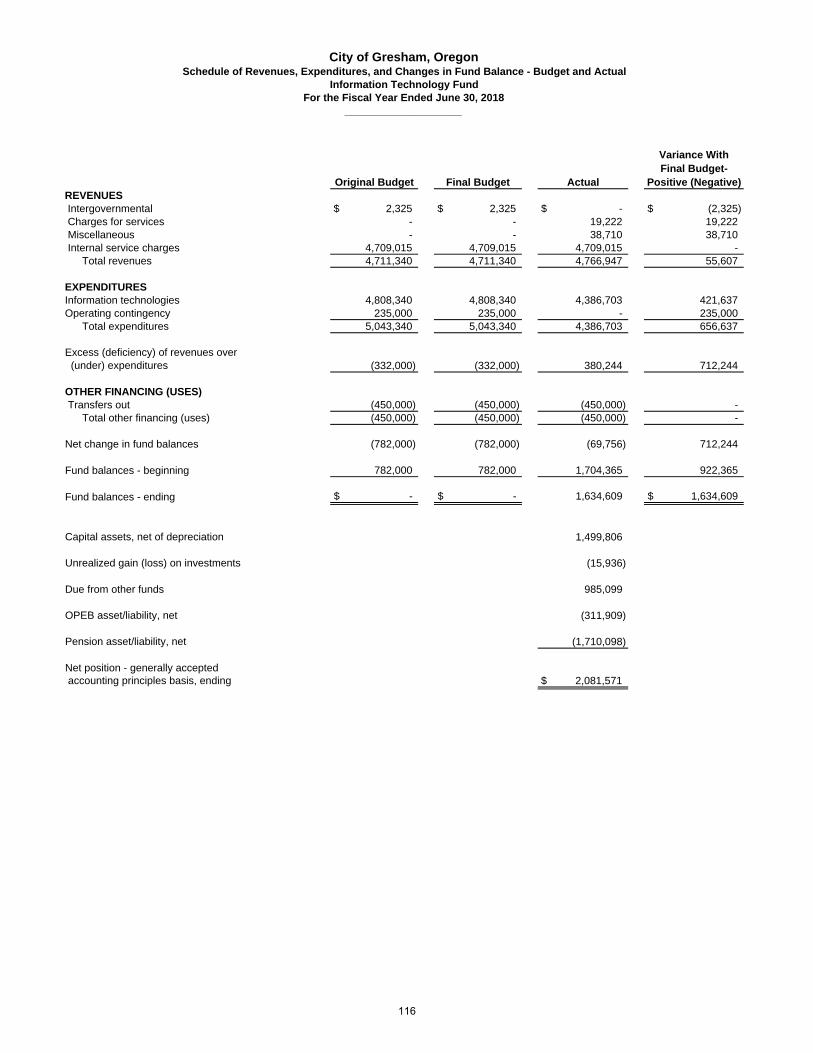
REVENUES Intergovernmental $ 2,325 $ 2,325 $ - $ (2,325) Charges for services - - 19,222 19,222 Miscellaneous - - 38,710 38,710 Internal service charges 4,709,015 4,709,015 4,709,015 -
Total revenues 4,711,340 4,711,340 4,766,947 55,607
EXPENDITURES Information technologies 4,808,340 4,808,340 4,386,703 421,637 Operating contingency 235,000 235,000 - 235,000
Total expenditures 5,043,340 5,043,340 4,386,703 656,637
Excess (deficiency) of revenues over (under) expenditures (332,000) (332,000) 380,244 712,244
OTHER FINANCING (USES) Transfers out (450,000) (450,000) (450,000) -
Total other financing (uses) (450,000) (450,000) (450,000) -
Net change in fund balances (782,000) (782,000) (69,756) 712,244
Fund balances - beginning 782,000 782,000 1,704,365 922,365
Fund balances - ending $ - $ - 1,634,609 $ 1,634,609
Capital assets, net of depreciation 1,499,806
Unrealized gain (loss) on investments (15,936)
Due from other funds 985,099
OPEB asset/liability, net (311,909)
Pension asset/liability, net (1,710,098)
Net position - generally accepted accounting principles basis, ending $ 2,081,571
Original Budget Final Budget Actual
Variance With Final Budget-
Positive (Negative)
City of Gresham, OregonSchedule of Revenues, Expenditures, and Changes in Fund Balance - Budget and Actual
Information Technology FundFor the Fiscal Year Ended June 30, 2018
____________________
116
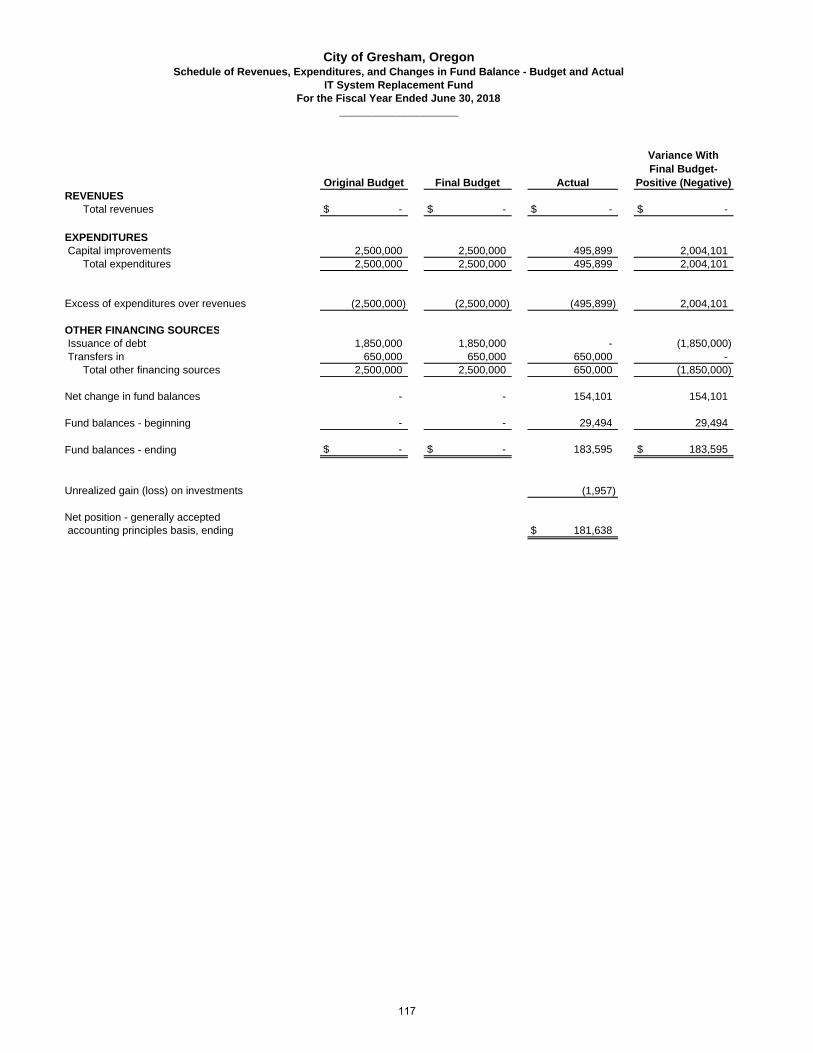
REVENUESTotal revenues $ - $ - $ - $ -
EXPENDITURES Capital improvements 2,500,000 2,500,000 495,899 2,004,101
Total expenditures 2,500,000 2,500,000 495,899 2,004,101
Excess of expenditures over revenues (2,500,000) (2,500,000) (495,899) 2,004,101
OTHER FINANCING SOURCES Issuance of debt 1,850,000 1,850,000 - (1,850,000) Transfers in 650,000 650,000 650,000 -
Total other financing sources 2,500,000 2,500,000 650,000 (1,850,000)
Net change in fund balances - - 154,101 154,101
Fund balances - beginning - - 29,494 29,494
Fund balances - ending $ - $ - 183,595 $ 183,595
Unrealized gain (loss) on investments (1,957)
Net position - generally accepted accounting principles basis, ending $ 181,638
Original Budget Final Budget Actual
Variance With Final Budget-
Positive (Negative)
City of Gresham, OregonSchedule of Revenues, Expenditures, and Changes in Fund Balance - Budget and Actual
IT System Replacement FundFor the Fiscal Year Ended June 30, 2018
____________________
117
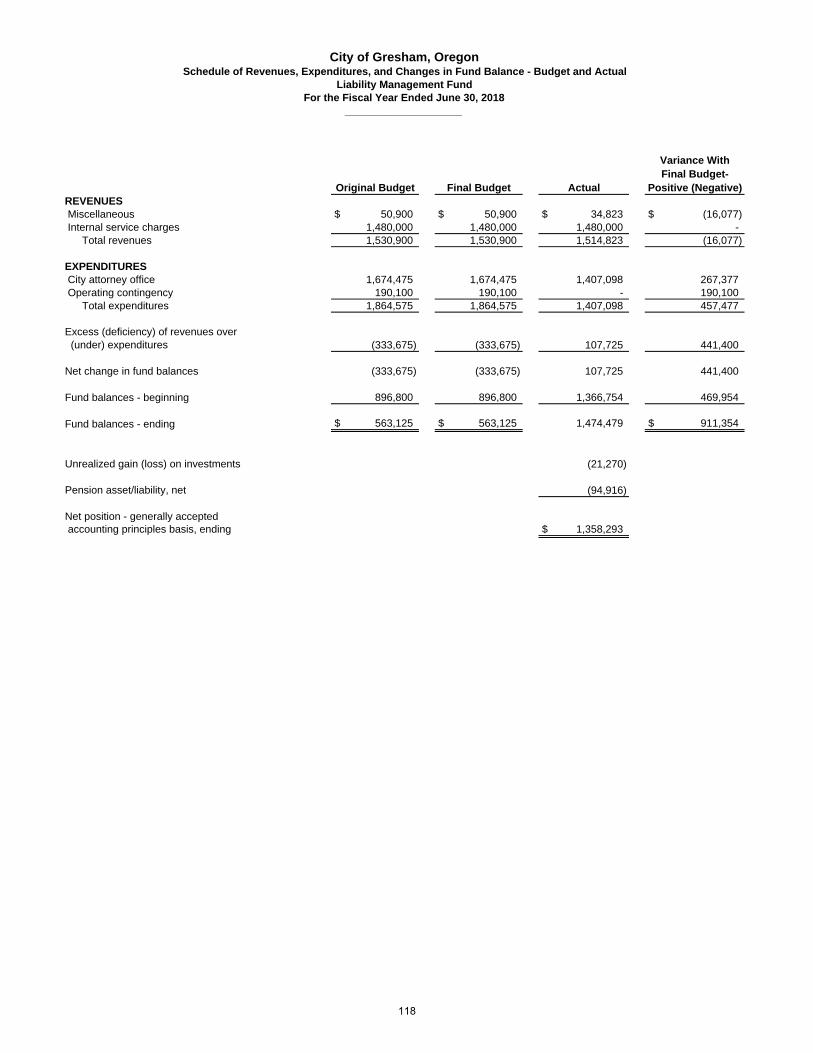
REVENUES Miscellaneous $ 50,900 $ 50,900 $ 34,823 $ (16,077) Internal service charges 1,480,000 1,480,000 1,480,000 -
Total revenues 1,530,900 1,530,900 1,514,823 (16,077)
EXPENDITURES City attorney office 1,674,475 1,674,475 1,407,098 267,377 Operating contingency 190,100 190,100 - 190,100
Total expenditures 1,864,575 1,864,575 1,407,098 457,477
Excess (deficiency) of revenues over (under) expenditures (333,675) (333,675) 107,725 441,400
Net change in fund balances (333,675) (333,675) 107,725 441,400
Fund balances - beginning 896,800 896,800 1,366,754 469,954
Fund balances - ending $ 563,125 $ 563,125 1,474,479 $ 911,354
Unrealized gain (loss) on investments (21,270)
Pension asset/liability, net (94,916)
Net position - generally accepted accounting principles basis, ending $ 1,358,293
Original Budget Final Budget Actual
Variance With Final Budget-
Positive (Negative)
City of Gresham, OregonSchedule of Revenues, Expenditures, and Changes in Fund Balance - Budget and Actual
Liability Management FundFor the Fiscal Year Ended June 30, 2018
____________________
118
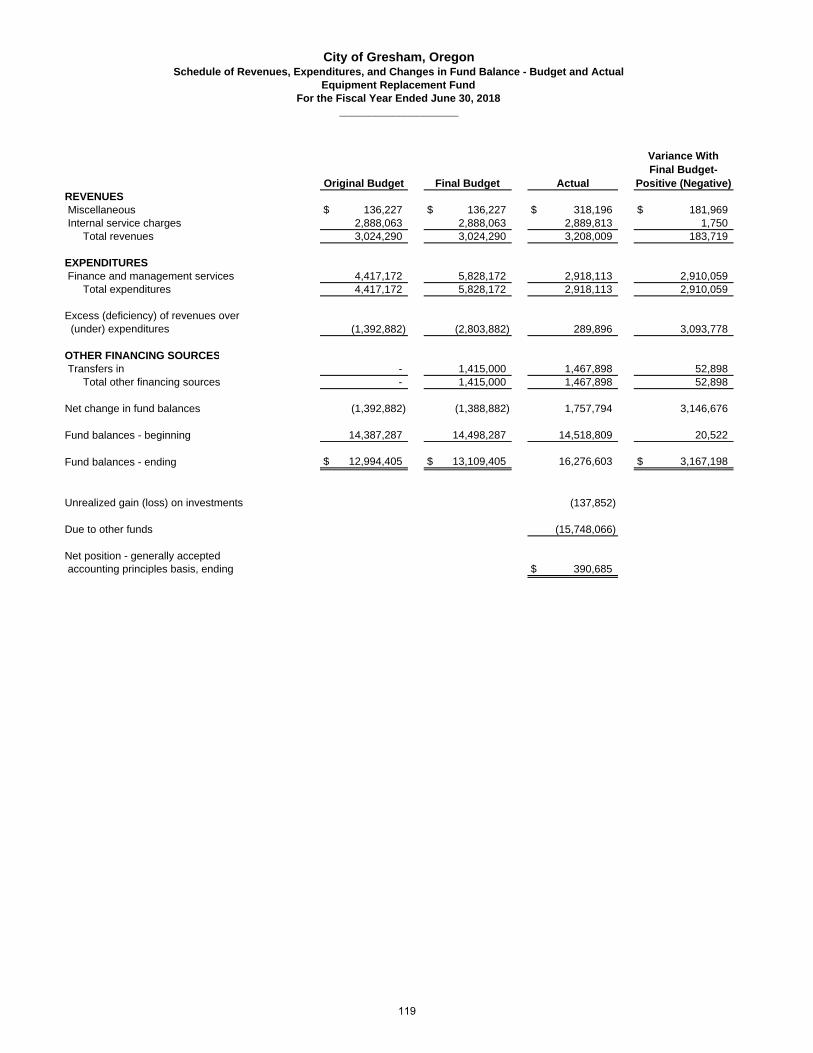
REVENUES Miscellaneous $ 136,227 $ 136,227 $ 318,196 $ 181,969 Internal service charges 2,888,063 2,888,063 2,889,813 1,750
Total revenues 3,024,290 3,024,290 3,208,009 183,719
EXPENDITURES Finance and management services 4,417,172 5,828,172 2,918,113 2,910,059
Total expenditures 4,417,172 5,828,172 2,918,113 2,910,059
Excess (deficiency) of revenues over (under) expenditures (1,392,882) (2,803,882) 289,896 3,093,778
OTHER FINANCING SOURCES Transfers in - 1,415,000 1,467,898 52,898
Total other financing sources - 1,415,000 1,467,898 52,898
Net change in fund balances (1,392,882) (1,388,882) 1,757,794 3,146,676
Fund balances - beginning 14,387,287 14,498,287 14,518,809 20,522
Fund balances - ending $ 12,994,405 $ 13,109,405 16,276,603 $ 3,167,198
Unrealized gain (loss) on investments (137,852)
Due to other funds (15,748,066)
Net position - generally accepted accounting principles basis, ending $ 390,685
Original Budget Final Budget Actual
Variance With Final Budget-
Positive (Negative)
City of Gresham, OregonSchedule of Revenues, Expenditures, and Changes in Fund Balance - Budget and Actual
Equipment Replacement FundFor the Fiscal Year Ended June 30, 2018
____________________
119
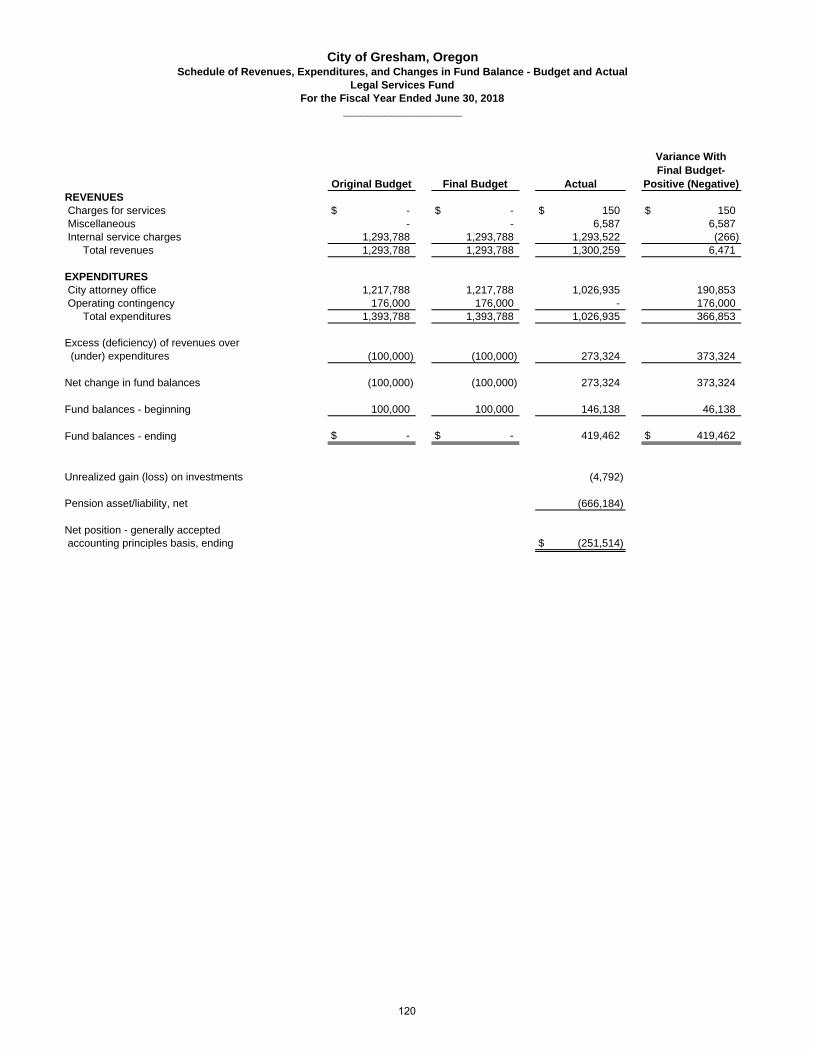
REVENUES Charges for services $ - $ - $ 150 $ 150 Miscellaneous - - 6,587 6,587 Internal service charges 1,293,788 1,293,788 1,293,522 (266)
Total revenues 1,293,788 1,293,788 1,300,259 6,471
EXPENDITURES City attorney office 1,217,788 1,217,788 1,026,935 190,853 Operating contingency 176,000 176,000 - 176,000
Total expenditures 1,393,788 1,393,788 1,026,935 366,853
Excess (deficiency) of revenues over (under) expenditures (100,000) (100,000) 273,324 373,324
Net change in fund balances (100,000) (100,000) 273,324 373,324
Fund balances - beginning 100,000 100,000 146,138 46,138
Fund balances - ending $ - $ - 419,462 $ 419,462
Unrealized gain (loss) on investments (4,792)
Pension asset/liability, net (666,184)
Net position - generally accepted accounting principles basis, ending $ (251,514)
Original Budget Final Budget Actual
Variance With Final Budget-
Positive (Negative)
City of Gresham, OregonSchedule of Revenues, Expenditures, and Changes in Fund Balance - Budget and Actual
Legal Services FundFor the Fiscal Year Ended June 30, 2018
____________________
120
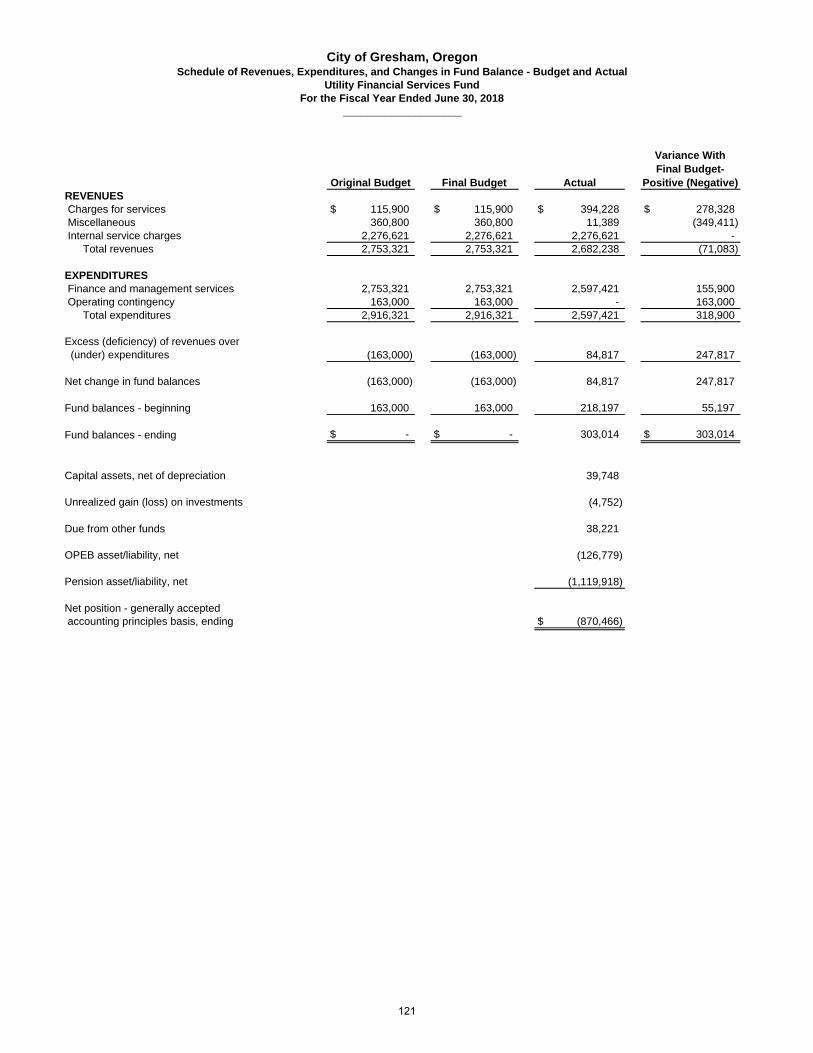
REVENUES Charges for services $ 115,900 $ 115,900 $ 394,228 $ 278,328 Miscellaneous 360,800 360,800 11,389 (349,411) Internal service charges 2,276,621 2,276,621 2,276,621 -
Total revenues 2,753,321 2,753,321 2,682,238 (71,083)
EXPENDITURES Finance and management services 2,753,321 2,753,321 2,597,421 155,900 Operating contingency 163,000 163,000 - 163,000
Total expenditures 2,916,321 2,916,321 2,597,421 318,900
Excess (deficiency) of revenues over (under) expenditures (163,000) (163,000) 84,817 247,817
Net change in fund balances (163,000) (163,000) 84,817 247,817
Fund balances - beginning 163,000 163,000 218,197 55,197
Fund balances - ending $ - $ - 303,014 $ 303,014
Capital assets, net of depreciation 39,748
Unrealized gain (loss) on investments (4,752)
Due from other funds 38,221
OPEB asset/liability, net (126,779)
Pension asset/liability, net (1,119,918)
Net position - generally accepted accounting principles basis, ending $ (870,466)
Original Budget Final Budget Actual
Variance With Final Budget-
Positive (Negative)
City of Gresham, OregonSchedule of Revenues, Expenditures, and Changes in Fund Balance - Budget and Actual
Utility Financial Services FundFor the Fiscal Year Ended June 30, 2018
____________________
121
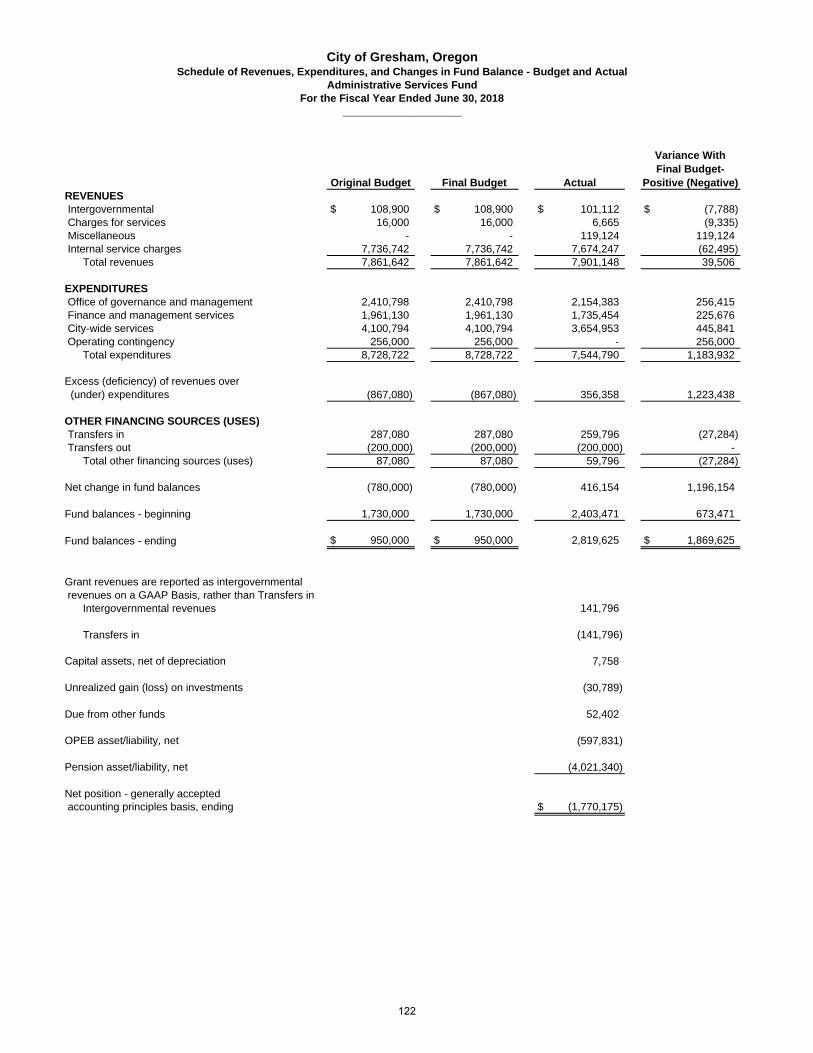
REVENUES Intergovernmental $ 108,900 $ 108,900 $ 101,112 $ (7,788) Charges for services 16,000 16,000 6,665 (9,335) Miscellaneous - - 119,124 119,124 Internal service charges 7,736,742 7,736,742 7,674,247 (62,495)
Total revenues 7,861,642 7,861,642 7,901,148 39,506
EXPENDITURES Office of governance and management 2,410,798 2,410,798 2,154,383 256,415 Finance and management services 1,961,130 1,961,130 1,735,454 225,676 City-wide services 4,100,794 4,100,794 3,654,953 445,841 Operating contingency 256,000 256,000 - 256,000
Total expenditures 8,728,722 8,728,722 7,544,790 1,183,932
Excess (deficiency) of revenues over (under) expenditures (867,080) (867,080) 356,358 1,223,438
OTHER FINANCING SOURCES (USES) Transfers in 287,080 287,080 259,796 (27,284) Transfers out (200,000) (200,000) (200,000) -
Total other financing sources (uses) 87,080 87,080 59,796 (27,284)
Net change in fund balances (780,000) (780,000) 416,154 1,196,154
Fund balances - beginning 1,730,000 1,730,000 2,403,471 673,471
Fund balances - ending $ 950,000 $ 950,000 2,819,625 $ 1,869,625
Grant revenues are reported as intergovernmental revenues on a GAAP Basis, rather than Transfers in
Intergovernmental revenues 141,796
Transfers in (141,796)
Capital assets, net of depreciation 7,758
Unrealized gain (loss) on investments (30,789)
Due from other funds 52,402
OPEB asset/liability, net (597,831)
Pension asset/liability, net (4,021,340)
Net position - generally accepted accounting principles basis, ending $ (1,770,175)
Original Budget Final Budget Actual
Variance With Final Budget-
Positive (Negative)
City of Gresham, OregonSchedule of Revenues, Expenditures, and Changes in Fund Balance - Budget and Actual
Administrative Services FundFor the Fiscal Year Ended June 30, 2018
____________________
122

APPENDIX C
Reconciliation of System Billing Rates to 2 CFR 200 Subpart E, “Cost Principles” Rates
Appendix C provides a reconciliation of the rates applied in the City’s financial costing system to the rates shown in the Indirect Cost Rate Proposal. As demonstrated by the reconciliation, all cost classifications, required adjustments and central service allocations are identical for both presentations. However, for simplicity in billing and internal cost smoothing over time, the City blends the rates of the Urban Design and Planning Services, Community Development and Economic Development Services Departments. For purposes of the Indirect Cost Rate Proposal, the City presents the rates in a format recommended in U.S. Department of Health and Human Services ASMB C-10 “Cost Principles and Procedures for Establishing Cost Allocation Plans and Indirect Cost Rates for Agreements with the Federal Government”. This format applies both indirect costs and central service allocations to total direct costs. The purpose of using this format is for ease of understanding to readers. The City’s financial costing system applies indirect costs to direct labor only (also allowed under 2 CFR 200 Subpart E, “Cost Principles”) and central service allocations to total direct costs. The purpose for this distinction is to use the cost drivers that most accurately allocate indirect costs to actual expenditures.
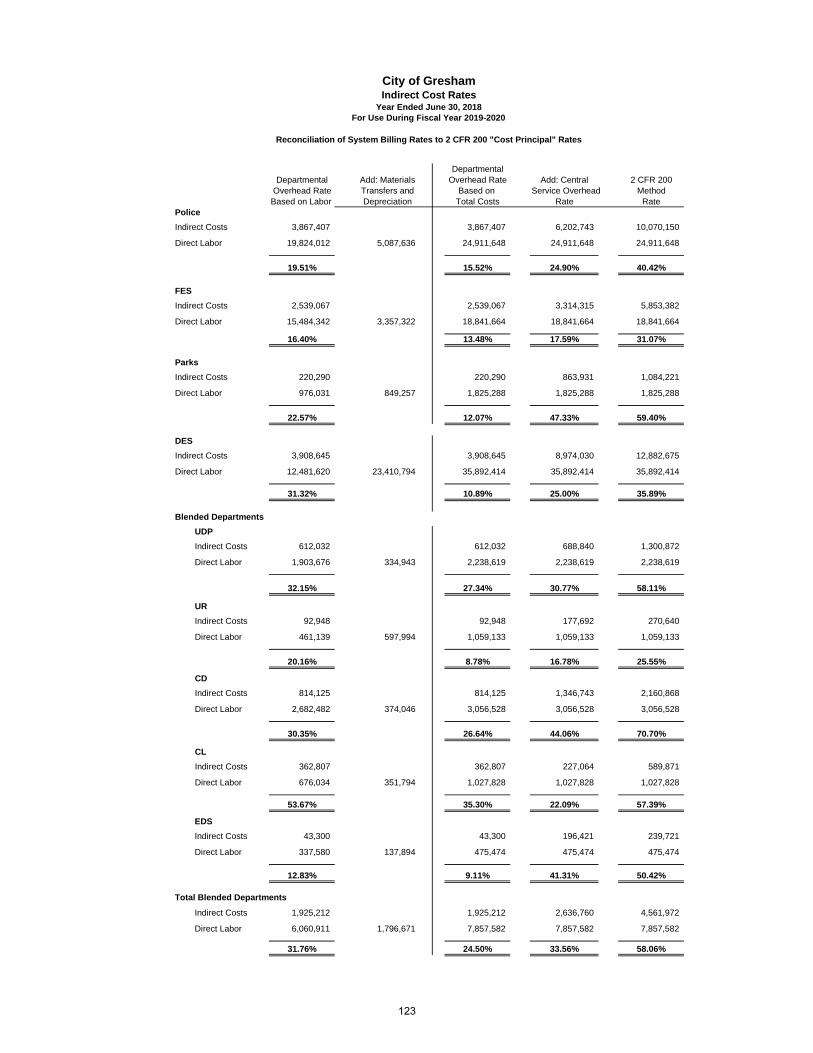
DepartmentalDepartmental Add: Materials Overhead Rate Add: Central 2 CFR 200
Overhead Rate Transfers and Based on Service Overhead MethodBased on Labor Depreciation Total Costs Rate Rate
Police Indirect Costs 3,867,407 3,867,407 6,202,743 10,070,150
Direct Labor 19,824,012 5,087,636 24,911,648 24,911,648 24,911,648
19.51% 15.52% 24.90% 40.42%
FES
Indirect Costs 2,539,067 2,539,067 3,314,315 5,853,382
Direct Labor 15,484,342 3,357,322 18,841,664 18,841,664 18,841,664
16.40% 13.48% 17.59% 31.07%
Parks
Indirect Costs 220,290 220,290 863,931 1,084,221
Direct Labor 976,031 849,257 1,825,288 1,825,288 1,825,288
22.57% 12.07% 47.33% 59.40%
DES
Indirect Costs 3,908,645 3,908,645 8,974,030 12,882,675
Direct Labor 12,481,620 23,410,794 35,892,414 35,892,414 35,892,414
31.32% 10.89% 25.00% 35.89%
Blended Departments
UDP
Indirect Costs 612,032 612,032 688,840 1,300,872
Direct Labor 1,903,676 334,943 2,238,619 2,238,619 2,238,619
32.15% 27.34% 30.77% 58.11%
UR
Indirect Costs 92,948 92,948 177,692 270,640
Direct Labor 461,139 597,994 1,059,133 1,059,133 1,059,133
20.16% 8.78% 16.78% 25.55%
CD
Indirect Costs 814,125 814,125 1,346,743 2,160,868
Direct Labor 2,682,482 374,046 3,056,528 3,056,528 3,056,528
30.35% 26.64% 44.06% 70.70%
CL
Indirect Costs 362,807 362,807 227,064 589,871
Direct Labor 676,034 351,794 1,027,828 1,027,828 1,027,828
53.67% 35.30% 22.09% 57.39%
EDS
Indirect Costs 43,300 43,300 196,421 239,721
Direct Labor 337,580 137,894 475,474 475,474 475,474
12.83% 9.11% 41.31% 50.42%
Total Blended Departments
Indirect Costs 1,925,212 1,925,212 2,636,760 4,561,972
Direct Labor 6,060,911 1,796,671 7,857,582 7,857,582 7,857,582
31.76% 24.50% 33.56% 58.06%
City of GreshamIndirect Cost Rates
Year Ended June 30, 2018
Reconciliation of System Billing Rates to 2 CFR 200 "Cost Principal" Rates
For Use During Fiscal Year 2019-2020
123
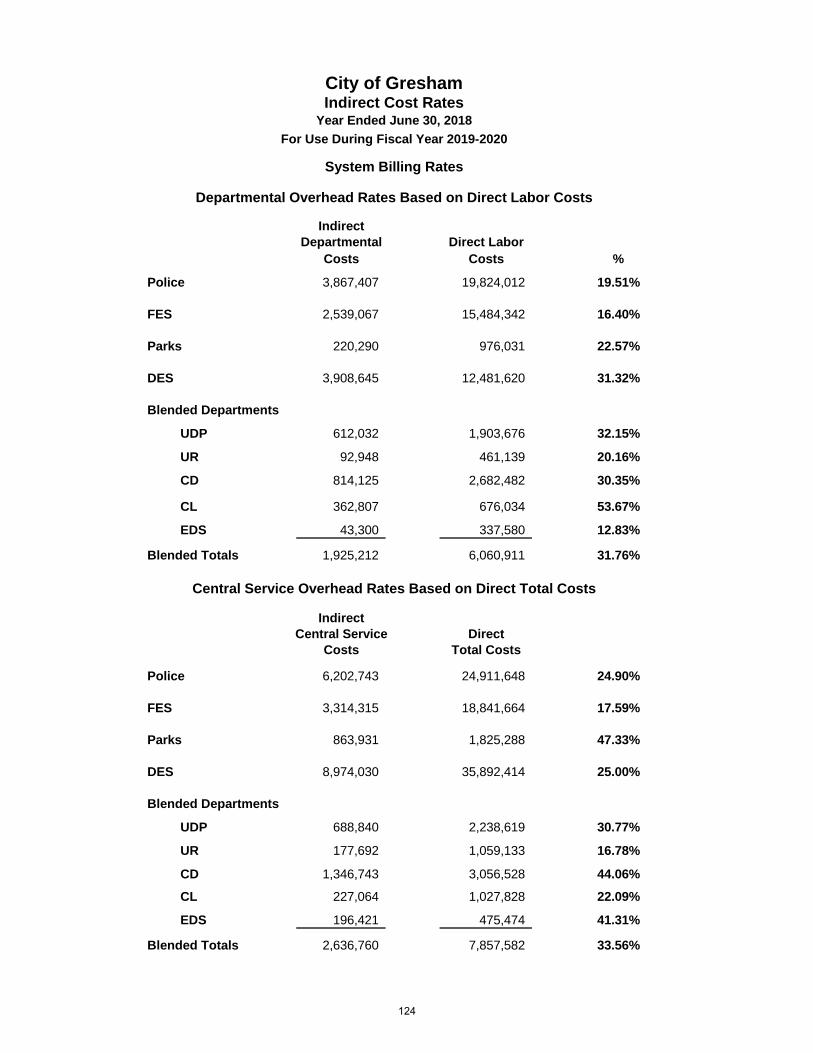
Indirect Departmental Direct Labor
Costs Costs %
Police 3,867,407 19,824,012 19.51%
FES 2,539,067 15,484,342 16.40%
Parks 220,290 976,031 22.57%
DES 3,908,645 12,481,620 31.32%
Blended Departments
UDP 612,032 1,903,676 32.15%
UR 92,948 461,139 20.16%
CD 814,125 2,682,482 30.35%
CL 362,807 676,034 53.67%
EDS 43,300 337,580 12.83%
Blended Totals 1,925,212 6,060,911 31.76%
IndirectCentral Service Direct
Costs Total Costs
Police 6,202,743 24,911,648 24.90%
FES 3,314,315 18,841,664 17.59%
Parks 863,931 1,825,288 47.33%
DES 8,974,030 35,892,414 25.00%
Blended Departments
UDP 688,840 2,238,619 30.77%
UR 177,692 1,059,133 16.78%
CD 1,346,743 3,056,528 44.06%
CL 227,064 1,027,828 22.09%
EDS 196,421 475,474 41.31%
Blended Totals 2,636,760 7,857,582 33.56%
System Billing Rates
Departmental Overhead Rates Based on Direct Labor Costs
Central Service Overhead Rates Based on Direct Total Costs
City of GreshamIndirect Cost Rates
Year Ended June 30, 2018
For Use During Fiscal Year 2019-2020
124